Correction to: Scientific Reports https://doi.org/10.1038/s41598-022-15851-x, published online 25 July 2022
The original version of this Article contained errors in Figure 3, where plot results did not display correctly.
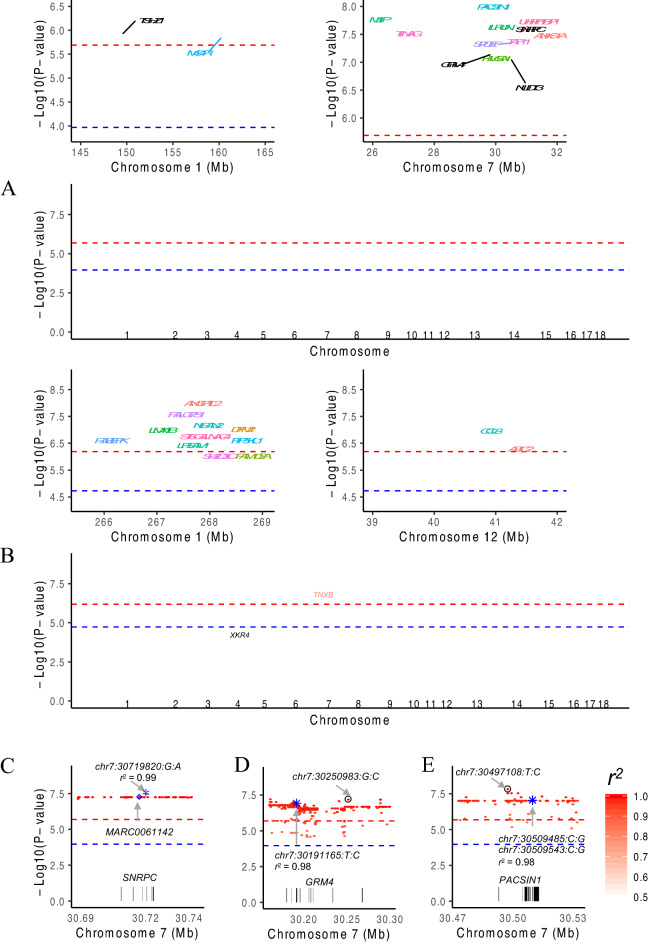
The original Figure 3 and accompanying legend appear below.
Figure 3.
Association signals for growth phenotypes before and after imputation. Association test statistics on the − log10 (P-value) scale (y-axis) are plotted for each SNP position (x-axis) for the trait of backfat thickness at an age of 180 days (A), from Zhang et al., and at 100 kg (B), from Fu et al. To simplify the plot, only the variants with a P-value less than 1.08 × 10⁻⁴ are shown, and they are colored according to the annotated genes. The black-labeled genes are reported in the original paper, and the blue-labeled genes are novel genes detected after imputation. Examples of potential causal variants (marked by blue asterisks) in the SNRPC (C), GRM4 (D) and PACSIN1 (E) genes. Each dot represents a variant, whose LD (r2) with the Chip SNP (marked by blue diamonds) or the one with the lowest P-value (marked by a black circle) is indicated by the colour of the dot. The two horizontal lines divide SNPs with P-values < 2.05 × 10⁻⁶ and < 1.08 × 10⁻⁴ (A), and P-values < 6.46 × 10⁻⁷ and < 1.86 × 10⁻⁵ (B).
The original Article has been corrected.
Contributor Information
Zhe Zhang, Email: zhe_zhang@zju.edu.cn.
Qishan Wang, Email: wangqishan@zju.edu.cn.
Yuchun Pan, Email: panyc@zju.edu.cn.


