Abstract
Background and Rationale
Hepatoblastoma (HB) is the most common pediatric liver cancer. Its predominant occurrence in very young children led us to investigating whether the neonatal liver provides a protumorigenic niche to HB development.
Methods
HB development was compared between orthotopic transplantation models established in postnatal day 5 and 60 mice (P5Tx and P60Tx models). Single-cell RNA-sequencing was performed using tumor and liver tissues from both models and the top candidate cell types and genes identified are investigated for their roles in HB cell growth, migration, and survival.
Results
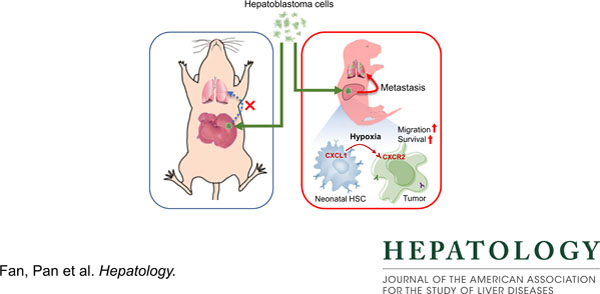
We found that various HB cell lines including HepG2 cells were consistently and considerably more tumorigenic and metastatic in the P5Tx model than in the P60Tx models. Sc-RNAseq of the P5Tx and P60Tx HepG2 models revealed that the P5Tx tumor was more hypoxic and had a larger number of activated hepatic stellate cells (aHSCs) in the tumor-surrounding liver which express significantly higher levels of Cxcl1 than those from the P60Tx model. We found these differences were developmentally present in normal P5 and P60 liver. We showed that the Cxcl1/Cxcr2 axis mediated HB cell migration and was critical to HB cell survival under hypoxia. Treating HepG2 P60Tx model with recombinant CXCL1 protein induced intrahepatic and pulmonary metastasis and CXCR2 knockout in HepG2 cells abolished their metastatic potential in the P5Tx model. Lastly, we showed that in metastatic HB patient tumors there was a similar larger population of aHSCs in the tumor-surrounding liver than in localized tumors, and tumor hypoxia was uniquely associated with HB patient prognosis among pediatric cancers.
Conclusion
We demonstrated that the neonatal liver provides a prometastatic niche to HB development via the Cxcl1/Cxcr2 axis.
Keywords: Hepatoblastoma, neonatal microenvironment, CXCL1/CXCR2, hypoxia
Graphical Abstract
INTRODUCTION
Hepatoblastoma (HB) is a rare hepatic tumor of early childhood with unclear etiology.1 Accounting for only 0.5–2% of all cancer cases in children, however, the incidence of HB is rising globally at a pace faster than any other pediatric cancers.2 Although HB patients have an excellent five-year survival rate above 80%, children with advanced forms of HB, including those that have metastasized or relapsed, do not respond well to standard treatments and their five-year survival is less than 40%.3 There is clearly an urgent need to understand the biology behind the deadly forms of HB.
HB has a unique, tight association with early development even among solid tumors that affect only children – HB occurs almost exclusively in young children under the age of three. Very-low-birth-weight (VLBW) infants have a 20–50-fold higher risk of developing HB than those born with normal weight, and HB with unfavorable prognosis typically develops in children who are extremely premature at birth.4, 5 Based on these observations, we hypothesize that the immature liver provides a developmentally protumorigenic niche to HB development. Patient-derived xenografts (PDXs) and cell line-derived xenografts have been established for HB in multiple laboratories.6, 7 However, these models used adult mice as the host, and the HB tumors developed in these models rarely progress into the advanced, metastatic stage. In this study, we established a novel HB orthotopic transplantation model using postnatal day 5 (P5) mice as the host and then compared to mice transplanted at P60 to dissect the potential cellular and molecular contributors to the differences we observed.
RESULTS
P5 mouse liver is more prometastatic to human and mouse HB cells than the P60 liver
To assess the impact of the early developing liver on HB progression, we developed an orthotopic liver transplantation procedure using P5 mouse pups as the host (P5Tx model) (Figure 1A). Due to their sensitivity to anesthetic, the small size of the liver, low post-surgery survival and dam rejection, we achieved an approximately 50% survival rate in this model. Liver transplantation was also performed in P60 mice in parallel (P60Tx model). Tumorigenicity of two HB cell lines was compared between P5Tx and P60Tx models: HepG2, a validated human HB cell line8, 9 and HBS1, a mouse HB cell line derived from a previously reported Notch-driven HB genetic mouse model.10, 11 NSG mice were used as the host strain for HepG2 and CD-1 NU/NU nude mice for HBS1. We found that HepG2, when orthotopically transplanted at 5×10⁴ cells/mouse, developed lung metastasis in 10 out of the 13 P5Tx mice while all the P60Tx mice (15/15) grew tumors only in the liver (median survival = 40 and 43 days, respectively, P value = 0.038) (Figure 1, B–D). To ensure that the tumor cell number/gram of body weight or tumors cell leakage into the blood circulation did not account for the extensive metastasis in the P5Tx model, we examined P5-transplanted pups two hours and two days post transplantation and found no tumor cell leaking into the long (Suppl Figure S1). We also performed orthotopic transplantation at 5×10⁵ cells/mouse or tail vein injection up to 3×10⁶ cells/mouse in P60 mice and found no lung metastasis in either conditions six weeks post injection (data not shown). For HBS1, we have previously reported that this mouse HB line was metastatic in an adult CD-1 NU/NU (nude) mouse orthotopic allograft model.11 In this study, we found that the P5Tx nude model consistently developed more lung metastases than the P60Tx model when orthotopically transplanted with 5×10⁴ HBS1 cells/mouse and examined six weeks post transplantation while tumors in the liver grew at a similar rate (Figure 1E, F). HBS1 cells had a genetically engineered ZsGreen (ZsG) reporter gene. We noticed an evident presence of ZsG+ tumor cells in both near- and far-tumor liver (defined as <500 μm and >5mm away from the tumor border, respectively) in the P5Tx mice but not in the P60Tx mice (Figure 1G), suggesting a more successfully tumor cell dissemination in the former. We also tested HB214, a human HB cell line derived from a previously reported subcutaneous HB PDX model.6 HB214 was not tumorigenic when injected into P5 NSG mice at 5×10⁴ cells/mouse. When injected into P21 and P60 liver at 1×10⁶ cells/mouse, HB214 developed tumors in 5/5 P21Tx mice with faithful HB histopathology while no tumors were found in P60Tx mice (Suppl Figure S2, A–C). Although no lung metastasis developed in HB214 P21Tx mice, this result supports the notion that the mouse liver at an earlier developmental stage is more protumorigenic than the adult liver. When comparing HepG2 and HB214 cells, we found HepG2 had higher activities of the WNT/β-catenin and KRAS pathways, which may account for its higher tumorigenic (Suppl Figure S2D).
Figure 1. The neonatal liver promotes HB development.
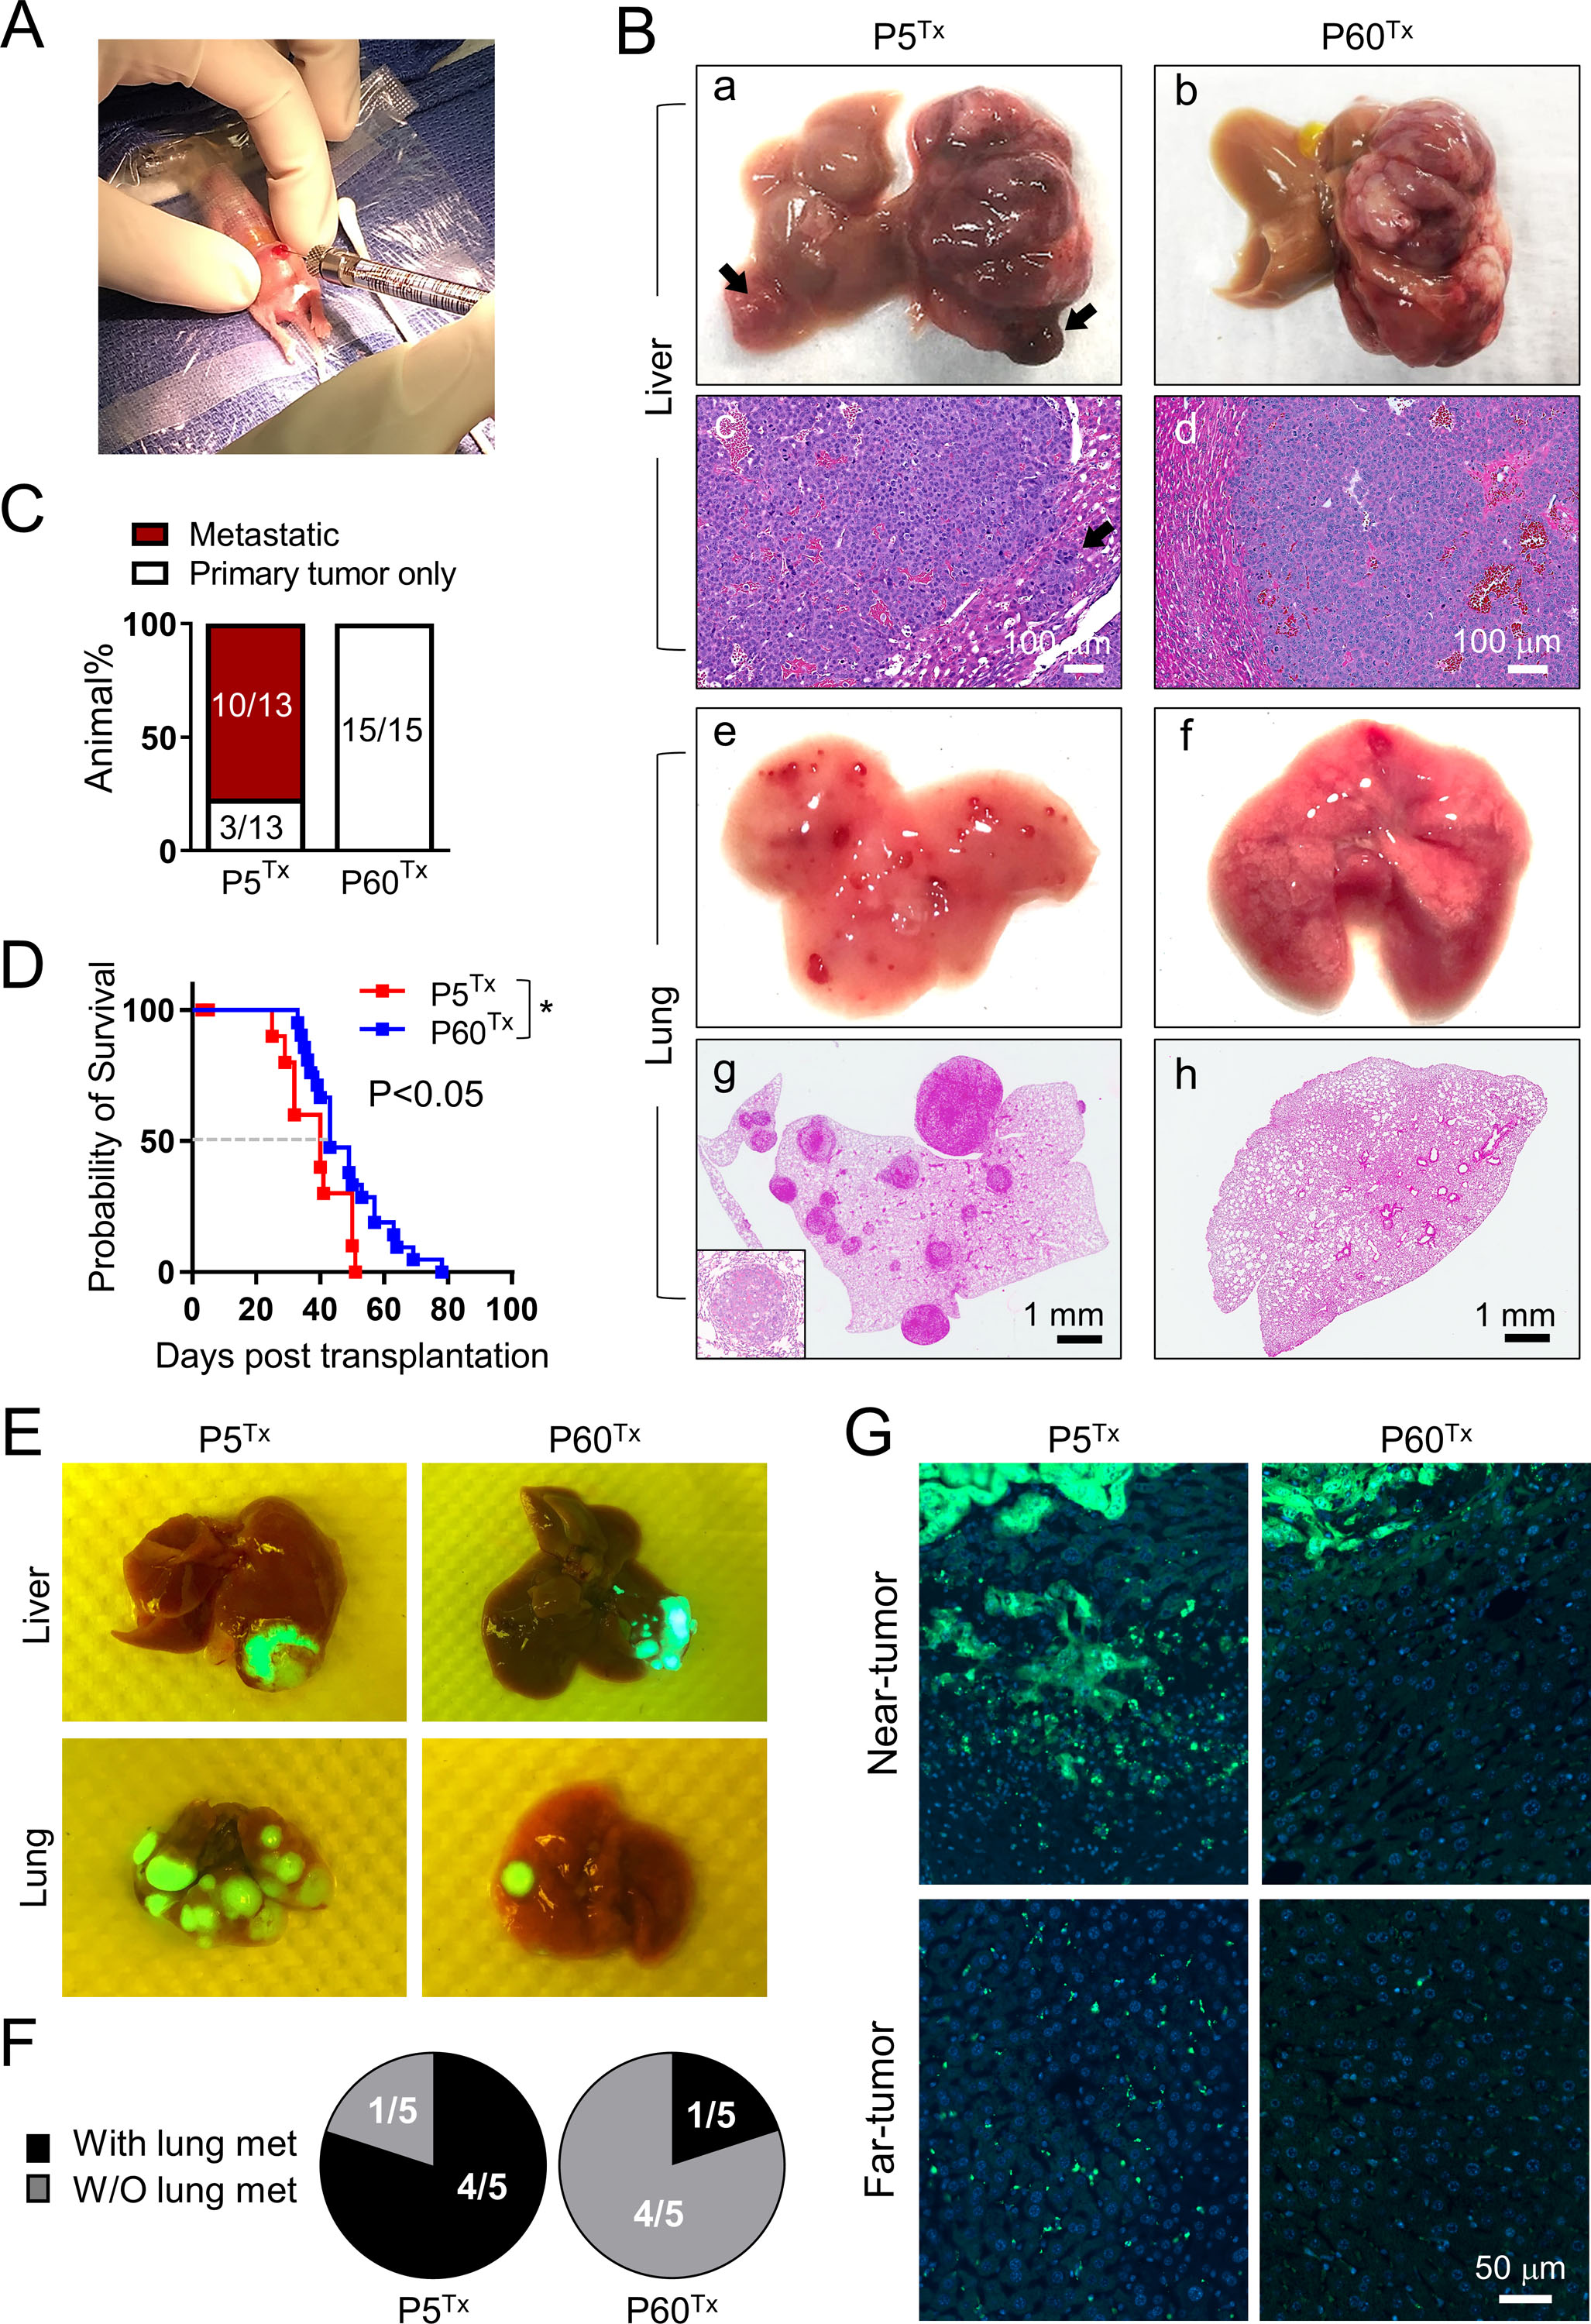
(A) Orthotopic liver transplantation using a P5 mouse pup.
(B) The gross (a, b, e, f) and H&E (c, d, g, h) images of the liver and lung collected from the HepG2 P5Tx and P60Tx model. Arrows in (a, c): intrahepatic metastases; inset in (g): a higher magnification image of a lung metastasis. Scale bars as indicated.
(C) Comparison of the lung metastasis rate between the HepG2 P5Tx and P60Tx model.
(D) Kaplan-Meier animal survival curves of the HepG2 P5Tx and P60Tx model.
(E) Merged gross/ZsG images of the liver and lung collected from the HBS1 P5Tx and P60Tx model. Liver tumors and lung metastases are ZsG+.
(F) Pie chart comparison of the lung metastasis rate between the HBS1 P5Tx and P60Tx model.
(G) ZsG fluorescence images of the near- and far-tumor liver in the HBS1 P5Tx and P60Tx model. All images share the same 50 μm scale bar.
Single-cell RNA-seq reveals key differences in the tumor-surrounding liver between the P5Tx and P60Tx HepG2 models
To determine what contributed to the different metastasis outcome in the P5Tx and P60Tx models, we performed single-cell RNA-seq (sc-RNAseq) analysis of the tumor masses as well as tumor-surrounding liver tissues, or peritumoral liver, collected from a P5Tx mouse and a P60Tx mouse six weeks post HepG2 transplantation (Figure 2A). A total of 8881 HepG2 cells were readily identified from the P5Tx and P60Tx mice because of their human origin, and partitioned into 9 clusters without distinct segregation (Suppl Figure S3A). However, we did find P5Tx HepG2 cells had a higher score of a previously reported patient HB C2 subtype that was associated with more invasion and metastasis compared to those from the P60Tx model which showed a higher C1 subtype score associated with less aggressive HB in patients (Suppl Figure S3B, C).12 Sequencing quality of the HepG2 cells was confirmed by the high numbers of total genes and unique molecular identifiers (UMIs) detected, and the low number of mitochondrial genes (Suppl Figure S3D). Different from the largely homogeneous tumor cells, 14675 cells detected from the peritumoral liver tissues formed 17 well-segregated clusters (Suppl Figure S3E). Seven hepatic linages were annotated based on the scores of known lineage-specific gene signatures across the 17 clusters (Figure 2B & 2C, Suppl Figure S3F, and Suppl Table S1).13–15 Expression of exemplar marker genes validated the lineage annotation by showing high cluster specificity for each lineage (Suppl Figure 3G). Sequencing quality of each hepatic lineage was similarly confirmed by the numbers of total genes, UMIs, and mitochondrial genes detected (Suppl Figure 3H).
Figure 2. A scRNA-seq transcriptomics comparison of the tumor and liver tissues from the HepG2 models reveals a significant difference between the P5Tx and P60Tx peritumoral aHSCs.
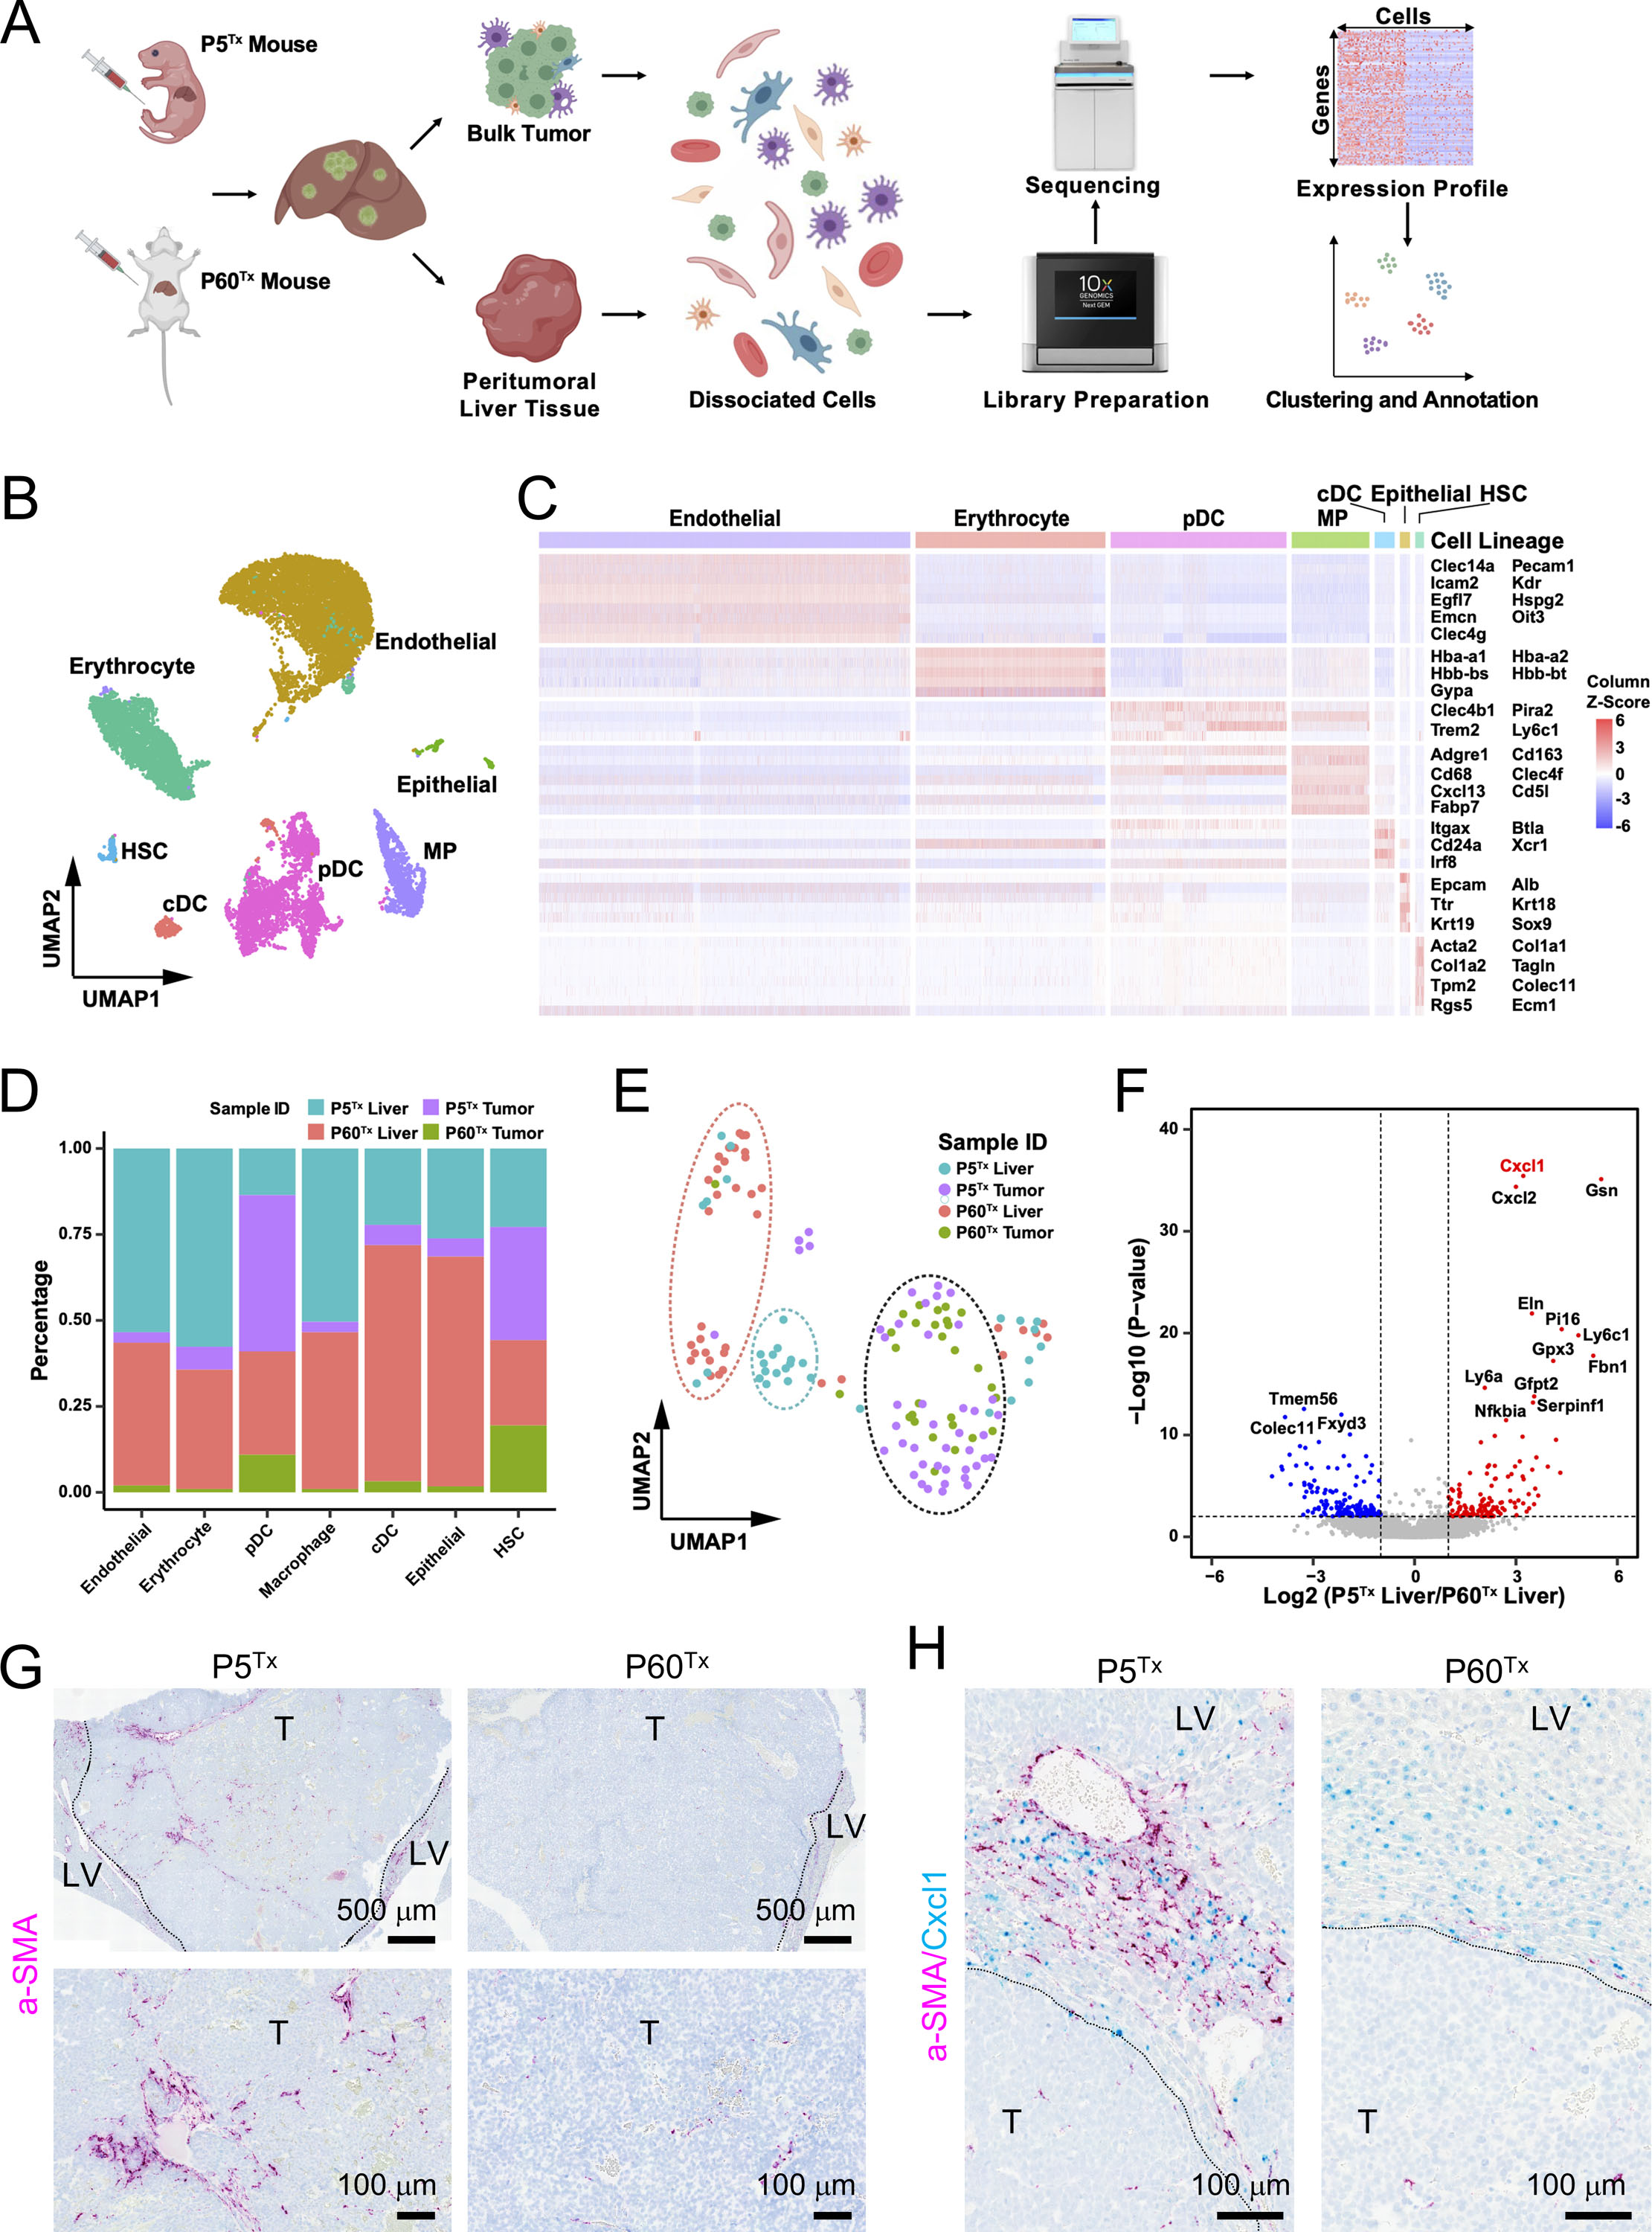
(A) The schematic illustrating the experimental design, single cell isolation, sequencing, and analysis.
(B) Cell type annotation by the expression of marker gene signatures. HSC, hepatic stellate cell; cDC, conventional dendritic cell; pDC, plasmacytoid dendritic cell; MP, macrophage.
(C) Heatmap showing the expression of marker gene signatures of each hepatic cell type. The columns denote cells, and the rows denote genes.
(D) Bar plot showing the proportion of cells from the indicated sample sources across seven hepatic cell types.
(E) UMAP illustration of the HSC clustering across the four indicated sample sources. The dashed ovals represent the main HSC clusters.
(F) Volcano plot of differential expression analysis of the peritumoral HSCs from the P5Tx and P60Tx samples. Red dots indicate genes up-regulated in the P5Tx liver HSCs and the blue dots indicate genes up-regulated in the P60Tx liver HSCs. P-value <0.01 coupled with a Fold Change >2 or <0.5 were used to define the significantly differentially expressed genes.
(G) RNAscope ISH of αSMA on the P5Tx and P60Tx tumors. Magenta: αSMA signal; blue: hematoxylin counterstain. Dashed line: tumor border. T: tumor; LV: liver. Scale bars as indicated.
(H) Dual RNAscope ISH of αSMA/Cxcl1 on the P5Tx and P60Tx tumors. Magenta: αSMA signal; cyan: Cxc11 signal, blue: hematoxylin counterstain. Scale bars as indicated.
Interestingly, hepatic stellate cells (HSCs), a well-known contributor to liver cancer metastasis,16, 17 showed a high level of tumor infiltration in both P5Tx and P60Tx models (Figure 2D). We found HSCs from the P5Tx- and P60Tx- peritumoral liver clustered separately while those found within the tumors were similar (Figure 2E). Among the top upregulated genes in the P5Tx peritumoral HSCs compared to those in the P5Tx model is a Cxcr2 ligands, Cxcl1 (Figure 2F). Cxcl1/Cxcr2 axis has been shown to contribute to the metastasis of many adult solid tumors,17–19 but its role in pediatric solid tumors remains elusive. Another Cxcr2 ligand, Cxcl2, also showed higher expression in P5Tx liver HSCs. To validate these findings, we performed dual αSMA/Cxcl1 RNAscope in-situ hybridization (ISH) on tumor sections. Cxcl1 is a small, secreted cytokine that is difficult to detect and localize via immunohistochemistry (IHC). Alpha-SMA is well recognized marker of activated HSCs (aHSCs).20 We confirmed that there was a larger number of αSMA+ aHSCs within the P5Tx tumor (Figure 2G) as well as a larger population of Cxcl1-expressing aHSCs in the peritumoral liver than the P60Tx model (Figure 2H). There were Cxcl1-expressing hepatocytes in both P5Tx and P60Tx models but Cxcl1-expressing aHSCs were predominantly found in the P5Tx model. The heterogeneity of aHSC distribution and Cxcl1 expression in- and outside the tumors made it challenging to perform quantitative comparisons between the two models. Nevertheless, our sc-RNAseq and histological analyses suggested that the aHSC population differed significantly between the P5Tx and P60Tx models.
Activation and Cxcl1 expression in HSCs differ significantly between the normal P5 and P60 liver
We suspected that the differences between aHSCs and their Cxcl1 expression we detected in the P5Tx and P60Tx liver were part of developmental differences between the normal P5 and P60 liver. Therefore, we performed IHC and immunoblotting using HSC markers αSMA, desmin and vimentin on wildtype P5 and P60 (P5WTand P60WT) NSG mouse liver. All three makers have been reported to increase during HSC activation.21 We found, indeed, there was a much larger population of αSMA+, desmin+ and vimentin+ cells as well as a higher expression of these proteins in the P5WT liver than the P60WT liver (Figure 3A, B). Cxcl1 RNAscope ISH also showed more intense staining in the P5WT liver than the P60WT liver (Figure 3C). Dual RNAscope ISH of αSMA/Cxcl1 showed that many Cxcl1-expressing cells in the P5WT liver, although not all, colocalized with the aSMA+ aHSCs (Figure 3D). To our knowledge, this is the first time that HSCs were shown to be markedly more active in the neonatal mouse liver than the adult, providing evidence that HB develops in a different TME than adult liver tumors. We further validated these differences between normal neonatal and adult HSCs using the scRNA-seq data generated by a recent study on mouse liver postnatal development (Suppl. Figure S4).22
Figure 3. The wildtype P5 mouse liver has a much larger population of aHSCs than the P60 liver.
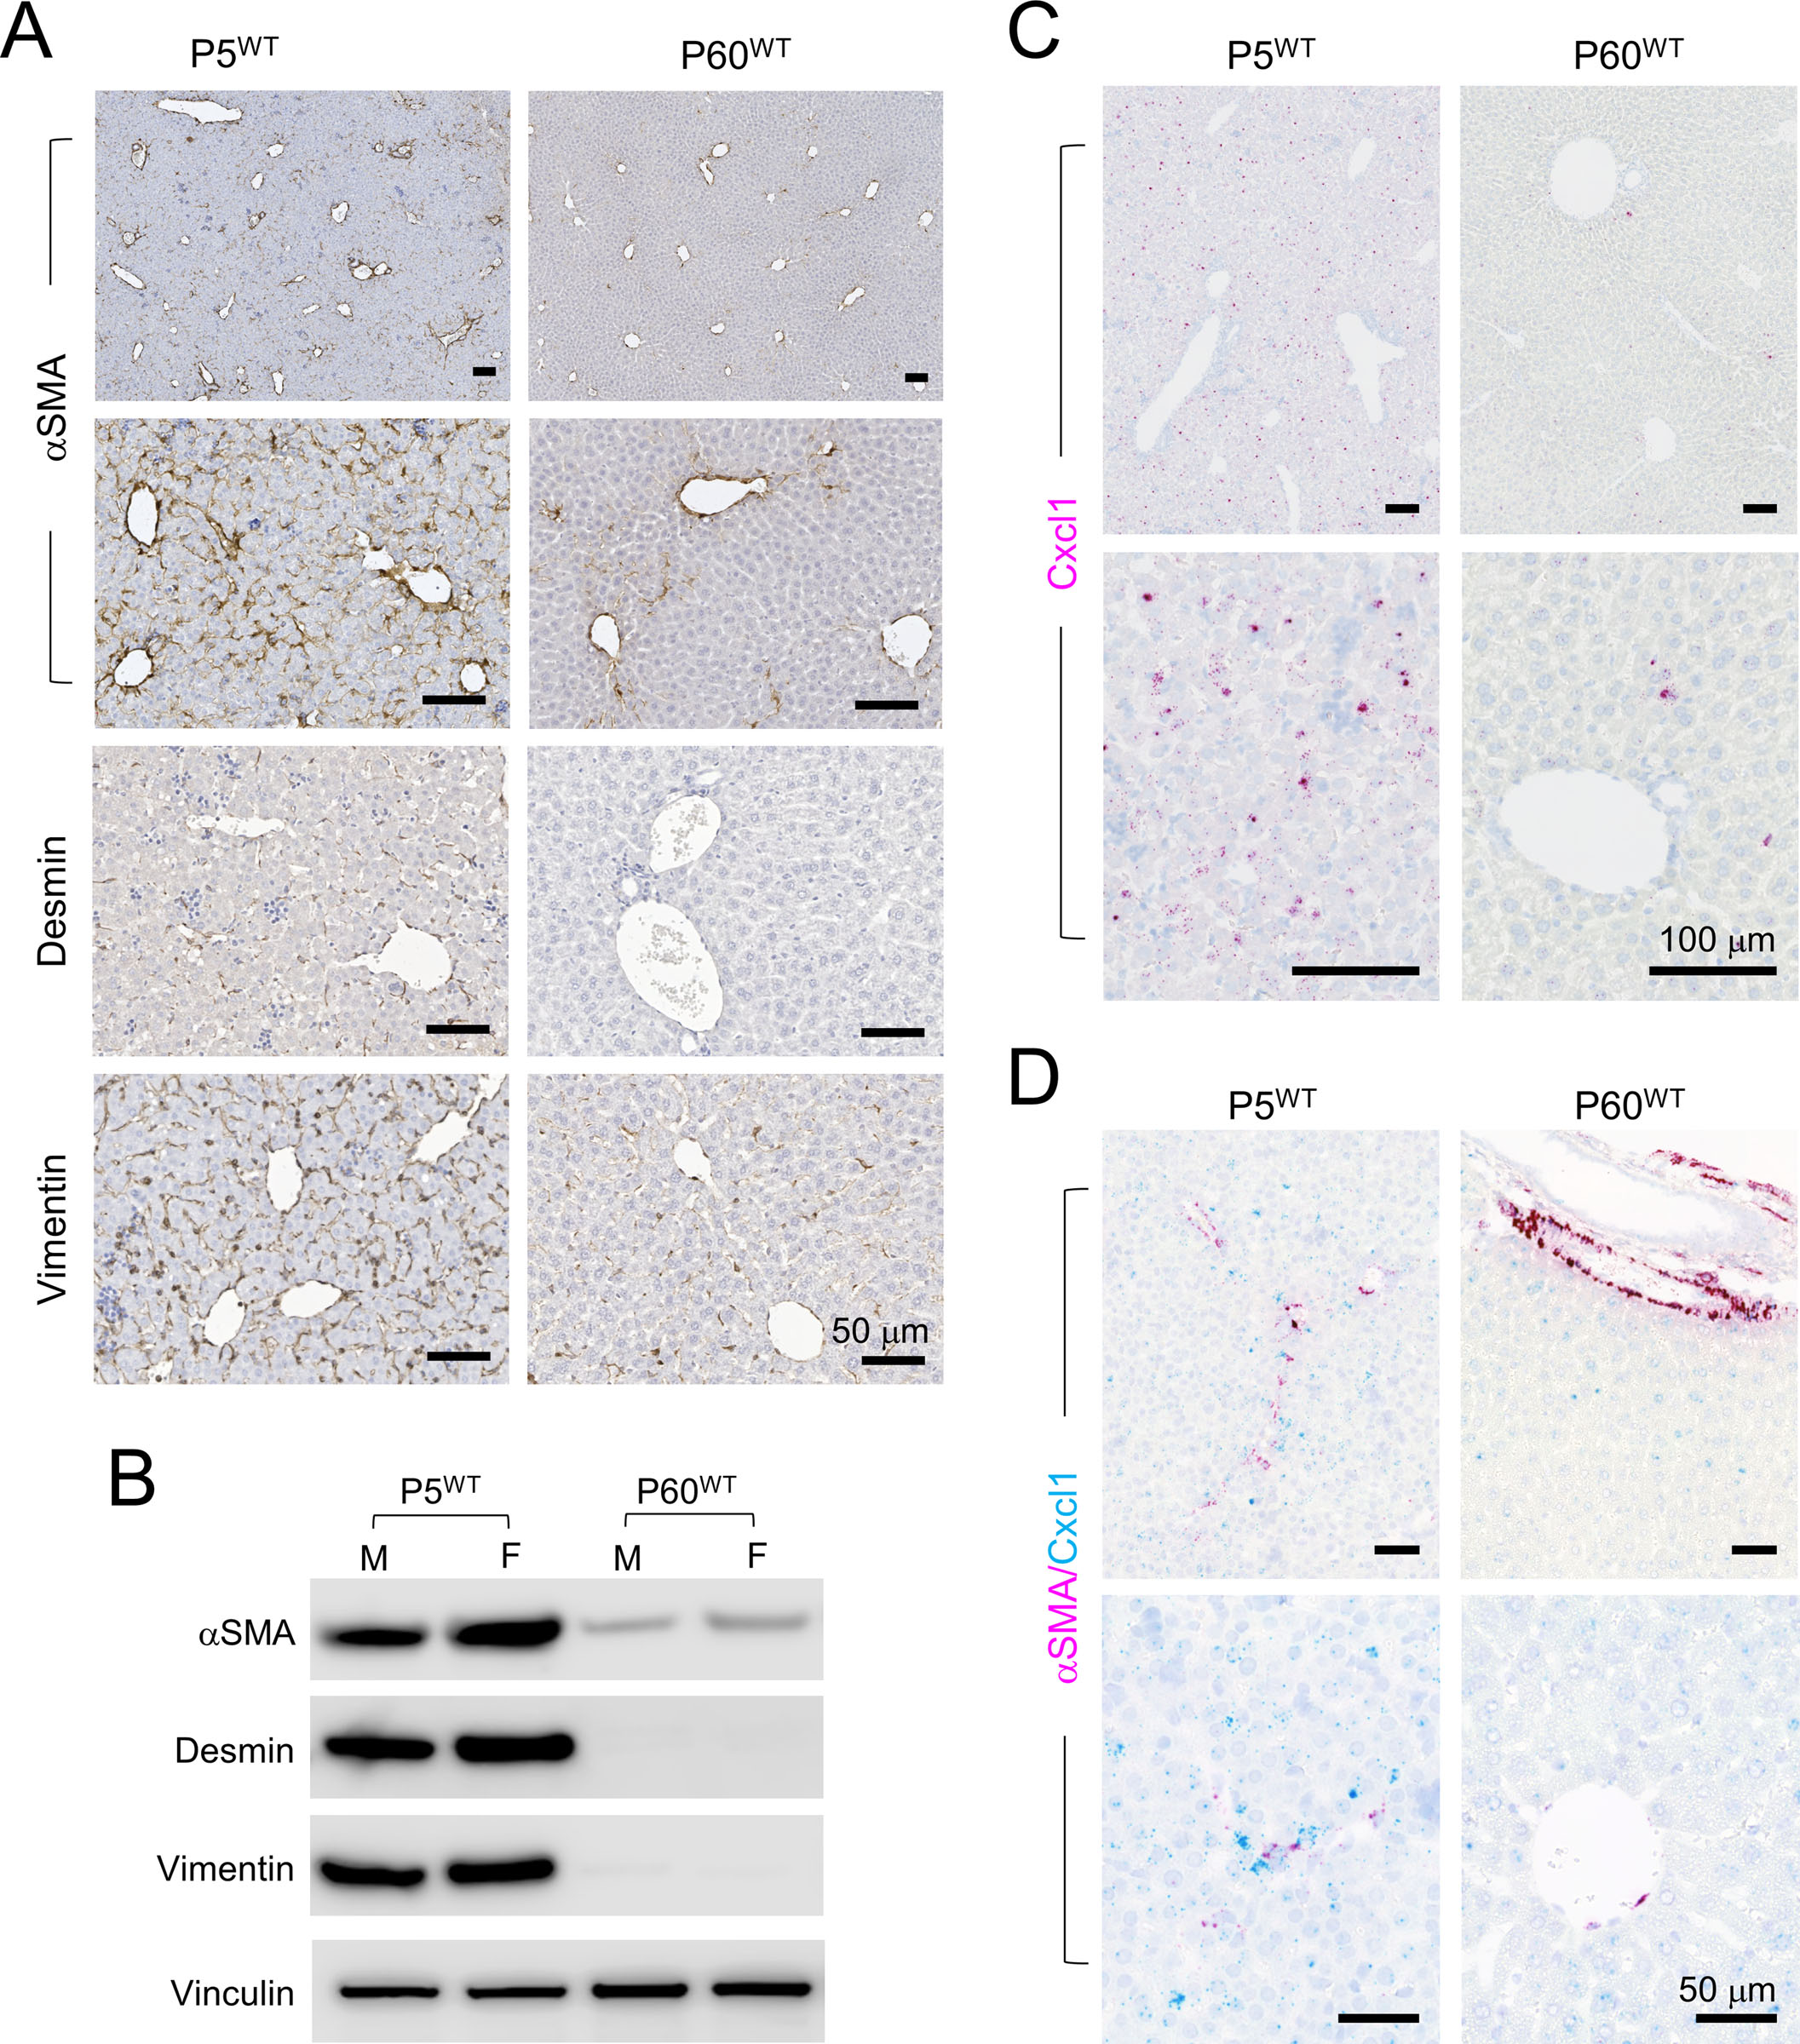
(A) IHC of the indicated HSC markers on the P5WT and P60WT liver. All scale bars are 50 μm.
(B) Immunoblots of the indicated HSC markers using whole cell proteins isolated from the P5WT and P60WT liver.
(C) RNAscope ISH of Cxcl1 on the P5WT and P60WT liver. Magenta: Cxcl1 signal; blue: hematoxylin counterstain. All scale bars are 100 μm.
(D) Dual RNAscope ISH of αSMA/Cxcl1 on the P5WT and P60WT liver. Magenta: αSMA signal; cyan: Cxc11 signal, blue: hematoxylin counterstain. All scale bars are 50 μm
Peritumoral aHSCs promotes HB cell migration and dissemination in a CXCL1-dependent manner
Since there were no HSCs from neonatal human liver available, we utilized two human HSC lines – LX-2, an immortalized human HSC cell line, and primary human HHSteC cells (ScienCell) – both isolated from adult human liver to study their interaction with HB tumor cells. Although it is likely that neonatal HSCs are different from those in the adult liver beyond their activation status, we focused on answering the question whether peritumoral aHSCs would affect HB cell behaviors in a Cxcl1-dependent manner. Both HSC lines were propagated on plastic culture plates to maintain an activated state.23, 24 We then performed a cytokine array assay using conditioned medium (CM) from these HSCs as well as HepG2 and HB214 cells. We found that both HSC lines secreted significantly higher levels of CXCL1 than tumor cells (Figure 4A). ELISA using the CMs confirmed the higher secretion of CXCL1 by LX-2 and HHSteC (185 and 1290 pg/ml, respectively) than HepG2 and HB214 cells (2 and 5 pg/ml, respectively) (Figure 4B). We also found other cytokines that signaled through the same receptor CXCR2, including CXCL2/3, CXCL5, CXCL6 and CXCL8, were secreted at significantly higher levels in the HSCs than HB tumors cells (Figure 4A and Suppl Figure S5).
Figure 4. Peritumoral aHSCs promotes HB cell migration and dissemination in a CXCL1-dependent manner in vitro and in vivo.
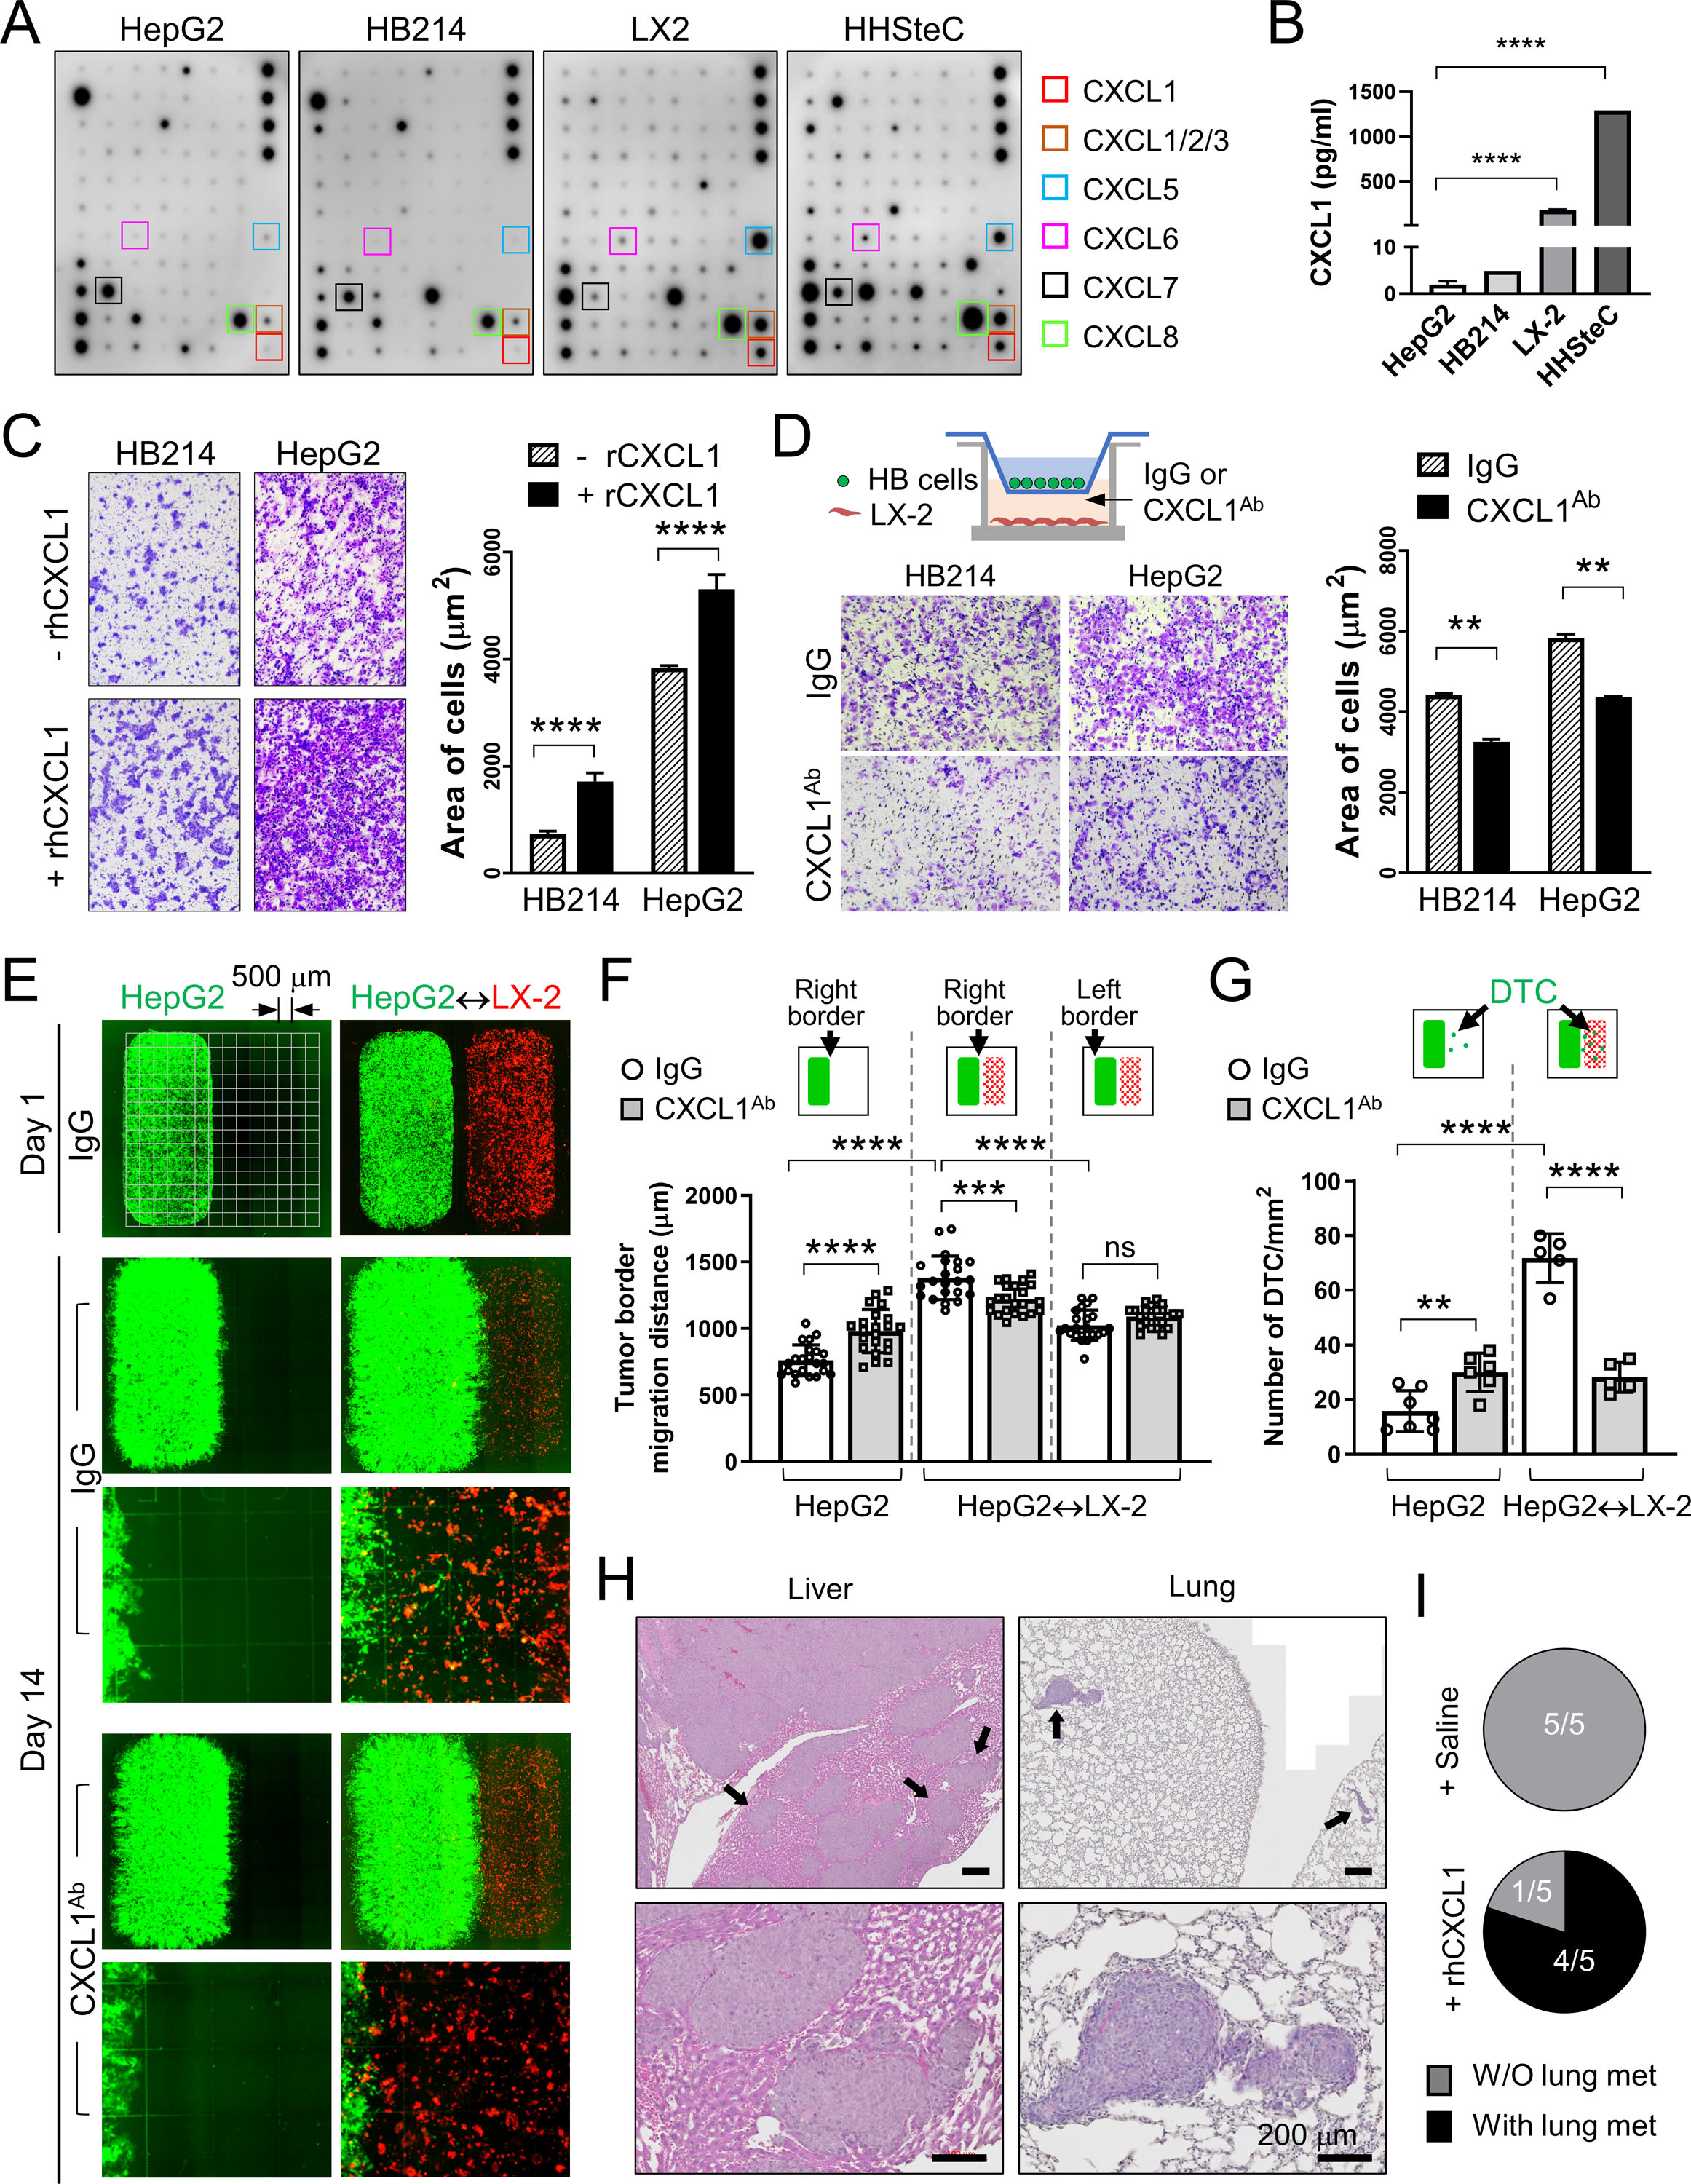
(A) Cytokine array assay using the CM from the indicated cells. Boxes: CXCR2 ligands.
(B) CXCL1 Elisa using the CM from the indicated cells.
(C) Images and quantification of the transwell migration assay of the HB214 and HepG2 cells pretreated with or without rhCXCL1.
(D) Images and quantification of the transwell migration assay of the HB214 and HepG2 cells as indicated in the top diagram. LX-2 was cultured in the bottom chamber with IgG or CXCL1Ab added in the medium. Number of cells/μm2 were counted and compared.
(E) Day 1 and Day 14 GFP/RFP fluorescence images of the two-well cocultures of GFP+ HepG2 and RFP+ LX-2. HepG2 was placed in the left well with or without RFP+ LX-2 in the right chamber, and treated with IgG or CXCL1Ab. Culture slides with an imprinted 500-µm grid were used as indicated in the top left image.
(F) Comparison of the HepG2 migration distance on the indicated border from Day 1 to Day 14 in (E) measured by using the 500-µm grid.
(G) Comparison of the number of disseminated HepG2 cells/mm2 in the indicated conditions.
(H) H&E images of the liver and lung of the P60Tx model treated with rhCXCL1. Arrows: metastases I the liver and lung. All scale bars are 200 μm.
(I) Pie charts showing the number of animals with or without lung metastasis in the saline- or rhCXCL1-treated P60Tx model.
All P-values were calculated by unpaired two-tailed t-test: ns, not significant, ** <0.01; *** <0.001; ****<0.0001.
When treated with recombinant human CXCL1 (rhCXCL1) protein, HepG2 and HB214 cells showed significantly increased migration ability in vitro (Figure 4C). Transwell migration assay with LX-2 placed in the bottom chamber also promoted the migration of both HepG2 and HB214 cells. Adding a neutralizing CXCL1 antibody (CXCL1Ab) in the bottom chamber suppressed this effect (Figure 4D). To better visualize peritumoral aHSC-induced HB cell migration, we set up a coculture system with LX-2 and HepG2 seeded separately by using a two-well silicone insert. Cell culture chambers with an imprinted 500-µm grid were used. GFP-expressing HepG2 cells were seeded in the left well (Well 1, or W1) with or without RFP-expressing LX-2 in the right well (W2) (Figure 4E). The insert was removed one day after seeding and cells were treated with IgG or CXCL1Ab. Tumor cell migration and dissemination were monitored and measured on Day 14. In IgG condition, HepG2 with LX-2 seeded in W2 showed significantly faster migration on the right border that faced LX-2, but not on the left border, than those seeded without LX-2 (average migration distance of the right border: 1381.0 μm vs 759.5 μm, respectively. P value < 0.0001) (Figure 4E, F). HepG2 with LX-2 in W2 also showed significantly greater cell dissemination from the right border than those without LX-2 (average number of disseminated cells: 16/mm2 vs. 72/mm2, respectively, P value < 0.0001). Upon CXCL1Ab treatment, we observed a significant reduction in both the migration and dissemination of HepG2 cocultured with LX-2, indicating that LX-2-secreted CXCL1 functions as a chemoattractant to HepG2 (Figure 4E, G). Interestingly, we found HepG2 seeded without LX-2 showed a mild but significant increase in their migration and dissemination under CXCL1Ab treatment, suggesting that the low level CXCL1 secreted by HB cells may also serve as a chemoattractant to keep tumor cells together.
To confirm the migration-promoting effect of CXCL1 on HB cells in vivo, we treated the P60Tx model transplanted with 1×10⁴ /mouse HepG2 with weekly treatment of rhCXCL1 protein or saline. All mice were euthanized 60 days post transplantation. We found that 4 of the 5 mice treated with CXCL1 developed intrahepatic metastases and small but multifocal lung metastasis while no liver or lung metastasis was detected in the saline-treated mice (0/5) (Figure 4H, I). CXCL1Ab treatment on the P5Tx model was not performed because their small size and poor post-surgery health prevented us from performing additional treatments on these pups. Overall, these results showed that peritumoral aHSCs promotes HB cell migration and dissemination in a CXCL1-dependent manner.
CXCR2 regulates the hypoxia response in HB tumor cells
Next, we tested the functional importance of the CXCL1 receptor, CXCR2, in HB development. We used CRISPR/Cas9 strategy to knockout (KO) the CXCR2 gene in HepG2 and HB214 cells (Figure 5A). We found it difficult to obtain single-cell clones with complete CXCR2 KO in both cell lines potentially because CXCR2 was a one-exon gene and both cell lines had a low single-cell clonability. We selected one KO clone for each cell line that showed the most significant reduction in CXCR2 protein level and performed RNA-seq to determine the impact of CXCR2 reduction on gene expression. Gene set enrichment analysis (GSEA) showed a significant downregulation of the hypoxia pathway in the CXCR2KO HepG2 cells (Figure 5B), a pathway that is well known for its prometastatic role in solid tumors.25 Indeed, the transcriptomics of HepG2 cells cultured under hypoxia showed a high degree of inversed correlation with that of the CXCR2KO HepG2 cells (Figure 5C). Possibly due to the low CXCR2 expression in the parental HB214 cells (Figure 5A), CXCR2KO in HB214 caused a lesser degree of hypoxia-related gene expression changes which, however, still showed a similar inversed pattern compared to HepG2 cells cultured under hypoxia (Figure 5D), suggesting CXCR2KO in HB214 also negatively impacted hypoxia-responding genes. On the other hand, hypoxia did not induce consistent increases in CXCL1 or CXCR2 expression in the HB tumor cells and the two HSC cell lines cultured under hypoxia, indicating that these two genes are not direct downstream effectors of hypoxia (Suppl. Figure S6).
Figure 5. CXCR2 regulates the hypoxia response in HB tumor cells.
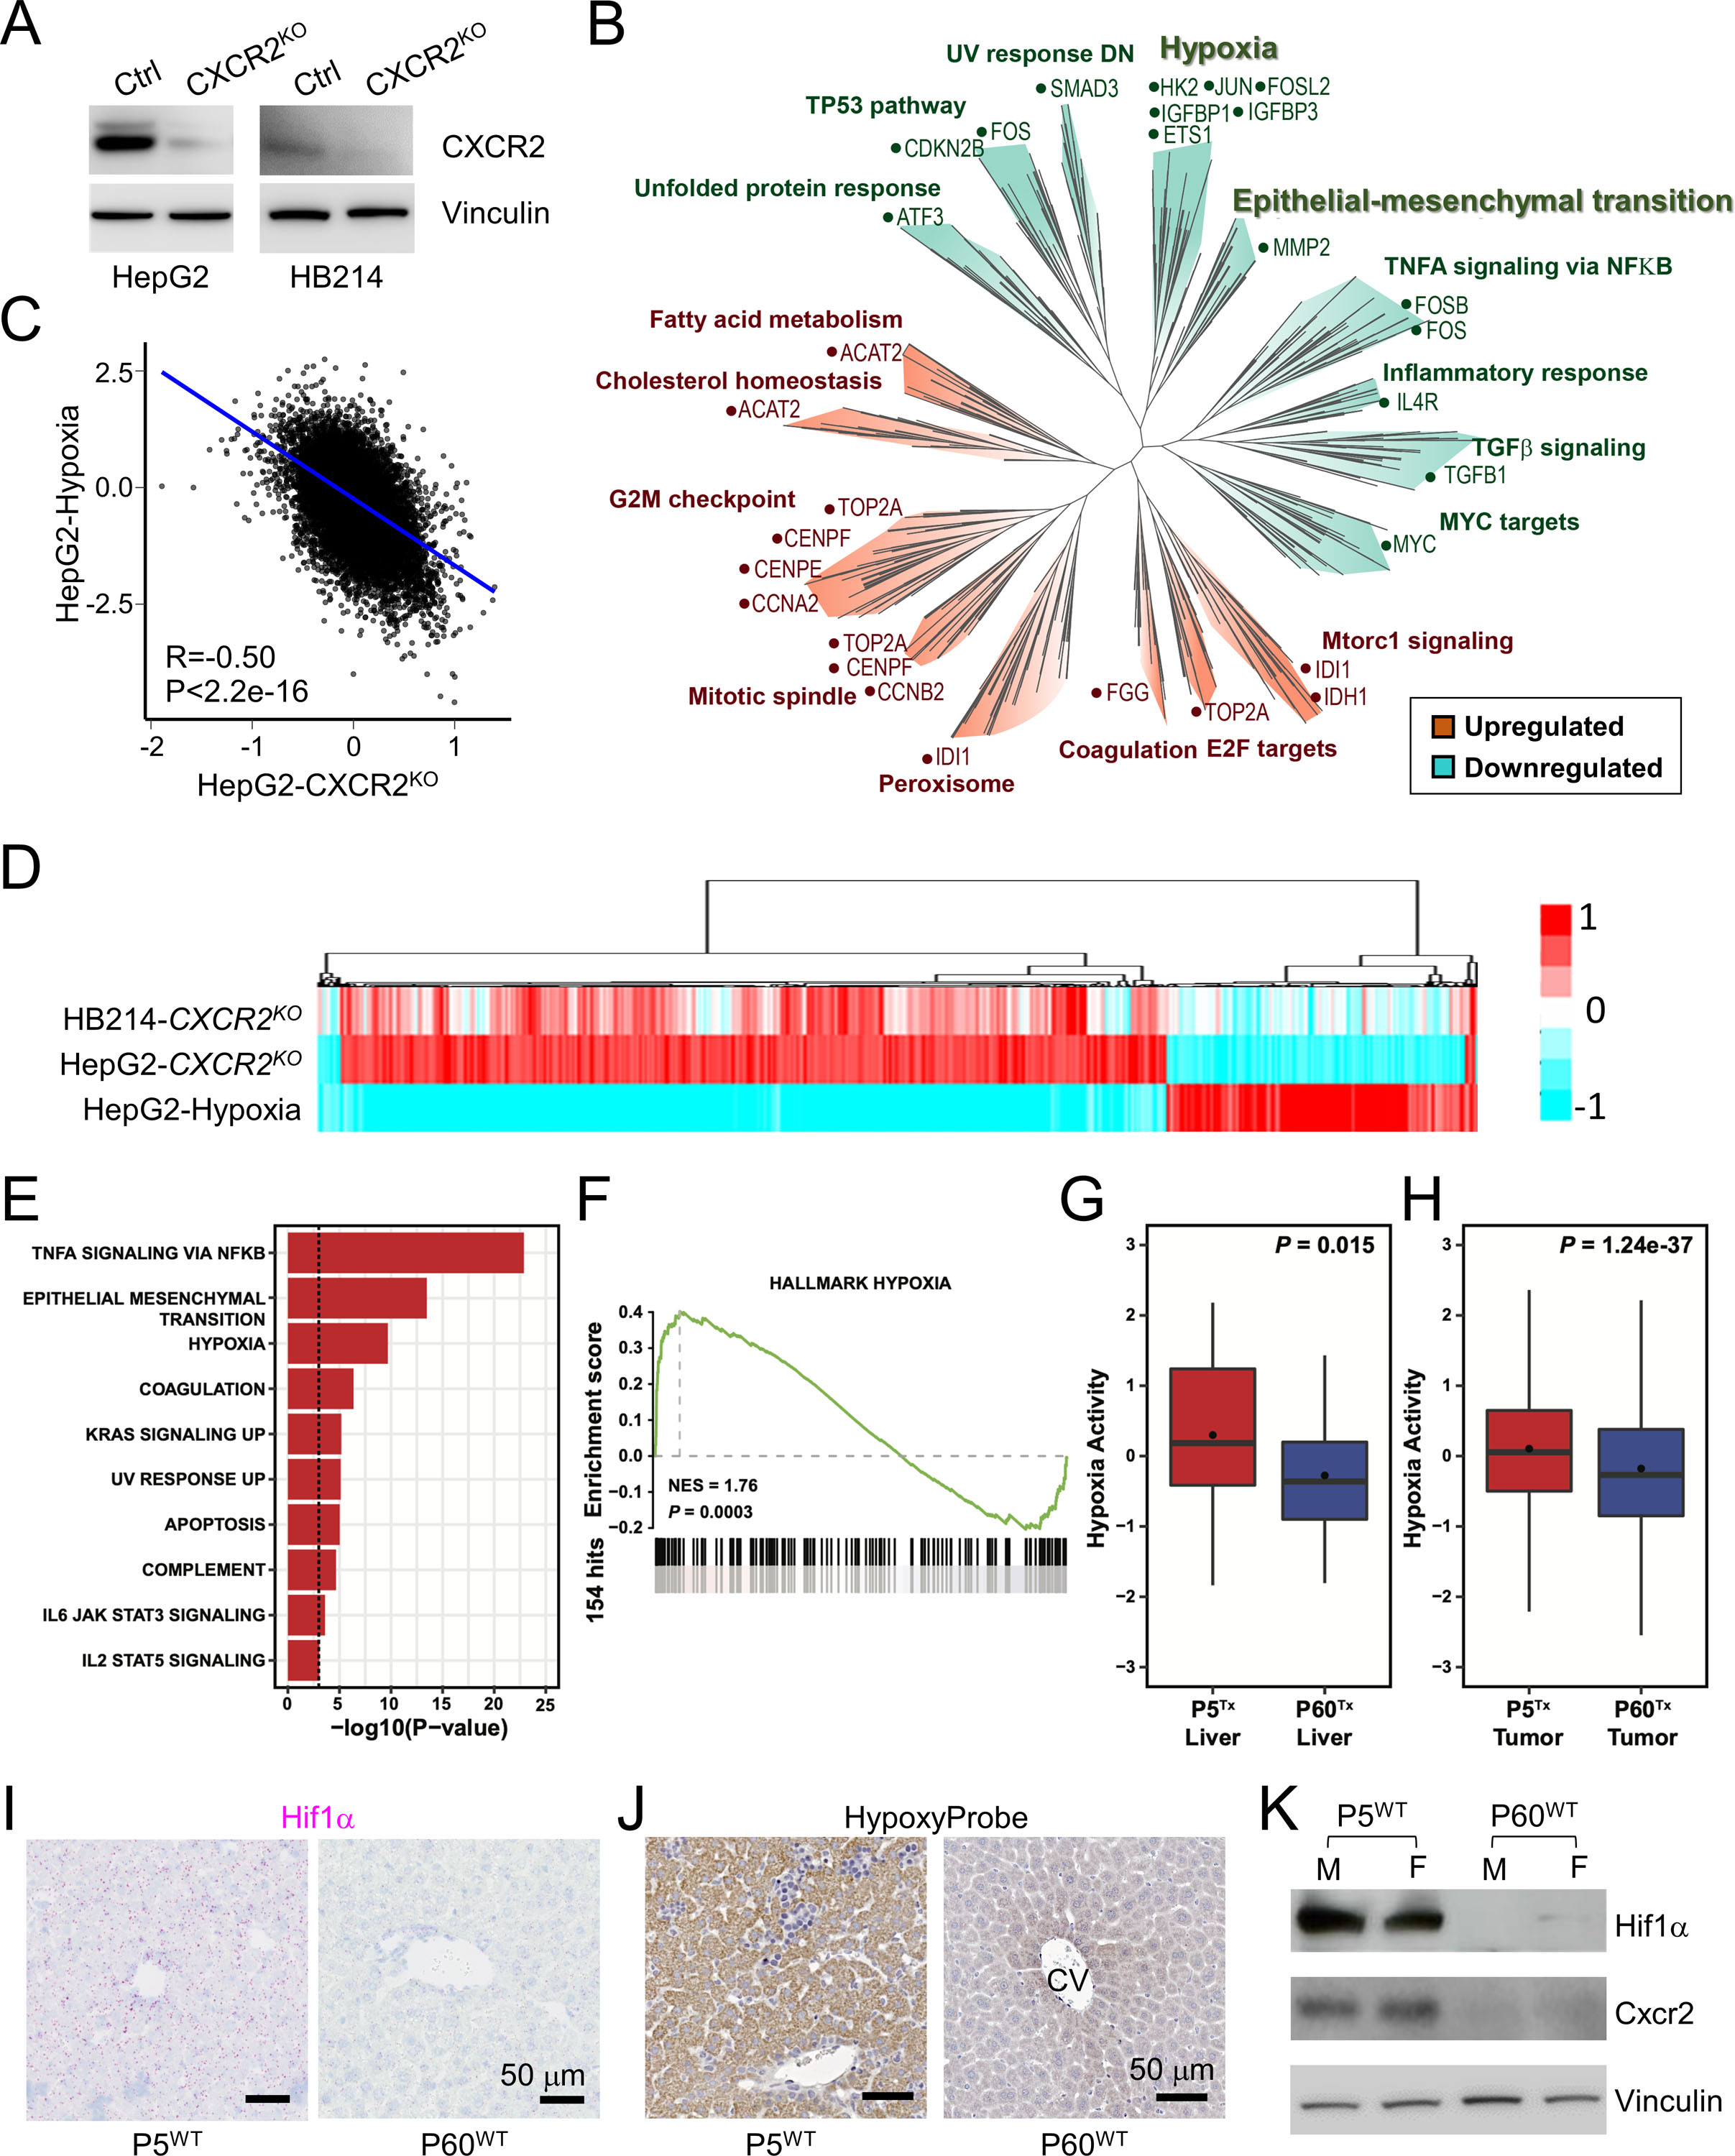
(A) Immunoblots of CXCR2 and Vinculin in the indicated HB cells.
(B) Pseudo-tree visualization of the GSEA comparing HepG2 control and CXCR2KO cells.
(C) Spearman correlation of the RNAseq gene expression of the HepG2 cells cultured under hypoxia and CXCR2KO HepG2 cells.
(D) Unsupervised clustering of the RNAseq gene expression of the indicated cell types.
(E) Enrichment analysis of HALLMARK gene sets among the 140 up-regulated genes in P5Tx liver HSCs using the Fisher’s exact test. Only those significantly enriched gene sets with P-value < 0.001 were shown.
(F) GSEA of HALLMARK_HYPOXIA comparing the P5Tx and P60Tx liver HSCs.
(G, H) Boxplot showing the distribution of hypoxia activities inferred by NetBID2 between the P5Tx and P60Tx peritumoral HSCs (G) and HepG2 tumor cells (H). P-values were calculated by unpaired two-tailed t-test.
(I) RNAscope ISH of Hif1α on the P5WT and P60WT mouse liver. Magenta: Hif1α signal; blue: hematoxylin counterstain. Both scale bars are 50 μm.
(J) HypoxyProbe IHC on the P5WT and P60WT mouse liver. Both scale bars are 50 μm.
(K) Immunoblots of Hif1α, Cxcr2, and vinculin using the whole proteins from the P5WT and P60WT mouse liver. M: male mouse; F: female mouse.
Based on these results, we looked into the scRNA-seq data of the HepG2 P5Tx and P60Tx models for hypoxia-related differences. Indeed, the hypoxia pathway is one of the top upregulated pathways in P5Tx liver HSCs compared to those in P60Tx liver (Figure 5E–G). HepG2 cells from the P5Tx model also showed a mild but significant increase in hypoxia network activity than those from the P60Tx model (Figure 5H). When examining the P5WT and P60WT mouse liver, we found the former showed a much higher expression of Hif1α – a master regulator of hypoxia26 – than the latter (Figure 5I). HypoxyProbe assay further confirmed higher hypoxia activity in P5WT liver than P60WT liver (Figure 5J). Immunoblotting confirmed higher protein levels of Hif1α and CXCR2 in P5WT liver than P60WT liver (Figure 5K). Overall, our data suggest that the neonatal liver is developmentally more hypoxic compared to adult liver, rendering a high hypoxia activity in its HSCs as well as tumor cells growing within.
CXCL1/CXCR2 axis is essential to HB cell migration and survival under hypoxia
Hypoxia is known to be tightly associated with epithelial-mesenchymal transition (EMT). Indeed, HepG2 cells cultured under hypoxia showed a significant upregulation of the Hallmark_EMT pathway, which was downregulated in CXCR2KO HepG2 cells and HB214 cells although the latter did not reach statistical significance (Figure 6A). In vitro migration assay confirmed that HepG2 and HB214 cells cultured under hypoxia had a significant increase in their migration ability, and adding rhCXCL1 further increased migration ability of the hypoxic cells (Figure 6B). We noticed that hypoxia also had a strong, negative impact on the survival of HB cells. HepG2 and HB214 cultured under hypoxia for seven days showed a dramatic increase in their apoptosis which, however, was largely reversed by rhCXCL1 treatment (Figure 6C). Based on these observations, we hypothesized that CXCL1-secreting HSCs could protect HB cells from hypoxia-induced apoptosis, an effect which would be lost to CXCR2KO HB cells. To test this, we cultured GFP+ control and CXCR2KO HepG2 and HB214 cells with or without LX-2 HSCs under normoxia and hypoxia. Tumor cell survival was monitored via their GFP fluorescence. No difference was seen in tumor cell survival when these cocultures were maintained under normoxia for two weeks (Figure 6D, e–l). As expected, hypoxia induced a significant cell death in both the control and CXCR2KO HB cells grown without LX-2 after two weeks (Figure 6D, m, q, o, s). When cocultured with LX-2 under hypoxia, the control cells showed a significantly better survival (Figure 6D, n, p), while no improvement in cell survival was seen in the CXCR2KO HB cells (Figure 6D, r, t). To determine the importance of CXCR2 to HB development in vivo, we transplanted the control and CXCR2KO HepG2 cells in P5 mouse liver at 1×10⁴/mouse and euthanized all animals after six weeks. We found CXCR2KO HepG2 cells generated significantly smaller tumors in the liver than the control cells and developed no lung metastasis (0/4), while 3/3 P5Tx mice transplanted with the control HepG2 developed multifocal intrahepatic metastasis and 2/3 had lung metastases (Figure 6E). These results reveal the importance of CXCL1/CXCR2 axis-mediated HB-aHSCs interaction in HB cell migration and survival under hypoxia.
Figure 6. CXCL1/CXCR2 axis is essential to HB cell migration and survival under hypoxia.
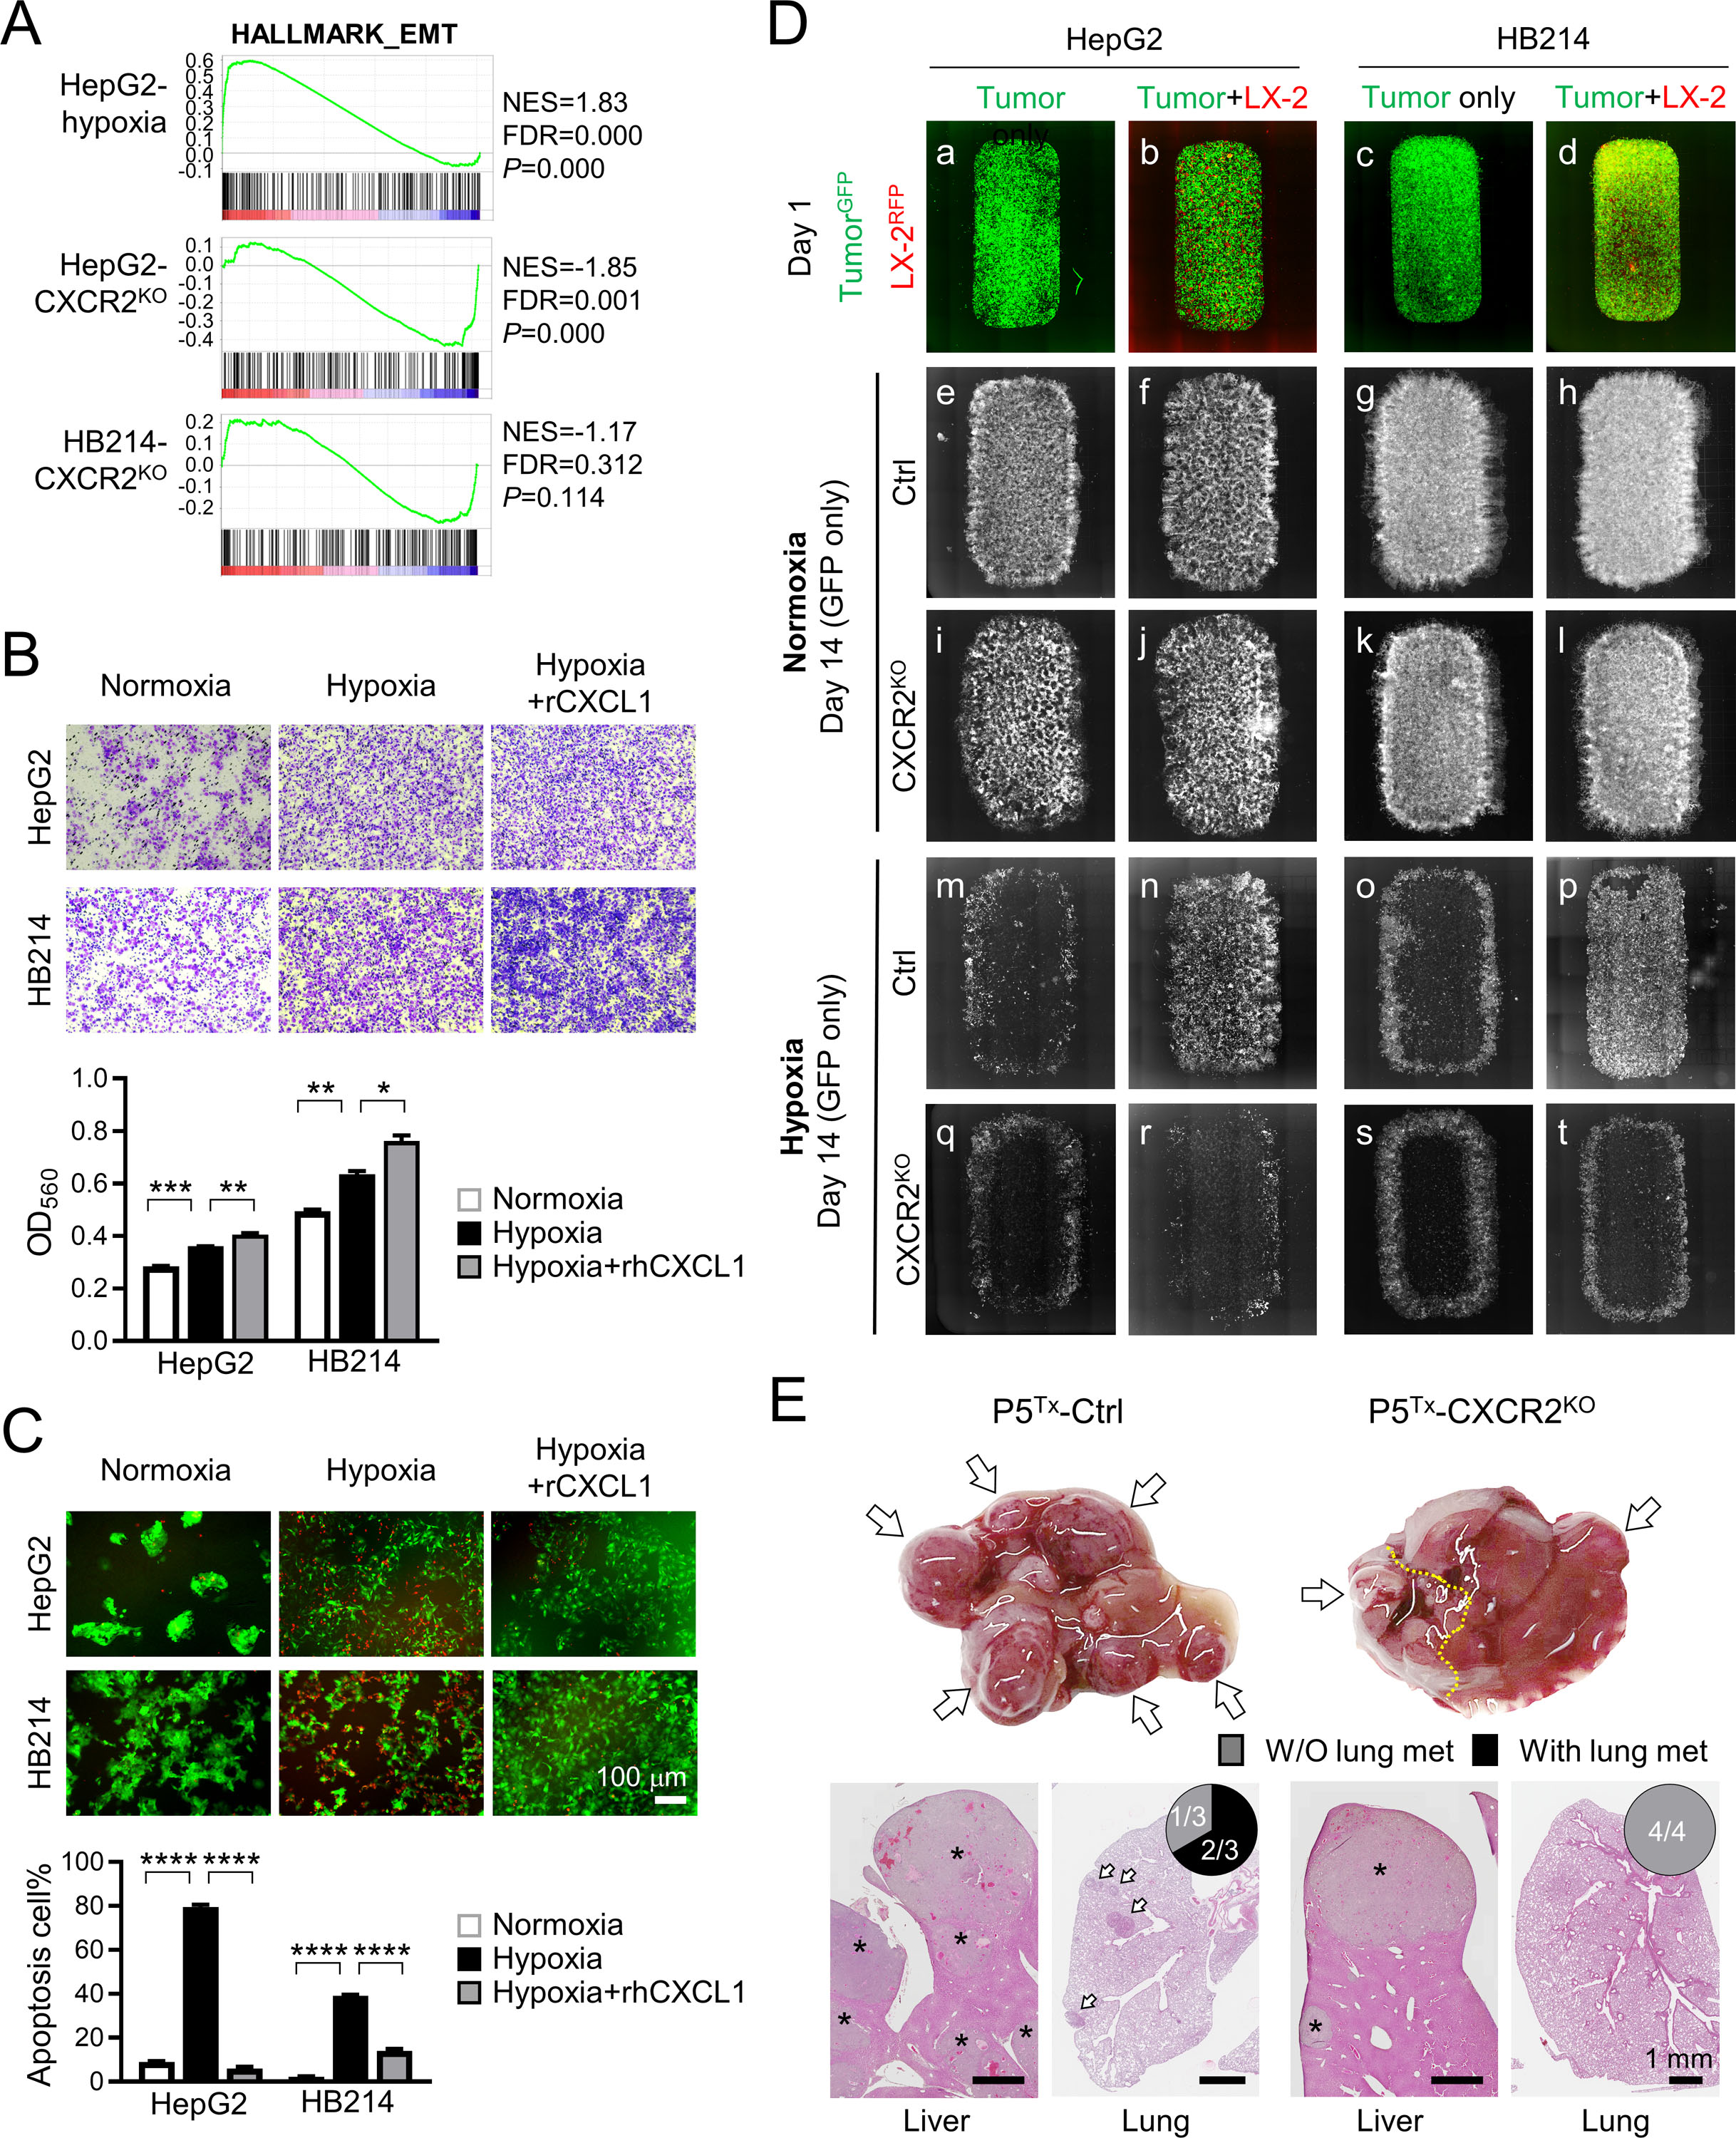
(A) GSEA of HALLMARK_EMT gene set by comparing the RNAseq profiles of the indicated cells with their control cells.
(B) Transwell migration assay of the HepG2 and HB214 cells cultured under hypoxia.
(C) Images and comparison of Caspase-3 apoptosis assay of the HepG2 and HB214 cells cultured under the indicated conditions. Apoptotic cells were labeled by NucView 530 RFP fluorescence. P-values were calculated by unpaired two-tailed t-test.
(D) Day 1 and Day 14 fluorescence images of the GFP+ HepG2 and HB214 cocultured with or without RFP+ LX-2 under normoxia and hypoxia. Day 1 images are merged GFP/RFP and Day 14 images are GFP only.
(E) Liver gross images (top) and H&E images of the liver and lung (bottom) of the P5Tx model transplanted with control or CXCR2KO HepG2 cells. * tumors in the liver; arrows: lung metastases. Pie charts indicate the incidence of lung metastasis. All scale bars are 1 mm.
Peritumoral aHSCs and tumor hypoxia are associated with HB patient prognosis
To validate our aHSC-related findings in HB patients, a small group of Stage I (n=3) and Stage IV (n=3) HB patient tumors resected with >= 5mm of adjacent liver were identified. The tumor number was low due to the rareness of this pediatric cancer, and the fact that most of the HB surgical specimens in our archives were biopsies that did not have sufficient sampling of the tumor-liver interface. Because nearly all HB patients with metastatic disease receive chemotherapy prior to tumor resection, all three Stage IV tumors we examined in this study were post chemotherapy. To minimize the impact of HSC activation induced by chemotherapy in our comparison, the Stage I tumors chosen were also post treatment.
IHC for αSMA was performed to detect aHSCs in these patient tumors. We found that the Stage IV, metastatic HB tumors had consistently higher numbers of αSMA+ aHSCs in both the tumor core as well as the near-tumor liver than the Stage I, localized tumors (Figure 7A). Additionally, all three metastatic tumors showed more intense αSMA staining and more αSMA+ aHSCs in the near-tumor liver than in the tumor core, suggesting that peritumoral aHSCs may have a stronger association with HB metastasis than intratumoral HSCs. To validate our hypoxia-related findings in HB patients, we examined HIF1A expression in association with HB tumor risk using a published HB patient tumor transcriptomic database.27 We found HIF1A expression was significantly higher in the high-risk HB patient tumors than the intermediate- and low-risk ones (P=0.036 and 0.001, respectively) (Figure 7B). HB patients with lower HIF1A expression also had significantly longer survival (P=0.031) (Figure 7C). Since there have been multiple large transcriptomics studies on pediatric cancers, we compared the association between HIF1A expression in the tumor cells and patient survival in 12 different pediatric cancers including HB by pooling multiple publicly available RNAseq transcriptomics databases (see details in Methods). We found that HB was the only pediatric solid tumor that showed a significant association between tumor hypoxia activity and patient survival (Hazard ratio, or HR, = 10.12, P=0.015) (Figure 7D). Pediatric acute lymphoblastic leukemia was another pediatric cancer that showed significance, but with a much lower HR than HB (1.34 vs. 10.12). Compared to the other 33 adult cancer types we similarly calculated the association between HIF1A expression and patient survival, HB was still the only cancer type that had a HR above 2 (Suppl Figure S7). Taken together, these results indicate that hypoxia has a very unique, strong impact on HB development among pediatric cancers.
Figure 7. Peritumoral aHSCs and tumor hypoxia are associated with HB patient prognosis.
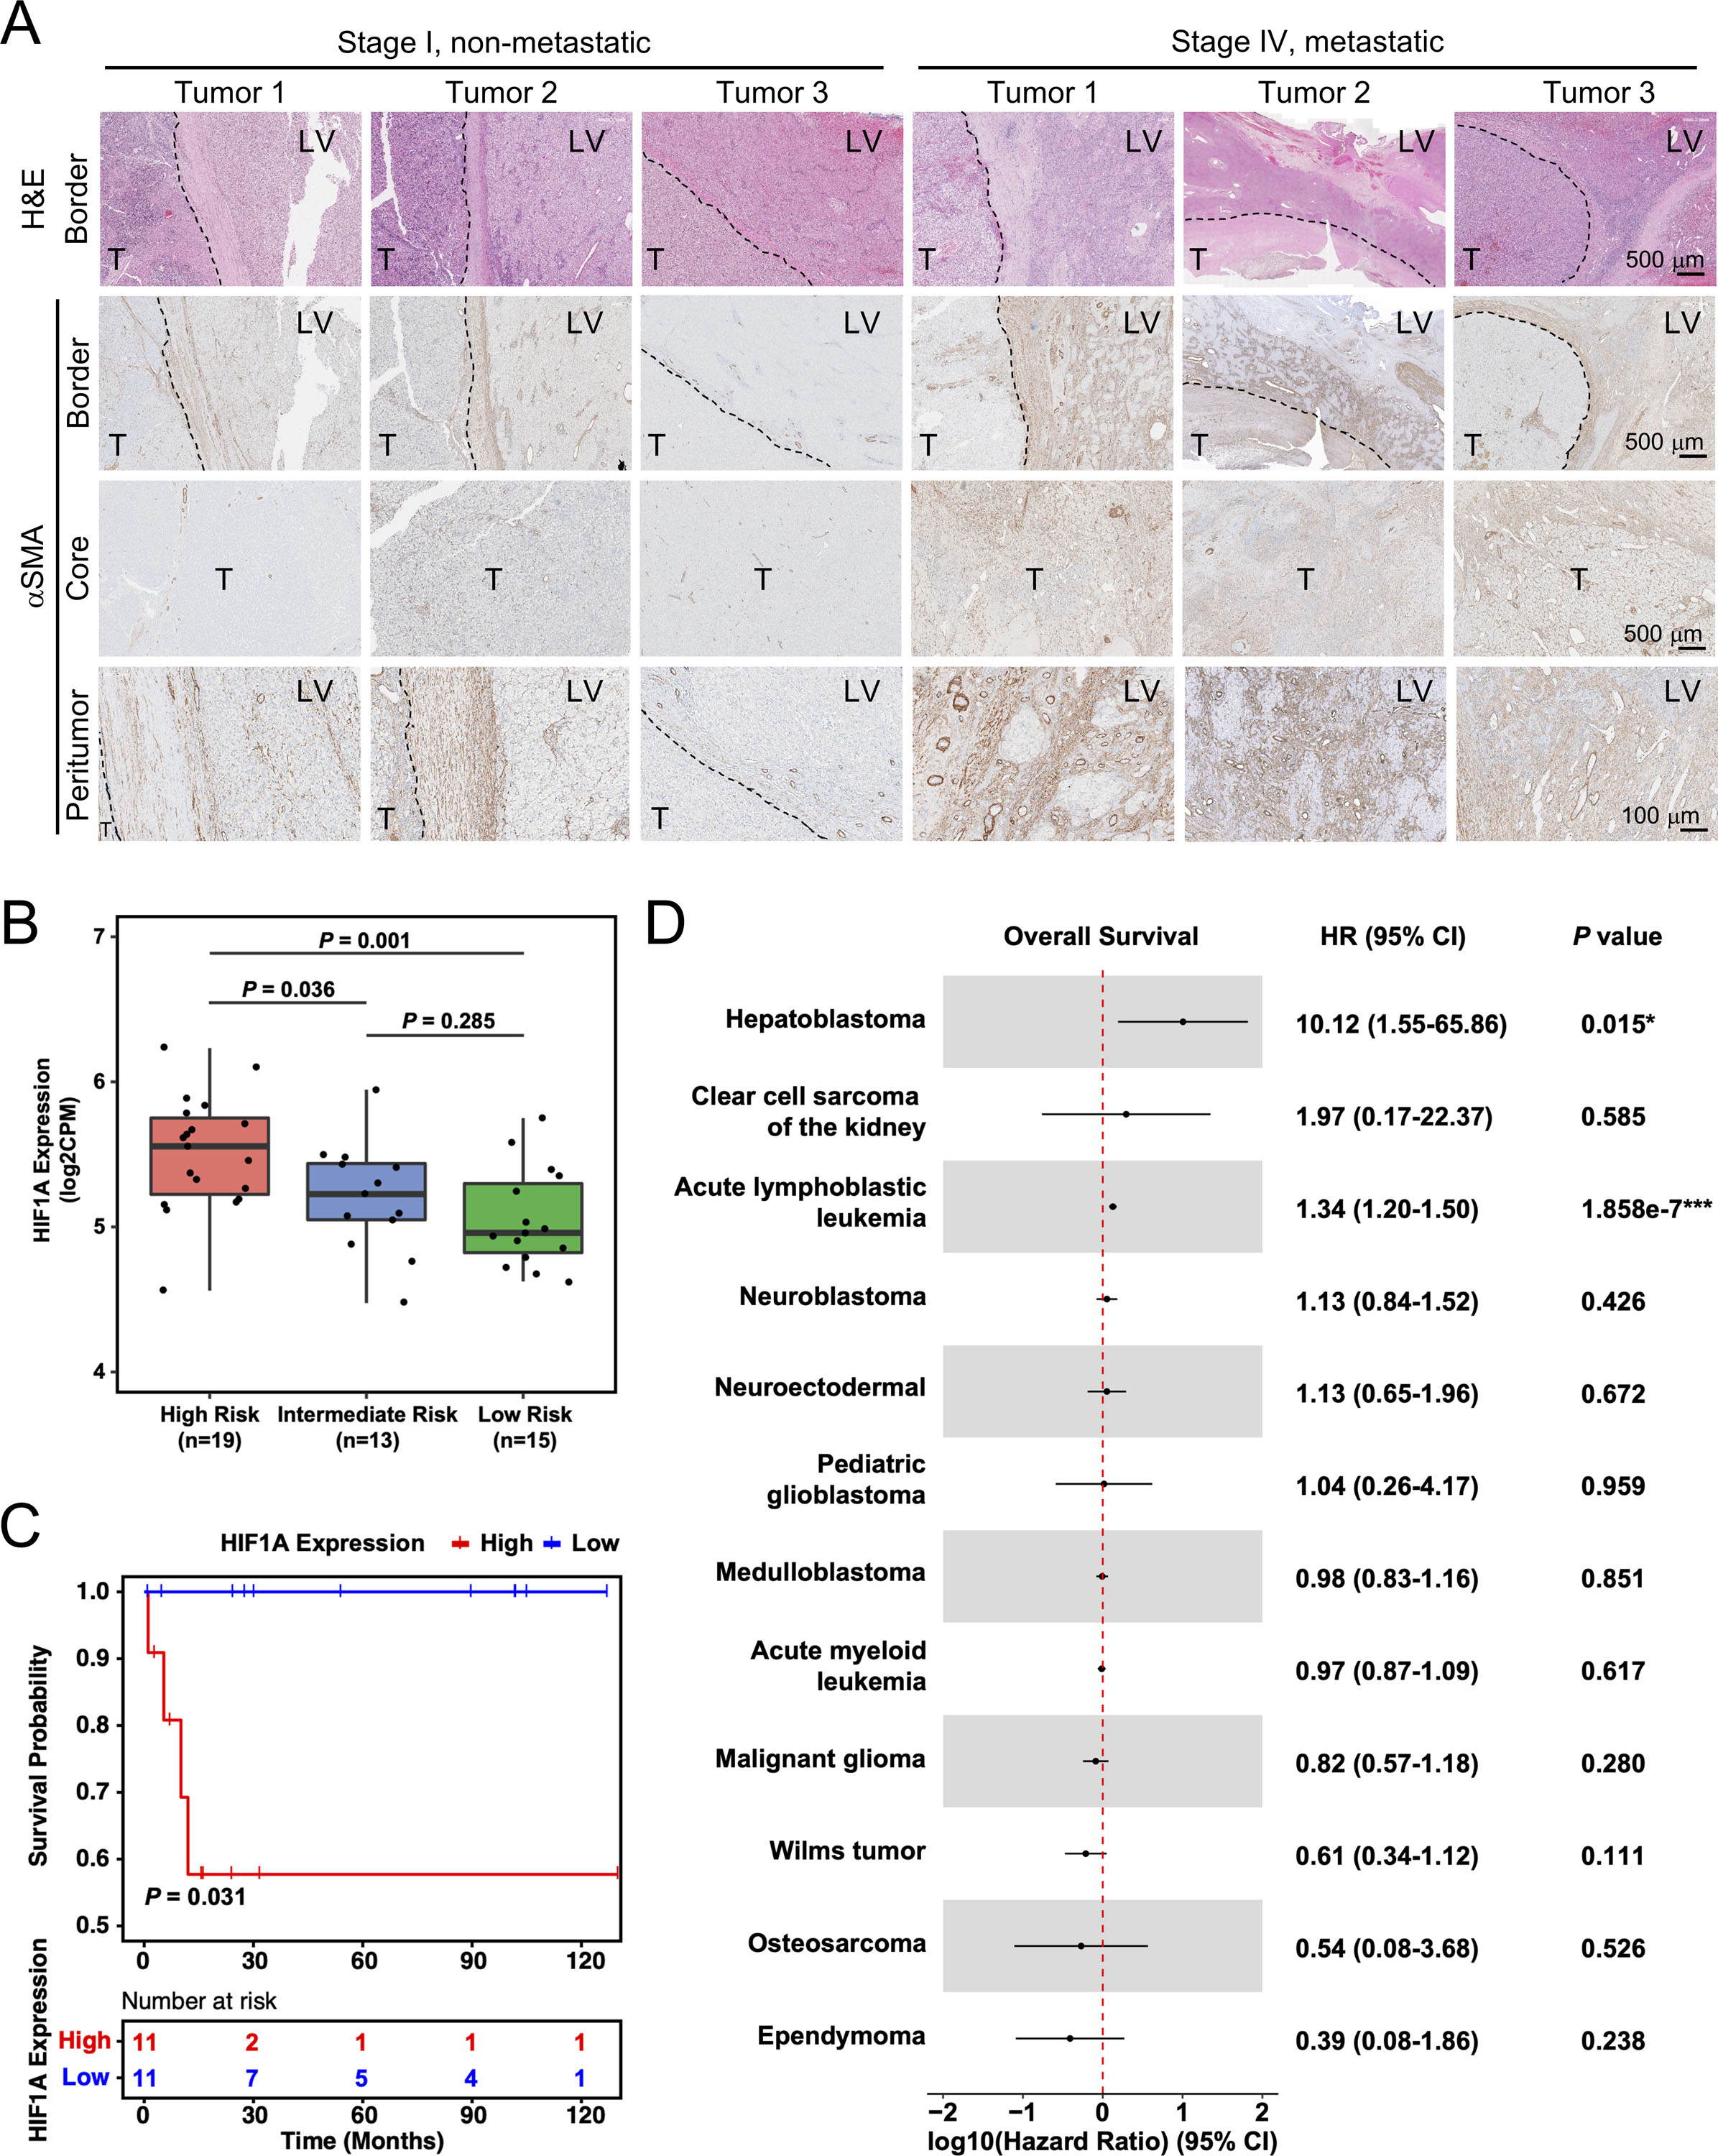
(A) H&E and aSMA IHC images of HB patient tumors. Dashed lines: tumor border. T: tumor; LV: liver. Images on the same row share the same scale bar.
(B) Boxplot showing the distribution of HIF1A expression among high-, medium-, and low-risk HB patient tumors. P values were calculated by unpaired two-tailed t-test.
(C) Kaplan-Meier estimates of overall survival comparing the top (“High”) and bottom (“Low”) quarter of HB patients with regard to HIF1A expression. P-value was calculated by log-rank test. Tick marks indicate censoring.
(D) Forest plot showing the association between HIF1A expression and overall survival among the patients of 12 types of pediatric cancer. HR, 95% CI and P values were calculated by univariate Cox proportional-hazards model.
DISCUSSION
In this study, we compared HB metastasis outcome in mice transplanted with human and mouse HB cells at P60 and P5 and found that these cells were markedly more metastatic in the latter. Via single-cell transcriptomic analysis, we found higher levels of Cxcl1 in the peritumoral aHSCs in the P5Tx model than the P60Tx model. We showed that this difference was part of the normal liver development that the P5WT liver had a much larger population of aHSCs and higher expression of Cxcl1 than the P60 WT liver. We showed that aHSCs secreted high levels of CXCL1, which was chemoattractant and prometastatic to HB cells both in vitro and in vivo. We found the P5WT liver was indeed significantly more hypoxic than the P60WT liver. Hypoxia induced HB cell migration but had a negative impact on survival, and aHSCs protected HB survival under hypoxia via the CXCL1/CXCR2 axis. Knockout of the CXCL1 receptor, CXCR2, in HB tumor cells compromised their hypoxia response and abolish their metastasis potential in the P5Tx model. Using a limited number of patient tumors, we showed that there was a potential association between the number of peritumoral aHSCs and metastasis in HB patients. By pooling transcriptomics database from 12 different types of pediatric cancers, we found, for the first time, that hypoxia has a unique, strong association with the poor survival of HB patients.
To our knowledge, work presented here is one of the first studies that places a pediatric solid tumor in its correct TME and demonstrates a strong impact of the developmentally immature TME on its progression. In fact, HB is the only pediatric cancer with a significantly increased risk in children and young adults born preterm.28 One common problem in premature infants is intermittent hypoxia in multiple organs.29, 30 However, the pathophysiologic impact of intermittent hypoxia has been mainly studied in the respiratory and nervous systems with little knowledge of its impact on early liver biology and pathogenesis. Our results on CXCL1/CXCR2 and hypoxia provide a potential explanation for the strong association between HB risk and premature birth.4 Indeed, our transcriptomic analysis on 12 types of pediatric cancers revealed that HB is the only cancer type in which HIF1A expression is strongly associated with poor prognosis. We acknowledge that tumor metastasis we focused on in this study is only one of the contributing factors to HB prognosis. Further investigations on how hypoxia impacts liver and HB biology are in order to better understand HB development in young children.
We acknowledge that a major limitation of this study is the use of immunocompromised mice, which excluded the contribution from immune-related players that utilize the CXCL1/CXCR2 axis.31–33 We are bound by the limited research resources derived from HB patients.34 A thorough investigation of the CXCL1/CXCR2 axis in various cellular compartments in HB patient tumors and tumor-surrounding liver will be necessary in the future to fully appreciate the involvement of this signaling pathway in HB development. We also acknowledge the small number of patient tumors we included due to the rarity of this cancer and the extremely limited specimens that have tumor-surrounding liver attached, which has made it difficult to establish statistical significance for our observations.
Rare pediatric cancers present one of the greatest challenges to the oncology community. Although most pediatric cancers have an excellent prognosis, their advanced forms still kill. With ever increasing appreciation of the importance of TME in adult cancers, it is necessary to begin the effect to investigate the developmental TME in pediatric cancers in order to achieve a more comprehensive understanding of their biology and more effective treatment for advanced diseases.
METHODS
Animals
Animal protocols were approved by the St. Jude Animal Care and Use Committee. All mice were maintained in the Animal Resource Center at St. Jude Children’s Research Hospital (St. Jude). HB tumor cells were surgically injected into the liver of P5 and P60 male and female NSG mice (JAX) at 5×10⁴/mouse in 2 μl cold growth factor-reduced (GFR) matrigel (Corning) using a 5-μl Hamilton syringe and a 27-gauge needle (Hamilton Company, Bonaduz, Switzerland). Animal survival curves and their median survival were determined by the Kaplan–Meier method in GraphPad Prism 7.
Generation of CXCR2 KO cell lines by the CRISPR/Cas9 system
CXCR2KO HepG2 and HB214 cells were generated via a CRISPR/Cas9 approach. The sgRNA sequence 5′-AAAAATGGAAGATTTTAACANGG-3′ is located at the start codon of CXCR2 gene.
Cytokine array assay
Proinflammatory factor levels were measured using human Cytokine Array C5 (RayBiotech, GA, USA). The intensities of signals were quantified, normalized to positive control. The culture supernatants were also applied onto Human CXCL1/GRO alpha Quantikine ELISA Kit from R&D.
Cellular functional assays
Cell migration ability was determined by CytoSelect™ 24-Well Cell Haptotaxis Assay (8 µm, Collagen I-Coated, Colorimetric Format; Cell Biolabs, Inc). Cells from five randomly selected fields were counted using Image J. For apoptosis assay, Cells were incubated with 2 µM NucView 530 Caspase-3 Substrate (Biotium, Fremont, CA) for 30 minutes and imaged by fluorescence microscopy. Cells from five randomly selected fields were counted using Image J. For two-chamber migration assay, a two-chamber culture insert was placed in the µ-slide 8-well Grid-500 culture slides (ibidi, Gräfelfing, Germany). LX-2 were labeled with CellTracker™ Red CMTPX (Thermo Fisher). The plates were scanned with Lionheart machine (Biotech). Cell migration rate was determined by measuring the distance between the tumor border on Day 1 and Day 14 within the middle 11 grids, 2 points/grid. Number of DTCs was counted using Image J from five randomly selected grids. All measurements were plotted using GraphPad.
All cellular functional assays were repeated >= three time.
Total mRNA sequencing and analysis
Total RNA library was constructed using Illumina TrueSeq stranded mRNA library prep kit and sequenced using the HiSeq 2000/2500 or NovaSeq 6000 platform (2 × 101- bp pair-end reads).
Single-cell RNA-sequencing (sc-RNAseq) and analysis
P5Tx and P60Tx mice were euthanized 42 days after intrahepatic injection. The injected liver lobe was removed. Tumor and the surrounding liver were separated and dissociated separately with papain digestion solution. The single cells dissociated from the liver and tumor tissues were processed by the Chromium Single Cell Platform using the Chromium Single Cell 3’ Library and Gel Bead Kit v2 (10X Genomics) as per the manufacture’s protocol. The libraries were sequenced by Novaseq 6000 (Illumina). The HALLMARK gene sets from MSigDB database (v-6.1)35 were used for the three gene set analysis. We employed a systems biology method to measure the hypoxia activity in both neonatal and adult mice. The hypoxia activity was defined as the geometric mean of expression of genes involved in the HALLMARK HYPOXIA gene set. The activity was calculated by NetBID2 (v-2.0.3, “cal.Activity.GS”).
Patient cohorts collection and survival analysis
We collected the pediatric cancer patient information from the QIAGEN Oncoland (Pediatrics, 2018Q1 release) and TARGET RNA-seq data (LandVersion: TARGET_B38_20170310_v1). A total of 52776 genes across 1319 samples were included in the final cohort. Kaplan-Meier estimates were constructed by survival R package (v-3.2–13, “survfit”)36 and visualized by survminer R package (v-0.4.9, “ggsurvplot”).37 The two groups for comparison were defined as the top (“High”) and bottom (“Low”) quarter of patients with regard to the expression of HIF1A. The p value of two-group comparison was calculated by log-rank test38. The association between overall survival and hypoxia activity was constructed using the Cox proportional hazards regression model.39 The hazard ratio, 95% CI and p values were calculated by survival R package (v-3.2–13, “coxph”)36. The linerange plots were prepared by ggplot2 (v-3.3.5).40
Statistical analysis
A two-tailed Student t test was performed in GraphPad to compare two independent pairs of groups. A one-way ANOVA was performed when two or more groups were compared. A P ≤0.05 was considered statistically significant.
Data and code availability
The raw scRNA-seq data have been deposited in the Gene Expression Omnibus (GEO, Accession number: GSE186027). The codes of the data analysis in this paper are freely available at https://github.com/jyyulab/Heptoblastoma_Cxcl1. The total RNA-seq data have been deposited in GEO (Accession number: GSE186335).
Detailed methods can be found in the Supplementary Materials.
Supplementary Material
Acknowledgement:
We thank Dr. Stefano Cairo (XenTech) for providing HB214 cell line.
Grant Support:
This work was supported by American Cancer Society Research Scholar Grant RSG-18-026-01 (to L.Z.) and National Institutes of Health GM134382 (to J.Y.).
ABBREVIATIONS
- HB
hepatoblastoma
- HSC
hepatic stellate cells
- aHSC
activated HSCs
- TME
tumor microenvironment
- VLBW
very-low-birth-weight
- sc-RNAseq
single-cell RNA-sequencing
- PDX
patient-derived xenograft
- ZsG
ZsGreen
- GFP
green fluorescent protein
- IHC
Immunohistochemistry
- ISH
in-situ hybridization
- CM
conditioned media
- rhCXCL1
recombinant human CXCL1
- KO
knockout
- GSEA
gene set enrichment analysis
- EMT
epithelial-Mesenchymal Transition
- ALL
acute lymphoblastic leukemia
- RFP
red fluorescent protein
Footnotes
Conflict of interest statement: The authors have declared that no conflict of interest exists.
REFERENCES
- 1.Litten JB, Tomlinson GE. Liver tumors in children. Oncologist 2008;13:812–20. [DOI] [PubMed] [Google Scholar]
- 2.Hubbard AK, Spector LG, Fortuna G, et al. Trends in International Incidence of Pediatric Cancers in Children Under 5 Years of Age: 1988–2012. JNCI Cancer Spectr 2019;3:pkz007. [DOI] [PMC free article] [PubMed] [Google Scholar]
- 3.Meyers RL, Rowland JR, Krailo M, et al. Predictive power of pretreatment prognostic factors in children with hepatoblastoma: a report from the Children’s Oncology Group. Pediatr Blood Cancer 2009;53:1016–22. [DOI] [PMC free article] [PubMed] [Google Scholar]
- 4.McLaughlin CC, Baptiste MS, Schymura MJ, et al. Maternal and infant birth characteristics and hepatoblastoma. Am J Epidemiol 2006;163:818–28. [DOI] [PubMed] [Google Scholar]
- 5.Ikeda H, Hachitanda Y, Tanimura M, et al. Development of unfavorable hepatoblastoma in children of very low birth weight: results of a surgical and pathologic review. Cancer 1998;82:1789–96. [PubMed] [Google Scholar]
- 6.Bissig-Choisat B, Kettlun-Leyton C, Legras XD, et al. Novel patient-derived xenograft and cell line models for therapeutic testing of pediatric liver cancer. J Hepatol 2016;65:325–33. [DOI] [PMC free article] [PubMed] [Google Scholar]
- 7.Nicolle D, Fabre M, Simon-Coma M, et al. Patient-derived xenografts from pediatric liver cancer predict tumor recurrence and advise clinical management. Hepatology 2016. [DOI] [PubMed] [Google Scholar]
- 8.Lopez-Terrada D, Cheung SW, Finegold MJ, et al. Hep G2 is a hepatoblastoma-derived cell line. Hum Pathol 2009;40:1512–5. [DOI] [PubMed] [Google Scholar]
- 9.Woodfield SE, Shi Y, Patel RH, et al. A Novel Cell Line Based Orthotopic Xenograft Mouse Model That Recapitulates Human Hepatoblastoma. Sci Rep 2017;7:17751. [DOI] [PMC free article] [PubMed] [Google Scholar]
- 10.Zhu L, Finkelstein D, Gao C, et al. Multi-organ Mapping of Cancer Risk. Cell 2016;166:1132–1146 e7. [DOI] [PMC free article] [PubMed] [Google Scholar]
- 11.Li L, Qian M, Chen IH, et al. Acquisition of Cholangiocarcinoma Traits during Advanced Hepatocellular Carcinoma Development in Mice. Am J Pathol 2018;188:656–671. [DOI] [PMC free article] [PubMed] [Google Scholar]
- 12.Cairo S, Armengol C, De Reynies A, et al. Hepatic stem-like phenotype and interplay of Wnt/beta-catenin and Myc signaling in aggressive childhood liver cancer. Cancer Cell 2008;14:471–84. [DOI] [PubMed] [Google Scholar]
- 13.Ramachandran P, Dobie R, Wilson-Kanamori JR, et al. Resolving the fibrotic niche of human liver cirrhosis at single-cell level. Nature 2019;575:512–518. [DOI] [PMC free article] [PubMed] [Google Scholar]
- 14.MacParland SA, Liu JC, Ma XZ, et al. Single cell RNA sequencing of human liver reveals distinct intrahepatic macrophage populations. Nat Commun 2018;9:4383. [DOI] [PMC free article] [PubMed] [Google Scholar]
- 15.Scott CL, Zheng F, De Baetselier P, et al. Bone marrow-derived monocytes give rise to self-renewing and fully differentiated Kupffer cells. Nat Commun 2016;7:10321. [DOI] [PMC free article] [PubMed] [Google Scholar]
- 16.Brodt P Role of the Microenvironment in Liver Metastasis: From Pre- to Prometastatic Niches. Clin Cancer Res 2016;22:5971–5982. [DOI] [PubMed] [Google Scholar]
- 17.Yin C, Evason KJ, Asahina K, et al. Hepatic stellate cells in liver development, regeneration, and cancer. J Clin Invest 2013;123:1902–10. [DOI] [PMC free article] [PubMed] [Google Scholar]
- 18.Okabe H, Beppu T, Hayashi H, et al. Hepatic stellate cells accelerate the malignant behavior of cholangiocarcinoma cells. Ann Surg Oncol 2011;18:1175–84. [DOI] [PubMed] [Google Scholar]
- 19.Song Y, Kim SH, Kim KM, et al. Activated hepatic stellate cells play pivotal roles in hepatocellular carcinoma cell chemoresistance and migration in multicellular tumor spheroids. Sci Rep 2016;6:36750. [DOI] [PMC free article] [PubMed] [Google Scholar]
- 20.Carpino G, Morini S, Ginanni Corradini S, et al. Alpha-SMA expression in hepatic stellate cells and quantitative analysis of hepatic fibrosis in cirrhosis and in recurrent chronic hepatitis after liver transplantation. Dig Liver Dis 2005;37:349–56. [DOI] [PubMed] [Google Scholar]
- 21.Niki T, Pekny M, Hellemans K, et al. Class VI intermediate filament protein nestin is induced during activation of rat hepatic stellate cells. Hepatology 1999;29:520–7. [DOI] [PubMed] [Google Scholar]
- 22.Liang Y, Kaneko K, Xin B, et al. Temporal analyses of postnatal liver development and maturation by single-cell transcriptomics. Dev Cell 2022;57:398–414 e5. [DOI] [PMC free article] [PubMed] [Google Scholar]
- 23.Mederacke I, Dapito DH, Affo S, et al. High-yield and high-purity isolation of hepatic stellate cells from normal and fibrotic mouse livers. Nat Protoc 2015;10:305–15. [DOI] [PMC free article] [PubMed] [Google Scholar]
- 24.Weiskirchen S, Tag CG, Sauer-Lehnen S, et al. Isolation and Culture of Primary Murine Hepatic Stellate Cells. Methods Mol Biol 2017;1627:165–191. [DOI] [PubMed] [Google Scholar]
- 25.Gilkes DM, Semenza GL, Wirtz D. Hypoxia and the extracellular matrix: drivers of tumour metastasis. Nat Rev Cancer 2014;14:430–9. [DOI] [PMC free article] [PubMed] [Google Scholar]
- 26.Semenza GL. HIF-1 and mechanisms of hypoxia sensing. Curr Opin Cell Biol 2001;13:167–71. [DOI] [PubMed] [Google Scholar]
- 27.Sumazin P, Chen Y, Trevino LR, et al. Genomic analysis of hepatoblastoma identifies distinct molecular and prognostic subgroups. Hepatology 2017;65:104–121. [DOI] [PubMed] [Google Scholar]
- 28.Paquette K, Coltin H, Boivin A, et al. Cancer risk in children and young adults born preterm: A systematic review and meta-analysis. PLoS One 2019;14:e0210366. [DOI] [PMC free article] [PubMed] [Google Scholar]
- 29.Jobe AH, Bancalari E. Bronchopulmonary dysplasia. Am J Respir Crit Care Med 2001;163:1723–9. [DOI] [PubMed] [Google Scholar]
- 30.Kinsella JP, Greenough A, Abman SH. Bronchopulmonary dysplasia. Lancet 2006;367:1421–31. [DOI] [PubMed] [Google Scholar]
- 31.Wang N, Liu W, Zheng Y, et al. CXCL1 derived from tumor-associated macrophages promotes breast cancer metastasis via activating NF-kappaB/SOX4 signaling. Cell Death Dis 2018;9:880. [DOI] [PMC free article] [PubMed] [Google Scholar]
- 32.Wang D, Sun H, Wei J, et al. CXCL1 Is Critical for Premetastatic Niche Formation and Metastasis in Colorectal Cancer. Cancer Res 2017;77:3655–3665. [DOI] [PMC free article] [PubMed] [Google Scholar]
- 33.Acharyya S, Oskarsson T, Vanharanta S, et al. A CXCL1 paracrine network links cancer chemoresistance and metastasis. Cell 2012;150:165–78. [DOI] [PMC free article] [PubMed] [Google Scholar]
- 34.Rikhi RR, Spady KK, Hoffman RI, et al. Hepatoblastoma: A Need for Cell Lines and Tissue Banks to Develop Targeted Drug Therapies. Front Pediatr 2016;4:22. [DOI] [PMC free article] [PubMed] [Google Scholar]
- 35.Subramanian A, Tamayo P, Mootha VK, et al. Gene set enrichment analysis: a knowledge-based approach for interpreting genome-wide expression profiles. Proc Natl Acad Sci U S A 2005;102:15545–50. [DOI] [PMC free article] [PubMed] [Google Scholar]
- 36.Therneau T A Package for Survival Analysis in R. R package version 3.2–7. 2020, 2021. [Google Scholar]
- 37. score inference by NetBID H. jyyulab/HDAC6-score.
- 38.Bland JM, Altman DG. The logrank test. Bmj 2004;328:1073. [DOI] [PMC free article] [PubMed] [Google Scholar]
- 39.George B, Seals S, Aban I. Survival analysis and regression models. J Nucl Cardiol 2014;21:686–94. [DOI] [PMC free article] [PubMed] [Google Scholar]
- 40.Wickham H ggplot2: elegant graphics for data analysis (use R!). Springer, New York, doi 2009;10:978–0. [Google Scholar]
Associated Data
This section collects any data citations, data availability statements, or supplementary materials included in this article.
Supplementary Materials
Data Availability Statement
The raw scRNA-seq data have been deposited in the Gene Expression Omnibus (GEO, Accession number: GSE186027). The codes of the data analysis in this paper are freely available at https://github.com/jyyulab/Heptoblastoma_Cxcl1. The total RNA-seq data have been deposited in GEO (Accession number: GSE186335).
Detailed methods can be found in the Supplementary Materials.


