

Abstract
Background
Measures of knee stability by symptoms, physical examination, and imaging do not accurately reflect the condition of knee movement. Therefore, this study aimed to introduce a model for assessing knee stability during walking in patients with knee osteoarthritis (OA).
Aims
Three dimensional(3D) gait analysis system was used to quantify the gait of patients and display the clinical diagnosis model of knee instability with nomogram to guide clinical diagnosis and treatment.
Methods
This cross-sectional study performed a 3D gait analysis in 93 participants with knee OA and 40 healthy control subjects. Multiple linear regression analysis investigated the correlation between gait parameters and knee extension/flexion stability. The predicting models were built applied multinomial logistic regression analysis and calibration plot, C-index, decision curve analysis, bootstrapping validation were used to assess the predicting nomograms' clinical usefulness and internal validation.
Results
Multiple linear regression analysis indicated knee extension stability was correlated with walking speed (β = 0.256, P = 0.006), knee extensor strength (β = −0.196, P = 0.03), static HKA (β = 0.218, P = 0.016), width of the femoral diaphysis (β = −0.282, P = 0.002) and WOMAC score (β = 0.281, P = 0.002); however, knee flexion stability was correlated with walking speed (β = 0.340, P < 0.001), knee flexor strength (β = −0.327, P < 0.001), posterior tibial slope (PTS) (β = 0.291, P < 0.001), knee flexion/extension range of motion (ROM) (β = 0.177, P = 0.018) and HSS score (β = −0.173, P = 0.028). We developed and internally validated a knee instability risk nomogram in patients with knee OA.
Conclusions
These results indicated that using the 3D motion analysis system is feasible to quantify knee instability. The current prediction models could serve as a reliable tool to quantify the possibility of knee instability in OA patients.
Trial registration number (TRN)
ChiCTR2100051302; Date of registration: Sep 18, 2021; retrospectively registered.
Keywords: Knee joint, Osteoarthritis, Gait analysis, Joint instability, Nomograms
Introduction
OA, a common joint disorder, is the leading cause of inflammation, pain, and functional disability. The main characteristic of knee OA is degeneration of cartilage gradually and hyperosteogeny. Studies reported that 25% of patients with knee OA develop difficulties performing activities of daily living and 80% have movement limitations [1].
Knee instability associated with activity limitations is prevalent in knee OA, frequently classified as extension instability and flexion instability [2]. Knee instability in patients with knee OA is likely to be a multi-factors problem such as structural damage of the knee, change of lower limb muscular strength [3]. For patients, knee instability is characterized by varus or valgus gait, stiff-legged gait, and the sensation of slippage of the knee when they have functional activities [4]. However, there are still difficulties in diagnosing knee instability due to the lack of clinically meaningful and valid measures. The imaging evaluation of knee instability, such as X-ray and CT, is a static evaluation, which cannot reflect the dynamic kinematic characteristics of knee joint [5].
Gait analysis is the use of biomechanical, kinematic and anatomical principles to quantitatively record the kinematic characteristics of gait, obtain kinematic and kinetic data, and can provide a series of time, angle, mechanics and other parameters and curves, and can objectively and quantitatively assess the human walking function. It can be used as a quantitative indicator to assess the severity and treatment effect of knee OA. [6]. The Vicon 3D motion analysis system is considered to be the most advanced and accurate gait analysis system that can objectively and quantitatively evaluate human motion processes[7]. It is imperative for knee OA patients to utilize 3D motion analysis to reflect different stability levels and daily functioning to evaluate knee stability. In this study, Vicon 3D motion analysis system was used to collect and analyze gait data of knee OA patients and then provide a reference for reliable appraisal of knee stability.
The nomogram, a simple graphical representation, has user-friendly interfaces and can generate the probability of a clinical event. In oncology, nomograms are widely used to assist clinicians in predicting the prognosis of the disease and improvement clinical decision [8]. However, the use of nomograms in the field of knee OA is relatively rare. In this study, we constructed the nomograms to predict the possibility of knee instability.
Methods
Participants
This article is a cross‐sectional analysis of knee OA patients. From February 2021 to September 2021, 93 knee OA patients were recruited in this study. Participants were included when they met all of the following criteria: (1) be diagnosed with knee OA and scheduled for total knee arthroplasty (TKA); (2) agree to participate in our study; (3) can walk 10 m unassisted. Exclusion criteria were: (1) have a history of knee operation; (2) combined with serious hip or ankle disease; (3) the lack of imaging data. In addition, we recruited 40 healthy control subjects, including 20 young adults and 20 old adults. The inclusion criteria were they have no knee pain. The exclusion criteria were: have a history of knee discomfort, lower limb surgery, lower limb pathology, and musculoskeletal disorder. The institutional ethics committee of the First Affiliated Hospital of Sun Yat-Sen University approved the study for clinical research, and each participant provided informed consent.
Assessment of Clinical and Functional Performance
The Hospital for Special Surgery Knee-Rating Score (HSS) and Western Ontario and McMaster Universities Osteoarthritis Index (WOMAC) are reliable measures. They can reflect symptoms and functional limitations of the knee in daily life activities. Participants were clinically evaluated for ROM using the angle scale measuring method. Knee pain was assessed with a visual analog pain scale (VAS). The score of 0 cm represented "no pain" and the score of 10 cm represented "worst pain imaginable". As shown in Fig. 1, we quantified muscle strength using a hand-held dynamometer MICROFET3, an accurate, portable force evaluation system. We then provided objective, quantifiable data from the "hand-on" manual muscle strength tester. [9]. With sitting on the edge of the chair with their knee in 90° flexion, the participants were encouraged verbally to extend or flex their knee to the maximum extent. We measured muscle strength three times, and the highest force was used for further analyses according to the instructions.
Fig. 1.

A dynamometer was fixed to the anterior lower part of the lower leg to measure the knee extensor force. B The dynamometer was fixed to the lower back of the lower leg to measure the knee flexor force. C The result of hand-held dynamometer MICROFET3, unit of measure is lb
Radiographic Assessment
The radiograph was evaluated for hip-knee-ankle angle (HKA) reflecting lower limb alignment, anterior condylar offset (ACO), posterior condylar offset (PCO), PTS, and joint line (JL) height. PCO was measured relative to the tangent of the posterior cortex of the femur, and ACO was measured relative to the tangent of the anterior cortex of the femur. We calculated the PCO ratio (PCOR)/ACO ratio (ACOR) by dividing PCO/ACO by the width of the femoral diaphysis at the level of the condylar flare [10]. PTS was measured using anterior tibial cortex (ATC) reference method. The JL height was defined as the distance from the apex of the fibular head to the joint line in an anteroposterior knee radiograph [11], as shown in Fig. 2.
Fig. 2.

A the solid line is the measured JL height. B the solid line a is ACO, the solid line b is PCO, and the solid line c is the measurement result of the width of the femoral diaphysis. ACOR a/c, PCOR b/c. C Measurement of HKA. D Measurement results of PTS
Gait Analysis
Vicon 3D motion analysis system (Vicon, Oxford, UK) included six cameras and four force plates. As shown in Fig. 3, sixteen retroreflective markers were placed on bony anatomical points of the lower limbs according to the protocol [12, 13]. We measured the height, weight, length of the lower limbs, and the width of knee and ankle. Then as shown in Fig. 4, The subjects were asked to stand on the force plates, and we used software (Vicon Nexus 1.7.1) for static modeling. The kinematic characteristics of knee joint were obtained by dynamic model (Plug-in Gait). The subjects were told to walk in their usual way, and we established dynamic model of the subjects' gait. We used another software (Polygon 3.5.1) to collect six successful gait cycle for 3D gait analysis. Finally, the six experimental gait data were averaged for subsequent analysis[14].
Fig. 3.

The marker model as part of the 3D gait analysis procedure. A Front view, B lateral view, C opposite view
Fig. 4.

Gait analysis with VICON system. A static model, B, C 3D view after dynamic model
Quantization for Knee Stability
Range of dynamic HKA during the stance phase of the gait cycle in the coronal plane represents knee extension stability; Range of dynamic HKA during the swing phase of the gait cycle in the coronal plane represents knee flexion stability [15, 16].
Statistical Analysis
Multiple linear regression analysis assesses the relationships between knee extension/flexion stability and other factors. Statistical analyses above were performed using the Statistical Package for the Social Sciences (SPSS v.26; SPSS Inc. Chicago, IL). In addition, a correlated statistical analysis on the nomograms was performed using the R software (Version 3.6.1; https://www.r-project.org) and RStudio software (https://www.rstudio.com/). When the value conforms to the normal distribution, it is expressed as the mean ± standard deviation; when the value does not conform to the normal distribution, it is expressed as the median (interquartile range). There was significant difference when P value < 0.05.
Results
Evaluation of demographic and disease-related characteristics of participants
Table 1 presents the baseline demographic characteristics of knee OA patients. Table 2 presents disease-related parameters, gait parameters, and self-reported physical function of knee OA patients. Table 3 presents the baseline demographic characteristics of the healthy control subjects. Table 4 presents the gait parameters of the healthy control subjects.
Table 1.
Demographic characteristics of the knee OA patients (N = 93) (mean ± standard deviation)
| Variables | Values |
|---|---|
| Age (years) | 68.97 ± 7.96 |
| Sex, males/females | 22/71 |
| Height (m) | 1.58 ± 0.07 |
| Weight (kg) | 65.15 ± 10.61 |
| BMI (kg/m2) | 25.89 ± 3.37 |
Table 2.
Disease-related parameters, gait parameters, and self-reported physical function of the knee OA patients (N = 93)
| Variables | Values |
|---|---|
| Disease-related parameters | |
| Static HKA (°) | 8.60 (8.95) |
| Width of the femoral diaphysis (cm) | 2.84 ± 0.41 |
| Knee extensor strength (lb) | 33.98 ± 4.68 |
| Knee flexor strength (lb) | 29.38 ± 5.42 |
| PTS (°) | 10.62 ± 4.18 |
| ROM (°) | 112.00 (24) |
| Gait parameters | |
| Cadence (steps/min) | 87.87 (27.60) |
| Stride time (s) | 1.37 (0.45) |
| Step time (s) | 0.69 (0.22) |
| Double support (s) | 0.37 (0.17) |
| Single support (s) | 0.47 (0.10) |
| Stride length (m) | 0.70 ± 0.20 |
| Step length (m) | 0.34 ± 0.11 |
| Walking speed (m/s) | 0.54 (0.36) |
| Self-reported physical function | |
| VAS score | 5.0 (2.3) |
| WOMAC score | 52.23 ± 13.81 |
| HSS score | 64.99 ± 9.36 |
Table 3.
Demographic characteristics of the healthy control subjects (N = 40)
| Variables | Values |
|---|---|
| Sex, males/females | 18/22 |
| Height (m) | 1.65 ± 0.07 |
| Weight (kg) | 60.00 (16.75) |
| BMI (kg/m2) | 23.06 ± 3.53 |
Table 4.
Gait parameters of healthy control subjects (N = 40)
| Variables | Values |
|---|---|
| Gait parameters | |
| Cadence (steps/min) | 105.23 (19.72) |
| Stride time (s) | 1.15 (0.23) |
| Step time (s) | 0.57 (0.11) |
| Double support (s) | 0.25 (0.09) |
| Single support (s) | 0.45 (0.08) |
| Stride length (m) | 1.01 ± 0.17 |
| Step length (m) | 0.50 ± 0.10 |
| Walking speed (m/s) | 0.88 ± 0.22 |
The Cut-off Values of Knee Extension and Flexion Instability
Forty healthy control subjects, including 20 young adults and 20 old adults, were performed gait analysis. There are no significant differences in extension and flexion stability between young adults and old adults. Therefore, all these 40 healthy control subjects were used to determine extension and flexion instability cut-off values. We defined the cut-off values according to the upper end of 95% confidence interval for typical values. The cut-off value of knee extension instability is 6.84; The cut-off value of knee flexion instability is 11.99 (Table 5). Thus, extensional instability is defined as a knee with stability greater than 6.84, and flexion instability is defined as a knee with stability greater than 11.99.
Table 5.
Knee extension/flexion stability between groups
| Old adult group, n = 20 | Young adult group, n = 20 | Difference between groups, P value | |
|---|---|---|---|
| Knee extension stability | 3.97 ± 1.58 | 4.07 ± 1.89 | 0.34 |
| Knee flexion stability | 7.02 ± 3.05 | 7.92 ± 2.43 | 0.32 |
Multiple Linear Regression Analysis of Knee Extension and Flexion Stability
Regression model was performed with 31 variables at knee extension stability. The linear regression analysis showed that walking speed (β = 0.256, P = 0.006) , knee extensor strength (β = − 0.196, P = 0.03), static HKA (β = 0.218, P = 0.016), width of the femoral diaphysis (β = −0.282, P = 0.002) and WOMAC score (β = 0.281, P = 0.002) were factors correlated with the extension stability (R2 = 0.31), as shown in Table 6.
Table 6.
Factors correlated with knee extension stability by multiple linear regression analysis
| Outcome/Independent predictor |
Standardized β | P value | Adjusted R2 |
|---|---|---|---|
| Knee extension stability | |||
| Walking speed | 0.26 | 0.006 | 0.31 |
| Knee extensor strength | − 0.20 | 0.030 | |
| Static HKA | 0.22 | 0.016 | |
| Width of the femoral diaphysis | − 0.28 | 0.002 | |
| WOMAC score | 0.28 | 0.002 | |
Regression model was performed with abovementioned 31 variables at knee flexion stability. The linear regression analysis showed that walking speed (β = 0.340, P < 0.001), knee flexor strength (β = −0.327, P < 0.001), PTS (β = 0.291, P < 0.001), ROM (β = 0.177, P = 0.018) and HSS score (β = −0.173, P = 0.028) were factors correlated with the flexion stability (R2 = 0.55), as shown in Table 7.
Table 7.
Factors correlated with knee flexion stability by multiple linear regression analysis
| Outcome/Independent predictor | Standardized β | P value | Adjusted R2 |
|---|---|---|---|
| Knee flexion stability | |||
| Walking speed | 0.34 | < 0.001 | 0.55 |
| Knee flexor strength | − 0.33 | < 0.001 | |
| PTS | 0.29 | < 0.001 | |
| ROM | 0.18 | 0.018 | |
| HSS score | − 0.17 | 0.028 | |
Development of a Knee Extension Instability Prediction Model
Of self-reported physical function and disease-related characteristics, 31 factors were decreased to 5 potential predictors based on 93 patients using the LASSO binary logistic regression model combined with expert opinions (Fig. 5). These factors included walking speed, knee extensor strength, static HKA, the width of the femoral diaphysis, and WOMAC score.
Fig. 5.
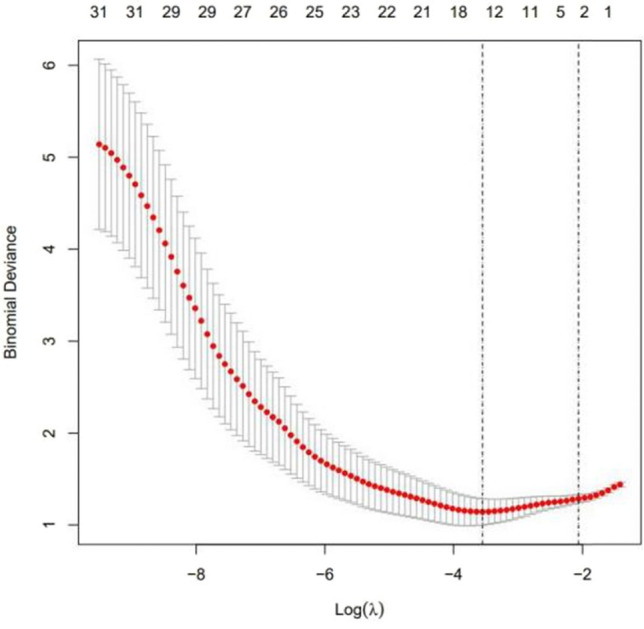
Selection of disease-related characteristics using the LASSO binary logistic regression model
We developed the model that incorporated the five independent predictors mentioned above and presented it as the nomogram (Fig. 6).
Fig. 6.

Developed the knee extension instability nomogram
The calibration curve of the extension instability nomogram for the prediction of extension instability in knee OA patients demonstrated good agreement in this cohort (Fig. 7). The C index of the nomogram was 0.809 (Fig. 8), and it was confirmed to be 0.772 through bootstrapping validation, which indicated good discrimination of the model.
Fig. 7.
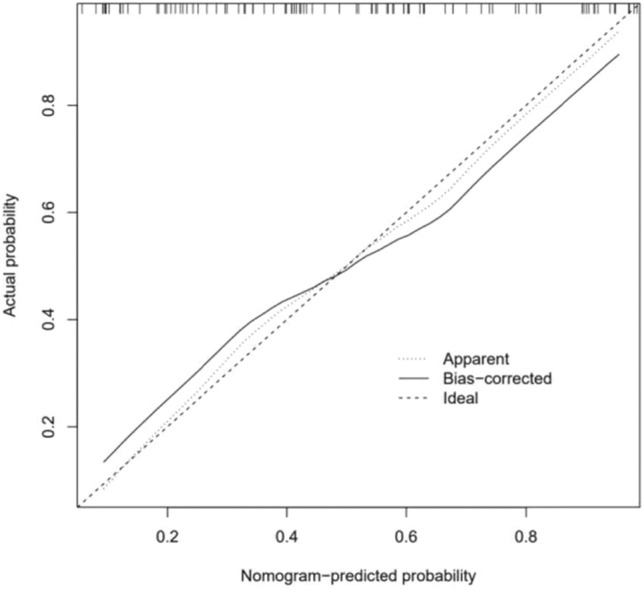
Calibration curves of the knee extension instability nomogram prediction in the cohort
Fig. 8.

In the ROC curve, the C index of the nomogram was 0.809
The decision curve analysis for the extension instability nomogram is presented in Fig. 9. The decision curve showed that if the threshold probability is >10%, using this nomogram to predict knee extension instability adds more benefit.
Fig. 9.
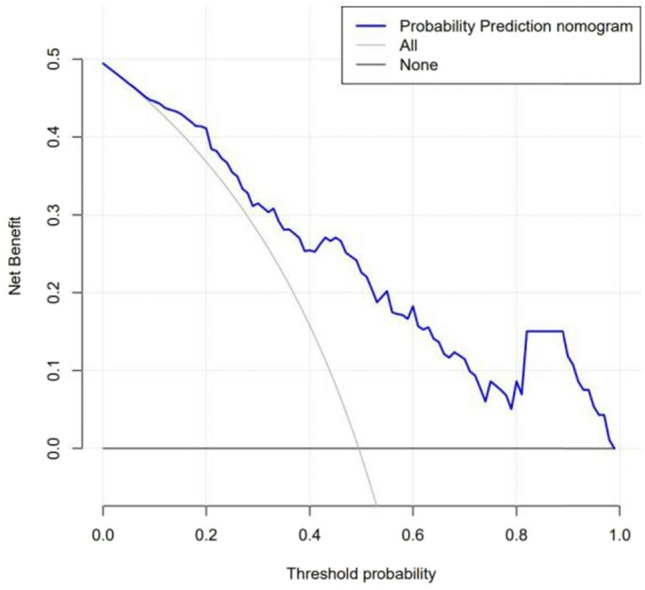
Decision curve analysis for the knee extension instability nomogram
Development of a Knee Flexion Instability Prediction Model
Of demographic, self-reported physical function, and disease-related characteristics, 31 factors were decreased to 5 potential predictors based on 93 patients using the LASSO binary logistic regression model combined with expert opinions (Fig. 10). These factors included walking speed, knee flexor strength, PTS, ROM, and HSS score.
Fig. 10.
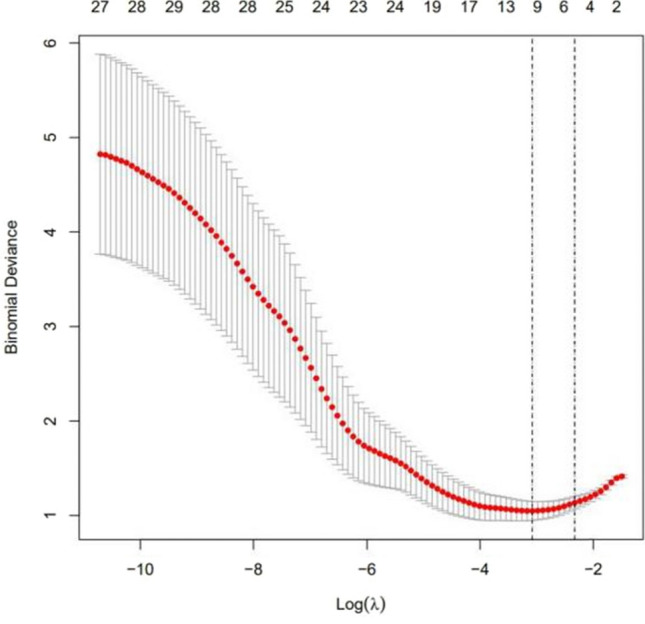
Selection of disease-related characteristics using the LASSO binary logistic regression model
We developed the model that incorporated the five independent predictors mentioned above and presented it as the nomogram (Fig. 11).
Fig. 11.

Developed the knee flexion instability nomogram
The calibration curve of the flexion instability nomogram for the prediction of flexion instability in knee OA patients demonstrated good agreement in this cohort (Fig. 12). The C index of the nomogram was 0.856 (Fig. 13), and it was confirmed to be 0.824 through bootstrapping validation, which indicated good discrimination of the model.
Fig. 12.
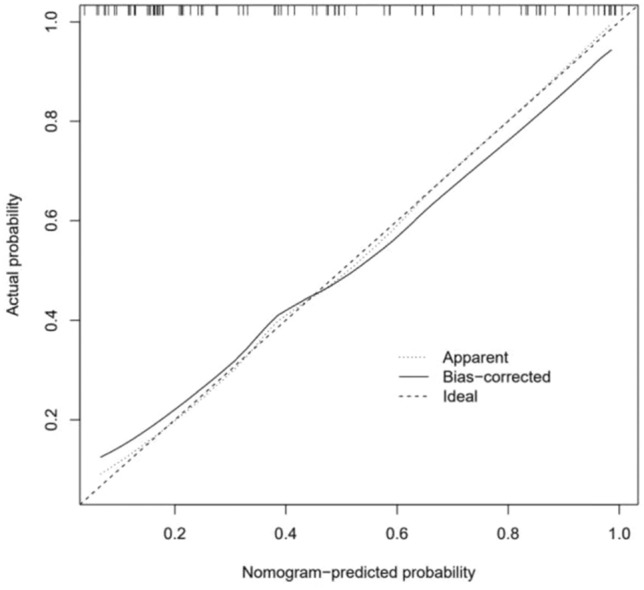
Calibration curves of the knee flexion instability nomogram prediction in the cohort
Fig. 13.
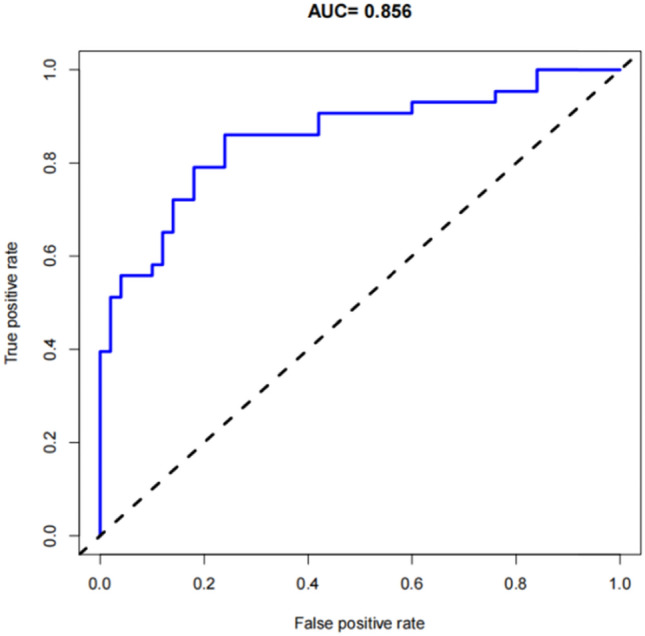
In the ROC curve, the C index of the nomogram was 0.856
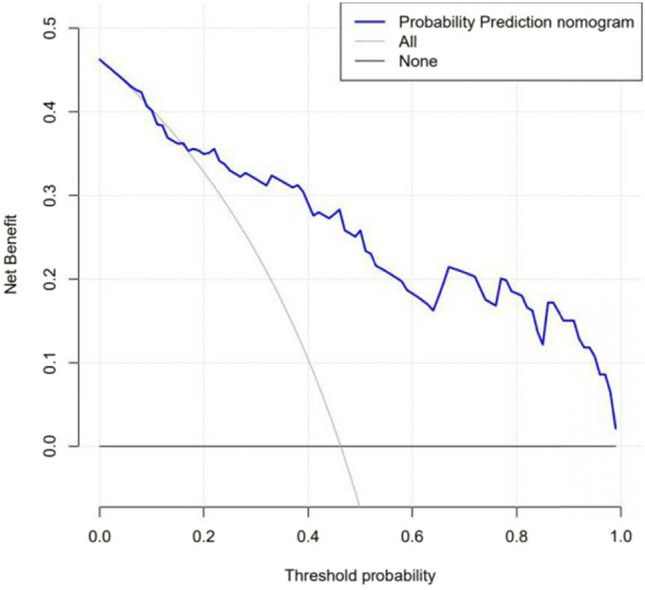
The decision curve analysis for the flexion instability nomogram is presented in Fig. 14. The decision curve showed that if the threshold probability is >20%, using this nomogram to predict knee flexion instability adds more benefit.
Fig. 14.
Decision curve analysis for the knee flexion instability nomogram
Discussion
Lower limb alignment has played a critical role in the assessment of knee stability for a long time. Neutral alignment on static full-length radiographs is essential for obtaining balanced medial and lateral loading distributions and producing optimal function [17]. However, static alignment cannot satisfactorily reflect dynamic alignment and adduction moment that is highly associated with medial compartment knee joint load indirectly [15]. Previous research suggested that knee stability exerts an essential role in the progression and development of knee OA [18]. However, some studies have demonstrated that relying only on static alignment and self-reporting to evaluate knee stability may be incomplete. Farrokhi S et al. revealed that there is no adequate objective measure of knee stability in knee OA patients [19]. Therefore, as the adjunct of static standing alignment, gait analysis has been used to quantitatively study and assess knee OA [20].
Nowadays, in OA patients, the diagnosis of knee instability mainly depends on symptoms, physical examination, and imaging examination. Instability should be considered when patients have symptoms such as stiff gait, knee hyperextension during standing, varus or valgus-driven gait, and rotating forward foot angle during walking [5]. Anteroposterior and varus-valgus stability is assessed with the knee in full extension, 30°, and 90° of flexion by the anterior and a posterior draw test and Bohler sign [21]. Radiographs such as the image of total lower limbs are also used to assess knee stability. Nevertheless, all the methods mentioned above are not generally accepted subjective or objective metrics and fail to evaluate knee stability as valid and clinically meaningful. It has been reported that gait analysis could assess dynamic knee stability [22]. For instance, Zeni JA et al. suppose the patients overcome knee instability by increasing apparent knee stiffness. Then they calculate apparent stiffness of knee joint by combining knee extensor moment and knee flexion and extension angle [23]. Therefore, gait analysis may be an appropriate tool to quantify knee instability in Knee OA patients.
Similarly, our results suggest gait analysis can help clinicians assess knee OA patients who are unstable potentially. In addition, multivariate linear regression analysis showed that extension stability was associated with walking speed, knee extensor strength, static HKA, width of the femoral diaphysis and WOMAC score, whereas flexion stability was associated with walking speed, knee flexor strength, PTS, ROM and HSS score. These findings suggested that flexion stability was not explained by static alignment and extension stability was partly explained by static alignment, which indicated the assessment of static alignment has its limitations indeed [15]. HSS score partly explained flexion stability, and extension stability was partly explained by WOMAC score, suggesting that self-report was a good predictor of knee instability. Khalaj N et al. found that impaired hip and knee strength are associated with chronic ankle instability [24]. In this study, knee muscle strength was correlated with extension stability and flexion stability. Similar to previous reports, our results indicated that muscle strength provides stability during walking, and strengthening exercise to improve muscle strength is essential for knee OA patients to enhance the muscle force around the knee joint and maintain the stability of the knee joint.
Recently, as prognostic devices, nomograms have been widely used in medicine. Nomograms have user-friendly digital interfaces and better help clinical decision-making [8]. This study developed a novel prediction model for knee extension stability and flexion stability using five readily available variables, respectively. To our knowledge, this is the first study that the nomograms were used to evaluate knee stability of knee OA. Excellent discrimination and calibration power were shown in Internal validation; a high C-index in interval validation indicated that the nomogram could be applied in a large sample size accurately and widely [25]. Five potential predictors based on the LASSO regression model and multivariate linear regression analysis were chosen for establishing the prediction model [26]. This prediction tool can aid clinicians in early identifying knee OA patients at high risk of knee instability. Thus, accurate evaluation can/assist physicians with taking interventions in time and avoiding adverse events such as falls. For knee OA patients scheduled for TKA, accurate evaluation of knee stability may avoid the occurrence of knee instability after TKA. The ultimate objective is to diagnose knee instability as early as possible through nomograms. When knee instability occurs after TKA, early diagnosis can help the surgeon intervene early to avoid reduced prosthetic life, postoperative complications and patient dissatisfaction.
The nomograms developed in this study for the diagnosis of knee instability was validated internally using the bootstrap method and can therefore be used independently. Among the predictors of knee instability nomograms, walking speed in meters per second and muscle strength in pounds are available for subjects with simple devices such as timers and simpler muscle strength testers, although they are difficult to obtain with accurate gait analysis systems for external populations. The rest of the predictors can be obtained accurately by radiography. Thus, the model we have developed is worthy of generalization to a wider population, which of course requires further external validation.
Depending on the factors affecting the patient's knee instability, the surgeon can be more purposeful during the operation. For example, when a patient has preoperative knee extension instability, the surgeon should pay attention to maintaining the width of the distal femoral and correcting abnormal alignment of the lower limbs during surgery to enhance postoperative knee stability. When preoperative knee flexion instability exists in patients, surgeons should avoid excessive PTS in surgical osteotomy to avoid exacerbating postoperative knee flexion instability. And the rehabilitation physician can target to enhance the stability of the patient's knee after TKA, such as improving muscle strength and knee flexion and extension ROM through rehabilitation training.
There are also some limitations to our current study. First, most patients we recruited came from Guangdong Province, which may not represent all Chinese knee OA patients well. Second, predictors did not include all potential impact factors that affected the knee's stability, such as the general or local neuromuscular disorders and other conditions. Third, although we examined the validity of the nomograms extensively with internal validation using bootstrap testing, external validation was not conducted, and the generalizability is still uncertain for other knee OA populations in other countries. Externally evaluated in broader knee OA populations were needed. Fourth, a complete 3D gait analysis is expensive, and the diagnostic model is worth further optimization.
These results indicated that the use of the 3D motion analysis system is feasible to quantify knee instability. The current prediction models could serve as a reliable tool to quantify the possibility of knee instability in OA patients.
Acknowledgements
We would like to thank Dr He Suiwen for his valuable clinical experience and guidance in total knee arthroplasty surgery; Dr Yu Baoxi for his patient guidance and advice on research direction and thesis writing; and Drs Zhu Weiwen, Yang Zhijian and Liu Hailong for providing us with valuable guidance and experience. Finally, we would like to thank the First Hospital of Sun Yat-sen University for providing us with a valuable research platform, rich resources and a good environment.
Abbreviations
- OA
Osteoarthritis
- 3D
Three-dimensional
- TKA
Total knee arthroplasty
- HSS
The hospital for special surgery knee-rating score
- WOMAC
Western Ontario and mcmaster universities osteoarthritis index
- ROM
Range of motion
- VAS
Visual analog pain scale
- HKA
Hip-knee-ankle angle
- ACO
Anterior condylar offset
- PCO
Posterior condylar offset
- PTS
Posterior tibial slope
- PCOR
Posterior condylar offset ratio
- ACOR
Anterior condylar offset ratio
- ATC
Anterior tibial cortex
Author contributions
CG proposed a Nomogram research idea for analyzing knee instability in patients with knee osteoarthritis using three-dimensional gait analysis, and designed the research plan, planned the experiment implementation process, collected and sorted data, and performed statistical analysis and processing on the data and explained it. Data to complete the writing of the paper. Y-RM is responsible for the operation of the gait analyzer, the data acquisition, and the technical and material support for the gait analysis. Participate in the planning of the experiment implementation process, assist in the acquisition of data and the interpretation and analysis of the data. MF participated in proposing research topics, providing financial support, providing clinical guidance and support for the diagnosis and evaluation of patients with knee osteoarthritis, revising the paper, and finalizing the paper. H-YD is responsible for collecting and organizing data, statistical analysis, and establishing diagnostic models. YC is responsible for collecting and sorting data, implementing the research process, researching and sorting documents. All authors read and approved the final manuscript.
Funding
This study was supported by two research grants from the National Nature Science Foundation of China (81974343) and Nature Science Foundation of Guangdong province (2020A1515010394).
Declarations
Conflict Of Interest Statement
Authors have no conflict of interest to declare.
Ethics Approval and Consent to Participate
All procedures performed in studies involving human participants were in accordance with the ethical standards of the institutional and/or national research committee and with the 1964 Helsinki Declaration and its later amendments or comparable ethical standards. The study was approved by the IEC for Clinical Research and Animal Trials of the First Affiliated Hospital of Sun Yat-sen University .Committee’s reference number: [2021] 571.
Consent to Participate and Publish
Informed consent was obtained from all individual participants included in the study and the participant has consented to the submission of the case report to the journal.
Footnotes
Publisher's Note
Springer Nature remains neutral with regard to jurisdictional claims in published maps and institutional affiliations.
Contributor Information
Cheng Gu, Email: guch8@mail2.sysu.edu.cn.
Yurong Mao, Email: maoyr@mail.sysu.edu.cn.
Haiyan Dong, Email: donghy23@mail2.sysu.edu.cn.
Yu Cui, Email: cuiyu@link.cuhk.edu.hk.
Ming Fu, Email: fuming@mail.sysu.edu.cn.
References
- 1.Brooks PM. Impact of osteoarthritis on individuals and society: How much disability? Social consequences and health economic implications. Current Opinion in Rheumatology. 2002;14(5):573–577. doi: 10.1097/00002281-200209000-00017. [DOI] [PubMed] [Google Scholar]
- 2.Shakoor N, Felson DT, Niu J, Nguyen US, Segal NA, Singh JA, Nevitt MC. The association of vibratory perception and muscle strength with the incidence and worsening of knee instability: The multicenter osteoarthritis study. Arthritis & Rheumatology (Hoboken, NJ) 2017;69(1):94–102. doi: 10.1002/art.39821. [DOI] [PMC free article] [PubMed] [Google Scholar]
- 3.Fitzgerald GK, Piva SR, Irrgang JJ. Reports of joint instability in knee osteoarthritis: Its prevalence and relationship to physical function. Arthritis and Rheumatism. 2004;51(6):941–946. doi: 10.1002/art.20825. [DOI] [PubMed] [Google Scholar]
- 4.Chang MJ, Lim H, Lee NR, Moon YW. Diagnosis, causes and treatments of instability following total knee arthroplasty. Knee Surgery & Related Research. 2014;26(2):61–67. doi: 10.5792/ksrr.2014.26.2.61. [DOI] [PMC free article] [PubMed] [Google Scholar]
- 5.Gonzalez MH, Mekhail AO. The failed total knee arthroplasty: Evaluation and etiology. The Journal of the American Academy of Orthopaedic Surgeons. 2004;12(6):436–446. doi: 10.5435/00124635-200411000-00008. [DOI] [PubMed] [Google Scholar]
- 6.Li Y, Fan T, Qi Q, Wang J, Qiu H, Zhang L, Wu X, Ye J, Chen G, Long J, et al. Efficacy of a novel exoskeletal robot for locomotor rehabilitation in stroke patients: A multi-center, non-inferiority, randomized controlled trial. Frontiers in aging neuroscience. 2021;13:706569. doi: 10.3389/fnagi.2021.706569. [DOI] [PMC free article] [PubMed] [Google Scholar]
- 7.Fritz JM, Canseco K, Konop KA, Kruger KM, Tarima S, Long JT, Law BC, Kraus JC, King DM, Harris GF. Multi-segment foot kinematics during gait following ankle arthroplasty. Journal of orthopaedic research. 2022;40(3):685–694. doi: 10.1002/jor.25062. [DOI] [PubMed] [Google Scholar]
- 8.Sun Y, Deng C, Zhang Z, Ma X, Zhou F, Liu X. Novel nomogram for predicting the progression of osteoarthritis based on 3D-MRI bone shape: Data from the FNIH OA biomarkers consortium. BMC musculoskeletal disorders. 2021;22(1):782. doi: 10.1186/s12891-021-04620-y. [DOI] [PMC free article] [PubMed] [Google Scholar]
- 9.Sentanin AC, de Facio CA, da Silva MMC, Sousa FC, Arcuri JF, Mendes RG, Di Lorenzo VAP: Reliability of quadriceps femoris muscle strength assessment using a portable dynamometer and protocol tolerance in patients with chronic obstructive pulmonary disease. Physical therapy 2021, 101(9). [DOI] [PubMed]
- 10.Clement ND, MacDonald DJ, Hamilton DF, Burnett R. Posterior condylar offset is an independent predictor of functional outcome after revision total knee arthroplasty. Bone & Joint Research. 2017;6(3):172–178. doi: 10.1302/2046-3758.63.BJR-2015-0021.R1. [DOI] [PMC free article] [PubMed] [Google Scholar]
- 11.Han HS, Yu CH, Shin N, Won S, Lee MC. Femoral joint line restoration is a major determinant of postoperative range of motion in revision total knee arthroplasty. Knee Surgery, Sports Traumatology, Arthroscopy. 2019;27(7):2090–2095. doi: 10.1007/s00167-019-05361-1. [DOI] [PubMed] [Google Scholar]
- 12.Sun M, Zhang Y, Peng Y, Fu D, Fan H, He R. Gait analysis after total knee arthroplasty assisted by 3D-printed personalized guide. BioMed Research International. 2020;2020:6485178. doi: 10.1155/2020/6485178. [DOI] [PMC free article] [PubMed] [Google Scholar]
- 13.Mao Y, Chen P, Li L, Li L, Huang D. Changes of pelvis control with subacute stroke: A comparison of body-weight- support treadmill training coupled virtual reality system and over-ground training. Technology and Health Care. 2015;23(Suppl 2):S355–364. doi: 10.3233/THC-150972. [DOI] [PubMed] [Google Scholar]
- 14.Gu C, Mao Y, Dong H, Cui Y, Fu M: Is Static Alignment a Good Predictor of Dynamic Alignment after Total Knee Arthroplasty? Healthcare (Basel, Switzerland) 2022, 10(3). [DOI] [PMC free article] [PubMed]
- 15.Larose G, Fuentes A, Lavoie F, Aissaoui R, de Guise J, Hagemeister N. Can total knee arthroplasty restore the correlation between radiographic mechanical axis angle and dynamic coronal plane alignment during gait? The Knee. 2019;26(3):586–594. doi: 10.1016/j.knee.2019.02.012. [DOI] [PubMed] [Google Scholar]
- 16.Rivière C, Ollivier M, Girerd D, Argenson JN, Parratte S. Does standing limb alignment after total knee arthroplasty predict dynamic alignment and knee loading during gait? The Knee. 2017;24(3):627–633. doi: 10.1016/j.knee.2017.03.001. [DOI] [PubMed] [Google Scholar]
- 17.Talmo CT, Cooper AJ, Wuerz T, Lang JE, Bono JV. Tibial component alignment after total knee arthroplasty with intramedullary instrumentation: A prospective analysis. The Journal of arthroplasty. 2010;25(8):1209–1215. doi: 10.1016/j.arth.2009.08.014. [DOI] [PubMed] [Google Scholar]
- 18.Cudejko T, van der Esch M, van den Noort JC, Rijnhart JJM, van der Leeden M, Roorda LD, Lems W, Waddington G, Harlaar J, Dekker J. Decreased pain and improved dynamic knee instability mediate the beneficial effect of wearing a soft knee brace on activity limitations in patients with knee osteoarthritis. Arthritis Care & Research. 2019;71(8):1036–1043. doi: 10.1002/acr.23722. [DOI] [PMC free article] [PubMed] [Google Scholar]
- 19.Farrokhi S, Voycheck CA, Klatt BA, Gustafson JA, Tashman S, Fitzgerald GK. Altered tibiofemoral joint contact mechanics and kinematics in patients with knee osteoarthritis and episodic complaints of joint instability. Clinical Biomechanics (Bristol, Avon) 2014;29(6):629–635. doi: 10.1016/j.clinbiomech.2014.04.014. [DOI] [PMC free article] [PubMed] [Google Scholar]
- 20.Leporace G, Gonzalez F, Metsavaht L, Motta M, Carpes FP, Chahla J, Luzo M. Are there different gait profiles in patients with advanced knee osteoarthritis? A machine learning approach. Clinical Biomechanics (Bristol, Avon) 2021;88:105447. doi: 10.1016/j.clinbiomech.2021.105447. [DOI] [PubMed] [Google Scholar]
- 21.Abdel MP, Haas SB: The unstable knee: wobble and buckle. The bone & joint journal 2014, 96-b(11 Supple A):112–114. [DOI] [PubMed]
- 22.Chang AH, Chmiel JS, Moisio KC, Almagor O, Zhang Y, Cahue S, Sharma L. Varus thrust and knee frontal plane dynamic motion in persons with knee osteoarthritis. Osteoarthritis and Cartilage. 2013;21(11):1668–1673. doi: 10.1016/j.joca.2013.08.007. [DOI] [PMC free article] [PubMed] [Google Scholar]
- 23.Zeni JA, Jr, Higginson JS. Dynamic knee joint stiffness in subjects with a progressive increase in severity of knee osteoarthritis. Clinical Biomechanics (Bristol, Avon) 2009;24(4):366–371. doi: 10.1016/j.clinbiomech.2009.01.005. [DOI] [PMC free article] [PubMed] [Google Scholar]
- 24.Khalaj N, Vicenzino B, Heales LJ, Smith MD. Is chronic ankle instability associated with impaired muscle strength? Ankle, knee and hip muscle strength in individuals with chronic ankle instability: A systematic review with meta-analysis. British Journal of Sports Medicine. 2020;54(14):839–847. doi: 10.1136/bjsports-2018-100070. [DOI] [PubMed] [Google Scholar]
- 25.Wu L, Chang W, Song Y, Wang L. Predicting treatment failure risk in a Chinese Drug-Resistant Tuberculosis with surgical therapy: Development and assessment of a new predictive nomogram. International Journal of Infectious Diseases. 2020;96:88–93. doi: 10.1016/j.ijid.2020.03.035. [DOI] [PubMed] [Google Scholar]
- 26.Xie QY, Wang MW, Hu ZY, Cao CJ, Wang C, Kang JY, Fu XY, Zhang XW, Chu YM, Feng ZH, et al. Screening the influence of biomarkers for metabolic syndrome in occupational population based on the lasso algorithm. Frontiers in public health. 2021;9:743731. doi: 10.3389/fpubh.2021.743731. [DOI] [PMC free article] [PubMed] [Google Scholar]