Abstract
Background
Studies of clinical outcomes that compare the Medial Pivot design (MP) with the Posterior-Stabilized design (PS) were controversial. The meta-analysis was performed to summarize existing evidence, aiming to determine whether MP was superior to PS prosthesis.
Methods
Search strategies followed the recommendations of the Cochrane collaboration. Electronic searches such as PubMed, Embase, Web of Science, and Cochrane were systematically searched for publications concerning medical pivot and posterior stabilized prosthesis from the inception date to April 2021. Authors also manually checked and retrieved a reference list of included publications for potential studies, which the electronic searches had not found. Two investigators independently searched, screened, and reviewed the full text of the article. Disagreements generated throughout the process were resolved by consensus, and if divergences remain, they were arbitrated by a third author. Subsequently, patients were divided into the MP and PS groups.
Results
This study included 18 articles, comprising a total of 2614 patients with a similar baseline. The results showed the PS group had a higher risk of the patellar clunk or crepitus. However, the theoretical advantages of MP prosthesis could not translate to the difference in knee function, clinical complications, revision rate and satisfaction. Similarly, the shape and mechanism of prostheses could not affect the implant position and postoperative alignment.
Conclusions
The MP prosthesis can reduce the patellar clunk or crepitus rate. However, choices between the MP and PS prosthesis would not affect knee function, clinical complications, revision rate, patient satisfaction, implant position, and postoperative alignment.
Keywords: Medial pivot prosthesis, Posterior-stabilized prosthesis, Primary total knee arthroplasty, Meta-analysis
Introduction
Total knee arthroplasty (TKA) has been the gold standard for end-stage knee osteoarthritis. Due to its high survival rate and effective outcome for restoring knee function, the frequency and spectrum of utilization have increased [1, 2]. Despite this, 10–15% of patients remain dissatisfied [3]. One possible justification for the dissatisfaction is that the design of the prosthesis has abnormal knee kinematics.
The conventional prosthetic knee design is the posterior-stabilized prosthesis, first developed in 1978[4]. The PS prosthesis relies on the cam-and-post mechanism to provide anterior–posterior stability and improve the range of motion of the knee joint, whatis more, it could improve stair-climbing ability through the prevention of posterior tibial subluxation [5–7] (Fig. 1). Simultaneously, it has the ascendancy of a more direct incision exposure and a more straightforward soft-tissue balance. However, its design could reduce posterior femoral rollback and increase anterior sliding of femoral component on tibia during deep knee flexion, so 60% of PS protheses could present the phenomenon so-called “paradoxical anterior movement”, which would cause the femoral component to impact the patella, produce some patellofemoral joint complications and obligatory bone loss [8–10].
Fig. 1.
Posterior-Stabilized Prosthesis relies on the cam-and-post mechanism which could provide anterior–posterior stability and improve the range of motion of the knee joint
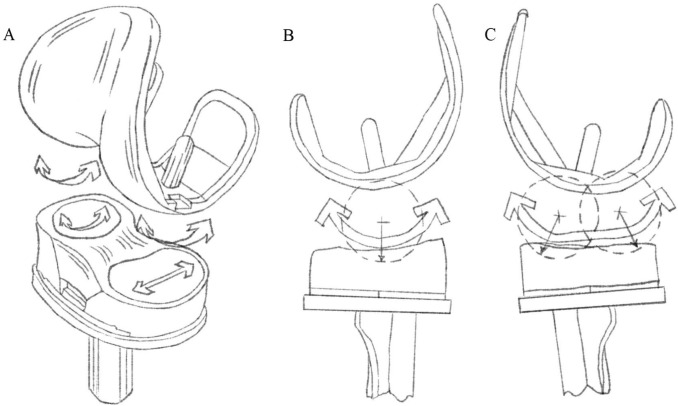
Kinematic studies showed that the medial compartment of the knee functioned like a ball-and-socket joint, with the lateral femoral condyle translating in an anteroposterior direction and rotating around the medial compartment in flexion [11]. To mimic the natural knee kinematics and improve the rate of satisfaction, the medial pivot (MP) prosthesis, which adopts the concept of the “ball-and-socket”, was developed. The MP prosthesis has a highly congruent medial compartment to guarantee stability and has a less conforming lateral compartment to allow relative freedom of the lateral femoral condyle [12, 13] (Fig. 2). At the same time, it has restored the depth of the trochlear groove to maintain the natural patella track in early knee flexion [14]. Thus, the MP design could theoretically avoid paradoxical anterior movement and improve the experience and satisfaction rate of patients.
Fig. 2.
Medial pivot prothesis, A the design of femur, tibia and insert prothesis B the medial compartment has highly congruent ball and socket; C the lateral compartment design allows sliding of the femur relative to the tibia during flexion and extension
Although the MP design is known to have theoretical advantages in many aspects, studies of clinical outcomes that compare the MP with the PS design are controversial. Thus, we undertook a meta-analysis to determine whether MP was superior to PS prosthesis in terms of ROM, PROMs, complications, revision rate and radiographic outcomes.
Methods
Search Strategy
The ethical statement is not needed because this study is based on a meta-analysis and systematic review of published studies. Search strategies followed the recommendations of the Cochrane collaboration. Electronic searches such as PubMed, Embase, Web of Science, Cochrane were systematically searched for publications concerning medical pivot and posterior stabilized prosthesis from the inception date to April 2021. Search terms “medial pivot” and “posterior stabilized” and “total knee arthroplasty” are included during the search. Authors also manually checked and retrieved a reference list of included publications for potential studies which had not been found by the electronic searches. Two investigators (ZHX and SYT) independently searched, screened, and reviewed the full text of the article. Disagreements generated throughout the process were resolved by consensus, and if divergences remain, they were arbitrated by a third author (HW).
Inclusion and Exclusion Criteria
The inclusion criteria were as follows: (1) Randomized controlled trials or cohort studies comparing medial pivot and posterior-stabilized Prostheses in primary total knee arthroplasty; (2) studies reporting at least one of the main outcomes, such as ROM, KSS, OKS, WOMAC, Kujala Score, FJS, revision rate,radiographic outcomes and complications(patellar clunk or crepitus, anterior knee pain, deep infection, instability, stiffness or other related complications); and (3) only English articles were included.
Exclusion criteria were as follows: any prostheses besides medial pivot and posterior stabilized prostheses; duplicated or overlapping data; review articles and scientific conference abstracts; cadaver or model studies; unreported data.
Data Extraction and Quality Assessment
Data extraction and quality assessment were conducted by two researchers independently using a standardized data collection sheet. Disagreements generated throughout the process were resolved through discussion with team members, and if differences remained, they were arbitrated by a third author (HW). The extracted contents included authors, nationality, publication date, study type, male–female ratio, participant age, follow-up time, sample size, brand of prothesis, outcome indicators, and assessment of bias.
Risk of Bias Assessment in Included Studies
The Cochrane handbook was used as the quality evaluation standard for randomized controlled trials. The Newcastle–Ottawa scale (NOS) was used to assess non-randomized controlled trial studies. A quality score ≥ 7 on the nine-point of the NOS was considered of relatively high quality for cohort studies.
Data Synthesis
The RevMan 5.3 software provided by Cochrane collaboration network was used for meta-analysis. Counted data used OR (odds ratio, OR) value and its 95% CI (confidence interval, CI) for data analysis, and measurement data used MD (mean difference, MD) and its 95% CI for statistical analysis. Heterogeneity between the results of the included studies was analyzed using the χ2 test (inspection level is α = 0.1), I2 was used to evaluate the heterogeneity quantitatively, and the inspection standard was set to 50%. When I2 < 50%, no significant heterogeneity was considered to exist in two sets of data, and the fixed effect model (Fixed effect model, FEM) was used for quantitative combined analysis; when I2 > 50%, it is considered that there is significant heterogeneity between the two sets of data, and the random effect model (random effect model, REM) was used for combined analysis. Publication bias of the literature was identified using software-generated funnel plots. For the sensitivity analysis of the included literatures, one article was removed at a time during the meta-analysis to observe the changes in the combined effect to illustrate the stability and accuracy of the results.
Results
Study Identification and Selection
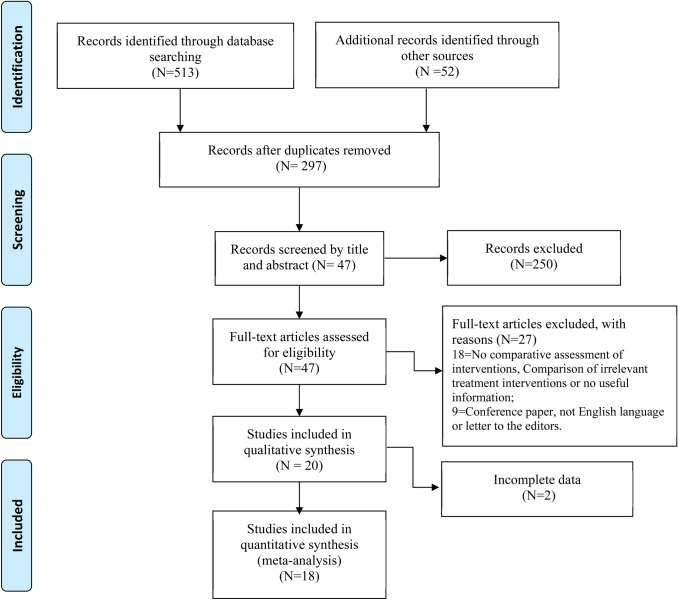
A total of 565 articles were retrieved from the database through the above search strategies. After reading the title and abstract, 47 articles were retained for further evaluation. After a full-text review, 29 articles were excluded. The remaining 18 articles [10, 13–29] involving 2614 patients met the inclusion criteria and were included in this review. Figure 1 shows the results flow chart for the whole search process (Fig. 3).
Fig. 3.
The flowchart of methodological search strategy and inclusion and exclusion criteria
Study Characteristics
Table 1 summarizes the main characteristics of the 18 studies [10, 13–29] in this review. The earliest of these studies were published in 2002, and the latest published in 2021. All of the 18 studies [10, 13–29] were conducted in the United States. The mean age of participants fluctuates between 62 and 75. The mean follow-up time for observation of postoperative results ranges from 1 to 81 months. The sample size of each study ranges from 40 to 527. Included studies are 8 randomized controlled trials, 2 prospective cohorts, and 8 retrospective designs.
Table 1.
Characteristics of the included studies
| Study (years) | Design | Country of origin | Number of patients | Number of knees | Brand of prosthesis | MP | PS | Gender (M/F) | Average age (y) | Mean follow up (months) | ||
|---|---|---|---|---|---|---|---|---|---|---|---|---|
| MP | PS | MP | PS | |||||||||
| Wang (2021) | RCS | China | 252 | 252 | Advance; NexGen | 126 | 126 | 24/102 | 22/104 | 66.9 | 67.2 | 19.7 |
| Chang (2021) | RCT | Britain | 90 | 90 | SAIPH; Triathlon | 45 | 45 | 31/14 | 28/17 | 68.4 | 69.1 | 24 |
| Zhang (2020) | PCS | China | 207 | 207 | Advance; NexGen | 98 | 109 | 74/24 | 80/29 | 67.5 | 65.4 | 1 |
| Lin (2020) | RCS | China | 374 | 374 | Advance; NexGen/NRG | 103 | 271 | 70/33 | 49/222 | 70.4 | 71.8 | 20.6 |
| Shi (2020) | RCS | China | 527 | 527 | Advance; NexGen | 290 | 237 | 228/62 | 169/68 | 74.5 | 75.4 | 80.8 |
| Kulshretha (2020) | RCT | India | 80 | 80 | Advance; NexGen | 40 | 40 | 17/23 | 11/29 | 66.0 | 63.8 | 24 |
| Batra (2020) | RCT | India | 53 | 106 | Advance; Genesis II | 53 | 53 | 42/11 | 42/11 | 61.7 | 61.7 | 6 |
| Lee (2020) | RCT | China | 46 | 92 | NA | 46 | 46 | 14/32 | 14/32 | 70 | 70 | 12 |
| Esposito (2020) | RCS | Italy | 40 | 40 | GMK; Persona | 20 | 20 | 9/11 | 2/18 | 73.5 | 70.5 | 18 |
| Gill (2019) | RCT | Pakistan | 70 | 70 | Advance; NA | 35 | 35 | 13/22 | 11/24 | 68.5 | 68.6 | 24 |
| Indelli (2019) | RCT | USA | 100 | 100 | Persona; Persona | 50 | 50 | 47/3 | 46/4 | 67.3 | 67.6 | 24 |
| Samy (2018) | RCS | Britain | 164 | 164 | EVOLUTION; Persona | 76 | 88 | 29/47 | 34/54 | 64.4 | 66.7 | 24 |
| Papagiannis (2016) | PCS | Greece | 46 | 46 | Advance; NA | 24 | 22 | n/a | n/a | 70.3 | 72.9 | 36 |
| Choi (2016) | RCS | Korea | 91 | 91 | Advance; ACS | 49 | 52 | 6/43 | 6/46 | 66.7 | 67.5 | 60 |
| Bae (2016) | RCS | Korea | 262 | 300 | Advance; PFC | 150 | 150 | 120/4 | 136/2 | 66.7 | 66.7 | 61.2 |
| Hossain (2011) | RCT | Britain | 80 | 80 | MRK; PFC Sigma | 40 | 40 | 9/31 | 18/22 | 72.5 | 68.9 | 24 |
| Kim (2009) | RCT | Korea | 92 | 184 | Advance; PFC Sigma | 92 | 92 | 7/85 | 7/85 | 69.5 | 69.5 | 36 |
| Anderson (2002) | RCS | USA | 40 | 40 | Advance; Axiom PSK | 20 | 20 | 9/11 | 6/14 | 69.5 | 69.5 | 19.5 |
RCT randomized controlled trial, PCS prospective cohort study, RCS retrospective cohort study, M/F male/female, NA not available, MP Medial pivot, PS Posterior-Stabilized, ACS Advance-coated system, MPK Medial Rotation Knee, PFC Press Fit Condylar, NA not available
Quality Assessment
We used the Cochrane risk of bias tool to categorize the included randomized controlled trials as high, unclear, and low risk of bias. This method rated bias within six main domains, with an additional option to report any “other” sources of bias (Fig. 4). Two study authors (ZHX, SYT) independently assessed the risk of these studies. Of the 8 included trials [10, 17, 18, 21–25] Five RCTs [10, 17, 18, 23, 24] were consider low risk of bias, the remainder [21, 22, 25] were considered unclear or high risk of bias (Fig. 4). Two studies [10, 22] had not explained the random sequence and allocation concealment. The 10 cohort studies [13–16, 19, 20, 26–29] were considered relatively high quality because of a score ≥ 7 according to the NOS scale criteria (Table 2).
Fig. 4.
Summary of the risk of bias of each included randomized controlled trial. Low risk: −; low risk: + ; unclear: ?
Table 2.
Quality assessment of included cohort studies using the Newcastle–Ottawa Scale
| Author | Selection | Comparability | Outcome | |||||||
|---|---|---|---|---|---|---|---|---|---|---|
| Representativeness of exposed cohort |
Selection of non- exposed cohort |
Ascertainment of exposure |
Demonstration that outcome of interest was not present at start of study |
Preoperative demographic risks |
Other TKA risk factors |
Assessment of outcome |
Follow-up > 1 year |
Loss to follow- up rate < = 10% |
Total quality score |
|
| Wang (2021) | 1 | 1 | 1 | 1 | 1 | 1 | 1 | 1 | 0 | 8 |
| Zhang (2020) | 1 | 1 | 1 | 1 | 1 | 1 | 1 | 0 | 1 | 8 |
| Lin (2020) | 1 | 1 | 1 | 1 | 0 | 1 | 1 | 1 | 0 | 7 |
| Shi (2020) | 1 | 1 | 1 | 1 | 1 | 1 | 1 | 1 | 0 | 8 |
| Esposito (2020) | 1 | 1 | 1 | 0 | 1 | 1 | 1 | 1 | 0 | 7 |
| Samy (2018) | 1 | 1 | 1 | 1 | 1 | 1 | 1 | 1 | 0 | 8 |
|
Papagiannis (2016) |
1 | 1 | 1 | 1 | 0 | 1 | 1 | 1 | 0 | 7 |
| Choi (2016) | 1 | 1 | 1 | 1 | 1 | 1 | 1 | 1 | 0 | 8 |
| Bae (2016) | 1 | 1 | 1 | 1 | 1 | 0 | 1 | 1 | 1 | 8 |
| Anderson (2002) | 1 | 1 | 1 | 1 | 0 | 1 | 1 | 1 | 1 | 8 |
Preoperative demographic risks included age, BMI, sex, if all characteristics were comparable, 1 point was assigned; Other TKA risk factors included single surgeon, or bilateral knee or same surgical approach, anyone of them was comparable, 1 point was assigned; Otherwise, 0 points were assigned.
Range of Motion (ROM)
Twelve studies [13–19, 21, 23, 25, 26, 28] indicated no significant difference in the ROM between the MP and PS groups. We divided the ROM results into 4 subgroups based on the follow-up period. The difference was not statistically significant in all subgroups: (1) follow-up: 6 months: MD = 1.13; 95% CI = − 1.33 to 3.59 (P = 0.37, fixed effect model); (2) follow-up: 1 year: MD = 3.55; 95% CI = − 1.19 to 8.30 (P = 0.14, random effect model); (3) follow-up: 2 years: MD = − 0.10; 95% CI = − 12.85 to 12.65 (P = 0.99, random effect model); (4) follow-up: 5 years: MD = − 1.51; 95% CI = − 4.97 to 1.96 (P = 0.39, random effect model) (Fig. 5) (Table 3); Four studies involving 1097 cases provided information on the improvement of ROM, no difference was found in our study(MD = 0.07; 95% CI = − 1.70 to 1.84, P = 0.94) (Table 3).
Fig. 5.
Comparison of ROM between the MP group and PS group. SD = standard deviation, IV = inverse variance, CI = confidence interval, and df = degrees of freedom
Table 3.
Postoperative comparison of MP and PS
| Outcome | No. of studies |
Cases (n) | Heterogeneity I2 (%) |
Pooled odds Ratio |
Mean difference |
95% confidence interval | P value |
|---|---|---|---|---|---|---|---|
| ROM | |||||||
| 6 months | 3 | 362 | 0 | NA | 1.13 | − 1.33 to 3.59 | 0.37 |
| 1 year | 6 | 957 | 90 | NA | 3.55 | − 1.19 to 8.30 | 0.14 |
| 2 years | 4 | 382 | 94 | NA | − 0.10 | − 12.85 to 12.65 | 0.99 |
| 5 years | 3 | 928 | 74 | NA | − 1.51 | − 4.97 to 1.96 | 0.39 |
| ROM improvement | 4 | 1097 | 41 | NA | 0.07 | − 1.70 to 1.84 | 0.94 |
| Flexion angle | 6 | 824 | 90 | NA | 1.30 | − 1.53 to 4.13 | 0.37 |
| Extension angle | 4 | 653 | 83 | NA | 0.36 | − 0.61 to 1.34 | 0.47 |
| KSS-Knee | |||||||
| 1 year | 3 | 260 | 0 | NA | 2.65 | − 1.13 to 6.44 | 0.17 |
| 2 years | 3 | 389 | 89 | NA | − 0.46 | − 6.19 to 5.27 | 0.88 |
| 5 years | 2 | 401 | 73 | NA | − 0.33 | − 3.42 to 2.76 | 0.83 |
| KSS-Function | |||||||
| 1 year | 3 | 260 | 0 | NA | 0.52 | − 4.11 to 5.14 | 0.83 |
| 2 years | 4 | 459 | 66 | NA | − 1.10 | − 3.89 to 1.69 | 0.44 |
| 5 years | 2 | 401 | 32 | NA | − 0.91 | − 2.48 to 0.65 | 0.25 |
| KSS-Total | 3 | 453 | 76 | NA | 2.07 | − 0.74 to 4.89 | 0.15 |
| OKS | 4 | 325 | 53 | NA | 0.17 | − 0.62 to 0.95 | 0.68 |
| WOMAC | 6 | 904 | 64 | NA | 0.74 | − 1.51 to 3.00 | 0.52 |
| FJS | 4 | 853 | 75 | NA | 5.15 | − 2.46 to 12.77 | 0.18 |
| Kujala Score | 2 | 552 | 35 | NA | 1.35 | 0.52 to 2.18 | 0.001 |
| Complications | |||||||
| Anterior knee pain | 4 | 1226 | 11 | 0.78 | NA | 0.41 to 1.46 | 0.43 |
| PCC | 5 | 1265 | 0 | 0.20 | NA | 0.07 to 0.58 | 0.003 |
| Deep infection | 6 | 1628 | 0 | 1.61 | NA | 0.59 to 4.35 | 0.35 |
| Instability | 4 | 723 | 0 | 2.16 | NA | 0.63 to 7.35 | 0.22 |
| Stiffness | 4 | 631 | 0 | 0.78 | NA | 0.25 to 2.46 | 0.67 |
| Overall | 12 | 2279 | 59 | 1.07 | NA | 0.51 to 2.22 | 0.86 |
| Revision rate | 6 | 1484 | 0 | 1.44 | NA | 0.54 to 3.86 | 0.47 |
| Patella shift | 2 | 552 | 19 | − 0.36 | NA | − 0.71 to -0.00 | 0.05 |
| Patella tilt | 5 | 881 | 87 | 0.70 | NA | − 0.42 to 1.81 | 0.22 |
| Femorotibial angle | 5 | 730 | 77 | − 0.14 | NA | − 0.72 to 0.44 | 0.63 |
| Implant imposition | |||||||
| α angle | 5 | 691 | 79 | − 0.02 | NA | − 0.64 to 0.59 | 0.94 |
| β angle | 5 | 691 | 0 | 0.03 | NA | − 0.26 to 0.31 | 0.85 |
| γ angle | 5 | 691 | 62 | 0.39 | NA | − 0.16 to 0.94 | 0.17 |
| δ angle | 5 | 691 | 97 | 0.28 | NA | − 1.52 to 2.09 | 0.76 |
PCC patellar clunk or crepitus, α angle coronal femoral component angle, β angle coronal tibial component angle, γ angle sagittal femoral component angle, δ angle sagittal tibial component angle, NA not available
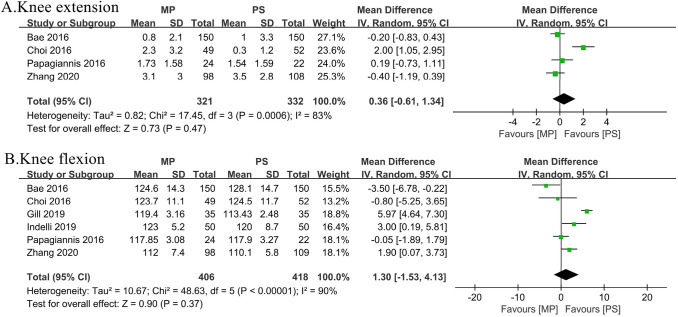
Four studies [16, 19, 27, 29] indicated no significant difference in the maximal extension of the knee between the MP group and the PS group in the random effect model. The difference between the 2 groups in favor of neither of any group was insignificant (MD = 0.36;95% CI = − 0.61to 1.34, P = 0.47) (Fig. 6A) (Table 3). Maximal postoperative flexion of the knee was reported in 6 studies [10, 16, 19, 22, 27, 29]. The difference between the 2 groups in favor of neither of any group was insignificant (MD = 1.30; 95% CI = − 1.53 to 4.13, P = 0.37) (Fig. 6B) (Table 3).
Fig. 6.
Comparison of knee extension or flexion between the MP group and PS group. SD = standard deviation, IV = inverse variance, CI = confidence interval, and df = degrees of freedom
Patient-Reported Outcome Measures (PROMs)
The PROMs consist of Knee Society Score (KSS), Oxford Knee Score (OKS), Western Ontario and McMaster Universities Arthritis Index (WOMAC), Forgotten Joint Score (FJS), and Kujala Score.
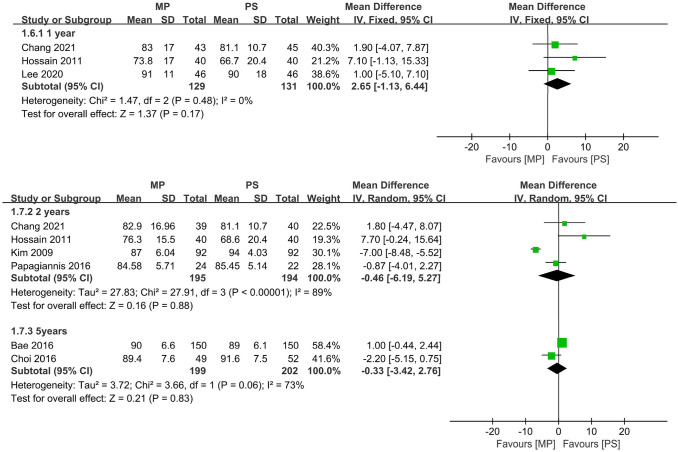
Seven studies [16, 18, 19, 21, 23, 25, 27] indicated no significant difference in the KSS-knee between the MP and PS groups. We divided the KSS-knee results into 4 subgroups based on the follow-up period. The difference was not statistically significant in all subgroups: (1) follow-up: 1 year: MD = 2.65; 95% CI = − 1.13 to 6.44 (P = 0.17, fixed effect model); (2) follow-up: 2 years: MD = − 0.46; 95% CI = -6.19 to 5.27 (P = 0.88, random effect model); (3) follow-up: 5 years: MD = − 0.33; 95% CI = − 3.42 to 2.76 (P = 0.83, random effect model) (Fig. 7) (Table 3).
Fig. 7.
Comparison of KSS-knee between the MP group and PS group. SD = standard deviation, IV = inverse variance, CI = confidence interval, and df = degrees of freedom
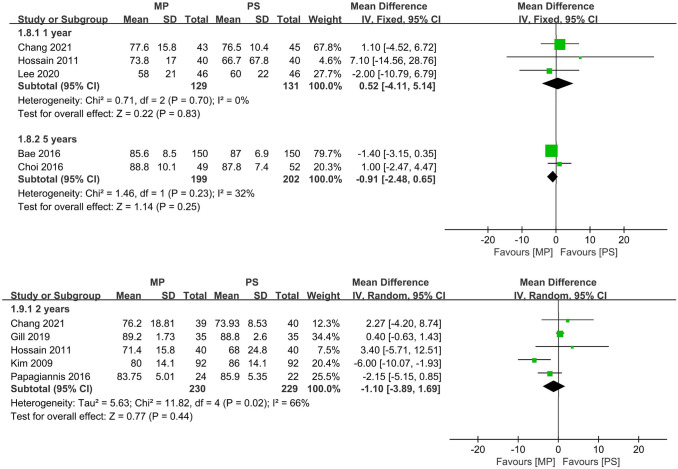
Eight studies [10, 16, 18, 19, 21, 23, 25, 27] indicated no significant difference in the KSS-function between the MP and PS groups. We divided the KSS-function results into four subgroups based on the follow-up period. The difference was not statistically significant in all subgroups: (1) follow-up: 1 year: MD = − 0.52; 95% CI = − 4.11 to 5.14 (P = 0.70, fixed effect model); (2) follow-up: 2 years: MD = − 1.10; 95% CI = − 3.89 to 1.69 (P = 0.44, fixed effect model); (3) follow-up: 5 years: MD = − 0.91; 95% CI = − 2.48 to 0.65 (P = 0.25, random effect model) (Fig. 8) (Table 3).
Fig. 8.
Comparison of KSS-function between the MP group and PS group. SD = standard deviation, IV = inverse variance, CI = confidence interval, and df = degrees of freedom
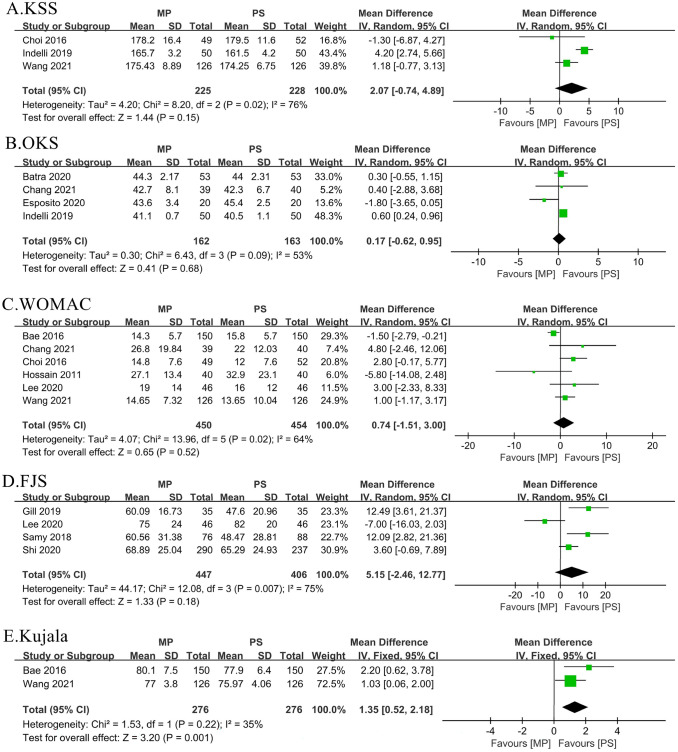
The outcome measure of KSS-total was available in three studies [14, 19, 22]. KSS-total was not affected by using a MP prosthesis when the MP prosthesis group was compared with the PS prosthesis group (MD = 2.07;95% CI = − 0.74 to 4.89, P = 0.15) (Fig. 9A) (Table 3). Four studies [16, 18, 20, 22]provided data on OKS. The odd ratio was insignificant (MD = 0.17;95% CI = − 0.62 to 0.95, P = 0.68) (Fig. 9B) (Table 3). Six articles [14, 16, 18, 19, 21, 25] measured WOMAC. There was no difference in MP and PS group (MD = 0.74;95% CI = − 1.51 to3.00, P = 0.52) (Fig. 9C) (Table 3). Four studies [10, 13, 25, 28] provide information about FJS. The difference was not statistically significant in all subgroups (MD = 5.15;95% CI = − 2.46 to 12.77, P = 0.18) (Fig. 9D) (Table 3). Only two studies [14, 16] mentioned Kujala Score. The cumulative MD was significant, with an MD of 1.35 (CI = 0.52 to 2.18, P = 0.001) comparing MP and PS groups (Fig. 9E) (Table 3).
Fig. 9.
Comparison of PROMs (A. KSS; B. OKS; C. WOMAC; D. F JS; E. Kujala) between the MP group and PS group. SD = standard deviation, IV = inverse variance, CI = confidence interval, and df = degrees of freedom
Clinical Complications
Clinical complications conclude anterior knee pain, patellar clunk or crepitus (PCC), deep infection, instability, and stiffness.
Four articles [14, 24, 26, 28] included 1226 cases provided data regarding anterior knee pain. No difference was found in our study (OR = 0.78;95% CI = 0.41 to 1.46, P = 0.43) (Fig. 10A) (Table 3).
Fig. 10.
Comparison of complications (A. anterior knee pain; B. PCC; C. deep infection; D. instability; E. stiffness) between the MP group and PS group. SD = standard deviation, IV = inverse variance, CI = confidence interval, and df = degrees of freedom
Four articles [14, 15, 26, 28] involving 1265 cases provided results regarding PCC, no heterogeneity existed among the studies (P = 0.85; I2 = 0%). The fixed effect model was used for meta-analysis. The rates of PCC were lower in patients who underwent MP prothesis than those in patients who underwent PS prothesis (OR = 0.20;95% CI = 0.07 to 0.58, P = 0.003) (Fig. 10B) (Table 3).
Six articles [13, 16, 18, 23, 26, 28] provided data regarding deep infection, no heterogeneity existed among the studies (P = 0.81; I2 = 0%). The fixed effect model was used for meta-analysis. The data showed that the MP prothesis is not superior to the PS prothesis (OR = 1.61;95% CI = 0.59 to 4.35, P = 0.35) (Fig. 10C) (Table 3). Four articles [13, 16, 17, 26] provided data regarding postoperative knee instability, no heterogeneity existed among the studies (P = 0.82; I2 = 0%). The fixed-effect model was used for meta-analysis. The data showed that there was no difference between the two kinds of prostheses (OR = 2.16;95% CI = 0.63to 7.35, P = 0.22) (Fig. 10D) (Table 3). Four articles [18, 22, 24, 26] provided data regarding stiffness, no heterogeneity existed among the studies (P = 0.77; I2 = 0%). The fixed-effect model was used for meta-analysis. The data showed that there was no difference between the two kinds of prostheses (OR = 0.78;95% CI = 0.25 to 2.46, P = 0.67) (Fig. 10E) (Table 3).
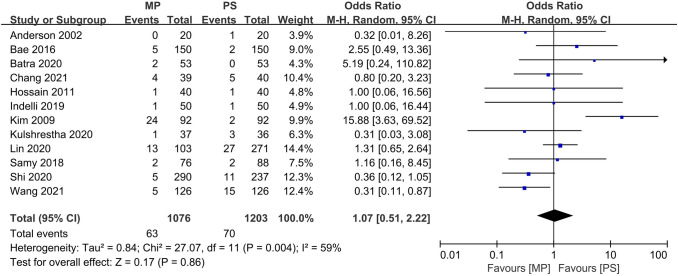
Twelve studies [13–18, 21–24, 26, 28] included complete complication rate data and were included in the pooled analysis of overall complications. There were no significant differences between all complications rates (OR = 1.07;95% CI = 0.51 to 2.22, P = 0.86) (Fig. 11) (Table 3).
Fig. 11.
Comparison of overall complications between the MP group and PS group. SD = standard deviation, IV = inverse variance, CI = confidence interval, and df = degrees of freedom
Revision Rate
Six articles [13, 15, 16, 18, 26, 28] provided data regarding revision rate, and no heterogeneity existed among the studies (P = 0.88; I2 = 0%). The fixed effect model was used for meta-analysis. The data showed that the MP prothesis is not superior to the PS prothesis (OR = 1.44;95% CI = 0.54 to 3.86, P = 0.47) (Fig. 12) (Table 3).
Fig. 12.
Comparison of implant position between the MP group and PS group. SD = standard deviation, IV = inverse variance, CI = confidence interval, and df = degrees of freedom
Radiographic Outcomes
The radiographic results consist of femorotibial angle, implant position (coronal femoral component angle, coronal tibial component angle, sagittal femoral component angle, sagittal tibial component angle), patella shift, and patella tilt angle.
Five articles [15–17, 19, 23] involving 730 cases provided results regarding postoperative femorotibial angle; there was no significant difference between the MP group and the PS group (MD = − 0.14; 95% CI = − 0.72 to 0.44, P = 0.63) (Table 3).
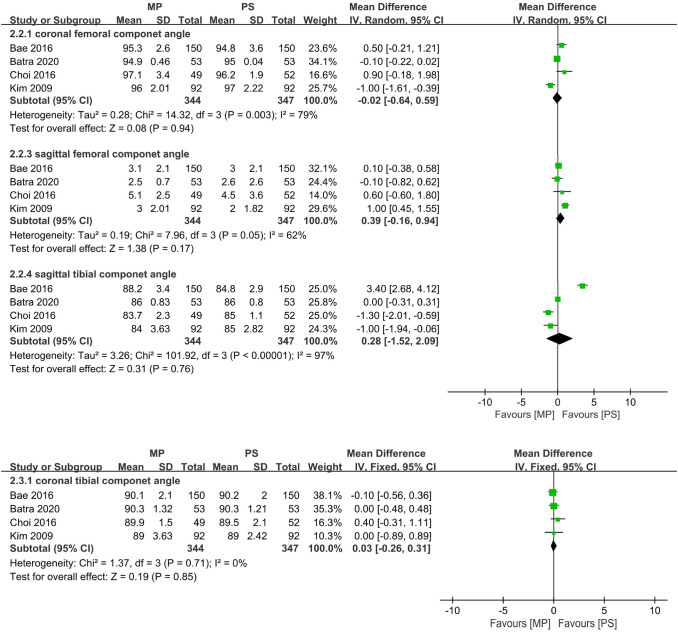
Four articles[16, 17, 19, 23] involving 691 cases provided data regarding postoperative implant position (coronal femoral component angle、coronal tibial component angle, sagittal femoral component angle, sagittal tibial component angle).The data show that there was no difference in all subgroup. (coronal femoral component angle: MD = − 0.02; 95% CI = − 0.64 to 0.59, P = 0.94; coronal tibial component angle: MD = 0.03; 95% CI = − 0.26 to 0.31, P = 0.85; sagittal femoral component angle: MD = 0.39; 95% CI = − 0.16 to 0.94, P = 0.17; sagittal tibial component angle: MD = 0.28; 95% CI = − 1.52 to 2.09, P = 0.76) (Fig. 13) (Table 3).
Fig. 13.
Comparison of revision rate between the MP group and PS group. SD = standard deviation, IV = inverse variance, CI = confidence interval, and df = degrees of freedom
Five articles [14–17, 23] involving 881 cases provided results regarding postoperative patella tilt angle. No difference was found in our study (MD = 0.70;95% CI = − 0.42 to 1.81, P = 0.22) (Table 3). Only two articles [10, 12] involving 552 cases provided the information on patella shift; similarly, the result of the MP prosthesis was not superior to the PS prosthesis (MD = − 0.36;95% CI = − 0.71 to − 0.00, P = 0.05) (Table 3).
Publication Bias
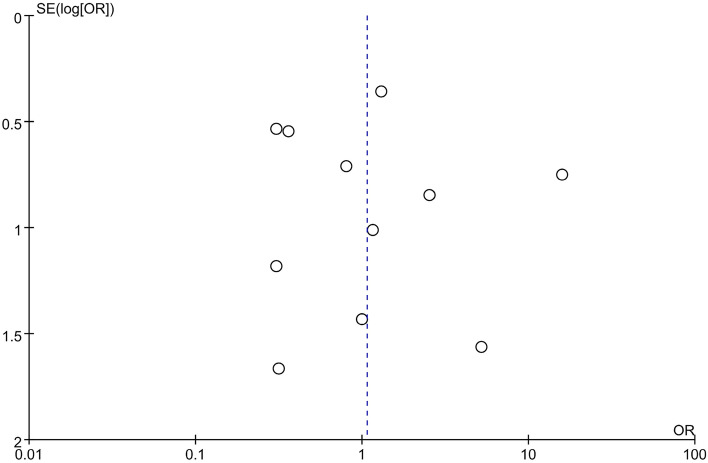
Publication bias was assessed by the funnel plot method and Egger’s test. The funnel plot shape and Egger’s test (P = 0.801) appeared essentially symmetric (Fig. 14), indicating no overt publication bias in the analysis of complications.
Fig. 14.
Funnel plot for overall complications
Sensitivity Analysis
Outcome indicated that ROM, Flexion angle, Extension angle, PROMs, overall complication rate, patella tilt, Femorotibial angle, α angle, γ angle and δ angle were statistically heterogeneous. Observing the stability of the results after excluding each article one by one, the results showed that the heterogeneity changed while the results remained unchanged, which suggested that the results were convincing.
Discussion
This meta-analysis aimed at evaluating whether theoretical superiority in the MP prosthesis group can be translated into actual outcomes . A previous meta-analysis [30] on this topic has shown that patients with the MP prosthesis have similar clinical results and radiographic outcomes as patients with PS prosthesis;11 additional articles have been identified since the publication of the latest meta-analysis. Thus, we have numerous data to compare the two groups regarding ROM, PROMs, clinical complications, and radiographic outcomes.
Additionally, the results of patella-related complications and FJS were analyzed in our study, whereas it was absent in the previous meta-analysis. Besides, to be more persuasive, we divided the results of ROM, KSS-knee, and KSS-function into three or four subgroups based on the follow-up period. In our study, the meta-analysis demonstrated that the MP prosthesis in TKA is not significantly different from the PS prosthesis in terms of ROM, patient-reported outcome measures(PROMS), overall complication rate, and radiographic outcomes. However, the Kujala Score and the occurrence rate of PCC in the MP group are significantly superior to the PS prosthesis.
Current studies had shown excellent functional outcome scores following TKA with the MP prosthesis [16, 17, 19, 25], but there is still debate on whether it is superior to a PS-TKA. The ROM is an important and common outcome to evaluate the knee function objectively. The overstuffing of the patellofemoral joints could reduce the passive knee flexion, but the advanced MP prosthesis has a deeper prosthetic groove to avoid this phenomenon [14, 31]. However, Bae reported that the MP prosthesis could not roll back as much as the PS prosthesis with a cam-and-post mechanism [16].
Numerous current studies intend to compare this outcome to settle disputes. Hossain et al. [21] reported that MP has a greater ROM than the PS group at both 1 and 2 years. In their study, ROM in the MP group was 115.5° ± 11.6°, 114.9° ± 12.8° at 1 and 2 years. Nevertheless, ROM in the PS group was only 98.2° ± 14.2° and 100.1° ± 15.9°. However, multiple articles [15, 17, 18, 25, 28] demonstrated no difference in the two groups in terms of ROM. To minimize the influence of different follow-up periods, we divided it into four subgroups (6 months, 1 year, 2 years and 5 years); surprisingly, the difference was not statistically significant in all groups. Moreover, we also compared the flexion or extension of the knee and the improvement of ROM; the result remained similar. Thus, we have sufficient evidence that the MP prosthesis is not superior to the PS prosthesis in terms of knee mobility.
The PROMs could assess knee function and quality of daily life comprehensively. Katchky et al. [32] included 92 patients and reported excellent PROMs in their MP prostheses compared to other prostheses. Regretfully, there is no difference in terms of KSS in all subgroups in our study. One reasonable explanation for this result is that this scoring system does not include squatting and kneeling activities, which seemingly are better achieved by MP prostheses.
However, we also compared WOMAC, OKS concurrently, which include daily activity and quality of daily life; the results remained similar in our meta-analysis. Pizza et al. [33] concluded 52 patients who received PS prostheses. Their widely acclaimed work found that patients could get good-to-excellent postoperative PROMs as long as there is no over-constraint of the medial compartment. These score systems have been subjected to a ceiling effect in the same vein, so it is not sensitive enough to determine differences [34]. Overall, we have insufficient evidence to demonstrate that the MP prosthesis is superior to the PS prosthesis in PROMs.
Patella-related complications account for about 10% of all TKA complications are thought to cause lousy TKA outcomes [35]. The medial pivot femoral prosthesis integrates various “patella-friendly” design features that could facilitate the restoration of patellofemoral joint function. Wang et al. [14] demonstrated that the MP prosthesis could achieve satisfactory outcomes with better patellofemoral performance than the PS prosthesis.
However, Bae et al. [16] found that MP prostheses did not show the expected advantage in relieving patellar symptoms. Moreover, Chinzei et al. [36] indicated that the MP prosthesis had difficulty reproducing normal patella-femoral joint kinematics in clinical practice. Thus, we intended to conclude several patella-related outcomes to settle disputes. Persistent anterior knee pain after TKA, one of the most common patella-related complications, is the major problem affecting satisfaction [26].
“Paradoxical anterior movement” after TKA could lead to pain caused by patellofemoral impact during flexion [37]. The MP prosthesis has been reported to avoid this phenomenon and reduce patellofemoral joint pressure [38]. However, no significant difference was found between the MP group and the PS group in our study. As known, pain is a subjective feeling and is affected by a variety of factors, including surgical technology and host factor. Thus, researchers had difficulty recording the incidence of knee pain accurately.
Another patella-related issue included in our study was patellar clunk or crepitus (PCC), and we found that the MP prosthesis had a low risk of PCC (OR = 0.20;95% CI = 0.07 to 0.58, P = 0.003). It was caused by the small nodules of the fibrous synovial hyperplasia at the superior junction of the quadriceps tendon, and the fiber nodule becomes entrapped within the intercondylar box during knee flexion [39].
While PCC is affected by various factors, the design of the femoral prosthesis is the crucial factor in its development. Femoral component with a high intercondylar box ratio was thought to be the main risk of PCC because they allow earlier contact of the distal quadriceps tendon during flexion than those with a lower ratio [40].
The design of the MP femoral prosthesis has more natural knee kinematics and a lower ratio of intercondylar than PS femoral prosthesis, reducing the incidence of PCC [14, 41]. Thus, the surgeons should be aware of the occurrence of PCC and make suitable intervention early when the PS prosthesis was utilized. Kujala score [42], has been widely used to assess the functional limitations and subjective symptoms in patellofemoral disorder, where a significant difference was found between the two groups. However, it is important to note that only two articles analysed Kujala score,and our conclusions are solely speculative.
Besides, patella tilt and shift are also related to the patella-related issues, but there were no significant differences in our study. The results reported here confirm that the MP prothesis was superior to the PS prosthesis in terms of PCC. However, the evidence is inadequate to establish that patellofemoral joint function was better in the MP group.
Other knee-related complications, including deep infection and instability, could significantly affect patient satisfaction and knee function. The PS prosthesis needs the box preparation that exposes more cancellous femoral bone and may also increase the risk of deep infection potentially. Zhang et al. [29] reported that the MP group had less CRP (C-reactive protein) and ESR (erythrocyte sedimentation rate) elevation than the PS group. Despite this, no difference was found in our meta-analysis. About the instability, The PS prosthesis relies on the femoral cam, increasing anteroposterior and translational stability and preventing the subluxation of the prosthesis, while the MP prosthesis allows relative freedom of anteroposterior movement of the lateral condyle [5–7].
However, Jones et al. [43] reported that MP-TKA had significantly decreased anterior translation on KT-1000 and improved sagittal stability compared to non-MP group. Batra et al. [17] reported that minor knee instability in the immediate postoperative period were possibly related to overzealous MCL release. The stability after TKA seems to interplay with prosthesis design, soft tissue balance, and surgical factors [43]. However, according to the result of our study, the instability is not significantly related to the design of components.
The large conformity of the medial femorotibial compartment in the MP prosthesis may produce smaller, rounder, and fewer particles, which may increase the long-term survival rate and reduce the revision rate. However, the Australian Orthopaedic Association National Joint Replacement Registry has revealed that the MP prosthesis has a higher rate of revision TKA compared with other types of prosthesis. Loosening and patellofemoral pain were the main issues of failure leading to revision, with 1.6% and 1.2% for the primary Advance MP prosthesis compared with 0.9% and 0.4% for all other types of TKA [12]. Only two articles [16, 28] in our meta-analysis had compared the survival rate between MP and PS prosthesis; both of researches had demonstrated that the survival rate of the MP prosthesis was slightly lower than that of the PS group. Besides, our analysis suggested that there were no difference between two groups in terms of revision rate (1.1 vs 0.7%, P > 0.05), and we found that deep infection and loosening were the main reasons of revision. Due to improvements in surgical techniques and various aspects of patient post-replacement management, post-total knee arthroplasty revision rates have been significantly reduced, and the different mechanism of prothesis could not affect the revision rate obviously.
Patient satisfaction after TKA is a crucial issue facing doctors and patients [3]. The failure of traditional TKA designs to reproduce physiologic knee kinematics may contribute to patient dissatisfaction. Therefore, the design of MP prothesis was expected to achieve superior patient satisfaction [26]. Prittchett et al. [44] compared the MP prosthesis with PS prostheses. They found that 76% of patients preferred MP prostheses over PS prostheses because they felt that those prostheses were more natural and stable. However, Lee et al. [25] showed that there is no difference in patient preference between MP (28.9%) and PS (35.6%) knees in staged bilateral TKA. The FJS score is a scale for evaluating postoperative patient satisfaction. Some researchers reported that patients with MP-TKA had better FJS than PS-TKA [13, 21]. Regretfully, no difference was found in our study.
In summary, we found the PS group had a higher risk of PCC, but the theoretical advantages of MP prosthesis could not translate to the difference in knee function, clinical complications, and patient satisfaction. Similarly, the shape and mechanism of prostheses could not affect the implant position and postoperative alignment.
This research had three limitations. First, in combining randomized control trials and cohort studies simultaneously, the bias caused by different types of trials could not be eliminated. Second, the prostheses brands were not consistent through the trials while the implantation mechanism was similar. Third, three included studies were high or unclear bias; the results remained similar when we excluded these articles [10, 22, 25]. Thus, future research should be performed considering high-quality randomized controlled studies to demonstrate whether the MP prosthesis is superior to the PS prosthesis concerning clinical outcomes, patient satisfaction, and patellofemoral joint complications.
Conclusions
In our meta-analysis, we found that the MP prosthesis can reduce the patellar clunk or crepitus rate. However, choices between the MP or PS prosthesis would not affect knee function, clinical complications, patient satisfaction, implant position, and postoperative alignment.
Funding
This work was supported by the Guizhou Medical University Doctoral Fund (I-2017–12), Science and Technology Fund Project of Guizhou Provincial Health Commission (gzwjkj2020-1-121),Project of New Seedling Program by Guizhou Medical University, Guizhou Provincial Administration of Traditional Chinese Medicine, 2020 Special Project of Traditional Chinese Medicine and Ethnic Medicine Science and Technology Subject.
Declarations
Conflict of Interest
The authors declare that they have no conflict of interest.
Ethical Approval
This article does not contain any studies with human participants or animals performed by any of the authors.
Informed Consent
No required.
Footnotes
Publisher's Note
Springer Nature remains neutral with regard to jurisdictional claims in published maps and institutional affiliations.
References
- 1.Fitch DA, Sedacki K, Yang Y. Mid- to long-term outcomes of a medial-pivot system for primary total knee replacement: A systematic review and meta-analysis. Bone Joint Research. 2014;3(10):297–304. doi: 10.1302/2046-3758.310.2000290. [DOI] [PMC free article] [PubMed] [Google Scholar]
- 2.Price AJ, Alvand A, Troelsen A, et al. Knee replacement. Lancet. 2018;392(10158):1672–1682. doi: 10.1016/S0140-6736(18)32344-4. [DOI] [PubMed] [Google Scholar]
- 3.Choi YJ, Ra HJ. Patient satisfaction after total knee arthroplasty. Knee Surgery Related Research. 2016;28(1):1–15. doi: 10.5792/ksrr.2016.28.1.1. [DOI] [PMC free article] [PubMed] [Google Scholar]
- 4.Dorr LD, Ochsner JL, Gronley J, et al. Functional comparison of posterior cruciate-retained versus cruciate-sacrificed total knee arthroplasty. Clinical Orthopaedics and Related Research. 1988;236:36–43. doi: 10.1097/00003086-198811000-00005. [DOI] [PubMed] [Google Scholar]
- 5.Collier JP, Mayor MB, McNamara JL, et al. Analysis of the failure of 122 polyethylene inserts from uncemented tibial knee components. Clinical Orthopaedics and Related Research. 1991;273:232–242. [PubMed] [Google Scholar]
- 6.Jacobs WC, Clement DJ, Wymenga AB. Retention versus removal of the posterior cruciate ligament in total knee replacement: A systematic literature review within the Cochrane framework. Acta Orthopaedica. 2005;76(6):757–768. doi: 10.1080/17453670510045345. [DOI] [PubMed] [Google Scholar]
- 7.Ranawat CS, Komistek RD, Rodriguez JA, et al. In vivo kinematics for fixed and mobile-bearing posterior stabilized knee prostheses. Clinical Orthopaedics and Related Research. 2004;418:184–190. doi: 10.1097/00003086-200401000-00030. [DOI] [PubMed] [Google Scholar]
- 8.Dennis DA, Komistek RD, Mahfouz MR. In vivo fluoroscopic analysis of fixed-bearing total knee replacements. Clinical Orthopaedics and Related Research. 2003;410:114–130. doi: 10.1097/01.blo.0000062385.79828.72. [DOI] [PubMed] [Google Scholar]
- 9.Walker PS, Yildirim G, Sussman-Fort J, et al. Factors affecting the impingement angle of fixed- and mobile-bearing total knee replacements: A laboratory study. Journal of Arthroplasty. 2007;22(5):745–752. doi: 10.1016/j.arth.2006.09.008. [DOI] [PubMed] [Google Scholar]
- 10.Gill UN, Shiraz HM, Rehman MKU, et al. Comparison of functional outcome of medial pivot total knee arthroplasty with posterior stabilizing (PS) total knee arthroplasty - A randomized trial. Pakistan Journal of Medical and Health Sciences. 2019;13(2):385–388. [Google Scholar]
- 11.Blaha JD, Mancinelli CA, Simons WH, et al. Kinematics of the human knee using an open chain cadaver model. Clinical Orthopaedics and Related Research. 2003;410:25–34. doi: 10.1097/01.blo.0000063564.90853.ed. [DOI] [PubMed] [Google Scholar]
- 12.Brinkman JM, Bubra PS, Walker P, et al. Midterm results using a medial pivot total knee replacement compared with the Australian National Joint Replacement Registry data. ANZ Journal of Surgery. 2014;84(3):172–176. doi: 10.1111/ans.12428. [DOI] [PubMed] [Google Scholar]
- 13.Samy DA, Wolfstadt JI, Vaidee I, et al. A retrospective comparison of a medial pivot and posterior-stabilized total knee arthroplasty with respect to patient-reported and radiographic outcomes. Journal of Arthroplasty. 2018;33(5):1379–1383. doi: 10.1016/j.arth.2017.11.049. [DOI] [PubMed] [Google Scholar]
- 14.Wang Z, Zhang YQ, Ding CR, et al. Early patellofemoral function of medial pivot prostheses compared with posterior-stabilized prostheses for unilateral total knee arthroplasty. Orthopaedic Surgery. 2021;13(2):417–425. doi: 10.1111/os.12895. [DOI] [PMC free article] [PubMed] [Google Scholar]
- 15.Anderson MJ, Becker DL, Kieckbusch T. Patellofemoral complications after posterior-stabilized total knee arthroplasty: A comparison of 2 different implant designs. Journal of Arthroplasty. 2002;17(4):422–426. doi: 10.1054/arth.2002.32173. [DOI] [PubMed] [Google Scholar]
- 16.Bae DK, Cho SD, Im SK, et al. Comparison of midterm clinical and radiographic results between total knee arthroplasties using medial pivot and posterior-stabilized prosthesis-a matched pair analysis. Journal of Arthroplasty. 2016;31(2):419–424. doi: 10.1016/j.arth.2015.09.038. [DOI] [PubMed] [Google Scholar]
- 17.Batra S, Malhotra R, Kumar V, et al. Superior patient satisfaction in medial pivot as compared to posterior stabilized total knee arthroplasty: A prospective randomized study. Knee Surgery, Sports Traumatology, Arthroscopy. 2020;29(11):3633–3640. doi: 10.1007/s00167-020-06343-4. [DOI] [PubMed] [Google Scholar]
- 18.Chang JS, Kayani B, Moriarty PD, et al. A prospective randomized controlled trial comparing medial-pivot versus posterior-stabilized total knee arthroplasty. Journal of Arthroplasty. 2021;36(5):1584–1589.e1. doi: 10.1016/j.arth.2021.01.013. [DOI] [PubMed] [Google Scholar]
- 19.Choi NY, In Y, Bae JH, et al. Are midterm patient-reported outcome measures between rotating-platform mobile-bearing prosthesis and medial-pivot prosthesis different? A minimum of 5-year follow-up study. Journal of Arthroplasty. 2017;32(3):824–829. doi: 10.1016/j.arth.2016.08.028. [DOI] [PubMed] [Google Scholar]
- 20.Esposito F, Freddolini M, Marcucci M, et al. Biomechanical analysis on total knee replacement patients during gait: Medial pivot or posterior stabilized design? Clinical Biomechanics (Bristol, Avon) 2020;78:105068. doi: 10.1016/j.clinbiomech.2020.105068. [DOI] [PubMed] [Google Scholar]
- 21.Hossain F, Patel S, Rhee SJ, et al. Knee arthroplasty with a medially conforming ball-and-socket tibiofemoral articulation provides better function. Clinical Orthopaedics and Related Research. 2011;469(1):55–63. doi: 10.1007/s11999-010-1493-3. [DOI] [PMC free article] [PubMed] [Google Scholar]
- 22.Indelli PF, Risitano S, Hall KE, et al. Effect of polyethylene conformity on total knee arthroplasty early clinical outcomes. Knee Surgery, Sports Traumatology, Arthroscopy. 2019;27(4):1028–1034. doi: 10.1007/s00167-018-5170-5. [DOI] [PubMed] [Google Scholar]
- 23.Kim YH, Yoon SH, Kim JS. Early outcome of TKA with a medial pivot fixed-bearing prosthesis is worse than with a PFC mobile-bearing prosthesis. Clinical Orthopaedics and Related Research. 2009;467(2):493–503. doi: 10.1007/s11999-008-0221-8. [DOI] [PMC free article] [PubMed] [Google Scholar]
- 24.Kulshrestha V, Sood M, Kanade S, et al. Early outcomes of medial pivot total knee arthroplasty compared to posterior-stabilized design: A randomized controlled trial. Clinics in Orthopedic Surgery. 2020;12(2):178–186. doi: 10.4055/cios19141. [DOI] [PMC free article] [PubMed] [Google Scholar]
- 25.Lee QJ, Wai YEC, Wong YC. No difference in patient preference for medial pivot versus posterior-stabilized design in staged bilateral total knee arthroplasty: A prospective study. Knee Surgery Sports Traumatology Arthroscopy. 2020;28(12):3805–3809. doi: 10.1007/s00167-020-05867-z. [DOI] [PubMed] [Google Scholar]
- 26.Lin Y, Chen X, Li L, et al. Comparison of patient satisfaction between medial pivot prostheses and posterior-stabilized prostheses in total knee arthroplasty. Orthopaedic Surgery. 2020;12(3):836–842. doi: 10.1111/os.12687. [DOI] [PMC free article] [PubMed] [Google Scholar]
- 27.Papagiannis GI, Roumpelakis IM, Triantafyllou AI, et al. No differences identified in transverse plane biomechanics between medial pivot and rotating platform total knee implant designs. Journal of Arthroplasty. 2016;31(8):1814–1820. doi: 10.1016/j.arth.2016.01.050. [DOI] [PubMed] [Google Scholar]
- 28.Shi W, Jiang Y, Wang C, et al. Comparative study on mid- and long-term clinical effects of medial pivot prosthesis and posterior-stabilized prosthesis after total knee arthroplasty. Journal of Orthopaedic Surgery and Research. 2020;15(1):421. doi: 10.1186/s13018-020-01951-9. [DOI] [PMC free article] [PubMed] [Google Scholar]
- 29.Zhang ZA, Feng H, Yan WN, et al. Comparison of postoperative effects between medial pivot prosthesis and posterior stabilized prosthesis. Orthopaedic Surgery. 2020;12(6):1843–1853. doi: 10.1111/os.12822. [DOI] [PMC free article] [PubMed] [Google Scholar]
- 30.Sun X, Gao X, Sun X, et al. Comparison of clinical and radiographic results between total knee arthroplasties using medial pivot and posterior-stabilized prosthesis: A meta-analysis. Medicine (Baltimore) 2021;100(4):e23809. doi: 10.1097/MD.0000000000023809. [DOI] [PMC free article] [PubMed] [Google Scholar]
- 31.Mihalko W, Fishkin Z, Krackow K. Patellofemoral overstuff and its relationship to flexion after total knee arthroplasty. Clinical Orthopaedics and Related Research. 2006;449:283–287. doi: 10.1097/01.blo.0000218756.89439.06. [DOI] [PubMed] [Google Scholar]
- 32.Katchky AM, Jones CW, Walter WL, et al. Medial ball and socket total knee arthroplasty: five-year clinical results. Bone Joint Journal. 2019;101-B(1 Suppl A):59–65. doi: 10.1302/0301-620X.101B1.BJJ-2018-0434.R1. [DOI] [PubMed] [Google Scholar]
- 33.Pizza N, Di Paolo S, Zinno R, et al. Over-constrained kinematic of the medial compartment leads to lower clinical outcomes after total knee arthroplasty. Knee Surgery, Sports Traumatology, Arthroscopy. 2021;30(2):661–667. doi: 10.1007/s00167-020-06398-3. [DOI] [PMC free article] [PubMed] [Google Scholar]
- 34.Na SE, Ha CW, Lee CH. A new high-flexion knee scoring system to eliminate the ceiling effect. Clinical Orthopaedics and Related Research. 2012;470(2):584–593. doi: 10.1007/s11999-011-2203-5. [DOI] [PMC free article] [PubMed] [Google Scholar]
- 35.Maheshwari AV, Tsailas PG, Ranawat AS, et al. How to address the patella in revision total knee arthroplasty. The Knee. 2009;16(2):92–97. doi: 10.1016/j.knee.2008.08.003. [DOI] [PubMed] [Google Scholar]
- 36.Chinzei N, Ishida K, Matsumoto T, et al. Evaluation of patellofemoral joint in ADVANCE Medial-pivot total knee arthroplasty. International Orthopaedics. 2014;38(3):509–515. doi: 10.1007/s00264-013-2043-x. [DOI] [PMC free article] [PubMed] [Google Scholar]
- 37.Matz J, Lanting BA, Howard JL. Understanding the patellofemoral joint in total knee arthroplasty. Canadian Journal of Surgery. 2019;62(1):57–65. doi: 10.1503/cjs.001617. [DOI] [PMC free article] [PubMed] [Google Scholar]
- 38.Konno T, Onodera T, Nishio Y, et al. Correlation between knee kinematics and patellofemoral contact pressure in total knee arthroplasty. Journal of Arthroplasty. 2014;29(12):2305–2308. doi: 10.1016/j.arth.2014.07.020. [DOI] [PubMed] [Google Scholar]
- 39.Conrad DN, Dennis DA. Patellofemoral crepitus after total knee arthroplasty: Etiology and preventive measures. Clinics in Orthopedic Surgery. 2014;6(1):9–19. doi: 10.4055/cios.2014.6.1.9. [DOI] [PMC free article] [PubMed] [Google Scholar]
- 40.Fukunaga K, Kobayashi A, Minoda Y, et al. The incidence of the patellar clunk syndrome in a recently designed mobile-bearing posteriorly stabilised total knee replacement. Journal of Bone and Joint Surgery. British Volume. 2009;91(4):463–468. doi: 10.1302/0301-620X.91B4.21494. [DOI] [PubMed] [Google Scholar]
- 41.Malo M, Vince KG. The unstable patella after total knee arthroplasty: Etiology, prevention, and management. Journal of American Academy of Orthopaedic Surgeons. 2003;11(5):364–371. doi: 10.5435/00124635-200309000-00009. [DOI] [PubMed] [Google Scholar]
- 42.Kujala UM, Jaakkola LH, Koskinen SK, et al. Scoring of patellofemoral disorders. Arthroscopy. 1993;9(2):159–163. doi: 10.1016/S0749-8063(05)80366-4. [DOI] [PubMed] [Google Scholar]
- 43.Jones CW, Jacobs H, Shumborski S, et al. Sagittal stability and implant design affect patient reported outcomes after total knee arthroplasty. Journal of Arthroplasty. 2020;35(3):747–751. doi: 10.1016/j.arth.2019.10.020. [DOI] [PubMed] [Google Scholar]
- 44.Pritchett JW. Patients prefer a bicruciate-retaining or the medial pivot total knee prosthesis. Journal of Arthroplasty. 2011;26(2):224–248. doi: 10.1016/j.arth.2010.02.012. [DOI] [PubMed] [Google Scholar]


