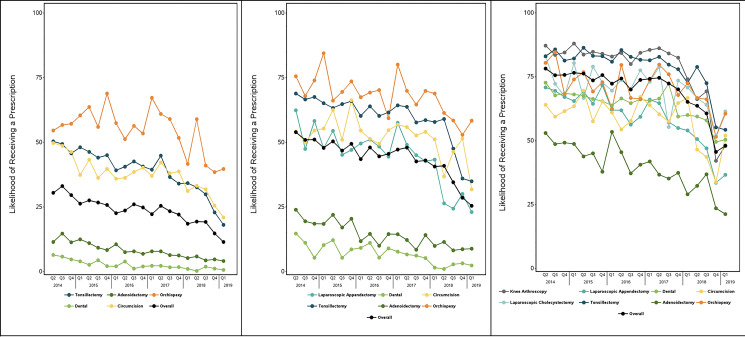
FIGURE 1.
Percentage of children who received a prescription for opioids after surgery, overall and by procedure, 2014 to 2019. Each figure displays, by year, the percentage of children undergoing a given surgery who did not receive a prescription for opioids when an equivalent recovery without opioids was considered possible. Panels contain data for the relevant procedures specific to the 3 age groups: A, Infant to 4 years of age; B, 5 to 10 years age; and C, 11 to 17 years of age.

