Abstract
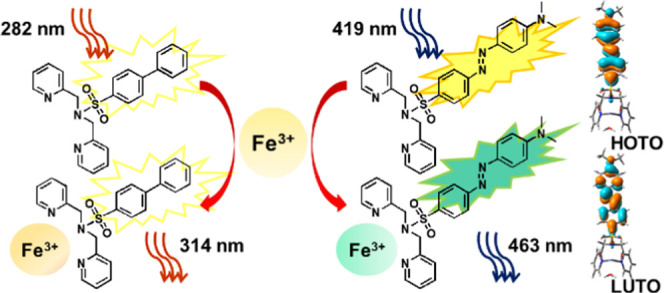
We have synthesized two ligand systems, N(SO2)(R1)dpa (L1) and N(SO2)(R2)dpa (L2), where R1 = biphenyl and R2 = azobenzene, which are sulfonamide derivatives of the NNN-donor chelating dipicolylamine. Both L1 and L2 can be used as sensors for detecting Fe3+ and are highly sensitive and selective over a wide range of common cations. Time-dependent density functional theory (TDDFT) calculations confirmed that the key excitations of L2 and the [Fe(L2)(H2O)3]3+ model complex involve −R2-unit-based π and π* charge transfer. L2 demonstrates a relatively high photostability, a fluorescence turn-on mechanism, and a detection limit of 0.018 μM with 1.00 μM L2 concentration, whereas L1 has a detection limit of 0.67 μM. Thus, both ligands have the potential to be used as fluorosensors for the detection of Fe3+ in aqueous solutions.
1. Introduction
Iron is the fourth most abundant element in Earth’s crust and the most abundant transition metal in living systems.1,2 Iron exhibits important biological functions, such as participation in electron transfer reactions, gene regulation, binding and transport of oxygen through hemoglobin and myoglobin, and regulation of cell growth.3,4 Thus, iron deficiency may lead to major health problems. Similarly, the accumulation of higher concentrations of iron in cells is also problematic and leads to “iron toxicity” caused by free radical formation. These radicals attack and damage cellular substances, leading to cell death.5 Furthermore, a high concentration of iron in cells may cause several diseases such as certain types of cancers, malfunction of the heart, pancreas, and liver-like organs, etc.6,7 Thus, detection of iron in living systems and determination of iron uptake from dietary supplies are equally important. In addition to living systems, the determination of iron in environmental samples is also essential since Fe3+ plays a major role in controlling dissolved concentrations, mobility, and toxicity of other trace metals in natural waters by coprecipitating with hydrous iron oxide and hydroxides.8
Several instrumental techniques are available for the detection of total iron, such as atomic absorption spectroscopy,9,10 inductively coupled plasma mass spectrometry,11 colorimetry,12 and cyclic voltammetry.13 However, some of these techniques have several drawbacks such as the inability to determine the redox states of iron, requirement of complicated pretreatment procedures and sophisticated instrumentation,14 lack of selectivity, destruction of the sample, and inability to apply in the field.15 Therefore, the development of highly selective, sensitive, and noninvasive sensors that can be used to obtain real-time local imaging of Fe3+ is an interesting and useful area in analytical chemistry and bioinorganic chemistry.
Fluorescence sensor technology is considered a promising area of research for the detection of environmentally and biologically important cations and anions.16 Some currently available fluorescent probes for detecting iron include dansyl-based probes,17 quinoline-based probes,18 rhodamine-based probes,19 benzimidazole-based probes,20 and naphthyl-based probes.21 However, these probes have several limitations such as lack of water solubility and lack of sensitivity and selectivity.14,17 Another major problem with Fe3+ probes is the presence of a quenching mechanism instead of increasing fluorescence intensity due to the paramagnetic nature of Fe3+. Only a limited number of turn-on fluorescent sensors are available because of the above-mentioned reason.
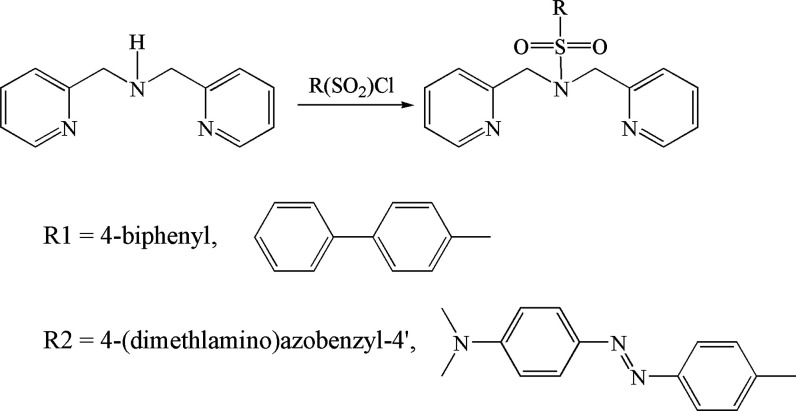
In this study, we have developed two dipicolylamine (DPA)-based ligands into Fe3+ fluorosensors. Since DPA is a symmetric secondary amine that has good reactivity, it can be derivatized easily into various ligand systems with different properties.22 Here, two sulfonamide derivatives of dipicolylamine ligands with two different R groups, N(SO2)(R1)dpa (L1) and N(SO2)(R2)dpa (L2), (Figure 1), where R1 = biphenyl and R2 = azobenzyl, were developed into fluorophores that can detect Fe3+ ions with high sensitivity and selectivity. The L1 ligand was designed by combining the sulfonyl chloride containing biphenyl as the R group with the hydrophobic dipicolylamine and characterization was carried out. The L2 ligand was synthesized using a similar procedure reported in a previous study.23 The ground-state molecular structures were calculated using density functional theory (DFT). Time-dependent DFT calculations gave some insights into the excited states.
Figure 1.
Synthetic routes for the ligand systems; N(SO2)(R1)dpa (L1) and N(SO2)(R2)dpa (L2).
2. Materials and Methods
2.1. Chemicals, Reagents, and Apparatus
All the chemicals used for the synthesis were obtained from Sigma-Aldrich. Chemicals used in fluorescence analysis were of analytical grade and used without further purification. Chloride solutions of K+, Na+, Ca2+, Mg2+, Ba2+, Fe2+, Fe3+, Cd2+, Pb2+, Hg2+, Cu2+, Co2+, Zn2+, and Ni2+ were prepared in double-distilled water.
The 1H NMR spectra were recorded in DMSO-d6 on a Bruker 400 MHz spectrometer. Peak positions are relative to tetramethylsilane (TMS) as a reference. All NMR data were processed with MestReNova software. Fluorescence studies were carried out using a fluorescence spectrometer (Lumina, Thermo Scientific). The UV–visible analysis was performed with a double-beam scanning spectrophotometer (UVD-2960, Labomed).
2.2. Synthesis and Characterization of the Ligands
2.2.1. N(SO2)(bip)dpa Ligand (L1)
A solution of biphenyl-4-sulfonyl chloride (5 mmol) in 25 mL of dioxane was added dropwise over a period of 2 h to a solution of N(H)dpa (10 mmol) in 100 mL of dioxane at 20 °C. The reaction mixture was stirred at room temperature for 24 h and filtered to remove any precipitate, and thereafter, dioxane was completely removed by rotary evaporation. Weakly acidic water (30 mL, pH ∼5) was added to the resulting compound; the product was then extracted into CH2Cl2 (2 × 25 mL), and the CH2Cl2 extracts were combined. The general procedure described above yielded brown-colored, needle-like crystals (1.997 g, 96%). Anal. Calcd for C24H21N3SO2 (%): C, 68.63; H, 05.01; N, 10.44; S, 7.97. Found: C, 67.76; H, 05.21; N, 10.16; S, 7.68. NMR signals (ppm) in DMSO-d6: 8.37 (d, J = 4.80, 2H, H6/H6′), 7.87 (d, J = 8.64, 2H, Ha/Ha′), 7.82 (d, J = 8.68, 2H, Hb/Hb′), 7.73 (d, J = 7.04, 2H, Hc/Hc′), 7.67 (t, J = 7.68, 2H, H4/H4′), 7.43–7.55 (m, 3H, Hd/Hd′ and He), 7.29 (d, J = 7.80, 2H, H3/H3′), 7.20 (t, J = 6.20, 2H, H5/H5′), 4.59 (s, 2CH2). The 1H NMR spectrum of L1 is shown in Figure S1. L2 was synthesized using azobenzyl-4-sulfonyl chloride, and 1H NMR data and elemental analysis data matched with the previously reported data.23
2.3. Fluorescence Analysis
The solubility of the ligands in methanol, acetonitrile, and dimethylsulfoxide (DMSO) was assessed to find a suitable solvent. The stock solutions of both ligands (0.10 mM) were prepared in 2% methanol containing 10.00 mM HEPES (4-(2-hydroxyethyl)-1-piperazineethanesulfonic acid) buffer. The fluorescence spectral range of L1 was observed from 290 to 360 nm with 307 nm excitation wavelength, while for L2, the spectral range was 420–500 nm. Both fluorescence excitation and emission spectra of the free ligands were recorded. In each step, the necessary amounts of cation stock solutions and the ligand stock solutions were mixed in a 10.00 mL volumetric flask and diluted up to the mark. All the tests were carried out at 7.4 pH using HEPES buffer.
2.4. Computational Studies
Ground-state structure optimizations were carried out using density functional theory (DFT), as implemented in the Gaussian16 program (version RevC.01).24 The PBE1PBE functional,25 including Grimme’s dispersion and the Becke–Johnson damping, was employed.26 The SDD27,28 basis set and the associated effective core potential were used for Fe, and the 6-31G(d)29−32 basis sets were applied for the other atoms. The polarizable continuum model (PCM)33−35 was used as the implicit solvent model, where methanol (ε = 32.613) was the solvent. Vibrational frequency calculations confirmed that the optimized structures were local minima (i.e., no imaginary frequency). Vertical excitation energies were calculated using time-dependent density functional theory (TDDFT). The wB97X-D functional, the basis sets described above, and the PCM were employed for TDDFT calculations.
3. Results and Discussion
3.1. Selecting Suitable Experimental Conditions
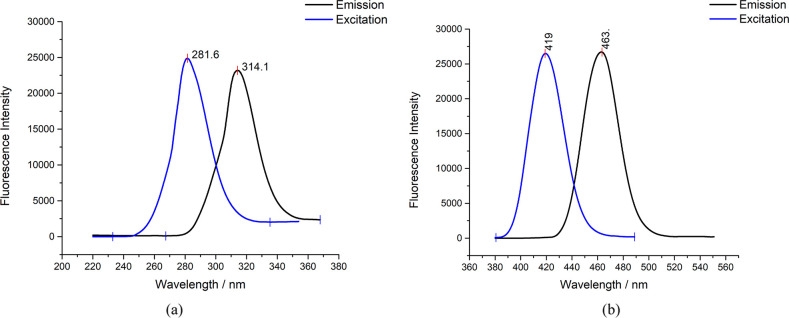
Initially, 2% methanol was selected as the suitable solvent to prepare stock solutions of ligands because of the high solubility of the ligands and relatively low toxicity of methanol. The actual methanol concentration in working solutions was always below 0.02%, and therefore, the effect of the variation of methanol concentration can be neglected. The fluorescence excitation and emission spectra of L1 and L2 are shown in Figure 2. L2 has a higher Stokes shift and fluorescence emission in the visible range. Peak intensities for the fluorescence emissions of L1 and L2 were 314 and 463 nm, respectively. Out of L1 and L2, L2 holds more promise for biological species detection in cell environments and in situ imaging since its emission is in the visible range.
Figure 2.
Excitation and emission spectra of (a) N(SO2)(bip)dpa and (b) N(SO2)(azobenz)dpa ligands in 0.2% methanol solution with 10.00 mM HEPES buffer.
The photostability of L1 and L2 was determined using fluorescence measurements recorded at 2 min intervals for 2 h by irradiating the samples under a 150 W xenon light source. According to the photostability graphs, L2 showed a constant fluorescence intensity, while the fluorescent emission of L1 decreased gradually with consecutive irradiations. The photostability data of L1 and L2 are shown in Figure S2. The experimental data clearly state that L2 has good photostability and is resistant to photobleaching.
3.2. Study of the Fluorescence Intensity of Metal–Ligand Complexes
The fluorescence intensities of ligand–metal complexes were studied to find the selectivity of the ligands to metal ions. According to the experimental data shown in Figure 3, the fluorescence intensity of N(SO2)(bip)dpa (L1) was quenched selectively by the addition of Fe3+ and Zn2+ ions compared to other metal ions investigated. A significant decrease in the fluorescence intensity of L1 was observed with the addition of Fe3+ compared with Zn 2+ ions. Similar behavior was reported with the N(SO2)(dansyl)dpa ligand for Fe3+ ions.17
Figure 3.
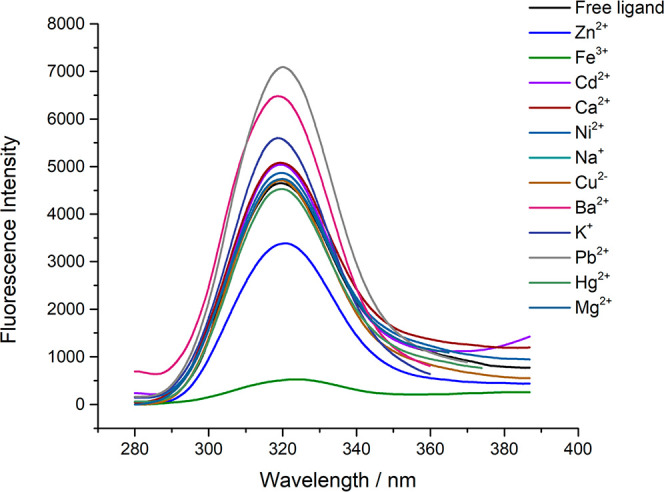
Fluorescence intensity change with different metals (100.00 μM) of L1 (5.00 μM) in 10 mM HEPES buffer.
Further investigations were carried out to determine the behavior of L1 with different Fe3+ concentrations, and the fluorescence data are given in Figure S3. It was observed that higher Fe3+ concentrations (>70.0 μM) show fluorescence quenching as expected; however, with decreasing ferric concentrations, the fluorescence intensity suddenly started to increase at around 70.0 μM Fe3+ concentration when the ligand concentration was 10.00 μM according to Figure S3a. Similar behavior was observed at ferric concentrations less than 10.0 μM with 1.00 μM ligand concentration according to Figure S3b. This is the first observation of such behavior for these types of ligands. A possible reason could be that at lower Fe3+ concentrations, there is a termination of the photoinduced electron transfer (PET) mechanism, which leads to the fluorescence increase, and at higher Fe3+ concentrations, the electron transfer mechanism takes place from the ligand to the metal.36
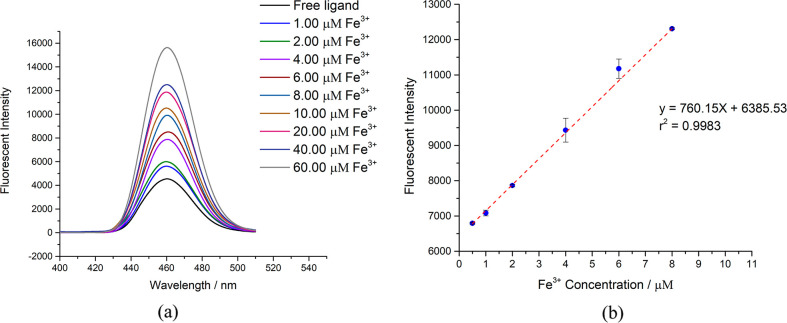
The fluorescence emission of the N(SO2)(R2)dpa ligand with different metal ions is shown in Figure 4a at pH 7.4. The fluorescence intensity values of the ligand at 463 nm with different metal concentrations are represented in Figure 4b. The highest fluorescence intensity variation was observed for Fe3+ ions as for L2. The fluorescent intensity of L2 increased with a gradual increase of the Fe3+ concentration, which is contrary to L1. This behavior remained unchanged when the Fe3+ concentration increased to 60.0 μM. The increase in fluorescence is significant since most available Fe3+-detecting fluorescence probes have a quenching mechanism.37
Figure 4.
Fluorescence intensity change with (a) different metal ion solutions (100.00 μM) and (b) different Fe3+ concentrations in L2 (5.00 μM) at pH 7.4.
3.3. Calibration Curve for the Fluorescence Response to Different Fe3+ Concentrations
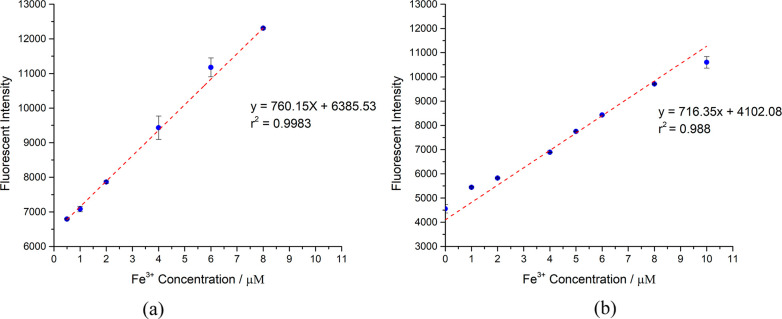
The relationship between the fluorescence intensity of the Fe3+–L1 complex and the concentration of Fe3+ in the range of 1.0–8.0 μM was studied. The fluorescence intensity of the complex increased linearly with the increasing Fe3+ concentrations with R = 0.998, as shown in Figure 5a. The good linearity of the data demonstrated that the fluorescence of the Fe3+–L1 complex could be used for the quantitative determination of Fe3+. The detection limit of the quantitative method was determined with 10 blank samples containing 1.00 μM biphenyl ligand and 10.00 mM HEPES buffer at pH = 7.4. The mean intensity and the standard deviation of the blank samples were 4984 and 194, respectively, and the calculated detection limit was 0.67 μM. The L1 system can be used to determine the Fe3+ concentration of samples in the range of 1.0–8.0 μM with a ligand concentration of 1.00 μM.
Figure 5.
Fluorescence intensity increase with different Fe3+ concentrations in (a) N(SO2)(bip)dpa ligand (1.00 μM) and (b) N(SO2)(azobenz)dpa ligand (5.00 μM) at pH 7.4.
To find the relationship between L2 and Fe3+, a calibration plot was constructed for Fe3+ concentrations in the range of 0.5–8 μM with a ligand concentration of 5.00 μM. The standard deviation of 10 blank samples was calculated as 175 at 463 nm. The calibration curve has R = 0.988 and 0.89 μM detection limit (Figure 5b). The calibration curve constructed for the 1.00 μM L2 concentration demonstrated 0.018 μM detection limit with 41.72 standard deviation (see Figure S4).
3.4. Study of Metal Interferences
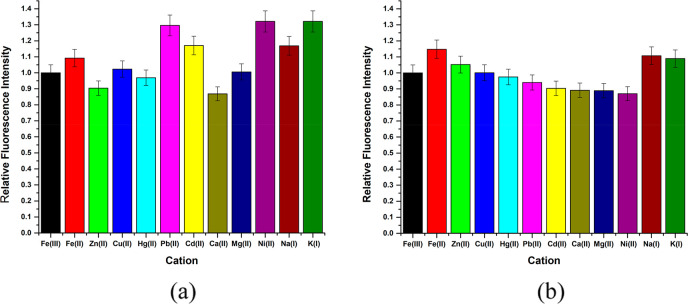
It is of utmost importance to study the possible interferences for an analytical method to ensure its accuracy. The lack of high selectivity toward Fe3+ ions under experimental consideration could lead to erroneous results. To assess the possible metal-ion interferences, 5.00 μM L1 and L2 solutions were prepared separately with 10.00 μM Fe3+ concentration, and the probable interfering metals at 100.00 μM were added. The relative fluorescence intensities in the presence of different metal ions (Zn2+, Fe2+, Cd2+, Ca2+, Cu2+, Pb2+, Hg2+, Mg2+, K+, and Na+) are shown in Figure 6. For L1, the highest interferences are from K+, Pb2+, Ni2+, and Cd2+ cations. However, Ni2+, Cd2+, and Pb2+ concentrations are significantly low in biological samples in comparison with iron species.38 Thus, the interferences from these can be neglected when the probe is used for biological samples. The interference from K+ is relatively high. Therefore, to use L1 as a Fe3+-detecting fluorophore, a prior understanding of the presence of K+ is essential. As in L1, the highest interference for L2 was from Fe2+ ions. The observation is quite obvious due to the presence of an equilibrium between iron +2 and +3 oxidation states. However, the fluorescence intensity changes with each considered cation can be taken as a negligible value. Hence, the ligand system with azobenzene as the R group can be used as a suitable fluorophore for Fe3+ determination in complex metal ion solutions.
Figure 6.
Effect of other metals (100.00 μM) on the metal–ligand systems with Fe3+ 10.00 μM and (a) L1 and (b) L2 at 5.00 μM at 7.4 pH interpreted as normalized fluorescence intensity.
3.5. Determination of pH Effects on the Metal–Ligand Fluorescence Intensities
Since pH can be a key factor that affects the stability of the metal–ligand complex, the fluorescence spectra were recorded for the L1–Fe3+ system at different pH levels (Figure S5a). The results indicate that between pH 5 and 10, there is no considerable deviation of the peak height compared to that at pH 7.4. However, small shifts in peaks can be observed in other pH levels in addition to physiological pH. Since the pH levels of these systems were adjusted with the addition of H+ ions and OH– ions, the absence of HEPES buffer can be the reason for the peak shifts. Since there is a minimum effect on the fluorescence intensity by pH 5–10, the stability of the metal–ligand complex can be considered to be high. In addition, the fluorescence intensity decreases at only extreme pH levels, and these conditions are rarely observed in physiological and environmental samples. Similar results were observed in the L2–Fe3+ system (Figure S5b).
3.6. Observation Under an UV Lamp
Since the N(SO2)(azobenz)dpa ligand gives intense fluorescence emission in the visible region with Fe3+, the complex was observed under an UV lamp. The ligand concentration was 5.00 μM, and four solutions were prepared with the cation concentrations of 0.00, 0.50, 1.00, and 5.00 μM. The colors observed by the naked eyes are equivalent to the UV–Vis data and the fluorescence data for the complex. Blue-green, fluorescent light was observed with increasing color intensity with the metal concentration under UV light (Figure S6). The blue-green color fluorescence is due to the emission that is around 460 nm, resulting from the absorption near 400 nm. With the emission of these colors, the complex can be utilized for observation under a simple fluorescent microscope.
3.7. UV–Visible Absorption Changes of the Ligands with the Addition of Fe3+
For further investigation of the behavior of N(SO2)(R1)dpa with ferric ions, UV–Visible spectra of the ligand–Fe3+ systems were recorded, and the data are given in Figure S7a. For 10.00 μM ligand in 10 mM HEPES buffer and 0.02% (v/v) methanol solution, it was observed that there are two major peaks at 204 and 267 nm. These two peaks can be assigned to the intraligand π–π* and n−π* transitions, respectively, with the availability of heterocyclic, conjugate, aromatic structures.39 According to a previous study, dipicolylamine in hexane has three significant peaks even if L1 shows only two major peaks.40 The reason can be the presence of a polar solvent (0.02% (v/v) methanol) instead of nonpolar hexane. A high increase in absorbance in the ligand–ferric system corresponds to a significant fluorescence change.
The UV–Vis absorbance of L2 and the Fe3+–ligand system UV–Vis absorption spectra were recorded, and data are given in Figure S7b. The ligand concentration of both samples was 0.50 μM, and one sample had 1.00 μM ferric ion concentration. Three major absorption peaks were observed for the N(SO2)(azobenz)dpa ligand system at 199, 260, and 418 nm wavelengths. As in L1, the reason for the first two peaks can be π–π* transitions in aromatic pyridyl rings in the structure. With the addition of Fe3+, all three absorption peaks were increased, indicating the availability of a higher number of electron transitions.
3.8. Observations with the Addition of Ethylenediaminetetraacetic Acid (EDTA) into the Ligand–Metal Systems
To obtain a better understanding of metal–ligand system behaviors, a strong chelating agent, EDTA, was added, and changes in the fluorescent signal were recorded, and the data are shown in Figure S8. As per Figure S8a, with the addition of EDTA, the quenched fluorescence intensity of L1 can be recovered up to a certain extent. Likewise, L2’s increased fluorescence intensity with ferric concentration decreased when EDTA was added, as shown in Figure S8b. Since EDTA is an effective chelating agent for Fe3+ ions, it forms a stable complex. With these results, it is clear that the ligands show reversible fluorescence changes due to Fe3+ ions, and the ligand can be recovered from the Fe3+–ligand system.
Interestingly, the above-mentioned results can be used to explain the possible quenching mechanism for the L1 system. According to Yang et al.,17 similar behavior was revealed by a similar type of ligand, which has dansyl as the R group [N(SO2)(dansyl)dpa], illustrating two major reasons for fluorescence quenching. These two possible mechanisms are fluorescence resonance energy transfer (FRET) and electron transfer between DPA (strong nucleophile) and Fe3+ ions, which have a strong electron accepting ability. They have used two ligand systems: one with DPA and the other without DPA. Even though both ligand systems have shown a fluorescence decrease with ferric ions, only the DPA system has had fluorescence recovery with EDTA. Furthermore, the fluorescence signal has not been recovered to its initial full intensity. With these results, Yang et al. suggested that the Fe3+–ligand system has both mechanisms in action.17 Expanding the above-mentioned results into our study, since L1 displays a similar type of observations, there is a possibility of the presence of both FRET and electron transfer mechanisms here as well.
3.9. Computational Studies
Key structural parameters of the optimized structure of L2 are in good agreement with the X-ray structure (Table 1). Despite a number of attempts, we were unable to obtain single crystals of a Fe complex with L2. Thus, we have created two model complexes, [Fe(L2)(H2O)3]3+ and [Fe(L2)]3+. In the [Fe(L2)(H2O)3]3+ model system, L2 occupies three coordination sites and three water molecules occupy three coordination sites, making a Fe3+ complex with an approximate octahedral (Oh) symmetry. For a formal Fe3+ complex in an Oh symmetry, three spin states, S = 1/2, 3/2, and 5/2, are possible. Key structural parameters of the optimized structures of three spin states are summarized in Table 1.
Table 1. Key Structural Parameters of the X-Ray Structures of L2 and Optimized Structures of L2 and the [Fe(L2)(H2O)3]3+ Complex.
| L2 |
[Fe(L2)(H2O)3]3+ |
||||
|---|---|---|---|---|---|
| experimental | calculated | S = 1/2 calculated | S = 3/2 calculated | S = 5/2 calculated | |
| S1–O1 | 1.432 | 1.46 | 1.46 | 1.46 | 1.46 |
| S1–O2 | 1.435 | 1.46 | 1.46 | 1.46 | 1.46 |
| S1–N2 | 1.62 | 1.65 | 1.71 | 1.72 | 1.72 |
| S1–C13 | 1.765 | 1.77 | 1.76 | 1.76 | 1.76 |
| N1–C1 | 1.347 | 1.33 | 1.34 | 1.34 | 1.34 |
| N1–C5 | 1.345 | 1.34 | 1.34 | 1.34 | 1.34 |
| N2–C6 | 1.469 | 1.47 | 1.48 | 1.48 | 1.48 |
| N2–C7 | 1.461 | 1.46 | 1.48 | 1.48 | 1.48 |
| N3–C12 | 1.345 | 1.34 | 1.34 | 1.34 | 1.34 |
| N3–C8 | 1.35 | 1.39 | 1.34 | 1.34 | 1.34 |
| Fe1–N1 | 2.02 | 2.16 | 2.16 | ||
| Fe1–N2 | 2.40 | 2.39 | 2.39 | ||
| Fe1–N3 | 2.02 | 2.17 | 2.17 | ||
| O1–S1–O2 | 119.19 | 119.7 | 120.6 | 120.5 | 120.5 |
| O1–S1–N2 | 108.12 | 107.4 | 104.8 | 105.0 | 105.0 |
| O2–S1–N2 | 106.19 | 106.4 | 104.8 | 105.0 | 105.0 |
| C6–N2–C7 | 118.1 | 117.8 | 114.3 | 113.4 | 113.4 |
| C6–N2–S1 | 118.9 | 118.3 | 113.2 | 111.9 | 112.0 |
| C7–N2–S1 | 120.6 | 120.7 | 113.0 | 111.8 | 111.8 |
| N1–C5–C6 | 116.2 | 113.8 | 118.1 | 117.6 | 117.6 |
| C1–N1–C5 | 116.8 | 117.9 | 119.3 | 119.1 | 119.1 |
| C12–N3–C8 | 116.56 | 117.7 | 119.3 | 119.1 | 119.1 |
| N1–Fe1–N3 | 85.8 | 81.2 | 73.8 | ||
| N3–Fe1–C12 | 23.3 | 21.5 | 39.7 | ||
| N1–Fe1–C1 | 23.4 | 21.6 | 21.6 | ||
The ground state of the complex is S = 3/2, where the computed spin densities, ρ(Fe) of 3.84 and ρ(−R2) of −0.98, indicated that four unpaired electrons of Fe are antiferromagnetically coupled to the unpaired electron on the −R2 unit, as shown in Figure 7. Therefore, the ground state of the complex shows a Fe(IV)-R2-radical character. The computed ⟨S2⟩ of the S = 3/2 optimized structure of 4.82 is closer to the ideal value (4.75).
Figure 7.
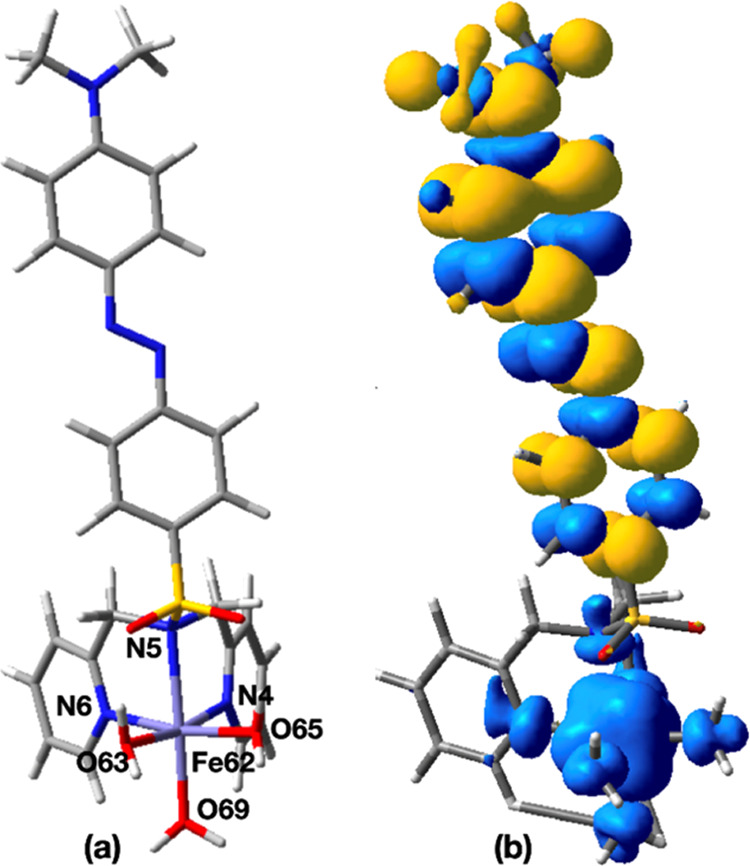
(a) Optimized structure of the S = 3/2 state of the [Fe(L2)(H2O)3]3+ complex. (b) Total spin density distribution of the S = 3/2 state of the optimized [Fe(L2)(H2O)3]3+ complex.
The optimized structure of the S = 5/2 state is only 0.4 kcal/mol higher than the ground state. Computed spin densities of ρ(Fe) of 3.84 and ρ(−R2) of 0.99 indicate the Fe(IV)(R2-radical) nature, where the four unpaired electrons of Fe are ferromagnetically coupled to the unpaired electron on the −R2 unit. The computed ⟨S2⟩ value of S = 5/2 of 8.81 is similar to the ideal value (8.75). The optimized structure of the S = 1/2 state is 23.1 kcal/mol higher than the ground state, where the computed spin density, ρ(Fe) of 2.04 and ρ(−R2) of −0.57, indicates the Fe(IV)(R2-radical) nature. Based on the DFT calculations, we concluded that the ground state of the [Fe(L2)(H2O)3]3+ complex is S = 3/2 and has the Fe(IV)(R2-radical) form. A qualitatively similar electronic structure was found for [Fe(L2)]3+, where the S = 3/2 ground state optimized structure has a distorted Oh shape, and the computed spin densities [ρ(Fe) of 3.84 and ρ(−R2) of −0.93] indicated the Fe(IV)(R2-radical) character. The S = 5/2 state of the [Fe(L2)]3+ complex is only 0.01 kcal/mol above the ground state. The computed spin densities of the S = 5/2 states, ρ(Fe) of 3.84 and ρ(−R2) of 0.98, also indicated the Fe(IV)(R2-radical) character
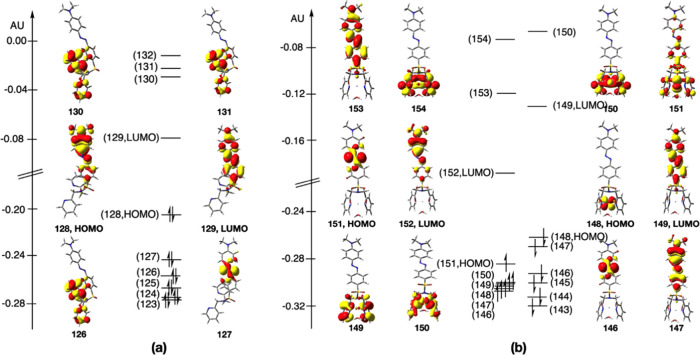
Kohn–Sham frontier orbitals of the ground-state-optimized structures of L2 and the [Fe(L2)(H2O)3]3+ complex are shown in Figure 8. The highest occupied molecular orbital (HOMO) and the lowest unoccupied molecular orbital (LUMO) of L2 are delocalized on the −R2 unit and showed π and π* characters, respectively. In the case of the [Fe(L2)(H2O)3]3+ complex, the HOMO and LUMO in the spin-α manifold are −R2 unit-based orbitals, while the HOMO and LUMO of the spin-β manifold are Fe- and −R2 unit-based, respectively. The computed HOMO–LUMO gap of L1 of 5.09 eV is relatively large compared to that of the [Fe(L2)(H2O)3]3+ complex (spin-α manifold: 2.64 eV and spin-β manifold: 3.70 eV).
Figure 8.
Kohn–Sham frontier orbitals of the ground-state-optimized structures of (a) L2 and (b) [Fe(L2)(H2O)3]3+.
Starting from the optimized ground-state structures of L2 and [Fe(L2)(H2O)3]3+ complex, vertical excitations were calculated. The key excitation of L2 occurred at 457 nm (f = 1.22), which is qualitatively in agreement with the experimental excitation, 419 nm. According to the computed natural transition orbitals (NTOs), the key excitation of L2 involved −R2 unit-based π and π* charge transfer (see the Supporting Information for the computed NTOs). The key excitation of the [Fe(L2)(H2O)3]3+ complex also showed −R2 unit-based π and π* charge transfer (i.e., ligand-centered charge transfer,1LC) excitation at 453 nm (f = 1.09) (see the Supporting Information for the computed NTOs). Also, a relatively weak Fe-dpa to −R2 unit-π* charge transfer (i.e., metal–ligand-to-ligand charge transfer, 1MLLCT) occurred at 340 nm (f = 0.14). Thus, 1LC and 1MLLCT excited states of [Fe(L2)(H2O)3]3+ would be important for its photophysical properties.
4. Conclusions
Two novel compounds, based on sulfonamide derivatives of the dipicolylamine moiety, with two different R groups, were developed as fluorescent probes for the detection of Fe3+. N(SO2)(bip)dpa (L1) had a low photostability and small Stokes shift. However, the ligand exhibits a fluorescence increasing and decreasing mechanism selectively with the Fe3+ concentration. The calibration curve for the fluorescence increasing region had a lower detection limit of 0.67 μM, implying that the sensitivity of the probe is quite high at pH 7.4. The Fe3+–L1 system had minimum interferences from other common cations and pH. Even though the ligand has high sensitivity and moderate selectivity toward the +3 oxidation state of iron, its applicability in biological systems is low due to the UV region emission spectrum. On the other hand, N(SO2)(azobenz)dpa (L2) displays an excellent photostability, larger Stokes shift, and the fluorescence is selective to Fe3+ ions. The fluorescence emission of L2 was observed around 460 nm, and observations under the UV lamp indicated that the fluorescent probe has the capability of visual detection of Fe3+ ions. The limit of detection of the probe was found to be 0.018 for 1.00 μM L2 concentration and had minimum interferences from other metal cations, implying that both the sensitivity and selectivity of the probe are very high at pH 7.4.
The [Fe(L2)(H2O)3]3+ model complex shows the Fe(IV)(R2-radical) nature in its ground state, S = 3/2. The key excitation of L2 and [Fe(L2)(H2O)3]3+ involves −R2 unit-based π and π* charge transfer.
It can be concluded that the N(SO2)(azobenz)dpa ligand has a much larger suitability for application as a biological Fe3+ detection chemosensor, and both ligands have the potential to be utilized as sensors in biological, environmental, and industrial samples with a low iron content. Both ligands form a reversible system with Fe3+, and the ligands can be recovered with EDTA.
Acknowledgments
This work was supported by the University of Sri Jayewardenepura under the research grant ASP/01/RE/SCI/2018/22. The Instrument Centre of the Faculty of Applied Sciences, University of Sri Jayewardenepura, is acknowledged. Super computing resources at the Academic Center for Computing at Media Studies at Kyoto University in Japan and the Institute of Molecular Science in Japan are also acknowledged.
Supporting Information Available
The Supporting Information is available free of charge at https://pubs.acs.org/doi/10.1021/acsomega.2c02862.
1H NMR spectra for L1, photostability results of the two ligands, fluorescence intensity change of L1 and L2 with different Fe3+ concentrations, effects of pH on each metal–ligand system, colors of the Fe3+–L2 complex under visible light and UV light, UV–visible absorbance of the two ligands, and fluorescence change with EDTA and TDDFT results of two model systems (PDF)
Author Contributions
N.N.V.: formal analysis, methodology, data curation, and writing the original draft. C.K.: formal analysis and methodology. T.P.: methodology, conceptualization, supervision, writing, and editing. S.P.D.: methodology, conceptualization, and supervision. W.M.C.S.: computational studies, writing, and editing. A.T.C.: resources, methodology, conceptualization, supervision, and writing—review and editing.
The authors declare no competing financial interest.
Notes
All the data underlying the results are available as part of the article and the Supporting Information, and no additional source data are required.
Supplementary Material
References
- Aron A. T.; Reeves A. G.; Chang C. J. Activity-Based Sensing Fluorescent Probes for Iron in Biological Systems. Curr. Opin. Chem. Biol. 2018, 43, 113–118. 10.1016/j.cbpa.2017.12.010. [DOI] [PMC free article] [PubMed] [Google Scholar]
- Ilgen A. G.; Kukkadapu R. K.; Leung K.; Washington R. E. “Switching on” Iron in Clay Minerals. Environ. Sci.: Nano 2019, 6, 1704–1715. 10.1039/C9EN00228F. [DOI] [Google Scholar]
- Galaris D.; Barbouti A.; Pantopoulos K. Iron Homeostasis and Oxidative Stress: An Intimate Relationship. Biochim. Biophys. Acta 2019, 1866, 118535 10.1016/j.bbamcr.2019.118535. [DOI] [PubMed] [Google Scholar]
- Yiannikourides A.; Latunde-Dada G. A Short Review of Iron Metabolism and Pathophysiology of Iron Disorders. Medicines 2019, 6, 85. 10.3390/medicines6030085. [DOI] [PMC free article] [PubMed] [Google Scholar]
- Eid R.; Arab N. T. T.; Greenwood M. T. Iron Mediated Toxicity and Programmed Cell Death: A Review and a Re-Examination of Existing Paradigms. Biochim. Biophys. Acta 2017, 1864, 399–430. 10.1016/j.bbamcr.2016.12.002. [DOI] [PubMed] [Google Scholar]
- Corradini E.; Buzzetti E.; Pietrangelo A. Genetic Iron Overload Disorders. Mol. Aspects Med. 2020, 75, 100896 10.1016/j.mam.2020.100896. [DOI] [PubMed] [Google Scholar]
- Duck K. A.; Connor J. R. Iron Uptake and Transport across Physiological Barriers. BioMetals 2016, 29, 573–591. 10.1007/s10534-016-9952-2. [DOI] [PMC free article] [PubMed] [Google Scholar]
- Lunvongsa S.; Oshima S. M.; Motomizu S. Determination of Total and Dissolved Amount of Iron in Water Samples Using Catalytic Spectrophotometric Flow Injection Analysis. Talanta 2006, 68, 969–973. 10.1016/j.talanta.2005.06.067. [DOI] [PubMed] [Google Scholar]
- Almeida J. S.; Santos G. L.; Brandão G. C.; Korn M. G. A.; Teixeira L. S. G. Multivariate Optimization of Ultrasound-Assisted Extraction Using Doehlert Matrix for Simultaneous Determination of Fe and Ni in Vegetable Oils by High-Resolution Continuum Source Graphite Furnace Atomic Absorption Spectrometry. Food Chem. 2019, 273, 130–135. 10.1016/j.foodchem.2018.01.112. [DOI] [PubMed] [Google Scholar]
- Antunes G. A.; Dos Santos H. S.; Da Silva Y. P.; Silva M. M.; Piatnicki C. M. S.; Samios D. Determination of Iron, Copper, Zinc, Aluminum, and Chromium in Biodiesel by Flame Atomic Absorption Spectrometry Using a Microemulsion Preparation Method. Energy Fuels 2017, 31, 2944–2950. 10.1021/acs.energyfuels.6b03360. [DOI] [Google Scholar]
- Kim P.; Weiskirchen S.; Uerlings R.; Kueppers A.; Stellmacher F.; Viveiros A.; Zoller H.; Weiskirchen R. Quantification of Liver Iron Overload Disease with Laser Ablation Inductively Coupled Plasma Mass Spectrometry. BMC Med. Imaging 2018, 18, 51. 10.1186/s12880-018-0291-3. [DOI] [PMC free article] [PubMed] [Google Scholar]
- Liang Z. Q.; Wang C. X.; Yang J. X.; Gao H. W.; Tian Y. P.; Tao X. T.; Jiang M. H. A Highly Selective Colorimetric Chemosensor for Detecting the Respective Amounts of Iron(II) and Iron(III) Ions in Water. New J. Chem. 2007, 31, 906–910. 10.1039/b701201m. [DOI] [Google Scholar]
- Nguyen L. D.; Nguyen T. S. V.; Huynh T. M.; Baptist R.; Chanh Duc Doan T.; Dang C. M. Voltammetric Determination of Iron(III) Using Sputtered Platinum Thin Film. Electrochim. Acta 2019, 320, 134607 10.1016/j.electacta.2019.134607. [DOI] [Google Scholar]
- Sahoo S. K.; Sharma D.; Ber R. K.; Crisponi G.; Callan J. F. Iron(III) Selective Molecular and Supramolecular Fluorescent Probes. Chem. Soc. Rev. 2012, 41, 7195–7227. 10.1039/c2cs35152h. [DOI] [PubMed] [Google Scholar]
- Ghosh K.; Rathi S.; Kushwaha R. Sensing of Fe(III) Ion via Turn-on Fluorescence by Fluorescence Probes Derived from 1-Naphthylamine. Tetrahedron Lett. 2013, 54, 6460–6463. 10.1016/j.tetlet.2013.09.066. [DOI] [Google Scholar]
- Zhu X.; Duan Y.; Li P.; Fan H.; Han T.; Huang X. A Highly Selective and Instantaneously Responsive Schiff Base Fluorescent Sensor for the “Turn-off” Detection of Iron(III), Iron(II), and Copper(II) Ions. Anal. Methods 2019, 11, 642–647. 10.1039/C8AY02526F. [DOI] [Google Scholar]
- Yang M.; Sun M.; Zhang Z.; Wang S. A Novel Dansyl-Based Fluorescent Probe for Highly Selective Detection of Ferric Ions. Talanta 2013, 105, 34–39. 10.1016/j.talanta.2012.11.066. [DOI] [PubMed] [Google Scholar]
- Zhang B.; Liu H.; Wu F.; Hao G. F.; Chen Y.; Tan C.; Tan Y.; Jiang Y. A Dual-Response Quinoline-Based Fluorescent Sensor for the Detection of Copper (II) and Iron(III) Ions in Aqueous Medium. Sens. Actuators, B 2017, 243, 765–774. 10.1016/j.snb.2016.12.067. [DOI] [Google Scholar]
- Weerasinghe A. J.; Schmiesing C.; Varaganti S.; Ramakrishna G.; Sinn E. Single- and Multiphoton Turn-On Fluorescent Fe3+ Sensors Based on bis(rhodamine). J. Phys. Chem. B 2010, 114, 9413–9419. 10.1021/jp1034568. [DOI] [PubMed] [Google Scholar]
- Lee D. Y.; Singh N.; Jang D. O. Fine Tuning of a Solvatochromic Fluorophore for Selective Determination of Fe3+: A New Type of Benzimidazole-Based Anthracene-Coupled Receptor. Tetrahedron Lett. 2011, 52, 1368–1371. 10.1016/j.tetlet.2011.01.077. [DOI] [Google Scholar]
- Ghosh S.; Dey C. K.; Manna R. Epoxy-Based Polymer Bearing 1-Naphthylamine Units: Highly Selective Fluorescent Chemosensor for Ferric Ion. Tetrahedron Lett. 2010, 51, 3177–3180. 10.1016/j.tetlet.2010.04.016. [DOI] [Google Scholar]
- Thushara N.; Darshani T.; Samarakoon S. R.; Perera I. C.; Fronczek F. R.; Sameera W. M. C.; Perera T. Synthesis, Characterization and Biological Evaluation of Dipicolylamine Sulfonamide Derivatized Platinum Complexes as Potential Anticancer Agents. RSC Adv. 2021, 11, 17658–17668. 10.1039/D1RA00842K. [DOI] [PMC free article] [PubMed] [Google Scholar]
- Maladeniya C.; Darshani T.; Samarakoon S. R.; Fronczek F. R.; Sameera W. M. C.; Perera I. C.; Perera T. Biological Evaluation of Platinum(II) Sulfonamido Complexes: Synthesis, Characterization, Cytotoxicity and Biological Imaging. Bioinorg. Chem. Appl. 2022, 0. [DOI] [PMC free article] [PubMed] [Google Scholar]; In press.
- Frisch M. J.; Trucks G. W.; Schlegel H. B.; Scuseria G. E.; Robb M.; Cheeseman J. R.; Scalmani G.; Barone V.; Petersson G.; Nakatsuji H.; Li X.; Caricato M.; Marenich V.; Bloino J.; Janesko B. G.; Gomperts R.; Mennucci B.; Hratchian H. P.; Ortiz J. V.; Izmaylov F.; Sonnenberg J. L.; Ding F.; Lipparini F.; Egidi F.; Goings J.; Peng B.; Petrone A.; Henderson T.; Ranasinghe D.; Zakrzewski V. G.; Gao J.; Rega N.; Zheng G.; Liang W.; Hada M.; Ehara M.; Toyota K.; Fukuda R.; Hasegawa J.; Ishida M.; Nakajima T.; Honda Y.; Kitao O.; Nakai H.; Vreven T.; Throssell K.; Montgomery J. Jr.; Peralta J. E.; Ogliaro F.; Bearpark M. J.; Heyd J. J.; Brothers E. N.; Kudin K. N.; Staroverov V. N.; Keith T.; Kobayashi R.; Normand J.; Raghavachari K.; Rendell P.; Burant J. C.; Iyengar S. S.; Tomasi J.; Cossi M.; Millam J. M.; Klene M.; Adamo C.; Cammi R.; Ochterski J. W.; Martin R. L.; Morokuma K.; Farkas O.; Foresman J. B.; Fox D. J.. G16_C01, Gaussian 16, revision C.01, Gaussian, Inc., 2016.
- Perdew J. P.; Burke K.; Ernzerhof M. Generalized Gradient Approximation Made Simple. Phys. Rev. Lett. 1996, 77, 3865–3868. 10.1103/PhysRevLett.77.3865. [DOI] [PubMed] [Google Scholar]
- Grimme S.; Ehrlich S.; Goerigk L. Effect of the Damping Function in Dispersion Corrected Density Functional Theory. J. Comput. Chem. 2011, 32, 1456–1465. 10.1002/jcc.21759. [DOI] [PubMed] [Google Scholar]
- Dunning T. H. Jr.; Hay J. P.. Methods of Electronic Structure Theory, Schaefer H. F., III, Ed.; Plenum Press, 1977; pp 1–28. [Google Scholar]
- Fuentealba P.; Preuss H.; Stoll H.; Von Szentpály L. A Proper Account of Core-Polarization with Pseudopotentials: Single Valence-Electron Alkali Compounds. Chem. Phys. Lett. 1982, 89, 418–422. 10.1016/0009-2614(82)80012-2. [DOI] [Google Scholar]
- Ditchfield R.; Hehre W. J.; Pople J. A. Self-Consistent Molecular-Orbital Methods. IX. An Extended Gaussian-Type Basis for Molecular-Orbital Studies of Organic Molecules. J. Chem. Phys. 1971, 54, 724–728. 10.1063/1.1674902. [DOI] [Google Scholar]
- Hehre W. J.; Ditchfield K.; Pople J. A. Self-Consistent Molecular Orbital Methods. XII. Further Extensions of Gaussian-Type Basis Sets for Use in Molecular Orbital Studies of Organic Molecules. J. Chem. Phys. 1972, 56, 2257–2261. 10.1063/1.1677527. [DOI] [Google Scholar]
- Hariharan P. C.; Pople J. A. The Influence of Polarization Functions on Molecular Orbital Hydrogenation Energies. Theor. Chim. Acta 1973, 28, 213–222. 10.1007/BF00533485. [DOI] [Google Scholar]
- Francl M. M.; Pietro W. J.; Hehre W. J.; Binkley J. S.; Gordon M. S.; DeFrees D. J.; Pople J. A. Self-Consistent Molecular Orbital Methods. XXIII. A Polarization-Type Basis Set for Second-Row Elements. J. Chem. Phys. 1982, 77, 3654–3665. 10.1063/1.444267. [DOI] [Google Scholar]
- Miertuš S.; Scrocco E.; Tomasi J. Electrostatic Interaction of a Solute with a Continuum. A Direct Utilization of AB Initio Molecular Potentials for the Prevision of Solvent Effects. Chem. Phys. 1981, 55, 117–129. 10.1016/0301-0104(81)85090-2. [DOI] [Google Scholar]
- Pascual-Ahuir J. L.; Silla E.; Tuñon I. GEPOL: An Improved Description of Molecular Surfaces. III. A New Algorithm for the Computation of a Solvent-excluding Surface. J. Comput. Chem. 1994, 15, 1127–1138. 10.1002/jcc.540151009. [DOI] [Google Scholar]
- Miertus̃ S.; Tomasi J. Approximate Evaluations of the Electrostatic Free Energy and Internal Energy Changes in Solution Processes. Chem. Phys. 1982, 65, 239–245. 10.1016/0301-0104(82)85072-6. [DOI] [Google Scholar]
- De Silva A. P.; Gunaratne H. Q. N.; Gunnlaugsson T.; Huxley A. J. M.; McCoy C. P.; Rademacher J. T.; Rice T. E. Signaling Recognition Events with Fluorescent Sensors and Switches. Chem. Rev. 1997, 97, 1515–1566. 10.1021/cr960386p. [DOI] [PubMed] [Google Scholar]
- Sahoo S. K.; Crisponi G. Recent Advances on Iron(III) Selective Fluorescent Probes with Possible Applications in Bioimaging. Molecules 2019, 24, 3267. 10.3390/molecules24183267. [DOI] [PMC free article] [PubMed] [Google Scholar]
- Shriver D. F.; Atkins P. W.; Langford C. H.. Inorganic Chemistry; Oxford University Press: Oxford, 1994. [Google Scholar]
- Sidman J. W. Electronic Transitions Due To Nonbonding Electrons Carbonyl, Aza-Aromatic, And Other Compounds. Chem. Rev. 1958, 58, 689–713. 10.1021/cr50022a004. [DOI] [Google Scholar]
- Bingul M.; Tan O.; Gardner C. R.; Sutton S. K.; Arndt G. M.; Marshall G. M.; Cheung B. B.; Kumar N.; Black D. S. Synthesis, Characterization and Anti-Cancer Activity of Hydrazide Derivatives Incorporating a Quinoline Moiety. Molecules 2016, 21, 916. 10.3390/molecules21070916. [DOI] [PMC free article] [PubMed] [Google Scholar]
Associated Data
This section collects any data citations, data availability statements, or supplementary materials included in this article.


