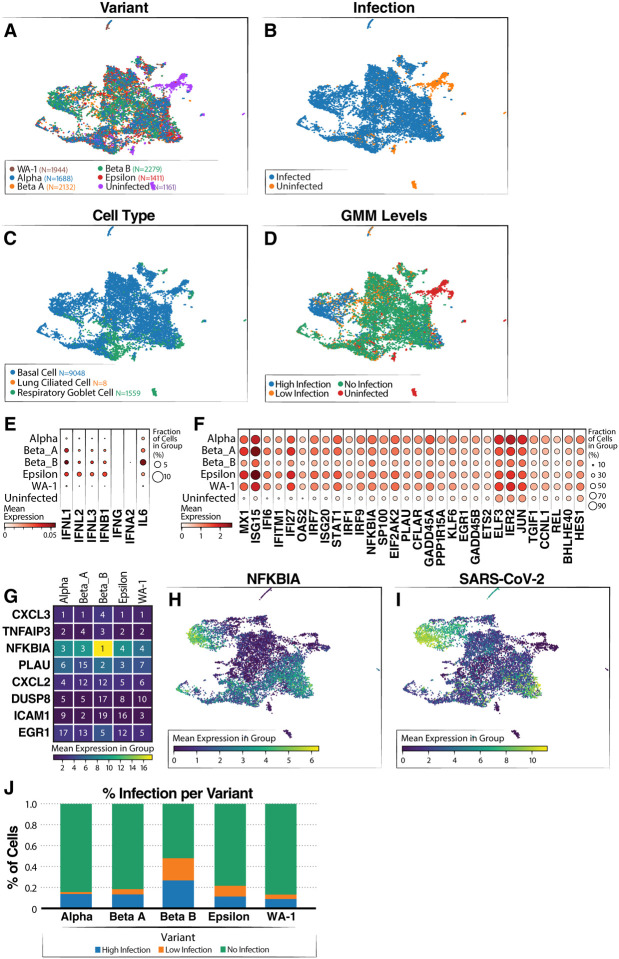
Figure 4: Single-cell RNA-sequencing of airway organoids infected with SARS-CoV-2 variants.
(A) UMAP showing distribution of cells from each variant infection. (B) UMAP colored by infected and uninfected conditions. (C) UMAP colored by cell type (D) UMAP colored by SARS-CoV-2 infection level (via GMM classification). (E) Dot plot showing levels of interferon genes and IL-6 grouped by variant. (F) Dot plot showing levels of ISG expression grouped by variant. (G) Heatmap showing top five genes correlated to SARS-CoV-2 RNA level grouped by variant. The number in the box shows the ranking of the gene based on correlation for the variant and coloring shows the mean expression of the gene listed on the left. (H) UMAP colored by log expression of NFKBIA RNA. (I) UMAP colored by log expression of SARS-CoV-2 RNA. (J) Infection level proportions per variant.

