Abstract
The glycosylation of immunoglobulin G (IgG) has attracted increased attention due to the impact of N-glycan modifications at N297 on IgG function, acting primarily through modulation of Fc domain conformation and Fcγ receptor-binding affinities and signaling. However, the mechanisms regulating IgG glycosylation and especially α2,6-sialylation of its N-glycan remain poorly understood. We observed previously that IgG is normally sialylated in mice with B cells lacking the sialyltransferase ST6Gal1. This supported the hypothesis that IgG may be sialylated outside of B cells, perhaps through the action of hepatocyte-released plasma ST6Gal1. Here, we demonstrate that this model is incorrect. Animals lacking hepatocyte expressed ST6Gal1 retain normal IgG α2,6-sialylation despite the lack of detectable ST6Gal1 in plasma. Moreover, we confirmed that B cells were not a redundant source of IgG sialylation. Thus, while α2,6-sialylation is lacking in IgG from mice with germline ablation of ST6Gal1, IgG α2,6-sialylation is normal in mice lacking ST6Gal1 in either hepatocytes or B cells. These results indicate that IgG α2,6-sialylation arises after release from a B cell but is not dependent on plasma-localized ST6Gal1 activity.
Keywords: ST6Gal1, IgG, sialic acid, plasma, hepatocyte
1. Introduction
Research beginning in the early 1980s has firmly established the links between changing biological and disease states with alterations in immunoglobulin G (IgG) glycosylation (reviewed in Cobb 2020). Human and mouse IgG contains a single and conserved N-linked glycan at N297 of the Fc domain in each heavy chain, which is primarily a biantennary complex N-glycan varying in of GlcNAc bisection, galactosylation, core fucosylation, and terminal α2,6-linked sialylation (de Haan et al. 2017). A number of early studies characterized IgG glycosylation in the context of rheumatoid arthritis (RA) and reported a decrease of galactosylation and sialylation associated with disease. Similar studies involving a variety of inflammatory conditions have extended these findings to establish that inflammatory diseases lead to a decrease of galactosylation and sialylation, directly demonstrating that these modifications to the IgG glycan are under regulatory control.
The importance of sialylation of IgG was documented first in 2006 when it was reported that the active portion of high-dose intravenous immunoglobulin therapy responsible for its antiinflammatory properties in autoimmune patients was the α2,6-sialylated glycoforms of IgG (Kaneko et al. 2006). Subsequent studies have largely documented the linkage of IgG glycosylation changes to various physiological and pathological states, including pregnancy (Rook et al. 1991; van de Geijn et al. 2009), tuberculosis (Kawahara et al. 2019), HIV (Lofano et al. 2018; Butler et al. 2019), diabetes (Keser et al. 2017), kidney dysfunction (Barrios et al. 2016), lupus (Vuckovic et al. 2015), and others, as has been recently reviewed (Cobb 2020). Mechanistic work has focused on how sialylated IgG reduces inflammation (Anthony et al. 2008; Anthony et al. 2011), but many outstanding questions remain (Yu et al. 2013; Temming et al. 2019).
Our recent work has established that the α2,6-sialylation of IgG is independent of the required enzyme ST6Gal1 in B cells (Jones et al. 2016) using a novel B cell-specific conditional knockout of ST6Gal1 (BcKO). Despite lacking ST6Gal1, these BcKO animals express α2,6-sialylated IgG at levels indistinguishable from wild-type (WT) mice. Although there are published data on the relationship of B cell ST6Gal1 expression and IgG sialylation (Wang et al. 2015), as well as other models of B cell glycan modification (Ohmi et al. 2016), it is clear that B cell ST6Gal1 is not required for IgG sialylation (Jones et al. 2016). Instead, the observations with the BcKO mouse point to a previously suggested possibility (Jones et al. 2012), based on a growing body of work, that the complex N-glycans of IgG and other circulatory glycoproteins can be modified after they are secreted into the fluid phases of the body—a process called extracellular sialylation.
ST6Gal1 is highly and inducibly expressed in hepatocytes as a membrane-bound enzyme (Dalziel et al. 1999); however, due to action by the protease BACE-1, a soluble form of ST6Gal1 can be released into plasma (Kitazume et al. 2003; Kitazume et al. 2004), where ST6Gal1 retains enzymatic activity (Appenheimer et al. 2003; Jones et al. 2016). Coupling our BcKO observations (Jones et al. 2016) with previous findings linking liver ST6Gal1 with IgG sialylation (Jones et al. 2012, 2016), we and others hypothesized that the liver-released ST6Gal1 may be required for the synthesis of sialylated IgG. Indeed, the development of mice lacking the liver-specific P1 ST6Gal1 promoter (ΔP1) was reported to have both reduced circulatory ST6Gal1 activity (Appenheimer et al. 2003) and reduced IgG sialylation (Jones et al. 2012). Consistent with this model, we showed that ST6Gal1 expression in the liver is dramatically increased in halos surrounding central veins where hepatocyte proteins and glycoproteins are released into circulation. Finally, there is evidence that human platelet granules may supply the nucleotide-activated sugars that serve as donors for glycosyltransferases within the plasma (Wandall et al. 2012), and our prior findings confirm that murine platelets can also supply CMP-sialic acid (CMP-SA) for ST6Gal1 activity (Jones et al. 2016).
However, to conclusively establish whether extracellular sialylation from plasma-localized ST6Gal1 may be contributing to α2,6-sialylation of IgG, we generated a hepatocyte-specific conditional knockout of ST6Gal1 (HcKO) using the albumin-Cre mouse, which we have recently reported (Oswald, Jones, et al. 2020a; Oswald, Zhou, et al. 2020b). We observed, as predicted, a complete ablation of α2,6-linked sialic acids on liver-produced circulatory glycoproteins and hepatocyte cell surfaces but not in other cells or tissues. Here, we describe the impact of hepatocyte ablation of ST6Gal1 on IgG sialylation. Our results indicate that despite the loss of detectable plasma ST6Gal1 in the HcKO mice, IgG sialylation was unchanged compared to WT controls. Additionally, BACE-1 knockout mice also had normal IgG sialylation. Importantly, mice with germline loss of ST6Gal1 lacked sialylated IgG, thereby confirming the absolute requirement for ST6Gal1 in IgG sialylation. We further developed a mouse lacking ST6Gal1 in both the hepatocyte and B cell compartments (BHcKO) to determine whether each cell might be able to compensate for the other. IgG sialylation remained unchanged. These findings demonstrate that neither ST6Gal1 in plasma nor in B cells generates IgG sialylation and suggest that an unidentified compartment outside of these must be necessary to regulate the sialylation of IgG.
2. Results
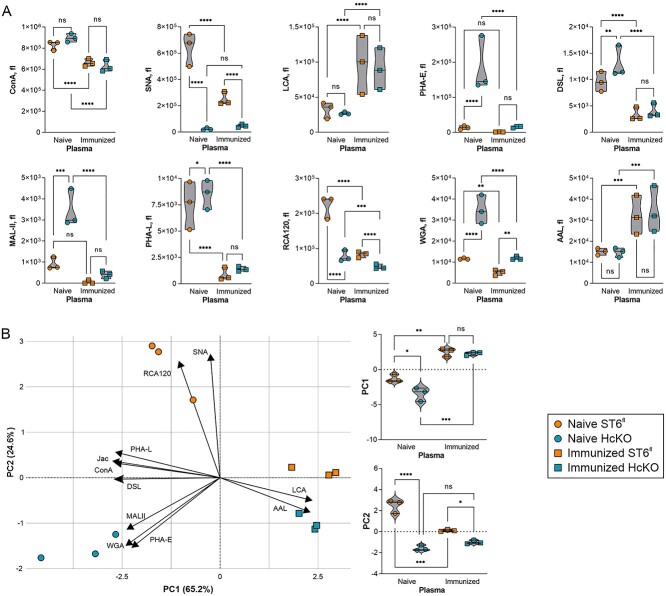
Total plasma glycoprotein glycosylation in WT and HcKO mice was characterized with and without ovalbumin in alum immunization using a plate-based lectin enzyme-linked immunosorbent assay (ELISA) assay as we have previously described (Oswald et al. 2019). We found that regardless of immunization status, SNA signal was very low in HcKO samples (Fig. 1A). Interestingly, MAL-II, WGA, and PHA-E all showed marked increases in naive HcKO mice compared to WT, but those differences and overall levels were dramatically reduced in both strains upon immunization despite that the immunized plasma samples were taken 6 weeks after the final boost to allow the mice to return to baseline. Conversely, immunization increased LCA and AAL, both fucose-detecting lectins (Fig. 1A). Principal component analysis (PCA) of these data illustrated the major differences between naive WT and HcKO plasma glycosylation (Fig. 1B). Immunization significantly reduced the difference between strains, but the immunized cohort was significantly different from their naive counterparts (Fig. 1B), with the exception that SNA-detectable α2,6-sialylation remained distinct between strains (Fig. 1A).
Fig. 1.
Plasma glycoprotein glycan changes are associated with both hepatocyte ST6Gal1 and immunization. A) Lectin ELISA of total plasma glycoproteins in resting and immunized WT and HcKO mice 2 weeks after the final booster exposure using an array of lectins revealed a loss of SNA in HcKO samples, reductions in ConA, SNA, PHA-E, DSL, PHA-L, RCA120, and WGA in WT and HcKO associated with immunization. Increased LCA and AAL was also seen in both strains following immunization. B) PCA results demonstrated that immunized mouse plasma glycans are more similar to each other than either naive mouse. PC1 and PC2 scores for each of the 4 groups show the dominance of immunization in determining overall plasma glycan characteristics. N = 3 for each condition and strain.
Next, the IgG response to immunization was quantified. We found that both WT and HcKO mice strongly responded to immunization, although immunized WT mice did responded stronger (Fig. 2A). SNA and anti-Fc antibody ELISA on purified IgG from each nonimmunized strain revealed no detectable difference in total sialylation between strains (Fig. 2B). The dramatically increased presence of IgG might explain the decreases in SNA and ConA, and increased LCA signal in the total plasma samples of immunized mice (Fig. 1A) due to the low sialylation and high fucosylation characteristics of typical IgG N-glycans (de Haan et al. 2017).
Fig. 2.
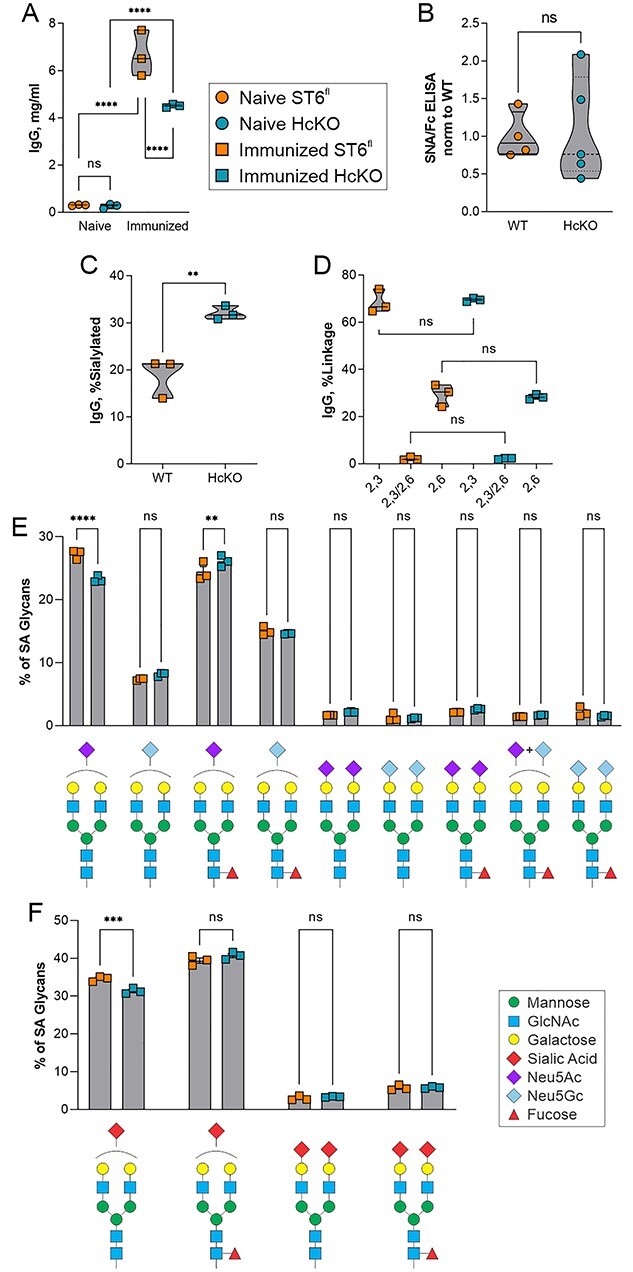
IgG glycan sialylation is consistent between WT and HcKO mice. A) IgG titers in immunized and nonimmunized mice, 2 weeks following the final immunization, showed strong IgG responses in both strains despite a slightly reduced overall response in HcKO mice. N = 3. B) Lectin ELISA data on purified IgG from nonimmunized mice revealed a lack of difference in α2,6-sialylation between WT and HcKO IgG. N = 4–5. C) Based on mass spectrometry, total IgG sialylated glycan species from immunized mice were increased in HcKO mice. N = 3. D) No difference in linkage distribution of sialic acids was detected. N = 3. E and F) A breakdown of individual sialylated glycan species found by mass spectrometry showed that the distribution of monosialylated, disialylated, Neu5Ac, Neu5Gc, and fucosylation was indistinguishable between WT and HcKO mice. N = 3.
To more robustly quantify α2,6-sialylation, we performed mass spectrometry analysis on IgG glycans from immunized mice using 4-(4,6-dimethoxy-1,3,5-triazin-2yl)-4-methylmorpholinium chloride (DMT-MM) activation of the sialic acid carboxylate group, which upon permethylation leads to selective amidation of α2,6-linkages and spontaneous lactonization of α2,3-linkages that are easily differentiated by mass spectrometry due to an added +13 Da on α2,3-linked sialic acids (Alley and Novotny 2010). The degree of sialylation 2 weeks after the final immunization was found to be approximately 20% in WT mice, but over 30% in HcKO mice (Fig. 2C). We found that the majority of sialic acids in murine IgG are present in an α2,3 linkage, whereas α2,6 linkages were a minority, although there was no significant difference between strains (Fig. 2D), consistent with prior studies (de Haan et al. 2017). A detailed breakdown of sialylated N-glycans further reveals that the dominant structures were G2S1 with either Neu5Ac or Neu5Gc and plus or minus core fucose (Fig. 2E and F). Very few disialylated N-glycans were present in either strain on IgG at this time point, and differences in distribution were predominantly not significant except for a small reduction in monosialylated glycans carrying Neu5Ac in HcKO samples.
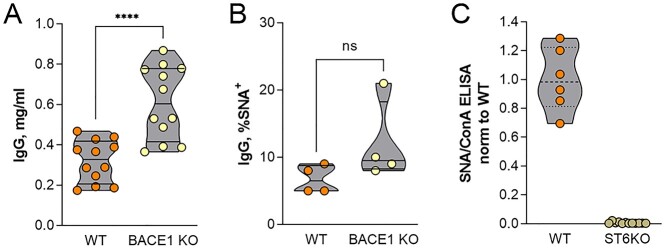
BACE-1 has been shown to be necessary for ST6Gal1 release from the liver (Kitazume et al. 2004). Thus, the BACE-1 knockout mouse would be expected to phenocopy HcKO mice in terms of IgG sialylation due to a lack of circulatory ST6Gal1. We obtained plasma from naive WT and BACE-1 knockout mice from the Jackson Laboratories (JAX). IgG concentration was higher in the unimmunized BACE-1 knockout mice (Fig. 3A), and the degree of IgG α2,6-sialylation, as measured by SNA binding, was indistinguishable from WT mice from the same facility (Fig. 3B). Finally, we confirmed that ST6Gal1 was indeed required for IgG α2,6-sialylation using the germline ST6Gal1 knockout mouse. IgG from these mice lacked SNA-detectable α2,6-sialylation (Fig. 3C).
Fig. 3.
ST6Gal1 but not BACE-1 is necessary for IgG α2,6-sialylation. A) BACE-1 knockout mice carried modestly but significantly higher IgG titers compared to similarly housed WT control mice. N = 12. B) The degree of α2,6-sialylation of IgG from resting and nonimmunized WT and BACE-1 knockout mice, as measured by SNA, was indistinguishable. N = 4. C) Mice with germline knockout of ST6Gal1 lacked detectable IgG α2,6-sialylation. N = 6–9.
These data demonstrate that hepatocyte-released ST6Gal1 is dispensable for IgG sialylation, suggesting 2 possibilities. One is that either B cells and hepatocytes (i.e. circulatory ST6Gal1) are redundant pathways and thus can compensate for each other, yielding a lack of IgG sialylation differences in each of the HcKO and BcKO mouse models. The other is that neither of these compartments are necessary for IgG sialylation. In order to differentiate between these 2 possibilities, we created a mouse in which ST6Gal1 was ablated in both hepatocytes and B cells (BHcKO; Fig. 4A). We first confirmed the lack of hepatocyte α2,6-sialylation using confocal microscopy and found a similar pattern of SNA staining in the BHcKO liver (Fig. 4B) as we previously reported for the HcKO mouse (Oswald, Jones, et al. 2020a; Oswald, Zhou, et al. 2020b) in which hepatocytes but not macrophages or endothelial cells were SNA negative in liver tissues. Likewise, B cells were analyzed by flow cytometry with SNA and ECL, and we found the same decrease in SNA and increase in ECL (Fig. 4C) as we previously reported for the BcKO mouse (Jones et al. 2016). These data confirm that the ablation of ST6Gal1 was found in both target tissues as expected.
Fig. 4.
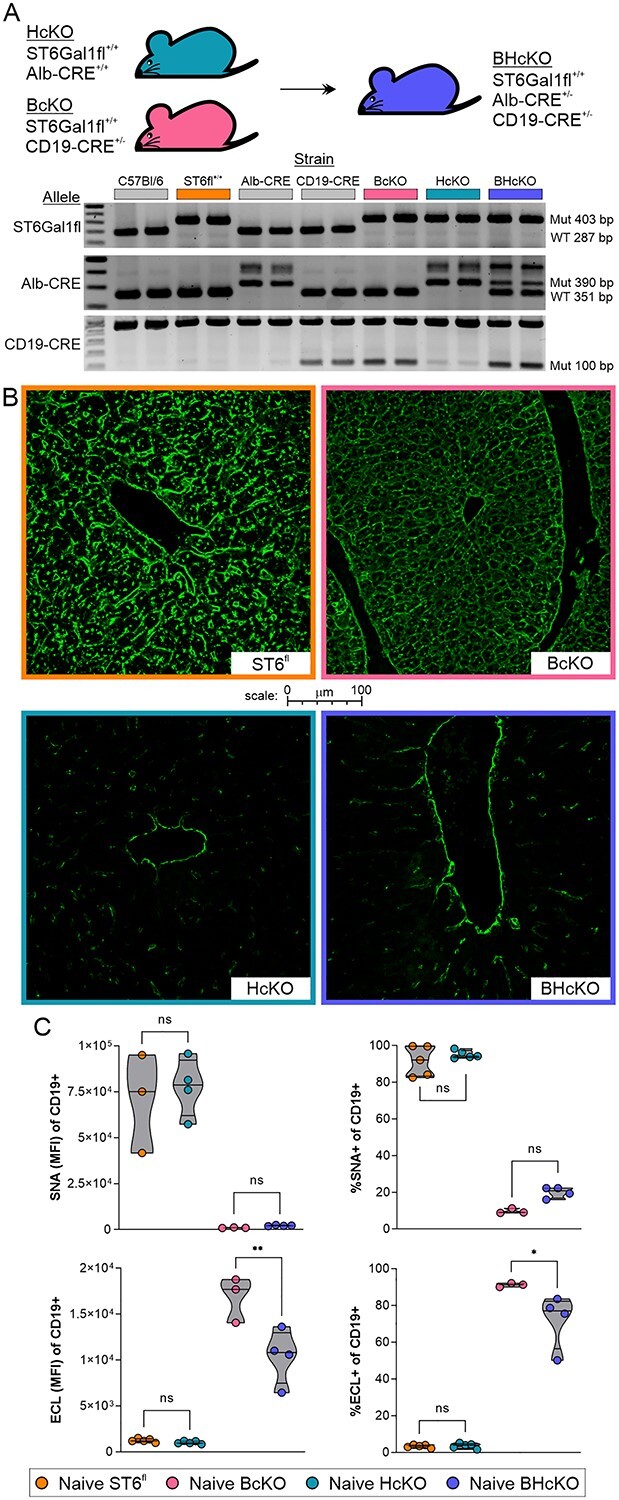
Creation and general characterization of the BHcKO mouse. A) Scheme, genetics, and validating genotype analysis of the dual-deficient mutant mice. B) Confocal staining for SNA in the liver revealed the expected deficiency of sialylation in HcKO and BHcKO but not in WT and BcKO tissue; image border color description is indicated in panel A. C) SNA and ECL lectin flow cytometry analysis of blood CD19+ B cells demonstrated the ablation of surface α2,6 sialic acids and increase in terminal galactose, respectively, on BcKO and BHcKO mice cells but not in WT and HcKO. N = 3–5.
Before analyzing the IgG itself, we measured the plasma-localized ST6Gal1 activity in all 4 mouse strains. First, plasma from WT (ST6Gal1fl), HcKO, BcKO, and BHcKO were harvested, incubated with 100 μM CMP-SA, and quantified for glycoprotein α2,6 sialylation using a direct lectin ELISA with SNA. We found that with the addition of CMP-SA, both WT and BcKO plasma samples showed strong SNA reactivity compared to samples that did not receive CMP-SA (Fig. 5A). Next, we employed a plate-based solid phase assay, essentially as previously described (Oswald et al. 2019). ELISA plates were coated with mouse plasma treated with neuraminidase to remove all sialylation. Next, freshly isolated plasma was added with or without CMP-SA and incubated for 24 h. The addition of α2,6-linked sialic acids was quantified by SNA reactivity. In accordance with the fluid-phase assay (Fig. 5A), we found that both WT and BcKO plasma samples show consistent increases in sialylation compared to their paired controls (Fig. 5B), which was further illustrated by showing the change in sialylation for each paired mouse sample (Fig. 5C). We also confirmed that recombinant ST6Gal was easily measured in this assay (Fig. 5D). Thus, both the WT and BcKO strains showed strong ST6Gal1 activity in the plasma when supplied with exogenous CMP-SA, but neither the HcKO nor BHcKO mice showed detectable plasma-localized activity. Finally, we confirmed that plasma-localized ST6Gal1 retains activity in vivo by injecting CMP-SA via the tail vein and monitoring for changes in IgG sialylation. Although the total IgG concentration did not change, the degree of IgG sialylation significantly increased (Fig. 5E), demonstrating that the enzyme in circulation can function if given adequate donor.
Fig. 5.
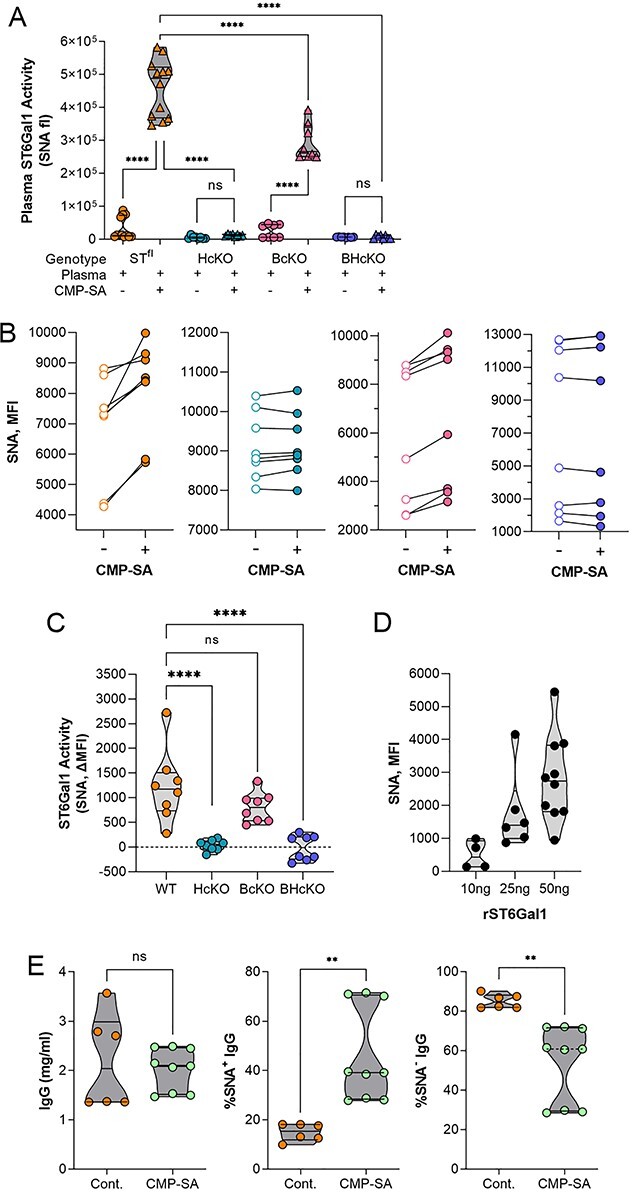
Plasma ST6Gal1 activity is lost in HcKO and BHcKO mice. A) Addition of α2,6 sialic acids to glycoproteins in plasma incubated with or without CMP-SA nucleotide-sugar donor, and probed by direct SNA ELISA, showing a lack of added sialylation in HcKO and BHcKO samples. N = 12. B and C) Addition of α2,6 sialic acids to plate-bound mouse plasma pretreated with neuraminidase (NA) and then incubated with plasma from WT, BcKO, HcKO, and BHcKO mice with or without CMP-SA as paired readouts, showing that only WT and BcKO plasma samples increased SNA reactivity in a CMP-SA-dependent fashion. N = 8. D) Addition of α2,6 sialic acids to plate-bound mouse plasma treated with NA and then incubated with varied amounts of recombinant ST6Gal1 with CMP-SA and probed with SNA. E) I.v. injection of CMP-SA did not alter the total IgG concentration, but led to an increase in α2,6-sialylation in WT mice, confirming the function of plasma-localized ST6Gal1. N = 6–9.
Next, we analyzed the overall IgG titer (Fig. 6A) and IgG subclass distribution (Fig. 6B) in the WT, BcKO, HcKO, and BHcKO strains with and without immunization. In contrast to the data in Fig. 2 in which IgG N-glycans were analyzed 2 weeks after the final immunization booster, we chose to perform the analysis at 8 weeks after the last injection to ensure all animals had returned to homeostasis following immune activation. In general, all 3 knockout strains had a slightly reduced IgG concentration following immunization. With the exception of the BcKO, IgG subclass distribution was also not substantially different from WT. The BcKO showed an expansion of IgG2a and IgG2b with a concomitant decrease in IgG1, although the underlying mechanism generating such a difference remains unknown. We also employed lectin-based analyses of IgG isolated from an immunized cohort and found no statistical difference between any of the strains in terms of SNA reactivity (Fig. 6C). Using mass spectrometry on a separate cohort of immunized animals, we confirmed that the degree of sialylation and the relative distribution of sialic acid linkages was indistinguishable among all 4 strains (Fig. 6D and E). A further breakdown of the dominant sialylated N-glycans revealed similar results to the WT and HcKO mice at 2 weeks in which singly sialylated species dominated (Fig. 2), although there was an increase in dual sialylated species at this later time point (compare Figs 2E and6F). These findings suggest that the appearance of disialylated species carrying Neu5Gc increases over time following a return to homeostasis, although significantly less so with BcKO and BHcKO mice (Fig. 6F and G). In addition, no differences in galactose, fucose, or bisecting GlcNAc were detectable across any of these strains (Fig. 7). These data reveal that both circulatory/hepatocyte as well as B cell ST6Gal1 are dispensable for overall IgG sialylation and glycan composition and that they do not compensate for each other.
Fig. 6.
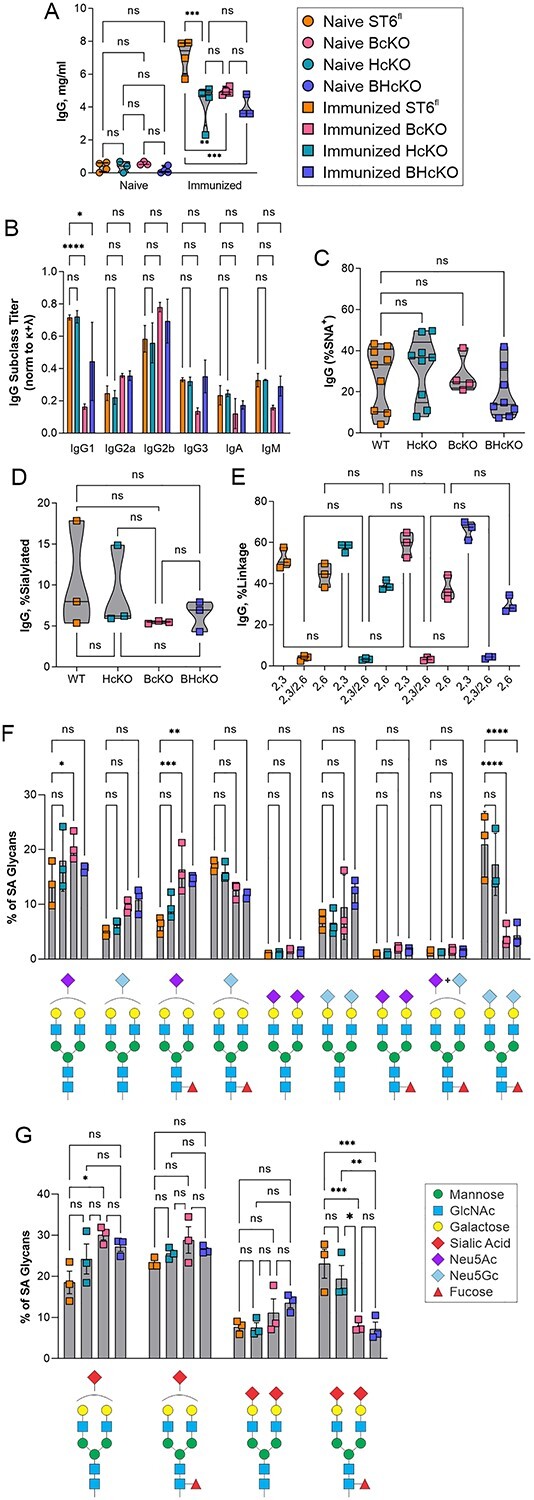
BHcKO IgG glycans mirror WT glycans. A) IgG titers in immunized and nonimmunized mice revealed slightly lower overall IgG titers in all 3 ST6Gal1 knockout mice. N = 4. B) With the exception of the BcKO strain, the Ig class and subclass distribution is essentially unchanged across strains. BcKO mice showed a decrease in IgG1 and IgG3 and an increase in IgG2a and IgG2b. N = 3. C) Lectin analysis of IgG from immunized mice, showing a lack of difference in SNA reactivity. D) Based on mass spectrometry, overall IgG sialylation of IgG glycans 8 weeks postimmunization was indistinguishable between strains. N = 3. E) Likewise, the distribution of α2,3 and α2,6 linkages were indistinguishable. F and G) A breakdown of specific sialylated glycan species found showed that the general distribution of monosialylated, disialylated, Neu5Ac, Neu5Gc, and fucosylation is the same in all strains of mice, although G2FS2 structures, particularly with 2 Neu5Gc residues were higher in WT and HcKO compared to BcKO and BHcKO samples. N = 3.
Fig. 7.
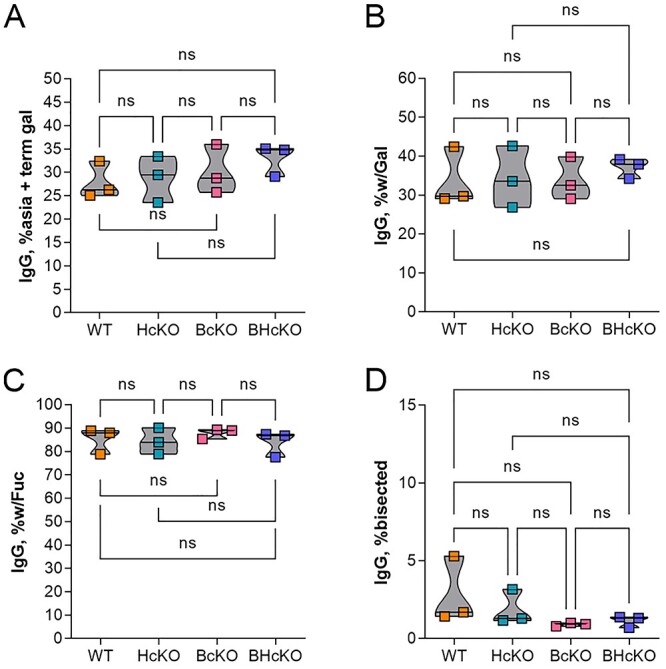
IgG glycan composition is unaltered in ST6Gal1 ablated mice. Comparison of IgG glycan composition based on mass spectrometry findings, including glycans with terminal galactose and no sialic acid (A), total glycans with galactose (B), glycans with core fucose (C), and glycans with bisecting GlcNAc residues (D), No differences were apparent. All data N = 3.
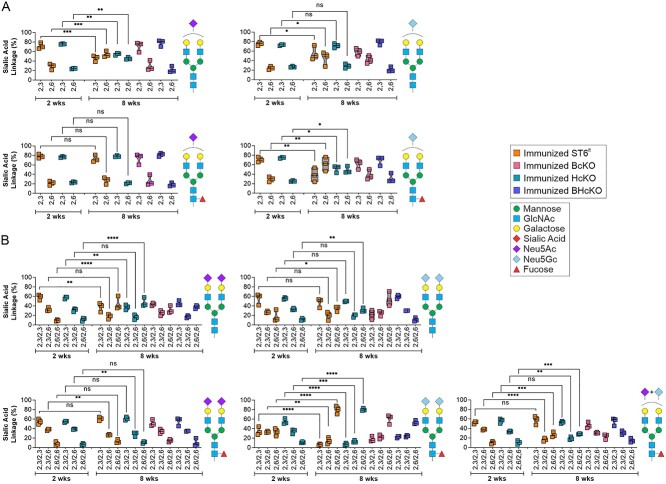
Finally, the mass spectrometry data at 2 and 8 weeks postfinal immunization booster seemed to indicate a progressive sialylation process during the return to homeostasis after immunization/exposure (compare Figs 2F and6G). Thus, we first analyzed each of the main sialylated species independently based on the distribution of α2,3 and α2,6 linkages. Among the monosialylated N-glycans, we found that there are shifts in the linkage distribution at different time points, but that this appears to be influenced by the strain (Fig. 8A). For example, in the G2S1 N-glycan containing Neu5Ac, both WT and HcKO strains showed low initial α2,6 sialylation at 2 weeks, but that increased over time to yield equivalent α2,3 and α2,6 distributions by week 8. The equivalent distribution was not seen in BcKO or BHcKO mice at 8 weeks. Similarly, among the disialylated species, there was some change in the distributions, depending on the strain (Fig. 8B). In general, we found that the relative amount of α2,6 linked sialic acids increased over time, and this correlated with an increase in disialylated N-glycans with increasing time after the last immunization in both WT and HcKO mice (Fig. 9).
Fig. 8.
IgG sialylation linkage distribution is distinct for each sialylated species. A) Comparison of the distribution of α2,3 and α2,6 linkages on a singly sialylated glycan species-by-species level at 2 weeks of WT and HcKO mice and 8 weeks of WT, HcKO, BcKO, and BHcKO mice. B) Comparison of the distribution of α2,3 and α2,6 linkages on a dually sialylated glycan species-by-species level at 2 weeks of WT and HcKO mice and 8 weeks of WT, HcKO, BcKO, and BHcKO mice. The data revealed that linkage distributions change differentially among sialylated species. All data N = 3.
Fig. 9.
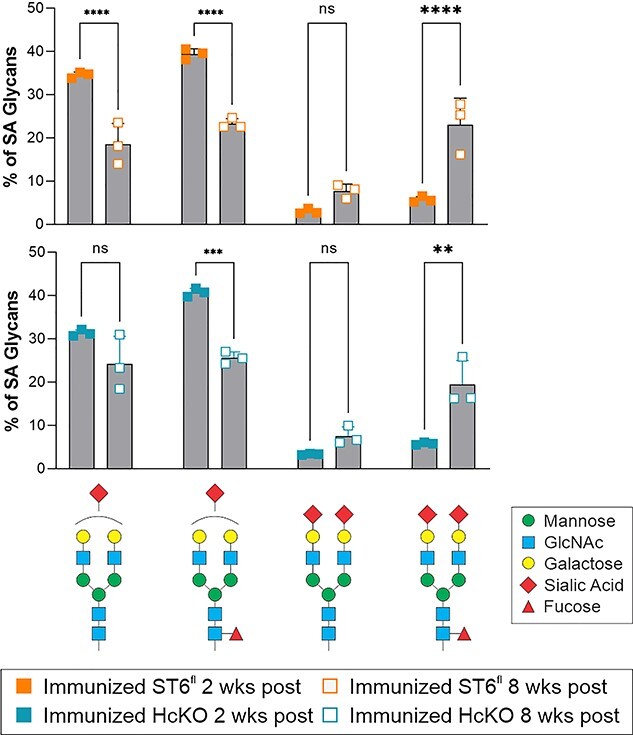
IgG sialylation increases over time following immunization. Time course comparison of the main singly and dually sialylated glycan species in WT and HcKO mice at 2 and 8 weeks postfinal immunization boost, which indicated a shift toward structures containing 2 sialic acids at a longer time point after the most recent exposure to antigen. N = 3.
3. Discussion
Here, we confirm that α2,6-sialylation of IgG by ST6Gal1 arises by the action of ST6Gal1, as documented using germline deletion of ST6Gal1. Unexpectedly, our prior studies had shown that such sialylation of IgG does not arise by the action of ST6Gal1 in B cells, although the loss of B cell ST6Gal1 led to a loss of cell surface α2,6-sialylation and replacement by terminal galactose (Jones et al. 2016). These prior studies led us to test the hypothesis that IgG α2,6-sialylation might arise through the action of liver-derived soluble ST6Gal1 in the plasma. However, our results demonstrate that neither the ST6Gal1 in plasma or in B cells is chiefly responsible for IgG α2,6-sialylation.
The plasma-derived ST6Gal1 is known to be released from the liver through the action of the protease BACE-1 (Kitazume et al. 2004, Kitazume. 2003). The notion that IgG sialylation might involve plasma ST6Gal1 originated in studies utilizing a mouse with the P1 promoter of ST6Gal1 ablated (Appenheimer et al. 2003). The ΔP1 mouse has a documented reduction, albeit not an ablation, of plasma ST6Gal1 activity along with a reduction in IgG sialylation (Appenheimer et al. 2003; Jones et al. 2012). We considered that the creation of the BcKO mouse and the observation that IgG sialylation was unchanged (Jones et al. 2012) seemed to support this model. Through the creation of the combined HcKO and BHcKO mice, our results here demonstrate that plasma ST6Gal1 is not necessary for IgG sialylation. Complete loss of plasma ST6Gal1 activity, ablation of BACE-1, and a combination knockout in hepatocytes and B cells collectively demonstrate that IgG sialylation occurs elsewhere but certainly not in B cells or plasma.
The lack of plasma ST6Gal1 making an impact on glycans within the circulation is further supported by the fate of the B cells in the BcKO mouse (Jones et al. 2012). These cells have a dramatically reduced surface α2,6-sialylation, yet are in direct contact with ST6Gal1 in plasma just like IgG. We were puzzled by the apparent contradiction that while B cell surfaces lacked α2,6-sialylation, their secreted IgG was α2,6-sialylated. The current HcKO mouse supports the interpretation that plasma ST6Gal1, while functional, does not sialylate B cells lacking endogenous ST6Gal1 despite available terminal galactose. This is most likely due to the lack of CMP-SA required as a donor for the sialylation reaction under most conditions.
Another key uncertainty has been why the ΔP1 mouse does not phenocopy the HcKO strain. The original description of the ΔP1 mouse exhibited a modest reduction in circulatory ST6Gal1 protein and activity using in vitro assays, likely due to the fact that expression of the enzyme is incompletely knocked down. Moreover, since the creation of the ΔP1 mouse, it has become clear that these animals carry interesting hematopoietic phenotypes (Nasirikenari et al. 2006; Jones et al. 2010; Nasirikenari et al. 2010) that are also not phenocopied in the HcKO mice (Oswald, Jones, et al. 2020a; Oswald, Zhou, et al. 2020b). We reason that the manipulation of the P1 promoter has an impact beyond the liver and circulatory activity of ST6Gal1 and that it is likely involved with expression of ST6Gal1 in multiple hematopoietic cell lineages. Given that the HcKO mouse lacks detectable ST6Gal1 activity in plasma, we believe that nonliver reductions in expression are the source of the phenotypes described using the ΔP1 mouse and not the changes in plasma ST6Gal1.
Beyond the continuing puzzle regarding the nonplasma and non-B cell location of IgG sialylation, another observation herein is the apparent high proportion of α2,3-linkages among sialylated N-glycans found on IgG in these mice. Work citing α2,3-sialylation of IgG is extremely limited, although α2,3- and α2,6-sialylation of murine IgG was recently documented as well as the strain differences in distribution. Unfortunately, a great number of studies on IgG glycosylation does not address the specific nature of sialic acid linkages or form (e.g. Neu5Ac vs. Neu5Gc or other modifications). As such, much of the discussion and analysis of IgG sialylation may be, to some degree, problematic. The effects of α2,3- versus α2,6-sialylation on the activities of IgG are not well documented. Thus, it is likewise not clear whether α2,3-sialylation of IgG affects its affinity to the Fcγ receptor in the same way as α2,6-sialylation nor is it known how α2,3-sialylation might impact IgG structure. In this regard, while IgG glycosylation invariably occurs on the Fc portion at N297, it is known that additional N-glycans might be present on a subset of IgG through N-glycosylation of the Fab domain. However, this would not affect our overall interpretation, as we analyzed total N-glycans and their total sialylation in which α2,6-sialylation could of course impact both types of N-glycans.
Finally, we found that the sialylation of IgG N-glycans changes as a function of distance in time from the most recent exposure or immunization. There have been proposals as to the possibility of programming the glycoform of specific clones of antibodies in vivo via vaccination (Mahan et al. 2016), but our data suggest that IgG glycosylation is not stable enough for this to work as a therapeutic approach, at least in the murine system, since the degree of sialylation as well as the proportion of singly or doubly sialylated species changes longitudinally after immunization.
In summary, our data now allow us to reject the model that IgG sialylation occurs within the circulatory microenvironment through plasma-localized ST6Gal1 as well as documenting a significant degree of α2,3-sialylation on IgG N-glycans in mice and an unstable degree of sialylation over time following immunization. The findings point to an unidentified anatomical location or cell type in which IgG is sialylated. A leading candidate may be platelets, given their expression of ST6Gal1 and demonstrated ability to release CMP-SA (Wandall et al. 2012; Jones et al. 2016), yet much more research is needed to clarify these mechanisms in vivo.
4. Experimental procedures
4.1 Animal care and use
All animal work was approved by the Institutional Animal Care and Use Committee (IACUC) of Case Western Reserve University. Mice were procured from JAX and were kept/bred in the CWRU ARC in accordance with IACUC guidelines. ST6Gal1f/f mice (stock 006901) and Alb-Cre mice (stock 003574) were crossed to produce the HcKO line, as we document in our previous manuscript (Oswald, Jones, et al. 2020a; Oswald, Zhou, et al. 2020b). Wherever the phrases “wild type” or “parental” are used, they refer to mice of the ST6Gal1f/f background, which carry no phenotype, with the exception of the control mice for the BACE-1 study which were C57Bl/6J mice directly housed by JAX. In that case, the WT and BACE-1 knockout mouse serum was harvested by and purchased directly from JAX. BcKO mice were produced by crossing the ST6Gal1f/f mice with CD19-Cre mice (stock 006785) and were used as experimental when homozygous on the allele and heterozygous on the CD19-Cre allele, as described (Jones et al. 2016). BHcKO mice were combined by crossing homozygous breeder of the BcKO and HcKO line, resulting in ST6Gal1f/f, Alb-Cre+/−, and CD19-Cre+/− mice.
4.2 Animal harvest
For harvest, mice were euthanized using CO2 following standard procedures. Blood was drawn via cardiac puncture. Plasma was separated from blood by spinning at 2,000 × g for 15 min and by aspirating the liquid phase.
4.3 Flow cytometry
Flow cytometry was performed on cells isolated freshly ex vivo from mice, as described elsewhere (Jones et al. 2016). Liver lobes were diced and digested in 2.5 mg/mL collagenase (cat) in 3% FBS for 45 min at 37 °C. Tissues were diced and mashed through 70-μm nylon filters in 10 mL of PBS. Cells were spun down, then RBC lysis was performed using pharmlyze (BD Biosciences, 555899) at 4 °C for 5 min, and then quenched with PBS. Cells were blocked for 30 min in Carbohydrate Free Blocking Solution (Vector) and were stained with the following reagents: SNA-FITC (Vector) and CD19-APC (Biolegend). Flow cytometry was run on an Accuri C7. Data were analyzed using FlowJo.
4.4 Histology
Histology embedding and sectioning was performed by the CWRU Cancer Center Histology Services Core as previously described (Jones et al. 2016). Tissues for histological analysis were resected from mice and were fixed in 10% formalin solution. Tissue blocks were embedded in paraffin wax, sectioned, and stained with H&E. For confocal analysis, freshly cut sections were deparafinized in xylenes and rehydrated. The tissue was blocked using carbohydrate free blocking solution (Vector) and was stained with SNA-FITC (Vector) at 0.5 μg/mL. Autofluorescence was diminished using TrueVIEW autofluorescence Quenching Kit (Vector) and the slides were mounted using VECTASHILED HardSet Antifade Mounting Medium (Vector). Confocal imaging was performed on a SP5 Laser Scanning Confocal Microscope (Leica).
4.5 IgG purification
IgG was purified by separation over a HiTrap Protein A HP Antibody Purification Column (GE Life Sciences, 17040203), fitted to a GE Life Sciences Akta Purifier 10 HPLC, according to manufacturer instructions. IgG was tittered using an IgG ELISA kit (Bethyl, E90-131) according to manufacturer instructions.
4.6 Mass spectrometry
Mass spectrometry N-glycan profile and sialic acid linkage analysis was performed on purified IgG essentially as described previously following DMT-MM and permethylation derivatization (Alley and Novotny 2010). IgG samples were lyophilized and were first incubated with 2 mg/mL 1,4-dithiothreitol (Millipore-Sigma) 600 mM Tris buffer at pH 8.5 for 1 h at 50 °C and then with 12 mg/mL iodoacetamide (Millipore-Sigma) also in 600 mM Tris at pH 8.5 for 1 h in the dark. Following dialysis against 50 mM ammonium bicarbonate, samples were dried by lyophilization and resuspended in 50 mM ammonium bicarbonate buffer containing 25 μg of TPCK-treated trypsin (Millipore-Sigma) and were incubated overnight at 37 °C. The trypsin-digested samples were cleaned using a 50 mg C18 Sep-Pak column (Waters). The lyophilized samples were then resuspended in 50 mM ammonium bicarbonate buffer and were digested with PNGaseF (New England Biolabs) for a total of 20 h. The PNGaseF-released N-glycans were isolated on a C18 Sep-Pak column, evenly split into 2 fractions and dried.
One of the 2 dried N-glycan aliquots for each sample was dissolved in a 1-mL slurry solution of NaOH in DMSO. The 500 μL of iodomethane (Millipore-Sigma) were added and the samples were mixed vigorously at room temperature for 30 min. The 1 mL of MilliQ water was then added to stop the reaction; 1 mL of chloroform and 3 mL of MilliQ water were added, vortexed thoroughly, and centrifuged (5,000 rpm, 30 s). The aqueous top layer was discarded and 3 mL of MilliQ water was added to wash the chloroform phase by vortexing and centrifuging as before. This was repeated 1 additional time before drying the chloroform fraction with a speedvac. The dried permethylated N-glycans were cleaned on a C18 Sep-Pak column and were eluted with 3 mL of 50% acetonitrile. The eluted fraction was lyophilized prior to MS analysis.
For the DMT-MM treatment, a solution of 0.5 M of DMT-MM (Millipore-Sigma) was prepared in 500 mM of NH4Cl, and pH 6.5.10 μL of the DMT-MM solution were added to the second aliquot of each N-glycan sample and incubated at 60 °C for 15 h. Samples were cleaned on a C18 Sep-Pak column, lyophilized, and permethylated as before.
Permethylated N-glycans +/− DMT-MM derivatization were dissolved in 10 μL of 75% methanol from which 1 μL was mixed with 1 μL 2,5-dihydroxybenzoic acid (DHB) (5 mg/mL in 50% acetonitrile with 0.1% trifluoroacetic acid) and was spotted on a MALDI polished steel target plate (Bruker Daltonics). MS data were acquired on a Bruker UltraFlex II MALDI-TOF Mass Spectrometer instrument. The reflective positive mode was used, and data were recorded between 500 and 6,000 m/z. For each MS N-glycan profile, the aggregation of 20,000 laser shots or more were considered for data extraction. Only MS signals matching an N-glycan composition were considered for further analysis. Subsequent MS postdata acquisition analysis was made using mMass (Strohalm et al. 2010).
4.7 Lectin ELISA
High-throughput, multiplexed lectin ELISA was performed on whole plasma samples, as has been published (Oswald and Cobb 2018; Oswald et al. 2019). Briefly, plasma was diluted to 0.5 μg/mL in carbonate coating buffer (100 mM NaHCO3, 30 mM NaCO3, and pH 9.5), pipetted into a 384-well black ELISA plate, and incubated overnight at 4 °C. The plate was blocked with carbohydrate free blocking solution (Vector, SP-5040) for 1 h at room temperature. Biotinylated lectins were diluted as previously described and incubated on the plate for 1 h at room temperature. Signal was detected using streptavidin-Eu (Perkin Elmer 1244-360) and enhancement solution (Perkin Elmer 4001-0010) measured in a Victor V3 1420 multilabel plate reader.
4.8 Lectin chromatography
Lectin chromatography of IgG was performed as previously described (Jones et al. 2016). Purified IgG was fractionated using SNA-agarose (Vector) into SNA− fraction, then washed 3 times (10 mM HEPES, 0.1% TX-100, pH 7.5), and an SNA+ fraction was eluted (100 mM glycine, 100 mM sodium acetate, 5 mM MgCl2, pH 4.5). IgG concentration was determined as detailed above.
4.9 ST6Gal1 activity
4.9.1 Fluid phase reaction. Mouse plasma was freshly isolated from each mouse strain and was incubated with or without 100 μM CMP-SA donor nucleotide-sugar overnight at 37 °C. The resulting solutions were directly coated onto wells of a 96-well ELISA plate and were blocked for 1 h at room temperature with Carbohydrate-Free blocking solution (Vector Labs). The α2,6-linked sialic acids were probed using SNA-biotin (0.4 μg/mL), Eu-conjugated streptavidin (Perkin-Elmer) at 0.1 μg/mL, and detected on a Victor plate reader (Perkin-Elmer) as previously published (Jones et al. 2016).
4.9.2 Solid phase reaction. A 96-well ELISA plate was coated with mouse plasma (5 μL/well) in carbonate buffer overnight, then blocked for 1 h at room temperature with Carbohydrate-Free blocking solution (Vector Labs), and treated with 0.005 U of neuraminidase from Clostridium perfringens (Sigma) per well in 1 mM Na2HPO4, 1 mM K2HPO4, and 10 mM KCl at pH 6.0 for 3 h at 37 °C. Using 10 μL of harvested mouse plasma, an enzymatic reaction was performed at 37 °C for 24 h with or without 100 μM CMP-SA donor nucleotide-sugar. Added α2,6-linked sialic acids were probed using SNA-biotin (0.4 μg/mL), Eu-conjugated streptavidin (Perkin-Elmer) at 0.1 μg/mL, and detected on a Victor plate reader (Perkin-Elmer) as previously published (Jones et al. 2016).
4.10 CMP-SA injection
Mice were injecting in the tail vein with 200 μg of CMP-SA suspended in PBS and plasma harvested after 24 h.
4.11 Data analysis
Data were analyzed using Microsoft Excel or R and plotted in GraphPad Prism. The R function “prcomp” was used to calculate PCA. PCA was then blotted using the “fviz_pca_biplot” function. Statistical testing was done by student’s T test: *, P < 0.01: **. P < 0.001: ***.
Authors’ contributions
D.M.O. took care of experimental design, data collection and analysis, and manuscript writing; J.Y.Z. and L.M.G. were in charge of data acquisition; S.D.L. and R.D.C. were responsible for mass spectrometry design, data collection and analysis, and manuscript editing; B.A.C. was responsible for experimental design, data analysis, manuscript writing, and funding.
Acknowledgements
The authors wish to acknowledge Dr. Mark B. Jones for scientific input in the early phases of this project and for the BACE-1 knockout IgG analysis.
Contributor Information
Douglas M Oswald, Department of Pathology, Case Western Reserve University School of Medicine, 10900 Euclid Avenue, Cleveland, OH 44106-7288, USA.
Sylvain D Lehoux, Beth Israel Deaconess Medical Center, Harvard Medical School Center for Glycoscience, National Center for Functional Glycomics, 330 Brookline Avenue, Boston, MA 02115, USA; Best Israel Deaconess Medical Center Glycomics Core, 330 Brookline Avenue, Boston, MA 02115, USA.
Julie Y Zhou, Department of Pathology, Case Western Reserve University School of Medicine, 10900 Euclid Avenue, Cleveland, OH 44106-7288, USA.
Leandre M Glendenning, Department of Pathology, Case Western Reserve University School of Medicine, 10900 Euclid Avenue, Cleveland, OH 44106-7288, USA.
Richard D Cummings, Beth Israel Deaconess Medical Center, Harvard Medical School Center for Glycoscience, National Center for Functional Glycomics, 330 Brookline Avenue, Boston, MA 02115, USA.
Brian A Cobb, Department of Pathology, Case Western Reserve University School of Medicine, 10900 Euclid Avenue, Cleveland, OH 44106-7288, USA.
Funding
Support for this research was provided through grants to BAC from the National Institute for General Medical Sciences (GM115234) and the National Institute for Allergy and Infectious Disease (AI154899), to RDC from the National Institute of General Medical Sciences (GM103694 and GM137763), and to DMO and JYZ from the National Institute for Allergy and Infectious Disease (AI089474). Flow cytometry was partially supported by the National Institutes of Health Shared Resource Grant (OD021559) to the Case Comprehensive Cancer Center Cytometry & Microscopy Core Facility.
Conflict of interest statement None declared.
Abbreviations
BcKO, B cell-specific conditional knockout of ST6Gal1; BHcKO, mouse lacking ST6Gal1 in both the hepatocyte and B cell compartments; CMP-SA, cytidine monophosphate N-acetylneuraminic acid; CMP-sialic acid; DMT-MM, 4-(4,6-dimethoxy-1,3,5-triazin-2yl)-4-methylmorpholinium chloride; HcKO, hepatocyte-specific conditional knockout of ST6Gal1; PCA, principal component analysis; RA, rheumatoid arthritis; WT, wild type.
References
- Alley WR Jr, Novotny MV. Glycomic analysis of sialic acid linkages in glycans derived from blood serum glycoproteins. J Proteome Res. 2010:9:3062–3072. [DOI] [PMC free article] [PubMed] [Google Scholar]
- Anthony RM, Wermeling F, Karlsson MC, Ravetch JV. Identification of a receptor required for the anti-inflammatory activity of IVIG. Proc Natl Acad Sci U S A. 2008:105:19571–19578. [DOI] [PMC free article] [PubMed] [Google Scholar]
- Anthony RM, Kobayashi T, Wermeling F, Ravetch JV. Intravenous gammaglobulin suppresses inflammation through a novel T(H)2 pathway. Nature. 2011:475:110–113. [DOI] [PMC free article] [PubMed] [Google Scholar]
- Appenheimer MM, Huang RY, Chandrasekaran EV, Dalziel M, Hu YP, Soloway PD, Wuensch SA, Matta KL, Lau JT. Biologic contribution of P1 promoter-mediated expression of ST6Gal I sialyltransferase. Glycobiology. 2003:13:591–600. [DOI] [PubMed] [Google Scholar]
- Barrios C, Zierer J, Gudelj I, Stambuk J, Ugrina I, Rodriguez E, Soler MJ, Pavic T, Simurina M, Keser T, et al. Glycosylation profile of IgG in moderate kidney dysfunction. J Am Soc Nephrol. 2016:27:933–941. [DOI] [PMC free article] [PubMed] [Google Scholar]
- Butler AL, Fischinger S, Alter G. The antibodiome-mapping the humoral immune response to HIV. Curr HIV/AIDS Rep. 2019:16:169–179. [DOI] [PMC free article] [PubMed] [Google Scholar]
- Cobb BA. The history of IgG glycosylation and where we are now. Glycobiology. 2020:30:202–213. [DOI] [PMC free article] [PubMed] [Google Scholar]
- Dalziel M, Lemaire S, Ewing J, Kobayashi L, Lau JT. Hepatic acute phase induction of murine beta-galactoside alpha 2,6 sialyltransferase (ST6Gal I) is IL-6 dependent and mediated by elevation of exon H-containing class of transcripts. Glycobiology. 1999:9:1003–1008. [DOI] [PubMed] [Google Scholar]
- van de Geijn FE, Wuhrer M, Selman MH, Willemsen SP, de Man YA, Deelder AM, Hazes JM, Dolhain RJ. Immunoglobulin G galactosylation and sialylation are associated with pregnancy-induced improvement of rheumatoid arthritis and the postpartum flare: results from a large prospective cohort study. Arthritis Res Ther. 2009:11:R193. [DOI] [PMC free article] [PubMed] [Google Scholar]
- de Haan N, Reiding KR, Kristic J, Hipgrave Ederveen AL, Lauc G, Wuhrer M. The N-glycosylation of mouse immunoglobulin G (IgG)-fragment crystallizable differs between IgG subclasses and strains. Front Immunol. 2017:8:608. [DOI] [PMC free article] [PubMed] [Google Scholar]
- Jones MB, Nasirikenari M, Feng L, Migliore MT, Choi KS, Kazim L, Lau JT. Role for hepatic and circulatory ST6Gal-1 sialyltransferase in regulating myelopoiesis. J Biol Chem. 2010:285:25009–25017. [DOI] [PMC free article] [PubMed] [Google Scholar]
- Jones MB, Nasirikenari M, Lugade AA, Thanavala Y, Lau JT. Anti-inflammatory IgG production requires functional P1 promoter in beta-galactoside alpha2,6-sialyltransferase 1 (ST6Gal-1) gene. J Biol Chem. 2012:287:15365–15370. [DOI] [PMC free article] [PubMed] [Google Scholar]
- Jones MB, Oswald DM, Joshi S, Whiteheart SW, Orlando R, Cobb BA. B-cell-independent sialylation of IgG. Proc Natl Acad Sci U S A. 2016:113:7207–7212. [DOI] [PMC free article] [PubMed] [Google Scholar]
- Kaneko Y, Nimmerjahn F, Ravetch JV. Anti-inflammatory activity of immunoglobulin G resulting from fc sialylation. Science. 2006:313:670–673. [DOI] [PubMed] [Google Scholar]
- Kawahara JY, Irvine EB, Alter G. A case for antibodies as mechanistic correlates of immunity in tuberculosis. Front Immunol. 2019:10:996. [DOI] [PMC free article] [PubMed] [Google Scholar]
- Keser T, Gornik I, Vuckovic F, Selak N, Pavic T, Lukic E, Gudelj I, Gasparovic H, Biocina B, Tilin T, et al. Increased plasma N-glycome complexity is associated with higher risk of type 2 diabetes. Diabetologia. 2017:60:2352–2360. [DOI] [PubMed] [Google Scholar]
- Kitazume S, Tachida Y, Oka R, Kotani N, Ogawa K, Suzuki M, Dohmae N, Takio K, Saido TC, Hashimoto Y. Characterization of alpha 2,6-sialyltransferase cleavage by Alzheimer's beta-secretase (BACE1). J Biol Chem. 2003:278:14865–14871. [DOI] [PubMed] [Google Scholar]
- Kitazume S, Suzuki M, Saido TC, Hashimoto Y. Involvement of proteases in glycosyltransferase secretion: Alzheimer's beta-secretase-dependent cleavage and a following processing by an aminopeptidase. Glycoconj J. 2004:21:25–29. [DOI] [PubMed] [Google Scholar]
- Lofano G, Gorman MJ, Yousif AS, Yu WH, Fox JM, Dugast AS, Ackerman ME, Suscovich TJ, Weiner J, Barouch D, et al. Antigen-specific antibody Fc glycosylation enhances humoral immunity via the recruitment of complement. Sci Immunol. 2018:3:eaat7796. [DOI] [PMC free article] [PubMed] [Google Scholar]
- Mahan AE, Jennewein MF, Suscovich T, Dionne K, Tedesco J, Chung AW, Streeck H, Pau M, Schuitemaker H, Francis D, et al. Antigen-specific antibody glycosylation is regulated via vaccination. PLoS Pathog. 2016:12:e1005456. [DOI] [PMC free article] [PubMed] [Google Scholar]
- Nasirikenari M, Segal BH, Ostberg JR, Urbasic A, Lau JT. Altered granulopoietic profile and exaggerated acute neutrophilic inflammation in mice with targeted deficiency in the sialyltransferase ST6Gal I. Blood. 2006:108:3397–3405. [DOI] [PMC free article] [PubMed] [Google Scholar]
- Nasirikenari M, Chandrasekaran EV, Matta KL, Segal BH, Bogner PN, Lugade AA, Thanavala Y, Lee JJ, Lau JT. Altered eosinophil profile in mice with ST6Gal-1 deficiency: an additional role for ST6Gal-1 generated by the P1 promoter in regulating allergic inflammation. J Leukoc Biol. 2010:87:457–466. [DOI] [PMC free article] [PubMed] [Google Scholar]
- Ohmi Y, Ise W, Harazono A, Takakura D, Fukuyama H, Baba Y, Narazaki M, Shoda H, Takahashi N, Ohkawa Y, et al. Sialylation converts arthritogenic IgG into inhibitors of collagen-induced arthritis. Nat Commun. 2016:7:11205. [DOI] [PMC free article] [PubMed] [Google Scholar]
- Oswald DM, Cobb BA. Emerging glycobiology tools: a renaissance in accessibility. Cell Immunol. 2018:333:2–8. [DOI] [PMC free article] [PubMed] [Google Scholar]
- Oswald DM, Sim ES, Baker C, Farhan O, Debanne SM, Morris NJ, Rodriguez BG, Jones MB, Cobb BA. Plasma glycomics predict cardiovascular disease in patients with ART-controlled HIV infections. FASEB J. 2019:33:1852–1859. [DOI] [PMC free article] [PubMed] [Google Scholar]
- Oswald DM, Jones MB, Cobb BA. Modulation of hepatocyte sialylation drives spontaneous fatty liver disease and inflammation. Glycobiology. 2020a:30:346–359. [DOI] [PMC free article] [PubMed] [Google Scholar]
- Oswald DM, Zhou JY, Jones MB, Cobb BA. Disruption of hepatocyte sialylation drives a T cell-dependent pro-inflammatory immune tone. Glycoconj J. 2020b:37:395–407. [DOI] [PMC free article] [PubMed] [Google Scholar]
- Rook GA, Steele J, Brealey R, Whyte A, Isenberg D, Sumar N, Nelson JL, Bodman KB, Young A, Roitt IM, et al. Changes in IgG glycoform levels are associated with remission of arthritis during pregnancy. J Autoimmun. 1991:4:779–794. [DOI] [PubMed] [Google Scholar]
- Strohalm M, Kavan D, Novak P, Volny M, Havlicek V. mMass 3: a cross-platform software environment for precise analysis of mass spectrometric data. Anal Chem. 2010:82:4648–4651. [DOI] [PubMed] [Google Scholar]
- Temming AR, Dekkers G, van de Bovenkamp FS, Plomp HR, Bentlage AEH, Szittner Z, Derksen NIL, Wuhrer M, Rispens T, Vidarsson G. Human DC-SIGN and CD23 do not interact with human IgG. Sci Rep. 2019:9:9995. [DOI] [PMC free article] [PubMed] [Google Scholar]
- Vuckovic F, Kristic J, Gudelj I, Teruel M, Keser T, Pezer M, Pucic-Bakovic M, Stambuk J, Trbojevic-Akmacic I, Barrios C, et al. Association of systemic lupus erythematosus with decreased immunosuppressive potential of the IgG glycome. Arthritis Rheumatol. 2015:67:2978–2989. [DOI] [PMC free article] [PubMed] [Google Scholar]
- Wandall HH, Rumjantseva V, Sorensen AL, Patel-Hett S, Josefsson EC, Bennett EP, Italiano JE Jr, Clausen H, Hartwig JH, Hoffmeister KM. The origin and function of platelet glycosyltransferases. Blood. 2012:120:626–635. [DOI] [PMC free article] [PubMed] [Google Scholar]
- Wang TT, Maamary J, Tan GS, Bournazos S, Davis CW, Krammer F, Schlesinger SJ, Palese P, Ahmed R, Ravetch JV. Anti-HA Glycoforms drive B cell affinity selection and determine influenza vaccine efficacy. Cell. 2015:162:160–169. [DOI] [PMC free article] [PubMed] [Google Scholar]
- Yu X, Vasiljevic S, Mitchell DA, Crispin M, Scanlan CN. Dissecting the molecular mechanism of IVIg therapy: the interaction between serum IgG and DC-SIGN is independent of antibody glycoform or fc domain. J Mol Biol. 2013:425:1253–1258. [DOI] [PubMed] [Google Scholar]


