Abstract
Understanding the environmental fate of microplastics is essential for their risk assessment. It is essential to differentiate size classes and degradation states. Still, insights into fragmentation and degradation mechanisms of primary and secondary microplastics into micro- and nanoplastic fragments and other degradation products are limited. Here, we present an adapted NanoRelease protocol for a UV-dose-dependent assessment and size-selective quantification of the release of micro- and nanoplastic fragments down to 10 nm and demonstrate its applicability for polyamide and thermoplastic polyurethanes. The tested cryo-milled polymers do not originate from actual consumer products but are handled in industry and are therefore representative of polydisperse microplastics occurring in the environment. The protocol is suitable for various types of microplastic polymers, and the measured rates can serve to parameterize mechanistic fragmentation models. We also found that primary microplastics matched the same ranking of weathering stability as their corresponding macroplastics and that dissolved organics constitute a major rate of microplastic mass loss. The results imply that previously formed micro- and nanoplastic fragments can further degrade into water-soluble organics with measurable rates that enable modeling approaches for all environmental compartments accessible to UV light.
Keywords: microplastics, nanoplastics, UV aging, fragmentation rates, dose-dependent, size-selective quantification, degradation products
Short abstract
Quantitative release kinetics and fragmentation/degradation rates for microplastics into (nano)plastic fragments and dissolved organics inform the modeling of plastic pollution.
Introduction
In recent years, concerns about plastic pollution have raised, especially when considering the potentially bioavailable microplastics and nanoplastics with compatible particle sizes for bio-uptake and membrane diffusion.1−3 While authorities have introduced restrictions for products containing intentionally produced microplastics,4,5 the majority of microplastic pollution originates from fragmentation of mismanaged waste into secondary macroplastic fragments, then micro- and nanoplastics, tire wear, or textile washing.6−8
Potential scenarios for the fate of microplastics are diverse. After their emission into the environment, microplastics might be transported through various environmental compartments, for example, via wastewater treatment plants (where an estimated 20% are not retained in the sludge)9 to rivers and eventually into the sea. Surf might wash some fraction ashore.10,11 Additionally, biotic (enzymatic processes of microorganisms)12 and abiotic (photolysis, thermal stress, hydrolysis, and mechanical stress)13,14 aging processes can lead to changes in the chemical and physical properties of microplastics,12−15 impacting among others their transport behavior and contaminant sorption. Regarding the environmental scenario of microplastics at a beach, ultraviolet (UV) irradiation, which initiates autocatalytic photo-oxidation,16,17 and hydrolysis could be responsible for chemical changes.16,18,19 Mechanical stress could lead to fragmentation due to increased abrasion in the surf zone (Figure 1a).18,20,21
Figure 1.
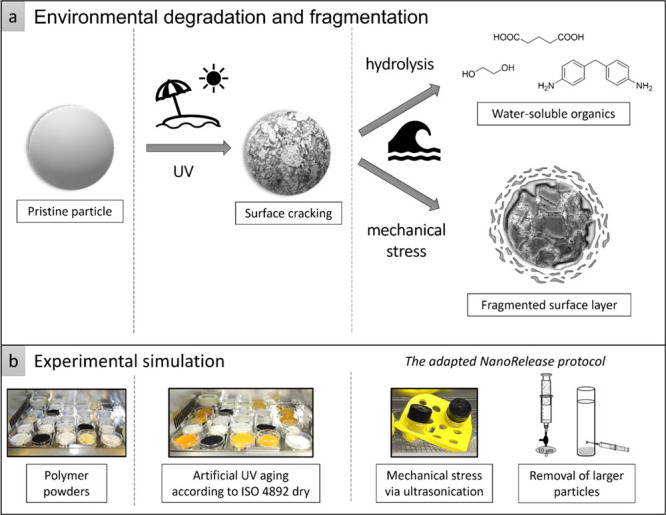
Transfer of an environmental scenario to an experimental simulation considering the chemical and physical treatments. (a) The environmental scenario at the beach including UV aging (photolysis) and mechanical stress due to surf leads to aging of a spherical microplastic particle due to chemical and physical treatments. In some cases, hydrolysis, especially for polymers containing ester bonds or similar, can lead to the release of low-molecular water-soluble organics. Cracks on the particle surface followed by surface ablation (mechanism adopted from Andrady7) result in the release of secondary micro- and nanoplastic fragments. (b) In an experimental approach, polymer powders simulate primary microplastics treated with UV irradiation and ultrasonication in ultrapure water to assess their degradation products.
Secondary nanoplastics are a particular concern due to their potentially higher bioavailability22−25 and size-specific interaction with living organisms.26,27 Aging of microplastics, starting from the surface that is directly exposed to environmental stress,7,28 can induce the generation of nanoplastics via two pathways: cracks can penetrate into deeper parts of the particle, resulting in the breakup of the bulk.7,29 On the other hand, fragmentation of the degraded surface layer can release micro- and nanoplastic fragments (Figure 1a). Dissociation of polymer chains into low-molecular water-soluble organic molecules might also be possible (Figure 1a), for example, due to hydrolysis-induced chain cleavage, if the backbone contains bonds that are susceptible to hydrolytic attack (e.g., ester).30,31 The multiple transformations require additional efforts to assess aged particles and their degradation products,32 before we can deduce fragmentation rates for microplastics under environmental conditions.3,23,24 A mass-specific method for a size-selective quantification of nanoplastics <200 nm and dissolved species generated by weathering is still missing. To fill this knowledge gap, we can adapt methods developed in former research33,34 In 2017, the NanoRelease protocol was developed originally to investigate leaching of nanofillers from polymer nanocomposite plates after weathering (UV irradiation, dry/wet).35−37 The recent ISO TR-22293:2021 introduced the fundamental idea to combine standardized aging stresses with a sampling step and fragment-specific analytics. The specific NanoRelease weathering protocol uses a standardized weathering process with sampling by immersed sonication and size-selective quantification of small fragments from 10 nm but was so far only applied to macroplastic test bodies and did not quantify water-soluble release products. In an interlab comparison, the release of nanofillers and polymer fragments from polymer nanocomposite plates was successfully quantified.35−37 In further studies, the researchers also quantified fragments of different polymer matrices, which we designate as secondary nanoplastics.36,38
Here, we simulated the beach and surf scenario experimentally with the aid of a standardized UV aging experiment and an adapted version of the already implemented NanoRelease protocol (Figure 1b). Our adaptation of the NanoRelease protocol allows a size-selective quantification of micro- and nanoplastic fragments released from microplastic powders after photolysis and mechanical stress and shall eventually calibrate the assumptions on fragmentation rates in models such as the Full Multi model by Domercq et al.39 We investigated if the dissociation into water-soluble organics can occur in parallel or instead of fragment release and analyzed their release kinetics. We selected a range of polyamide (PA) and thermoplastic polyurethane (TPU) powders with a systematically varied polymer backbone to explore the options of polymer synthesis in reducing fragmentation. Since some were sourced directly from the industrial production of 3D-printing plastic powders, our materials also represent a specific class of intentionally produced primary microplastics that are derogated from governmental restrictions due to the loss of particle shape during processing.4,40
Materials
Two PAs (PA-6, PA-12) and four TPUs (TPU_ester_arom, TPU_ether_arom, TPU_ester_ali, and TPU_ether_ali) were used to investigate the influence of UV aging on fragmentation and degradation of primary microplastics. The chemical composition of the TPUs was varied for a comparison between ester- and ether-based polyols, as well as between aromatic and aliphatic diisocyanate components.
PA powders were directly acquired from the industrial production (BASF) of plastic powder needed for 3D-printing by the selective laser sintering (SLS) process. 3D-printing fuses the powder intermediate into the final plastic part, thereby losing the particle nature.4,40 Cryo-milling of TPU granules (BASF) and sieving (<315 μm) generated TPU powders, representing polydisperse microplastics. The application of primary microplastic TPU and PA powders in 3D-printing by industrial users should ideally not allow any emission, but if transport losses or spills should occur,6,41 an assessment of fate and ultimately of sustainability of this version of additive manufacturing is needed.42,43 In addition, polyurethane constituted 7.8% of the European plastic demand in 2020 and is therefore one of the more common polymers.44 Selected particle properties and images are provided in the Supporting Information (SI Figure 1, SI Table 1).
Methods
Artificial UV Aging Following ISO 4892 Dry
Dry UV aging was performed using an Atlas SUNTEST XLS+ conforming to ISO 4892 standardized conditions [sunlight spectrum, UV intensity of 60 W/m2 (max. deviation ±7.0%) in the wavelength range of 300–400 nm, a black standard temperature (BST) of 65 °C].45 Thin layers (0.7 mm height) of the polymer powders were placed into clean petri dishes, assuring that the powders were evenly distributed. This setup was compared to monolayers (insufficient sample amount for further analysis) and thicker layers (1.5 mm) with mixing (every 200 h). Considering the concern that the uppermost layer might be much more affected than the lower layers, this would result in a mixture of pristine and aged particles. We assessed that and found that with the current setup the molar mass (SI Figure 2) was reduced for all particles (not resulting in a bimodal distribution), independent from their position in the petri dish. Afterwards, the petri dishes were partially covered with quartz glasses (SI Figure 3), avoiding windblown powder contamination but still providing oxygen for potential radiation-induced auto-oxidation. The powders were artificially aged for 1000, 2000, and 3000 h (216, 432, and 648 MJ/m2). Each 1000 h step simulates the annual external mid-European conditions.35 The aged microplastic particles were analyzed regarding their surface chemistry via attenuated total reflectance Fourier-transform infrared spectroscopy (ATR FT-IR), their surface texture via scanning electron microscopy (SEM), and their molar mass distribution via gel permeation chromatography (GPC). Duplicates were prepared for each polymer sample.
Adaptation of the ISO22293:2020 NanoRelease Protocol
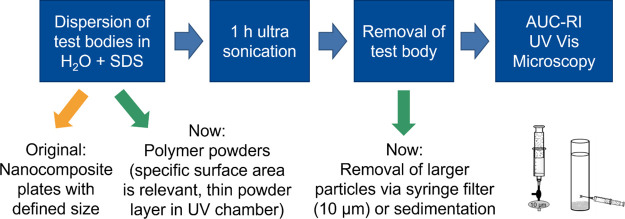
The NanoRelease protocol concerns a size-selective quantification of nano-fragments released from polymer nanocomposite plates after weathering,35 and pre-validation by pilot interlaboratory testing provides a suitable basis for an adaptation to the release of nano- and microplastics from primary microplastics (Figure 2). For this purpose, 0.45 g of UV-aged polymer powder was dispersed in 2 mL of ultrapure water with the surfactant (sodium dodecyl sulfate, SDS, 1 g/L) and treated with 1 h of ultrasonication (Sonorex Digital 10P, Bandelin, 100%, 20 °C). In the next step, to remove the primary particles, the dispersion was transferred to (a) a centrifuge vial (polypropylene 11 × 60 mm, Beckman Coulter) and left for 5 min for 1-g-sedimentation (TPU samples) or (b) a 5 mL syringe equipped with a 10 μm syringe filter (Acrodisc PSF 10 μm Versapor, Pall Corporation) and a three-way stopcock (Discofix C, B.Braun) (PA samples).
Figure 2.
Adaptation of the NanoRelease protocol for the assessment of secondary fragments released from primary microplastics. Since polymer powders are used instead of nanocomposite plates, the larger particles need to be removed with the aid of 1-g-sedimentation or a 10 μm syringe filter. The dispersion containing micro- and nanoplastic fragments was analyzed via analytical ultracentrifugation, UV–vis, and SEM.
Another 2 mL of ultrapure water with the surfactant was used to rinse the remaining particles from the vials. In the case of the TPU, the supernatant after sedimentation was analyzed, while for PA, the filtrate was used. Analysis included the particle size distribution (analytical ultracentrifugation with a refractive index detector (AUC-RI), a single-particle counter) and concentration of micro- and nanoplastic fragments (AUC-RI), the particle shape (SEM), and the content of released water-soluble organics (total organic carbon, TOC, and ultraviolet–visible spectroscopy, UV–vis). Blank samples without polymer powders were prepared for the 1-g-sedimentation as well as for the filtration pathway.
Detailed descriptions of the experimental conditions for ATR FT-IR, SEM, GPC, AUC-RI, single-particle counter, TOC, and UV–vis are given in the Supporting Information.
Results and Discussion
Depending on the Polymer Nature, UV Aging of Primary Microplastics Leads to Different Aging
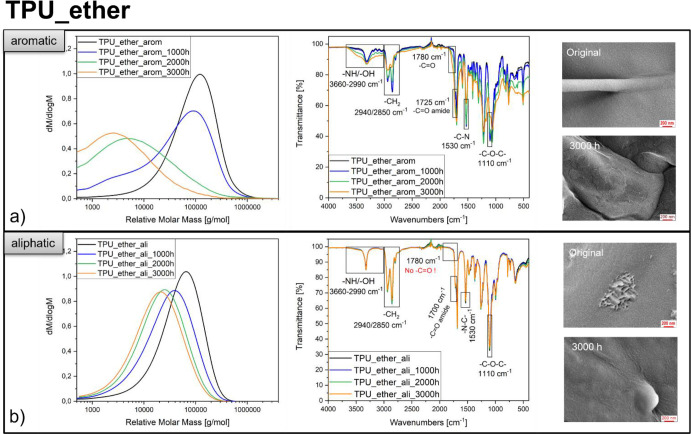
Following artificial UV aging, the investigated polymer types showed different molar mass distributions, surface chemistry, and texture (Figure 3, SI Figure 5). The mass (Mw) and number (Mn)-average molecular weight of the TPU ethers (aromatic, aliphatic) were reduced with increasing UV aging (Figure 3a,b, SI Table 2). The effect was more pronounced for the aromatic TPU_ether, resulting in broad peaks (polydispersity, PDI3000h = 17.7 vs PDI0h = 4.2) with low molecular masses (Mw,3000h = 12,000 g/mol compared to Mw,0h = 137,000 g/mol). An increasing crosslinking degree (SI Table 2) was observed for TPU_ether_arom but not for TPU_ether_ali. UV aging impacted the surface chemistry of TPU_ether_arom: the O–H/N–H stretch vibrations (3660–2990 cm–1)46,47 broadened, and the carbonyl (1780 cm–1, 1725 cm–1)46,48,49 peaks gained intensity over the UV aging time. The C–N (1530 cm–1)47 and the CH2 stretching vibration peaks (2940 cm–1, 2850 cm–1)50,51 showed an intensity decrease (Figure 3a). No spectral changes occurred for the aliphatic TPU_ether. The surface texture of the aromatic TPU_ether was more affected (rough structures, irregularities, brittleness, yellowish discoloration) than the surface texture of the aliphatic TPU_ether (slightly rough, no discoloration) (Figure 3a,b). The described trends of UV aging effects on aromatic/aliphatic TPU_ethers reappeared for the aromatic/aliphatic TPU_esters (SI Figure 5a,b, SI Table 2). This revealed that UV aging generally affected the TPU_ethers in a larger extent (compare to SI Table 2), leading to a subsumption of the four TPUs regarding UV durability:
Figure 3.
Characterization of primary microplastic powders before and after UV aging. Exemplary results for both of the TPU_ethers show a reduction in the molar mass distribution (more intense for the TPU aromatic), an increase of carbonyl- and hydroxyl functional groups (only for the TPU aromatic), and an affected surface texture (more intense for the TPU aromatic) with increasing duration of UV aging. More results are contained in SI Table 2 and SI Figure 5.
Aromatic moieties absorb the photon energy due to their delocalized electron system,46,52 leading to radical formation, auto-oxidation (reflected in Figure 3a: increasing carbonyl and hydroxyl signals at 3660–2990 cm–1, 1780 cm–1, and 1725 cm–1), chain cleavage, and thus degradation.16,17,53,54 A possible chain scission occurs at the C–N chemical bond located in the urethane group (intensity decrease in Figure 3a at 1530 cm–1), initiating the so-called photo-Fries rearrangement and carboxylic acids, as well as primary amines (Figure 3a: intensity increase at 3660–2990 cm–1, NH stretch vibration) result as degradation products.47,54 If a free radical originates at the methylene group CH2, located between two aromatic rings in the diisocyanate component, the resonance stability promotes a favorable energetic state.48,49,55,56 The following auto-oxidation (hydroperoxidation confirmed in Figure 3a at 3450 cm–1)57 generates quinoid chromophore structures, causing yellowish discoloration.46,48,50,58 Crosslinking in aromatic TPUs occurs by recombination of radicals or peroxide bridges.59,60 The decrease of the CH2 stretching vibrations (2940 cm–1, 2850 cm–1, Figure 3a) may hint to the occurrence of crosslinking and oxidation of the polymer chains.50,51 Aliphatic TPUs are slowly UV degraded since the degradation mechanism is predominantly based on the Norrish reactions next to the urethane bonds after auto-oxidation.46,48,49,59
The comparison between ether and ester-based TPUs revealed that polyether soft segments are more likely to abstract hydrogen than polyester soft segments, leading to free radical formation, oxidation, and chain scission.47−49 This assumption is supported by the decrease in signal intensity of the C–O–C vibration of the ether groups (1110 cm–1) over the UV aging time (Figure 3a),47 which is not the case in the ester-based TPU (SI Figure 5a). UV degradation predominantly occurs in the polyol soft segments, and if aromatic hard segments are contained, crosslinking and chain cleavage act as competing mechanisms.48
UV aging of PAs decreased molar masses with increasing duration of UV aging (SI Figure 5c,d, SI Table 2). For example, the Mw of PA-6 was 15,000 g/mol after 2000 h compared to Mw = 57,900 g/mol before aging. In contrast to the aromatic TPUs, crosslinking did not occur during UV aging. The change in polydispersity was also less intense than for the aromatic TPUs (PDI2000h = 7.5 vs PDI0h = 3.5). FT-IR spectra (SI Figure 5c) of PA-6 showed a broadened signal in the area of O–H and N–H stretch vibrations (3500–3000 cm–1)61,62 as well as an increasing intensity of the carbonyl signal at 1730 cm–1, which was also present in PA-12 (SI Figure 5d).61,63 We observed differences in the surface texture of the aged TPU surfaces. While the TPUs mainly showed irregularities and brittleness after aging, PA-6 showed nano-sized fragments on top of the surface (SI Figure 5c) and the formation of holes after 2000 h of UV aging. The latter were even more pronounced after 3000 h of UV aging (SI Figure 6). PA-12 was already covered with nano-sized structures before UV aging (SI Figure 5d) that were still present after UV aging and attributed to an inorganic anticaking agent. Discoloration was less intense than for the aromatic TPUs, leading only to a slight beige of the formerly white particles.
The main degradation mechanism for PA is also based on auto-oxidation (reflected in increasing signals at 3500–3000 cm–1 and 1730 cm–1), C–N chain scission (reduced molar masses), and photo-Fries rearrangement without crosslinking mechanisms.61,63,64 The hydroperoxides generated on the polymer surface are unable to initiate further reactions but are likely to decompose into hydroxyl groups, thus forming primary amines (3400 cm–1) and imide groups (1730 cm–1).61,65 Pyrrole degradation products or unsaturated oligoenimines in PA can show chromophoric properties,63,66,67 which are less pronounced than the quinoid structures in the TPUs. The hydroperoxides are more instable in PA-6 than in PA-12, making this material less durable against UV aging,63 while imides in PA-6 are more susceptible to hydrolysis than imides in PA-12.61
Fragmentation of Microplastics Down to Nanoplastics and Water-Soluble Organics Can Be Revealed by Adapting the NanoRelease Protocol
Aged particles should be more susceptible to mechanical stress. We adapted the NanoRelease protocol to quantify size-selective rates of fragmentation. Gentle shaking or sonication induces very similar release of nanoplastics from aged macroplastics,36 but the reproducibility was enhanced with the sonication protocol.35,62 We understand the sonication (mechanical process) as a sampling tool to determine the UV-dose-dependent rate of the formation of detachable fragments; others have used shaking in sand for this sampling purpose.18 Since our experiments were performed in a clean and controlled lab environment (dry UV aging, ultrasonication in ultrapure water, low background), the AUC-RI and a single-particle counter provided size-selective quantification of released micro- and nanoplastic fragments following UV aging. Pristine PA-6 already contained particles below 10 μm (Figure 4a).
Figure 4.
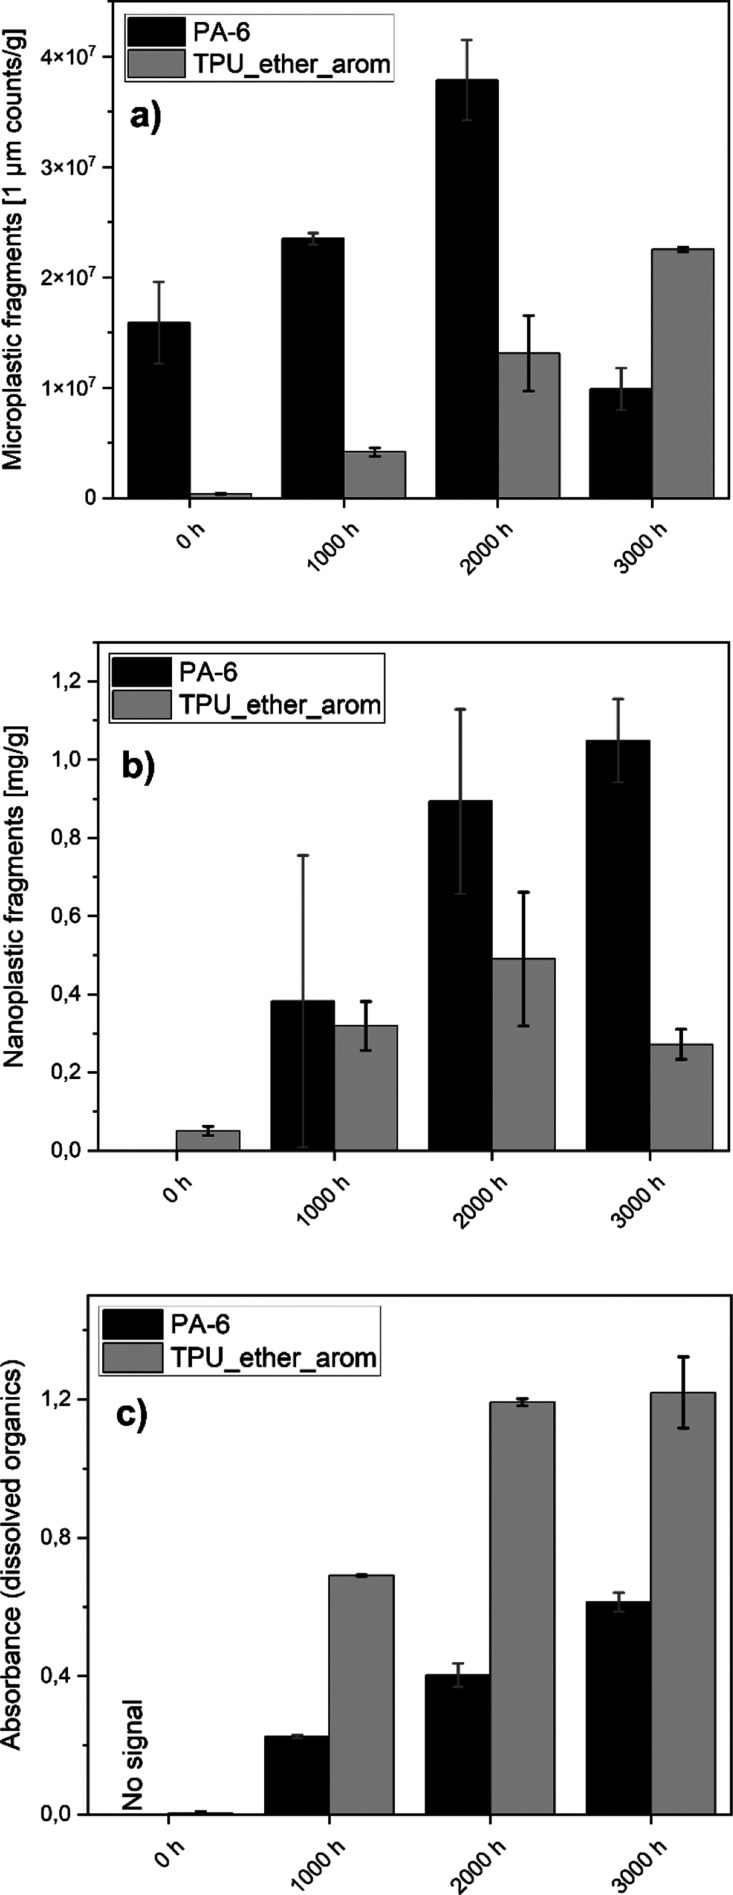
Evolution of the (nano)fragment and dissolved organic release from PA-6 and TPU_ether_arom over the UV aging time: (a) particle counts of microplastic fragments, (b) concentration of nanoplastic fragments, (c) signal intensity (UV–vis) of dissolved organics. After 3000 h, the release of nanoplastic fragments is reduced for TPU_ether_arom, while the release of 1 μm fragments is reduced for PA-6. The release of water-soluble organics increases over time for PA-6 but reached a plateau in the case of TPU_ether_arom. Duplicate testing (n = 2).
The dose-dependent evolution of micro- and nanoplastic fragment release was recorded as a function of UV aging (exemplary documented in Figure 4a,b). Differing from earlier studies on macroplastic degradation, the release increased roughly linearly with UV dose and did not show the lag time before fragmentation, as observed on macroscopics.68 For PA-6, there was an increase in released micro- and nanoplastic fragments until 2000 h of aging. At 3000 h of aging, the release of 1 μm particles reduced almost to the value of the pristine material, which implies further transformation of the previously formed detachable small particles in dissolved organics or volatile species before sampling. TPU_ether_arom showed a reduced release of nanoplastic fragments after 3000 h of UV aging compared to 2000 h of UV aging.
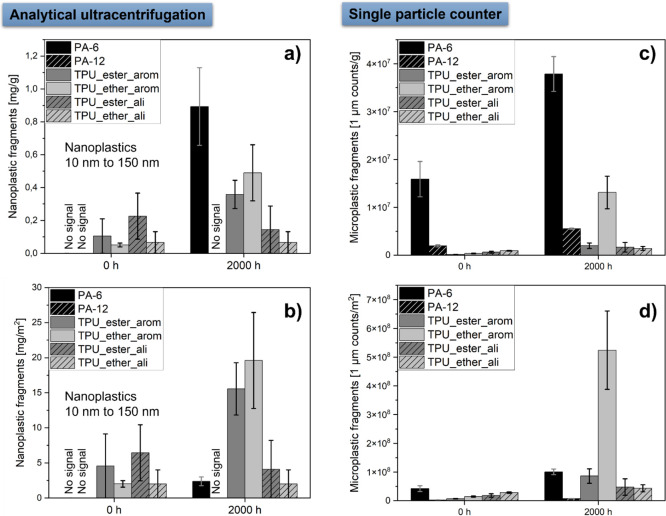
The 2000 h aged samples serve as a comparison between the polymers (Figure 5): After 2000 h of UV aging, we detected a mass concentration of micro- (∼1 μm) and nanoplastic (10–150 nm) fragments for PA-6 (0.89 mg nanoparticles released per gram aged PA-6, 37.8 × 10⁶ particle counts with a size of 1 μm) and for the aromatic TPUs (0.49 mg nanoparticles per gram aged TPU_ether_arom, 13.1 × 10⁶ particle counts with a size of 1 μm) compared to the lower release of the pristine PA-6 (no detectable mass of nanoparticles, 15.9 × 10⁶ particle counts with a size of 1 μm) and TPU_ether_arom (0.05 mg nanoparticles per gram TPU, 0.4 × 10⁶ particle counts with a size of 1 μm). Both aliphatic TPUs showed no detectable fragment release after UV aging. Even though a concentration of 0.36 mg/g nanoplastic fragments was detected for 2000 h aged TPU_ester_arom by AUC, no increase in the particle counts <1 μm was obtained by the particle counter. For PA-12, we could only detect a small increase of 1 μm particle counts (Figure 5a,c, compare also to raw data in SI Tables 3 and 4).
Figure 5.
Size-selective quantification of micro- and nanoplastic fragments released prior to and after 2000 h of UV aging: (a) released nanoplastic mass per gram (aged) polymer, (b) released nanoplastic mass per square meter of the polymer surface area, (c) particle counts of released microplastic fragments (1 μm) per gram (aged) polymer, (d) particle counts of released microplastic fragments (1 μm) per square meter of the polymer surface area. A significant amount of micro- and nanoplastic fragments was generated for PA-6 and aromatic TPU after 2000 h of UV aging. Full kinetics are listed in SI Tables 3 and 4. Duplicate testing (n = 2).
The release per primary microplastic mass was higher from PA-6 than from TPU, but after rescaling to release per surface (Figure 5b,d), the release from PA-6 (2.38 mg/m2) was lower than from the aromatic TPUs (e.g., 19.6 mg/m2 for TPU_ether_arom), whereas consistently all tested aliphatic TPUs remained compatible with zero micro- and nanoplastic fragment release in either metric.
The size distribution of the detected nanoplastic fragments (Figure 6, PA-6 and TPU_ether_arom) shows a maximum of around 10–20 nm and hardly any components above 50 nm. This may explain that such releases remained elusive in many of the previous attempts to quantify nanoplastics because the size is below detection limits of many techniques. It is also tempting to compare the size of the nanoplastics to the size of the spherulites or other crystalline domains in the original polymer. This may have changed by degradation in the bulk and at the surface of the particles and was not further investigated here. The size of the nanoplastics around 5–50 nm directly measured by an absolute technique is not directly relatable to the area between the microcracks observed on the surface of the aged polymer believed to preconfigure the fragment sizes.69
Figure 6.
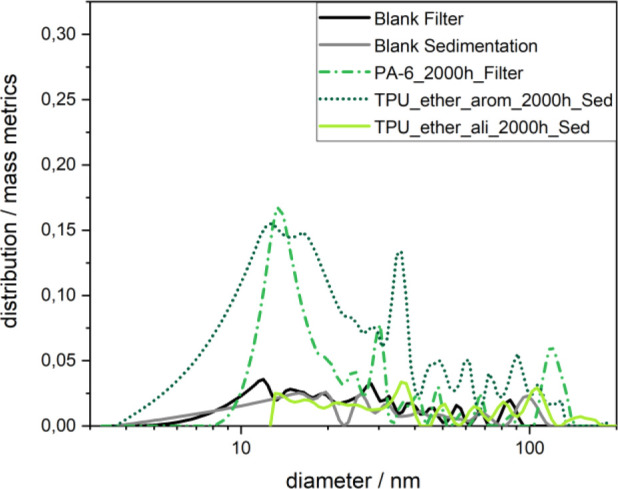
Particle size distributions of released nanoplastic fragments for selected polymer types after 2000 h of UV aging (size range only at 10 k rcf, 10–150 nm). A broad and intense distribution occurs for TPU_ether_arom and PA-6, while TPU_ether_ali and the blank samples show a noisy signal, indicating the absence of particles.
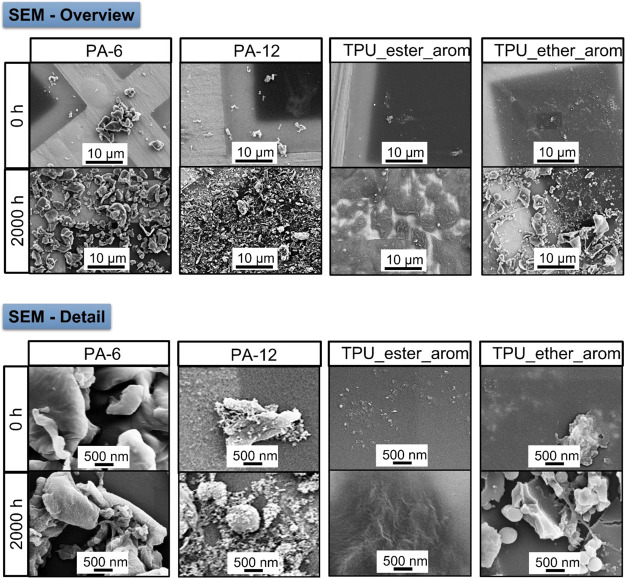
SEM images of the released particles may indicate their shapes and sizes (Figure 7). In the case of the PAs, particles with rounded edges were released. The surface of these particles showed lamella-like structures (SI Figure 7), which could indicate a high percentage of crystallites.7 The surface of the released TPU_ether_arom particles showed no irregularities but instead sharp breaking edges. We also found a high percentage of spherical particles (SI Figure 8). Based on these observations and the evolution of the surface texture of the microplastics (Figure 3 vs SI Figure 6), we assume different fragmentation mechanisms for PA-6 and TPU_ether_arom:
(1) TPU_ether_arom fragmentation to nanoplastics (fragmented surface, breaking edges in released particles) is based on the surface ablation mechanism due to microcracks.7,69
(2) PA-6 (holes and nano-sized structures on the surface, rounded released particles) shows signs of degradation, implying a decomposition of the surface, leading to the release of shrinking particles (remains after decomposition, possibly crystallites).7
Figure 7.
Particle shapes and sizes of released products. The released particles of TPU_ether_arom showed sharp breaking edges, whereas rounded particles were released from PA. In the case of TPU_ester_arom, no particles were visible, but instead a textured organic residue occurred, even though the water-soluble organics were removed during the centrifugal washing steps.
The released particles from PA-12 induced electron scattering during SEM. Their shapes and sizes showed similarities with the nano-sized structures already present on the pristine particle surface, attributed to inorganic anticaking agents.
AUC-RI measurements of TPU_ester_arom revealed nanoparticle release, but the amount of 1 μm-sized particles was low. On the corresponding SEM images, no released solid particles were found but rather an organic residue with nano-sized structures. According to the corresponding FT-IR spectrum, the residue is mainly composed of the polyester-polyol located in the TPU soft segments (SI Figure 9). The intensity of polyurethane groups (hard segments, −C–N– at 1530 cm–1) is low compared to the original spectrum of TPU_ester_arom. This observation leads to the assumption that chain scission occurred in the TPU soft segments only, leading to the release of the observed residue. AUC-RI measurements monitored the sedimentation of this residue as swollen macromolecules. After sedimentation, the released product has no particulate structure. No evaluable amount of particles was visible on the TEM grids of the aliphatic TPUs, as well as on the blank samples after filtration or sedimentation (SI Figure 10).
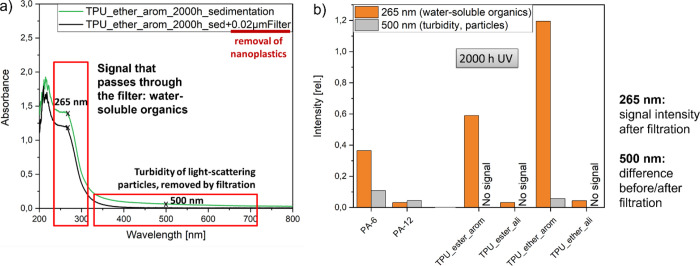
After observing the release of organic residue instead of micro- and nanoplastic fragments following UV aging of TPU_ester_arom, we wanted to gain deeper insights into the possible type of released species. For this purpose, we exploited the measured UV–vis spectra after 2000 h of UV aging (Figure 8a): The intensity at 500 nm describes the turbidity of light-scattering particles, while the signal at 265 nm (after filtration) stands for the released water-soluble organics. Comparing the aged PAs with the aged TPUs (Figure 8b), it became obvious that only aged PAs and TPU_ether_arom released nanoplastic fragments, while both aromatic TPUs and PA-6 released water-soluble organics. The released organics of these samples after 2000 h of UV aging ranged between 10 and 46 mg/g (TOC, SI Table 6).
Figure 8.
Which species (plastic fragments/water-soluble organics) is generated after dry UV aging? After removing the plastic fragments from the dispersion, a comparison of the signals at 265 nm (dissolved organics) and at 500 nm (particles) before and after filtration revealed the presence of a significant amount of water-soluble organics for PA-6 and the aromatic TPUs, as well as the presence of a significant amount of light-scattering particles for both PAs and TPU_ether_arom.
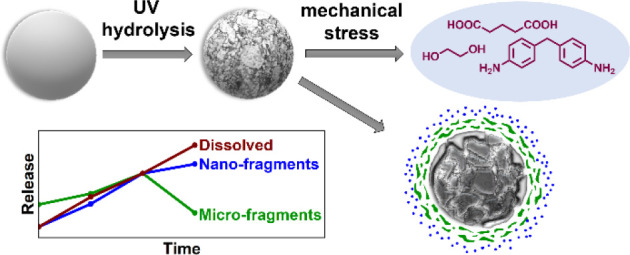
For all investigated microplastics, we observed an increase in the signal at 265 nm with increasing duration of UV aging (SI Figure 11, Figure 4c, SI Table 6), implying the formation of dissolved organics. For TPU_ether_arom, the turbidity signal became more pronounced with increasing UV aging (SI Figure 11e). This is in accordance with the results of the particle counter since the release of microplastic fragments rises over time. The turbidity signal of PA-12 shows the same intensity for each aging step (SI Figure 11b). This supports the assumption that only the inorganic anticaking agent is removed from the surface of PA-12, causing the signal without additional release of PA-12 fragments. UV aging of PA-6 up to 2000 h leads to an increase of water-soluble organics and particles (SI Figure 11a). After 3000 h of UV aging, the turbidity signal disappeared, while the signal of the dissolved organics was more intense than in the filtered sample after 2000 h of UV aging (Figure 4c). Considering the reduced release of 1 μm fragments determined by the particle counter, it seems that the first formed fragments are further degraded, and after a specific UV aging duration, they are mainly dissociated into water-soluble organics. Recent experiments showed that only a surface layer with a depth of approx. 30 μm is affected by photo-oxidation, which is already known to be independent from the UV duration time.69,70 The rate of photo-oxidation also depends on the possibility of oxygen diffusion within the sample.70,71 This means that the first surface layer needs to be degraded before the next surface layer can be affected, starting a new degradation cycle. In the case of PA-6, the influence of hydrolysis after UV aging should also be considered: PA-6 is able to take up water up to 9.5% (determined by ISO Test Method 62, standard conditions 23 °C), which favors hydrolysis. After dry UV aging, imide groups are introduced on the particle surface, which are susceptible to hydrolytic attack in particular.61 Increasing aging duration increases imide groups, resulting in chain scission and dissociation into dissolved organics when the material gets into contact with water. The impact by hydrolysis might be low in the conducted experiments because polymer powders were added to water after UV aging. A combined exposure to UV and rain on macroplastic plates led to less fragments released because fragments were lost during rain events.72 Future experiments could focus on the combined hydrolysis and UV in submersed exposure or by controlled air humidity.
Environmental Implications: Relevance for Micro- and Nanoplastic Fate Assessment
Experimental insights into fragmentation pathways and measured fragmentation rates parameterize environmental fate models, such as the recent Full Multi model.39 Its first release assumed a consecutive fragmentation from each size class to the next smaller one. This assumption likely underestimates the formation of smaller (i.e., nanosized) fragments and the low degree of confidence in the theoretical formulation and its parameterization.39 The improved mechanistic understanding of formation of micro- and nanoplastic fragments via surface ablation from larger microplastics will be implemented in the next model version by updating the fragmentation description to include direct fragmentation from the largest to all smaller size classes. This is demonstrated by the example of TPU_ether_arom (SI Table 7) with size- selective fragmentation rates from the initial 50-to-200-μm microplastic to only three receiving size bins for simplicity. The resulting rates were 2.6 × 10⁻⁷/h, 9.4 × 10⁻⁸/h, and 2.4 × 10⁻⁷/h to the size bins of 10-to-150 nm, 40-to-800 nm, and 300-to-5000 nm, respectively, and additionally a transfer rate of 6.3 × 10⁻⁶/h to dissolved organics. The same approach with higher-resolved and well-separated size bins will replace current “best guess” estimates in sophisticated fate models. Alternatively, a simplistic approach only to the UV-induced fragmentation rate finds the highest transformation of the initial 50-to-200-μm microplastics into 10-to-5-μm micro- and nanoplastic fragments with 0.951 mg/g/year for PA-6 and 0.589 mg/g/year for TPU_ether_arom (derived from SI Table 3, sum of AUC-detectable fragments at 2000 h). In parallel, dissolved organics emerge with rates of 23.1 mg/g/year (PA-6) and 7.8 mg/g/year (TPU_ether_arom). Converting the mass rate to a yearly loss of a spherical surface layer gives 171 nm/year (PA-6) or 346 nm/year (TPU_ether_arom) (SI Table 5). Assuming constant rates, this implies a half-life of 147 years for a PA-6 particle with 100 μm diameter in mid-European conditions, respectively, 73 years for a TPU_ether_arom particle of the same size until the mother particle is transformed into water-soluble organics and fragments. Our findings showed that dissolved organics are a major product of plastic weathering, which was historically not considered in plastic fate and ecological risk assessment, focusing on fragmentation only. Identification and risk assessment of such dissolved species are desirable for future work since nontarget analysis is needed.73 Motivated by investigations on additive release,74 researchers had started to investigate water-soluble degradation byproducts as well.75−77 This study compares release rates of dissolved species to those of small nanoplastics with sizes from 10 to 20 nm, which has not been addressed earlier. This significant loss term needs to be included in plastic fate and degradation models.78−80 Our present methods do not yet allow a conclusion if smaller particles, which may be enriched in crystalline domains, might have lower fragmentation rates and if chemical degradation and release rates of all species are best expressed as rate per surface. An integrated model of transport processes in different environmental compartments and fragmentation/degradation stresses is required to advance on that topic. The rates describe the scenario of UV degradation only without transport to compartments, where other stresses may dominate (e.g., enzymatic degradation, biofilm formation, and pH influence).
Depending on the actual environmental compartment, the estimated rates might differ from those measured by the present methods. For example, biofilm formation was reported to impact the transmittance of UV light,81−83 but biofilms were not possible to study in the present setup with dry aging under intense UV light. Studies in natural marine waters would add realism on biofilms but would prevent the sensitivity of quantification in the detection range down to 2 nm, as achieved here. The present approach might be most relevant for particles experiencing UV aging on upper sand layers or for those floating on the surface of the sea water. Still, similar surface degradation, cracking, and attached fragments were found in field experiments.84,85 As another example, the applied sonication describes a worst-case scenario for mechanical abrasion compared to environmental mechanical stresses;86 here, it was used as a sampling step. Literature supports that dry UV aging leads to crack formation and in consequence to fragment formation, before any mechanical treatment is applied.69 These previously formed fragments can be released (i.e., sampled) by any mechanical treatment, and in fact earlier NanoRelease studies compared shear-free immersion to gentle shaking to ultrasonication and found that shaking or sonication induced comparable fragment release rates, and also shear-free immersion was found to be in the same order of magnitude.37,87 Other studies related mass loss during UV aging to transformation into volatile species,80 but this is very indirect and could not be applied in our case because of the water uptake of PA-6 and TPU, which impacts the final masses.
In the current study, the transformation of microplastics into micro- and nanoplastic fragments and dissolved species was determined by an improved method. The demonstration on several grades of environmentally relevant polymers evidenced no concerns on the application to further polymer types. Even for floating polymers (e.g., polyolefines), all present methods are applicable by simply using D2O instead of H2O as the immersion medium. An alternative setup would however be needed to determine transformation into volatile species during UV aging. Since the availability of coherent datasets enables improved model accuracy and specific assessment of different types of polymers over time in different compartments, the present method enables filling of these knowledge gaps.
Acknowledgments
This publication would not have been possible without the dedicated laboratory support of Klaus Vilsmeier, Christian Roth, and Manuel Metzner. The authors are also sincerely grateful to Gitta Egbers for her support on material selection and discussion and to Ute Heinemeyer (SEM, surface texture), Rolf Tompers (TOC), and Christiane Lang (GPC) for polymer analytics.
Supporting Information Available
The Supporting Information is available free of charge at https://pubs.acs.org/doi/10.1021/acs.est.2c01228.
Additional information on technical properties of the polymers, micrographs of pristine and aged polymer and of its fragments, extensive analytical methods and controls, characterization of PA-6 and PA-12 and TPU_ester_arom and TPU_ester_aliphatic before and after UV aging, molar mass descriptors of all polymers at all sampling times, size-specific concentration and counts of nanoplastic fragments and of dissolved organics from all polymers, and calculations of halftimes and rates (PDF)
Author Contributions
All authors read, revised, and approved the final manuscript. P.P. and M.W. (FT-IR) carried out the experiments for this study. A.P. and P.D. performed the rate fitting. P.P. wrote the manuscript with contributions from W.W., T.Hü., T.Ho., A.P., and L.M. W.W. and T.Ho. supervised the project.
This work was partially funded by the BMBF (German Federal Ministry of Education and Research) project entitled InnoMat.Life – Innovative materials: safety in lifecycle (03XP0216C).
The authors declare the following competing financial interest(s): Some of the authors are employees of BASF, a company producing and marketing polymers, including plastics.
Supplementary Material
References
- Thompson R. C.; Olsen Y.; Mitchell R. P.; Davis A.; Rowland S. J.; John A. W. G.; McGonigle D.; Russell A. E. Lost at Sea: Where Is All the Plastic?. Science 2004, 304, 838. 10.1126/science.1094559. [DOI] [PubMed] [Google Scholar]
- Backhaus T.; Wagner M. Microplastics in the Environment: Much Ado about Nothing? A Debate. Glob. Challenges 2020, 4, 1900022 10.1002/gch2.201900022. [DOI] [PMC free article] [PubMed] [Google Scholar]
- Gigault J.; El Hadri H.; Nguyen B.; Grassl B.; Rowenczyk L.; Tufenkji N.; Feng S.; Wiesner M. Nanoplastics are neither microplastics nor engineered nanoparticles. Nat. Nanotechnol. 2021, 16, 501–507. 10.1038/s41565-021-00886-4. [DOI] [PubMed] [Google Scholar]
- https://echa.europa.eu/documents/10162/827ab66d-8f59-9076-e000-064274ba5b5e
- 129 STAT. 3129
- Boucher J.; Friot D., Primary Microplastics in the Oceans: a Global Evaluation of Sources. International Union for Conservation of Nature and Natural Resources; Gland, Switzerland: 2017, 1–43. [Google Scholar]
- Andrady A. L. The plastic in microplastics: A review. Mar. Pollut. Bull. 2017, 119, 12–22. 10.1016/j.marpolbul.2017.01.082. [DOI] [PubMed] [Google Scholar]
- Schmiedgruber M.; Hufenus R.; Mitrano D. M. Mechanistic understanding of microplastic fiber fate and sampling strategies: Synthesis and utility of metal doped polyester fibers. Water Res. 2019, 155, 423–430. 10.1016/j.watres.2019.02.044. [DOI] [PubMed] [Google Scholar]
- Gündoğdu S.; Çevik C.; Güzel E.; Kilercioğlu S. Microplastics in municipal wastewater treatment plants in Turkey: a comparison of the influent and secondary effluent concentrations. Environ. Monit. Assess. 2018, 190, 626. 10.1007/s10661-018-7010-y. [DOI] [PubMed] [Google Scholar]
- Crichton E. M.; Noël M.; Gies E. A.; Ross P. S. A novel, density-independent and FTIR-compatible approach for the rapid extraction of microplastics from aquatic sediments. Anal. Methods 2017, 9, 1419–1428. 10.1039/C6AY02733D. [DOI] [Google Scholar]
- Nuelle M.-T.; Dekiff J. H.; Remy D.; Fries E. A new analytical approach for monitoring microplastics in marine sediments. Environ. Pollut. 2014, 184, 161–169. 10.1016/j.envpol.2013.07.027. [DOI] [PubMed] [Google Scholar]
- Tsiota P.; Karkanorachaki K.; Syranidou E.; Franchini M.; Kalogerakis N., Microbial Degradation of HDPE Secondary Microplastics: Preliminary Results. Proceedings of the International Conference on Microplastic Pollution in the Mediterranean Sea. Springer Water; Springer: Cham: 2017, 181–188. [Google Scholar]
- Arhant M.; Le Gall M.; Le Gac P.-Y.; Davies P. Impact of hydrolytic degradation on mechanical properties of PET Towards an understanding of microplastics formation. Polym. Degrad. Stab. 2019, 161, 175–182. 10.1016/j.polymdegradstab.2019.01.021. [DOI] [Google Scholar]
- ter Halle A.; Ladirat L.; Martignac M.; Mingotaud A. F.; Boyron O.; Perez E. To what extent are microplastics from the open ocean weathered?. Environ. Pollut. 2017, 227, 167–174. 10.1016/j.envpol.2017.04.051. [DOI] [PubMed] [Google Scholar]
- Kalogerakis N.; Karkanorachaki K.; Kalogerakis C.; Triantafyllidi E. I.; Gotsis A. D.; Partsinevelos P.; Fava F. Microplastics Generation: Onset of Fragmentation of Polyethylene Films in Marine Environment Mesocosms. Front. Mar. Sci. 2017, 4, 1–15. 10.3389/fmars.2017.00084. [DOI] [Google Scholar]
- Andrady A. L. Microplastics in the marine environment. Mar. Pollut. Bull. 2011, 62, 1596–1605. 10.1016/j.marpolbul.2011.05.030. [DOI] [PubMed] [Google Scholar]
- Billingham N. C. Localization of oxidation in polypropylene. Makromol. Chem. Macromol. Symp. 1989, 28, 145–163. 10.1002/masy.19890280111. [DOI] [Google Scholar]
- Song Y. K.; Hong S. H.; Jang M.; Han G. M.; Jung S. W.; Shim W. J. Combined Effects of UV Exposure Duration and Mechanical Abrasion on Microplastic Fragmentation by Polymer Type. Environ. Sci. Technol. 2017, 51, 4368–4376. 10.1021/acs.est.6b06155. [DOI] [PubMed] [Google Scholar]
- Wright L. S.; Napper I. E.; Thompson R. C. Potential microplastic release from beached fishing gear in Great Britain’s region of highest fishing litter density. Mar. Pollut. Bull. 2021, 173, 113115 10.1016/j.marpolbul.2021.113115. [DOI] [PubMed] [Google Scholar]
- Kowalski N.; Reichardt A. M.; Waniek J. J. Sinking rates of microplastics and potential implications of their alteration by physical, biological, and chemical factors. Mar. Pollut. Bull. 2016, 109, 310–319. 10.1016/j.marpolbul.2016.05.064. [DOI] [PubMed] [Google Scholar]
- Chubarenko I.; Efimova I.; Bagaeva M.; Bagaev A.; Isachenko I. On mechanical fragmentation of single-use plastics in the sea swash zone with different types of bottom sediments: Insights from laboratory experiments. Mar. Pollut. Bull. 2020, 150, 110726 10.1016/j.marpolbul.2019.110726. [DOI] [PubMed] [Google Scholar]
- Koelmans A. A. Proxies for nanoplastic. Nat. Nanotechnol. 2019, 14, 307–308. 10.1038/s41565-019-0416-z. [DOI] [PubMed] [Google Scholar]
- Gigault J.; Pedrono B.; Maxit B.; Ter Halle A. Marine plastic litter: the unanalyzed nano-fraction. Environ. Sci.: Nano 2016, 3, 346–350. 10.1039/C6EN00008H. [DOI] [Google Scholar]
- Lambert S.; Wagner M. Characterisation of nanoplastics during the degradation of polystyrene. Chemosphere 2016, 145, 265–268. 10.1016/j.chemosphere.2015.11.078. [DOI] [PMC free article] [PubMed] [Google Scholar]
- Luo Y.; Li L.; Feng Y.; Li R.; Yang J.; Peijnenburg W.; Tu C. Quantitative tracing of uptake and transport of submicrometre plastics in crop plants using lanthanide chelates as a dual-functional tracer. Nat. Nanotechnol. 2022, 17, 424–431. 10.1038/s41565-021-01063-3. [DOI] [PubMed] [Google Scholar]
- Lehner R.; Weder C.; Petri-Fink A.; Rothen-Rutishauser B. Emergence of Nanoplastic in the Environment and Possible Impact on Human Health. Environ. Sci. Technol. 2019, 53, 1748–1765. 10.1021/acs.est.8b05512. [DOI] [PubMed] [Google Scholar]
- Wang L.; Wu W.-M.; Bolan N. S.; Tsang D. C. W.; Li Y.; Qin M.; Hou D. Environmental fate, toxicity and risk management strategies of nanoplastics in the environment: Current status and future perspectives. J. Hazard. Mater. 2021, 401, 123415 10.1016/j.jhazmat.2020.123415. [DOI] [PMC free article] [PubMed] [Google Scholar]
- Girois S.; Audouin L.; Verdu J.; Delprat B.; Marot G. Molecular weight changes during the photooxidation of isotactic polypropylene. Polym. Degrad. Stab. 1996, 51, 125–132. 10.1016/0141-3910(95)00166-2. [DOI] [Google Scholar]
- Koelmans A. A.; Besseling E.; Shim W. J., Nanoplastics in the Aquatic Environment. Critical Review. In Marine Anthropogenic Litter; Springer: Cham, Switzerland, 2015; 325–340. [Google Scholar]
- Cohen J. L.; Van Aartsen J. J.; et al. J. Polym. Sci. 1973, 42, 1325–1338. 10.1002/polc.5070420333. [DOI] [Google Scholar]
- Chaupart N.; Serpe G.; Verdu J. Molecular weight distribution and mass changes during polyamide hydrolysis. Polymer 1998, 39, 1375–1380. 10.1016/S0032-3861(97)00414-X. [DOI] [Google Scholar]
- Alimi O. S.; Claveau-Mallet D.; Kurusu R. S.; Lapointe M.; Bayen S.; Tufenkji N. Weathering pathways and protocols for environmentally relevant microplastics and nanoplastics: What are we missing?. J. Hazard. Mater. 2022, 423, 126955 10.1016/j.jhazmat.2021.126955. [DOI] [PubMed] [Google Scholar]
- Hüffer T.; Praetorius A.; Wagner S.; von der Kammer F.; Hofmann T. Microplastic Exposure Assessment in Aquatic Environments: Learning from Similarities and Differences to Engineered Nanoparticles. Environ. Sci. Technol. 2017, 51, 2499–2507. 10.1021/acs.est.6b04054. [DOI] [PubMed] [Google Scholar]
- Petersen E. J.; Kennedy A. J.; Huffer T.; von der Kammer F. Solving Familiar Problems: Leveraging Environmental Testing Methods for Nanomaterials to Evaluate Microplastics and Nanoplastics. Nanomaterials (Basel) 2022, 12, 1332. 10.3390/nano12081332. [DOI] [PMC free article] [PubMed] [Google Scholar]
- Wohlleben W.; Kingston C.; Carter J.; Sahle-Demessie E.; Vázquez-Campos S.; Acrey B.; Chen C.-Y.; Walton E.; Egenolf H.; Müller P.; Zepp R. NanoRelease: Pilot interlaboratory comparison of a weathering protocol applied to resilient and labile polymers with and without embedded carbon nanotubes. Carbon 2017, 113, 346–360. 10.1016/j.carbon.2016.11.011. [DOI] [PMC free article] [PubMed] [Google Scholar]
- Wohlleben W.; Neubauer N. Quantitative rates of release from weathered nanocomposites are determined across 5 orders of magnitude by the matrix, modulated by the embedded nanomaterial. NanoImpact 2016, 1, 39–45. 10.1016/j.impact.2016.01.001. [DOI] [Google Scholar]
- Ruggiero E.; Vilsmeier K.; Mueller P.; Pulbere S.; Wohlleben W. Environmental release from automotive coatings are similar for different (nano)forms of pigments. Environ. Sci.: Nano 2019, 6, 3039–3048. 10.1039/C9EN00227H. [DOI] [Google Scholar]
- Gigault J.; Halle A. T.; Baudrimont M.; Pascal P. Y.; Gauffre F.; Phi T. L.; El Hadri H.; Grassl B.; Reynaud S. Current opinion: What is a nanoplastic?. Environ. Pollut. 2018, 235, 1030–1034. 10.1016/j.envpol.2018.01.024. [DOI] [PubMed] [Google Scholar]
- Domercq P.; Praetorius A.; MacLeod M. The Full Multi: An open-source framework for modelling the transport and fate of nano- and microplastics in aquatic systems. Environ. Model. Softw. 2022, 148, 105291 10.1016/j.envsoft.2021.105291. [DOI] [Google Scholar]
- Mitrano D. M.; Wohlleben W. Microplastic regulation should be more precise to incentivize both innovation and environmental safety. Nat. Commun. 2020, 11, 5324. 10.1038/s41467-020-19069-1. [DOI] [PMC free article] [PubMed] [Google Scholar]
- Mendes L.; Kangas A.; Kukko K.; Mølgaard B.; Sämänen A.; Kanerva T.; Flores Ituarte I.; Huhtiniemi M.; Stockmann-Juvala H.; Partanen J.; Hämeri K.; Eleftheriadis K.; Viitanen A.-K. Characterization of Emissions from a Desktop 3D Printer. J. Ind. Ecol. 2017, 21, S94–S106. 10.1111/jiec.12569. [DOI] [Google Scholar]
- Ford S.; Despeisse M. Additive manufacturing and sustainability: an exploratory study of the advantages and challenges. J. Clean. Prod. 2016, 137, 1573–1587. 10.1016/j.jclepro.2016.04.150. [DOI] [Google Scholar]
- Ghobadian A.; Talavera I.; Bhattacharya A.; Kumar V.; Garza-Reyes J. A.; O’Regan N. Examining legitimatisation of additive manufacturing in the interplay between innovation, lean manufacturing and sustainability. Int. J. Prod. Econ. 2020, 219, 457–468. 10.1016/j.ijpe.2018.06.001. [DOI] [Google Scholar]
- https://www.plasticseurope.org/
- Normenausschuss Kunststoffe (Plastics Standards Committee), T. C. N.-.-A. V. g. U ., Plastics – Methods of exposure to laboratory light sources - Amendment A1:2009); European Committee for Standardization; 2009. [Google Scholar]
- Beachell H. C.; Chang I. L. Photodegradation of Urethane Model Systems. J. Polym. Sci. 1972, 10, 503–520. 10.1002/pol.1972.150100216. [DOI] [Google Scholar]
- Theiler G.; Wachtendorf V.; Elert A.; Weidner S. Effects of UV radiation on the friction behavior of thermoplastic polyurethanes. Polym. Test. 2018, 70, 467–473. 10.1016/j.polymertesting.2018.08.006. [DOI] [Google Scholar]
- Dannoux A.; Esnouf S.; Amekraz B.; Dauvois V.; Moulin C. Degradation mechanism of poly(ether-urethane) Estane® induced by high-energy radiation. II. Oxidation effects. J. Polym. Sci. B Polym. Phys. 2008, 46, 861–878. 10.1002/polb.21419. [DOI] [Google Scholar]
- Gardette J. L.; Lemaire J. Oxydation photothermique d’élastomères de polyuréthannes thermoplastiques. Makromol. Chem. 1981, 182, 2723–2736. 10.1002/macp.1981.021821019. [DOI] [Google Scholar]
- Wilhelm C.; Rivaton A.; Gardette J. L. Infrared analysis of the photochemical behaviour of segmented polyurethanes: 3. Aromatic diisocyanate based polymers. Polymer 1998, 39, 1223–1232. 10.1016/S0032-3861(97)00353-4. [DOI] [Google Scholar]
- Bruckmoser K.; Resch K. Investigation of Ageing Mechanisms in Thermoplastic Polyurethanes by Means of IR and Raman Spectroscopy. Macromol. Symp. 2014, 339, 70–83. 10.1002/masy.201300140. [DOI] [Google Scholar]
- Decker D.; Moussa K.; Bendaikha T. Photodegradation of UV-cured coatings II. Polyurethane–acrylate networks. J. Polym. Sci., Part A: Polym. Chem. 1991, 29, 739–747. 10.1002/pola.1991.080290516. [DOI] [Google Scholar]
- Geuskens G.; Baeyens-Volant D.; Delaunois G.; Lu-Vinh Q.; Piret W.; David C. Photo-oxidation of polymers - I: A quantitative study of the chemical reactions resulting from irradiation of polystyrene at 253. 7 nm in the presence of oxygen. Eur. Polym. J. 1978, 14, 291–297. 10.1016/0014-3057(78)90051-4. [DOI] [Google Scholar]
- Hoyle C. E.; Kim K.-J.; No Y. G.; Nelson G. L. Photolysis of Segmented Polyurethanes. The Role of Hard-Segment Content and Hydrogen Bonding. J. Appl. Polym. Sci. 1987, 34, 763–774. 10.1002/app.1987.070340227. [DOI] [Google Scholar]
- Griller D.; Ingold K. U. Persistent Carbon-Centered Radicals. Acc. Chem. Res. 1976, 9, 13–19. 10.1021/ar50097a003. [DOI] [Google Scholar]
- Jockusch S.; Hirano T.; Liu Z.; Turro N. J. A Spectroscopic Study of Diphenylmethyl Radicals and Diphenylmethyl Carbocations Stabilized by Zeolites. J. Phys. Chem. B 2000, 104, 1212–1216. 10.1021/jp992978s. [DOI] [Google Scholar]
- Singh R. P.; Tomer N. S.; Bhadraiah S. V. Photo-oxidation studies on polyurethane coating: effect of additives on yellowing of polyurethane. Polym. Degrad. Stab. 2001, 73, 443–446. 10.1016/S0141-3910(01)00127-6. [DOI] [Google Scholar]
- Rosu D.; Rosu L.; Cascaval C. N. IR-change and yellowing of polyurethane as a result of UV irradiation. Polym. Degrad. Stab. 2009, 94, 591–596. 10.1016/j.polymdegradstab.2009.01.013. [DOI] [Google Scholar]
- Scholz P.; Wachtendorf V.; Panne U.; Weidner S. M. Degradation of MDI-based polyether and polyester-polyurethanes in various environments - Effects on molecular mass and crosslinking. Polym. Test. 2019, 77, 105881. 10.1016/j.polymertesting.2019.04.028. [DOI] [Google Scholar]
- Xie F.; Zhang T.; Bryant P.; Kurusingal V.; Colwell J. M.; Laycock B. Degradation and stabilization of polyurethane elastomers. Prog. Polym. Sci. 2019, 90, 211–268. 10.1016/j.progpolymsci.2018.12.003. [DOI] [Google Scholar]
- Roger A.; Sallet D.; Lemaire J. Photochemistry of Aliphatic Polyamides. 4. Mechanisms of Photooxidation of Polyamides 6, 11, and 12 at Long Wavelengths. Macromolecules 1986, 19, 579–584. 10.1021/ma00157a015. [DOI] [Google Scholar]
- Wohlleben W.; Vilar G.; Fernández-Rosas E.; González-Gálvez D.; Gabriel C.; Hirth S.; Frechen T.; Stanley D.; Gorham J.; Sung L.-P.; Hsueh H.-C.; Chuang Y.-F.; Nguyen T.; Vazquez-Campos S. A pilot interlaboratory comparison of protocols that simulate aging of nanocomposites and detect released fragments. Environ. Chem. 2014, 11, 402. 10.1071/EN14072. [DOI] [Google Scholar]
- Lemaire J.; Gardette J. L.; Rivaton A.; Roger A. Dual photo-chemistries in aliphatic polyamides, bisphenol A polycarbonate and aromatic polyurethanes - A short review. Polym. Degrad. Stab. 1986, 15, 1–13. 10.1016/0141-3910(86)90002-9. [DOI] [Google Scholar]
- Li X.; Zhao X.; Ye L. Stress photo-oxidative aging behaviour of polyamide 6. Polym. Int. 2012, 61, 118–123. 10.1002/pi.3155. [DOI] [Google Scholar]
- Tang L.; Sallet D.; Lemaire J. Photochemistry of polyundecanamides. 1. Mechanisms of photooxidation at short and long wavelengths. Macromolecules 1982, 15, 1432–1437. 10.1021/ma00233a043. [DOI] [Google Scholar]
- Ties K.; Rossbach V. Thermo-oxidative degradation of polyamide 6 and polyamide 6,6 - Structure of UVVIS-active chromophores. Die Makromol. Chem. 1990, 191, 757–771. 10.1002/macp.1990.021910404. [DOI] [Google Scholar]
- He Y.; Chen S.; Zheng Q.; Chen Y. Thermal stability and yellowing of polyamide finished with a compound anti-thermal-yellowing agent. J. Text. Inst. 2015, 106, 1263–1269. 10.1080/00405000.2014.988435. [DOI] [Google Scholar]
- Scifo L.; Chaurand P.; Bossa N.; Avellan A.; Auffan M.; Masion A.; Angeletti B.; Kieffer I.; Labille J.; Bottero J. Y.; Rose J. Non-linear release dynamics for a CeO2 nanomaterial embedded in a protective wood stain, due to matrix photo-degradation. Environ. Pollut. 2018, 241, 182–193. 10.1016/j.envpol.2018.05.045. [DOI] [PubMed] [Google Scholar]
- Meides N.; Menzel T.; Poetzschner B.; Loder M. G. J.; Mansfeld U.; Strohriegl P.; Altstaedt V.; Senker J. Reconstructing the Environmental Degradation of Polystyrene by Accelerated Weathering. Environ. Sci. Technol. 2021, 55, 7930–7938. 10.1021/acs.est.0c07718. [DOI] [PubMed] [Google Scholar]
- Audouin L.; Langlois V.; Verdu J.; de Bruijn J. C. M. Role of oxygen diffusion in polymer ageing: kinetic and mechanical aspects. J. Mater. Sci. 1994, 29, 569–583. 10.1007/BF00445968. [DOI] [Google Scholar]
- Cunliffe A. V.; Davis A. Photo-oxidation of Thick Polymer Samples - Part II: The Influence of Oxygen Diffusion on the Natural and Artificial Weathering of Polyolefins. Polym. Degrad. Stab. 1982, 4, 17–37. 10.1016/0141-3910(82)90003-9. [DOI] [Google Scholar]
- Zepp R.; Ruggiero E.; Acrey B.; Davis M. J. B.; Han C.; Hsieh H.-S.; Vilsmeier K.; Wohlleben W.; Sahle-Demessie E. Fragmentation of polymer nanocomposites: modulation by dry and wet weathering, fractionation, and nanomaterial filler. Environ. Sci.: Nano 2020, 7, 1742–1758. 10.1039/c9en01360a. [DOI] [PMC free article] [PubMed] [Google Scholar]
- Gewert B.; Plassmann M.; Sandblom O.; MacLeod M. Identification of Chain Scission Products Released to Water by Plastic Exposed to Ultraviolet Light. Environ. Sci. Technol. Lett. 2018, 5, 272–276. 10.1021/acs.estlett.8b00119. [DOI] [Google Scholar]
- Khaled A.; Rivaton A.; Richard C.; Jaber F.; Sleiman M. Phototransformation of Plastic Containing Brominated Flame Retardants: Enhanced Fragmentation and Release of Photoproducts to Water and Air. Environ. Sci. Technol. 2018, 52, 11123–11131. 10.1021/acs.est.8b03172. [DOI] [PubMed] [Google Scholar]
- Zhu L.; Zhao S.; Bittar T. B.; Stubbins A.; Li D. Photochemical dissolution of buoyant microplastics to dissolved organic carbon: Rates and microbial impacts. J. Hazard. Mater. 2020, 383, 121065 10.1016/j.jhazmat.2019.121065. [DOI] [PubMed] [Google Scholar]
- Lee Y. K.; Murphy K. R.; Hur J. Fluorescence Signatures of Dissolved Organic Matter Leached from Microplastics: Polymers and Additives. Environ. Sci. Technol. 2020, 54, 11905–11914. 10.1021/acs.est.0c00942. [DOI] [PubMed] [Google Scholar]
- Walsh A. N.; Reddy C. M.; Niles S. F.; McKenna A. M.; Hansel C. M.; Ward C. P. Plastic Formulation is an Emerging Control of Its Photochemical Fate in the Ocean. Environ. Sci. Technol. 2021, 55, 12383–12392. 10.1021/acs.est.1c02272. [DOI] [PubMed] [Google Scholar]
- Ward C. P.; Armstrong C. J.; Walsh A. N.; Jackson J. H.; Reddy C. M. Sunlight Converts Polystyrene to Carbon Dioxide and Dissolved Organic Carbon. Environ. Sci. Technol. Lett. 2019, 6, 669–674. 10.1021/acs.estlett.9b00532. [DOI] [Google Scholar]
- Gewert B.; Plassmann M. M.; MacLeod M. Pathways for degradation of plastic polymers floating in the marine environment. Environ. Sci. Process. Impacts 2015, 17, 1513–1521. 10.1039/C5EM00207A. [DOI] [PubMed] [Google Scholar]
- Song Y. K.; Hong S. H.; Eo S.; Han G. M.; Shim W. J. Rapid Production of Micro- and Nanoplastics by Fragmentation of Expanded Polystyrene Exposed to Sunlight. Environ. Sci. Technol. 2020, 54, 11191–11200. 10.1021/acs.est.0c02288. [DOI] [PubMed] [Google Scholar]
- Nelson T. F.; Reddy C. M.; Ward C. P. Product Formulation Controls the Impact of Biofouling on Consumer Plastic Photochemical Fate in the Ocean. Environ. Sci. Technol. 2021, 55, 8898–8907. 10.1021/acs.est.1c02079. [DOI] [PubMed] [Google Scholar]
- Eich A.; Mildenberger T.; Laforsch C.; Weber M. Biofilm and Diatom Succession on Polyethylene (PE) and Biodegradable Plastic Bags in Two Marine Habitats: Early Signs of Degradation in the Pelagic and Benthic Zone?. PLoS One 2015, 10, e0137201 10.1371/journal.pone.0137201. [DOI] [PMC free article] [PubMed] [Google Scholar]
- Sudhakar M.; Trishul A.; Doble M.; Suresh Kumar K.; Syed Jahan S.; Inbakandan D.; Viduthalai R. R.; Umadevi V. R.; Sriyutha Murthy P.; Venkatesan R. Biofouling and biodegradation of polyolefins in ocean waters. Polym. Degrad. Stab. 2007, 92, 1743–1752. 10.1016/j.polymdegradstab.2007.03.029. [DOI] [Google Scholar]
- Weinstein J. E.; Crocker B. K.; Gray A. D. From macroplastic to microplastic: Degradation of high-density polyethylene, polypropylene, and polystyrene in a salt marsh habitat. Environ. Toxicol. Chem. 2016, 35, 1632–1640. 10.1002/etc.3432. [DOI] [PubMed] [Google Scholar]
- Lankone R. S.; Ruggiero E.; Goodwin D. G. Jr.; Vilsmeier K.; Mueller P.; Pulbere S.; Challis K.; Bi Y.; Westerhoff P.; Ranville J.; Fairbrother D. H.; Sung L.-P.; Wohlleben W. Evaluating performance, degradation, and release behavior of a nanoform pigmented coating after natural and accelerated weathering. NanoImpact 2020, 17, 100199 10.1016/j.impact.2019.100199. [DOI] [PMC free article] [PubMed] [Google Scholar]
- Sipe J. M.; Bossa N.; Berger W.; von Windheim N.; Gall K.; Wiesner M. R. From bottle to microplastics: Can we estimate how our plastic products are breaking down?. Sci. Total Environ. 2022, 814, 152460 10.1016/j.scitotenv.2021.152460. [DOI] [PubMed] [Google Scholar]
- Wohlleben W.; Meyer J.; Muller J.; Muller P.; Vilsmeier K.; Stahlmecke B.; Kuhlbusch T. A. J. Release from nanomaterials during their use phase: combined mechanical and chemical stresses applied to simple and multi-filler nanocomposites mimicking wear of nano-reinforced tires. Environ. Sci.: Nano 2016, 3, 1036–1051. 10.1039/C6EN00094K. [DOI] [Google Scholar]
Associated Data
This section collects any data citations, data availability statements, or supplementary materials included in this article.


