Abstract
Background:
Evaluation of aortic stiffness by pulse wave velocity (PWV) across the adult lifespan is needed to better understand normal aging in women and men.
Purpose:
To characterize PWV in the thoracic aorta using 4D flow MRI in an age- and sex-stratified cohort of healthy adults.
Study Type:
Retrospective
Population:
99 healthy participants (age: 46±15 [19-79] years, 50% female), divided into young adults (<45 years) (n=48), mid-life (45-65 years) (n=37) and later life (>65 years) (n=14) groups.
Field Strength/Sequence:
1.5T or 3T, 2D cine bSSFP, 4D flow MRI
Assessment:
Cardiac functional parameters of end-diastolic volume (EDV), end-systolic volume (ESV), stroke volume (SV) and myocardial mass were assessed by 2D cine bSSFP. PWV and aortic blood flow velocity were assessed by 4D flow MRI. Reproducibility of PWV was evaluated in a subset of 9 participants.
Statistical Tests:
Analysis of variance, Pearson’s correlation coefficient (r), linear regression, intra-class correlation coefficient (ICC). A p value <0.05 was considered statistically significant.
Results:
PWV increased significantly with age (young adults: 5.4±0.9 m/s, midlife: 7.2±1.1 m/s and later life: 9.4±1.8 m/s) (r=0.79, slope=0.09 m/s/year). PWV did not differ in women and men in entire sample (p=0.40) or within age-groups (young adults: p=0.83, midlife: p=0.17 and later life: p=0.96). PWV was significantly correlated with EDV (r=−0.29), ESV (r=−0.23), SV (r=−0.28), myocardial mass (r=0.21) and mean aortic blood flow velocity (r=−0.62). In the test-retest subgroup (N=9), PWV was 6.7±1.5 [4.4-9.3] m/s and ICC=0.75.
Data Conclusion:
4D flow MRI quantified higher aortic PWV with age, by approximately 1 m/s per decade, and significant differences between young adults, midlife and later life. Reproducibility analysis showed good test-retest agreement. Increased PWV was associated with decline in cardiac function and reduced aortic blood flow velocity. This study demonstrates the utility of 4D flow MRI-derived aortic PWV for studying aging.
Keywords: 4D flow MRI, aortic stiffness, hemodynamics, global cardiac function, age-related changes, phase contrast MRI
Introduction
Pulse wave velocity (PWV), a biomarker of arterial stiffness, has emerged as an important clinical parameters for assessment of cardiovascular risk (1). PWV has prognostic significance for future cardiovascular events, stroke and all-cause mortality (2–4). PWV is measured as the speed at which a pressure pulse, generated by the systolic pumping of the heart, traverses the vasculature. PWV assessment has usually been performed with two external measurements by applanation tonometry at the carotid and femoral arteries, providing an overall assessment of the arterial system, from the large arteries to the periphery (5). PWV assessment by carotid femoral tonometry has been used in large longitudinal studies, such as the Framingham Heart Study, where PWV was associated with increased risk of dementia related disease (6). Local measurement, however, is more precise because it considers the structure of different arteries (1) and a measurement focused on the thoracic aorta may provide further insights into these age-related changes.
The technique of 4D flow MRI (time-resolved 3-directional velocity encoding) (7) may be used to assess blood flow velocity and aortic PWV (8). It enables measurement of blood flow velocity in all three spatial directions with full volumetric coverage of the thoracic aorta and has advantages over other techniques by enabling retrospective analysis of any imaging plane and volumetric quantification of aortic blood flow velocity (7). Compared to 4D flow MRI, 2D phase contrast MRI may offer higher temporal resolution but is intrinsically limited by the spatial coverage of the 2D acquisition, introducing patient-specific as well as methodological limitations, e.g. manual slice placement (9). PWV requires measurements of flow waves over multiple planes along the 3D aorta. The intrinsic 2D acquisition makes it unfeasible to acquire flow along the entire 3D aorta as this would require several separate 2D acquisitions with associated susceptibility to spatio-temporal misregistration potentially affecting the accuracy of the PWV measurements (10).
Aortic PWV, assessed by 2D phase contrast MRI and (more recently) by 4D flow MRI, has been shown to increase with age and cardiovascular disease (9,11–16). In young healthy individuals, aortic PWV is typically on the order of 5 m/s (1). With aortic stiffening, aortic PWV may increase to 10 m/s or higher (10). Aortic PWV quantified in vivo by 4D flow MRI has shown promising results in initial studies (13,16); however, aortic PWV changes across the lifespan have not been fully characterized. Further studies are necessary to establish normative values for aortic PWV in different stages of the adult lifespan, i.e. young adults (in early life): < 45 years, midlife: 45-65 years and later life: >65 years (17). It is also important to determine whether there are differences in aortic PWV in women and men since findings for sex-related differences in arterial stiffness and aortic function have varied (13,18–20). Establishing the reproducibility of aortic PWV is critical for these studies and for extending application of the technique in clinical settings. In addition, how changes in aortic PWV relate to age-related changes in global left ventricular function (21,22) and aortic function (e.g. blood flow velocity) (20,23,24) remain unclear.
Thus the aim of this study was to characterize aortic PWV in normal aging using 4D flow MRI in an age- and sex-stratified cohort and to assess correlations with left ventricular function and aortic blood flow velocity. Our hypotheses were 1) aortic PWV increases with aging and may differ in women and men and 2) higher aortic PWV is associated with reduced left ventricular function and lower aortic blood flow velocity.
Materials and Methods
Study Cohort
Data were analyzed from a previous MRI study (20) that included 100 healthy volunteers (age: 46 ± 15 [19 to 79] years, 50% female). Exclusion criteria included history of cardiovascular disease or body mass index (BMI) > 40. Institutional Review Board approval was obtained for this HIPAA compliant study and informed consent was obtained from all participants. The data from one participant (a 65-year-old female) were excluded due to a timing issue with the scan acquisition that did not allow for full depiction of the upstroke of flow waveforms. Characteristics for the final study sample (N = 99) are shown in Table 1. Participants were classified according to age-group (17): young adults (< 45 years) (n=48), midlife (45-65 years) (n=37) and later life (> 65 years) (n=14).
Table 1:
Study cohort demographics and cardiac measures.
| Characteristic | Young adults <45 years |
Midlife 45-65 years |
Later life >65 years |
||
|---|---|---|---|---|---|
| N | 48 | 37 | 14 | ||
| Age [years] | 32.8 ± 7.1 min: 19 |
53.5 ± 5.6 | 71.5 ± 4.5 max: 79 |
||
| Sex | 24, 50% female | 19, 51% female | 6, 43% female | ||
| BSA [m2] | 1.9 ± 0.2 | 1.9 ± 0.2 | 2.1 ± 0.3 | ||
| Parameter | Corr. With Age | Corr. with PWV | |||
|
| |||||
| HR [1/min] | 65.3 ± 10.7 | 65.1 ± 10.1 | 64.8 ± 12.1 | r = 0.01 p = 0.95 |
r = 0.05 p = 0.61 |
| EF [%] | 56.0 ± 5.1 | 57.4 ± 5.3 | 55.7 ± 6.0 | r = 0.09 p = 0.35 |
r = 0.02 p = 0.85 |
| EDV/BSA [ml/m2] | 75.4 ± 14.3 | 71.8 ± 11.7 | 64.8 ± 15.7* | (−) r = −0.28 p = 0.006 |
(−) r = −0.29 p = 0.004 |
| ESV/BSA [ml/m2] | 33.4 ± 8.2 | 30.7 ± 6.9 | 29.4 ± 10.1 | (−) r = −0.25 p = 0.01 |
(−) r = −0.23 p = 0.02 |
| SV/BSA [ml/m2] | 42.1 ± 7.9 | 41.1 ± 7.0 | 35.5 ± 6.4* | (−) r = −0.24 p = 0.02 |
(−) r = −0.28 p = 0.005 |
| Myocardial mass / BSA [g/m2] | 49.7 ± 8.2 | 53.9 ± 8.4* | 57.7 ± 13.1 | (+) r = 0.24 p = 0.02 |
(+) r = 0.21 p = 0.04 |
| Mean Aortic Velocity [m/s] | 0.66 ± 0.12 | 0.56 ± 0.11* | 0.47 ± 0.06** | (−) r = −0.60 p < 0.001 |
(−) r = −0.62 p < 0.001 |
| Aortic PWV [m/s] | 5.4 ± 0.9 | 7.2 ± 1.1* | 9.4 ± 1.8** | (+) r = 0.79 p < 0.001 |
n/a |
Values are displayed as mean ± SD or N, Proportion %.
The direction (+) or (−) of significant correlations (p < 0.05) with age and PWV are given in the last two columns.
Note that after Bonferroni correction,
indicates values were significantly different (p < 0.05) compared to young adults and
indicates values were significantly different between later life and midlife.
HR: heart rate, EF: ejection fraction, EDV: end-diastolic volume, ESV: end-systolic volume, SV: stroke volume, BSA: body surface area.
Image Acquisition
All participants underwent thoracic cardiovascular MRI at 1.5T or 3T (Aera or Skyra; Siemens Healthcare, Erlangen, Germany). This included standard breath-held retrospectively gated 2D cine balanced steady state free precession (bSSFP) MRI in short-axis orientation (base to apex) with image parameters as follows: in plane spatial resolution = 1.0-2.2 × 1.0-2.2 mm2, slice thickness = 6.0-8.0 mm, FOV = 243-420 × 276-420 mm2, spacing between slices = 8-10 mm, temporal resolution = 27.1-40.6 ms, TE = 1.1-1.2 ms, TR = 2.1-3.1 ms, and flip angle = 30°-75°. Acquisitions were optimized based on patient size and scanner strength. Typical scan time was about 3 min (e.g. 10-12 slices, each performed as a 6-10 s breath-hold). The study also included free-breathing navigator and prospectively cardiac gated 4D flow MRI with full volumetric coverage of the thoracic aorta (25). Imaging parameters for 4D flow MRI were as follows: spatial resolution = 1.7-3.1 × 1.7-3.1 × 2.2-3.3 mm3, temporal resolution = 38.4-43.2 ms, TE = 2.3-2.9 ms. TR = 4.8-5.4 ms, flip angle = 7°-15°, and velocity encoding = 150-250 cm/s. Typical scan time was approximately 10 min. Nine participants had underwent another 4D flow MRI scan within one month (time between scans = 0.6±0.1 [0.5-0.9] months) and these data were included to evaluate reproducibility.
Image Analysis: Left Ventricular Function
The 2D bSSFP cine MRI data were used to evaluate cardiac function using the Simpson method in Cvi42® (Circle, Calgary, AB, Canada) according to current guidelines (31). This included evaluation of left ventricular ejection fraction (EF), end-diastolic volume (EDV), end-systolic volume (ESV) and stroke volume (SV). Myocardial mass was measured at diastole. The parameters of EDV, ESV, SV and myocardial mass were normalized to body surface area (BSA). Analysis was performed by an MD-PhD student (MS) and a postdoctoral fellow with 4 and 6 years of imaging analysis experience, respectively.
Image Analysis: 4D flow MRI (Pre-processing)
Results from 4D flow MRI were pre-processed according to a previously described workflow (26) with corrections for Maxwell terms, eddy currents and velocity aliasing as well as noise masking of areas outside flow regions. A time-averaged 3D phase contrast angiogram (PC-MRA) was calculated to depict vessel anatomy (27). The aortic volume was manually segmented from the 3D PC-MRA (Mimics Innovation Suite; Materialise, Leuven, Belgium). Analysis was performed by MS.
Image Analysis: 4D flow MRI (Aortic Blood Flow Velocity)
The aortic volume was used to mask the 4D flow MRI velocity data and measure blood flow velocity according to a previous workflow (20). Briefly, mean velocity at peak systole was assessed in regions of the thoracic aorta including the ascending aorta, arch and descending aorta. Regions were based on manual plane placement of two planes (immediately proximal to brachiocephalic artery and immediately distal to left subclavian artery). Regional results were averaged to give an overall mean aortic velocity. Analysis was performed by MS.
Image Analysis: 4D flow MRI (Aortic Pulse Wave Velocity)
An in-house automated PWV analysis algorithm (Figure 1) was used to generate a PWV distribution for each scan, as previously described (28) (Matlab; The MathWorks, Natick, Massachusetts, USA). Briefly, an aortic centerline was generated from the aortic volume and analysis planes were placed every 4 mm to capture flow waveforms. The time-delay between flow waveforms was calculated using cross-correlation (29). PWV estimation was repeated multiple times for each scan until all analysis planes were used as the reference plane in cross-correlation analysis. This resulted in a PWV estimate distribution for each scan. The final PWV value for each scan was the mean or median of the PWV estimates distribution, depending on normality. Analysis was performed by a postdoctoral fellow (KJ) with 8 years of imaging analysis experience.
Figure 1.
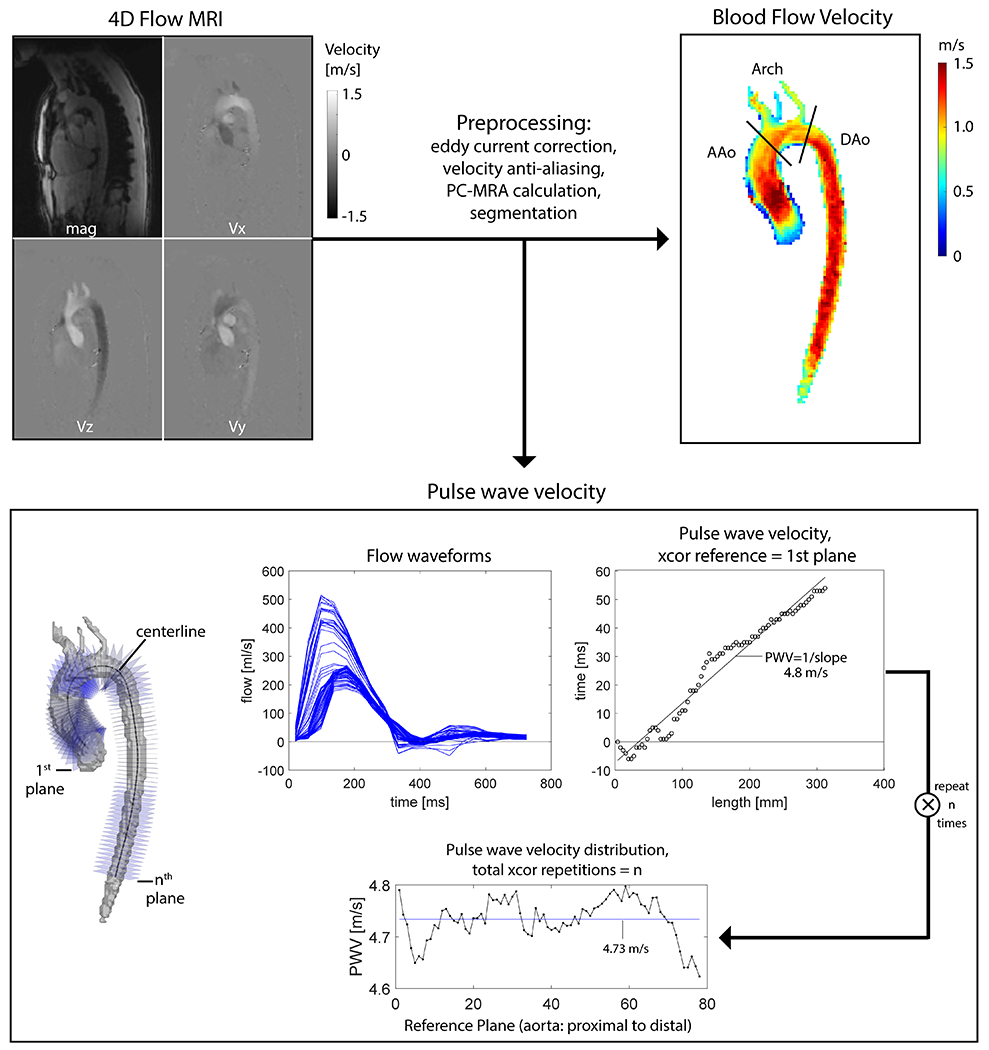
4D flow MRI analysis workflow. Blood flow velocity was evaluated in the ascending aorta (AAo), Arch and descending aorta (Dao) and averaged to give mean aortic values. PWV analysis using the technique of cross-correlation (xcor) was performed repeatedly (using each of n planes as the reference plane). The final PWV for each scan was determined by the mean or median of these repetitions, depending on the normality of the distribution. In this example the final value for PWV was mean = 4.73 m/s.
Statistical Analysis
Continuous variables were reported as mean ± standard deviation. Normality was assessed using the Shapiro-Wilk test. Group comparisons were accomplished using analysis of variance (or Kruskal-Wallis) and independent t-tests (or Wilcoxon rank sum). Bonferroni correction was used to correct for multiple comparisons and adjusted p values were reported. Pearson’s correlation coefficient (r) and linear regression were used to examine relationships between PWV and other measures. Test-retest was evaluated by the intraclass correlation coefficient (ICC). For all analysis, p values < 0.05 were considered statistically significant. Statistical analysis was performed in R (http://www.R-project.org/).
Results
Aortic PWV Estimate Distributions in Individual Participants
Examples of PWV estimate distributions (resulting from multiple repetitions of the PWV algorithm—see Figure 1) are shown for three example participants (Figure 2). The aortic PWV estimate distribution was non-normally distributed in 59 participants (median values: 3.8-11.7 m/s, interquartile ranges [IQR]: ≤ 3.3 m/s). Of these, one participant (34 year old male, median PWV = 9.3 m/s) (control B in Figure 2) had the highest variability with IQR = 3.3 m/s. Otherwise, IQR for non-normal PWV estimate distributions were less than 0.7 m/s. The remaining 40 participants were considered to have normally distributed estimates of PWV (mean values: 4.7-13.0 m/s, standard deviations: < 0.7 m/s). Taking the final value for each participant as median or mean of their PWV estimates distribution, aortic PWV for the entire cohort was 6.6 ± 1.8 [range = 3.8 to 13.0] m/s.
Figure 2:
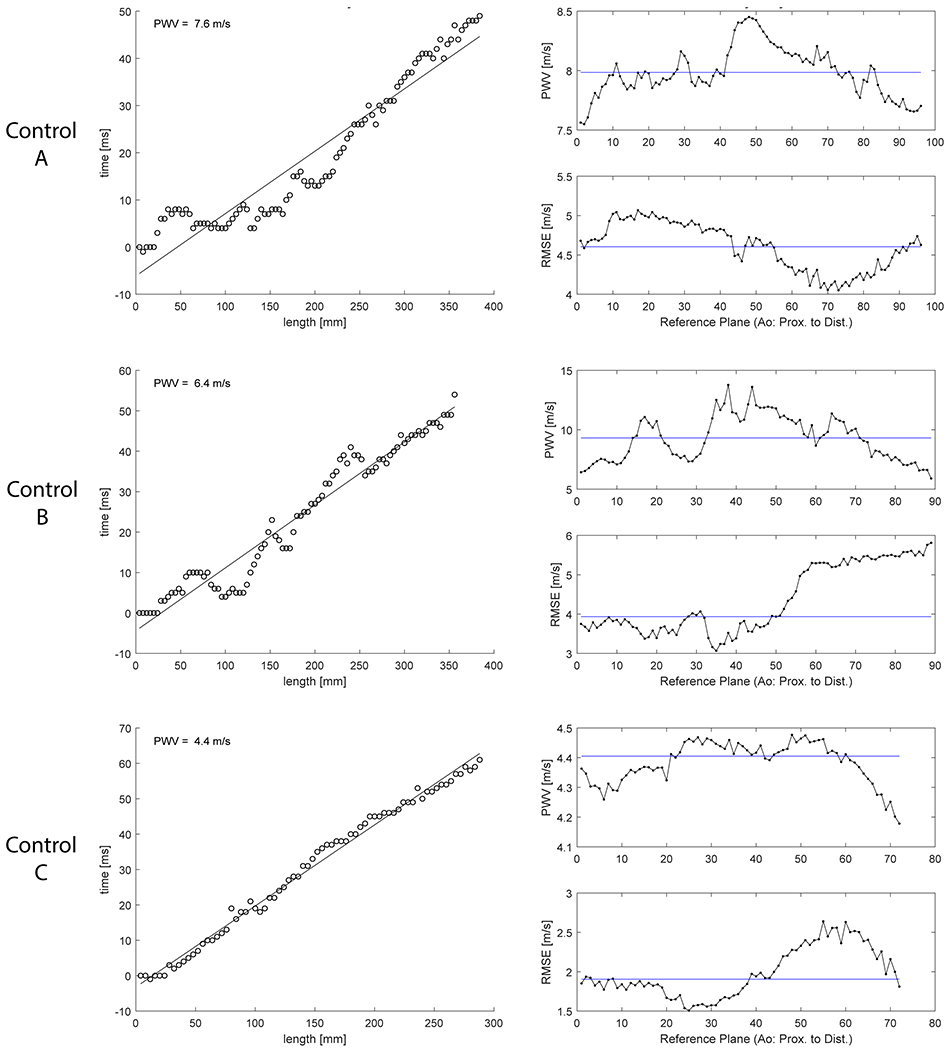
PWV evaluation by algorithm with repeated approach in three example participants. Results shown for 51 y/o male (top row), 34 y/o male (middle row) and 24 y/o female (bottom row). Final PWV results were 8.0 m/s, 9.3 m/s and 4.4 m/s, respectively. Left: PWV estimate using first plane as reference plane in cross-correlation (XCOR). Right: Final PWV estimates distribution and root mean square error (RMSE) using all planes as reference.
Test-retest Evaluation of Reproducibility
Aortic PWV in the test-retest study (N=9 × 2 scans) was 6.7 ± 1.5 [range = 4.4 to 9.3] m/s. Mean absolute difference between scans was 0.6 m/s and mean percent difference was 8%. Evaluation of reproducibility showed good agreement (ICC=0.75). The difference in measured PWV between scans was within 0.4 m/s for 8 out of 9 participants. One participant had a difference of 3.4 m/s (test: 9.3 m/s, retest: 5.9 m/s). This participant (34 year old male, PWV = 9.3 m/s) also had the highest variability of the PWV estimate distribution in the main study, IQR = 3.3 m/s (control B in Figure 2). The IQR for other scans in test-retest study was ≤ 0.3 m/s while the IQR for scans in main study was < 0.7 m/s.
Aortic PWV Increased with Age-group in Both Women and Men
Examination of group differences in aortic PWV using two-way analysis of variance indicated a main effect for age-group (F (2, 93) = 71.24); there were no differences for sex (p = 0.31) or interaction with age-group (p = 0.68). Aortic PWV was significantly higher with each stage of adulthood (young adults: 5.4 ± 0.9 m/s, midlife: 7.2 ± 1.1 m/s and later life: 9.4 ± 1.8 m/s). This pattern of higher aortic PWV with age-group was similar when examined separately in women and in men (Figure 3). Aortic PWV did not differ in women and men in the entire sample (p = 0.40) or within age-groups (young adults: p = 0.83, midlife: p = 0.17 and later life: p = 0.96).
Figure 3:
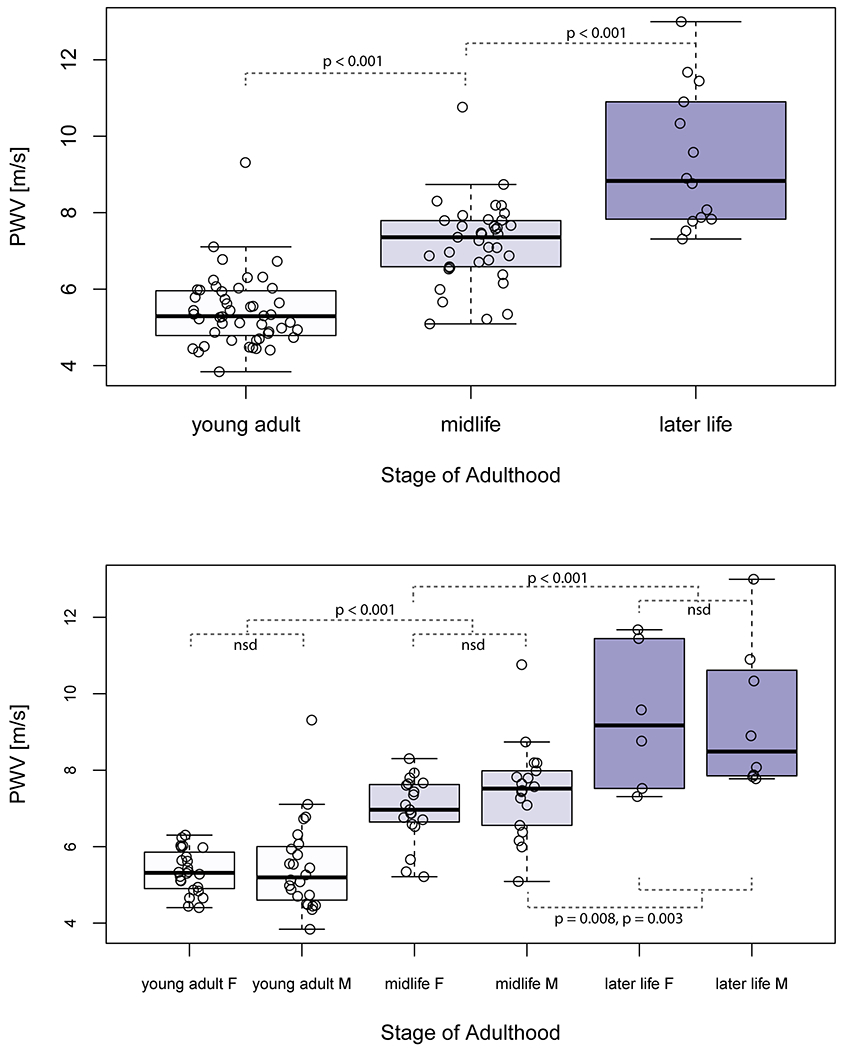
Characterization of aortic PWV measured by 4D flow MRI across the adult lifespan. Boxplots show the median (thick black line), 25% and 75% quartiles (Q1, Q3), whiskers that extend to 1.5(Q3-Q1) and outliers are datapoints beyond the whiskers. Aortic PWV was significantly different between all age-groups (top) in both women and men (F and M, bottom). Significant Bonferroni-adjusted p values are shown. No significant differences (nsd) in aortic PWV were found between women and men in the same age-group.
Age-related Changes in Left Ventricular Function
Group-wise comparisons of left ventricular function showed significantly lower values in later life compared to young adults for EDV (64.8 ± 15.7 ml/m2 vs. 75.4 ± 14.3 ml/m2) and SV (35.5 ± 6.4 ml/m2 vs. 42.1 ± 7.9 ml/m2). Myocardial mass was significantly higher in midlife compared to young adults (53.9 ± 8.4 g/m2 vs. 49.7 ± 8.2 g/m2). There were no other significant findings for age-group comparisons in other studied measures (heart rate: p = 0.97, EF: p = 0.43). Significant correlations with age were identified for EDV (r = −0.28), ESV (r = −0.25), SV (r = −0.24) and myocardial mass (r = 0.24) (Table 1).
Age-related Reduction in Aortic Blood Flow Velocity
Mean aortic velocity was significantly lower in midlife than in young adults (0.56 ± 0.11 m/s vs. 0.66 ± 0.12 m/s) and significantly lower in later life than in midlife (0.47 ± 0.06 m/s vs. 0.56 ± 0.11 m/s). Mean aortic velocity was significantly correlated with age (r = −0.60). Results were also significant for mean velocity when examined along localized regions of the aorta (ascending: r = −0.38, arch: r = −0.57, descending: r = −0.69).
Correlation and Regression Analysis
Aortic PWV was significantly correlated with age (r = 0.79) (Figure 4). Significant correlations were also identified between aortic PWV and EDV (r = −0.29), ESV (r = −0.23), SV (r = −0.28), myocardial mass (r = 0.21) and mean aortic velocity (r = −0.62) (Table 1, Figure 5 and Figure 6). In a linear regression that included age as a covariate, higher aortic PWV was significantly related to lower mean aortic velocity (adjusted R2 = 0.65). Results for mean aortic velocity were also significant when examined along localized regions of the aorta (ascending: adjusted R2 = 0.64, arch: adjusted R2 = 0.65, descending: adjusted R2 = 0.66).
Figure 4:
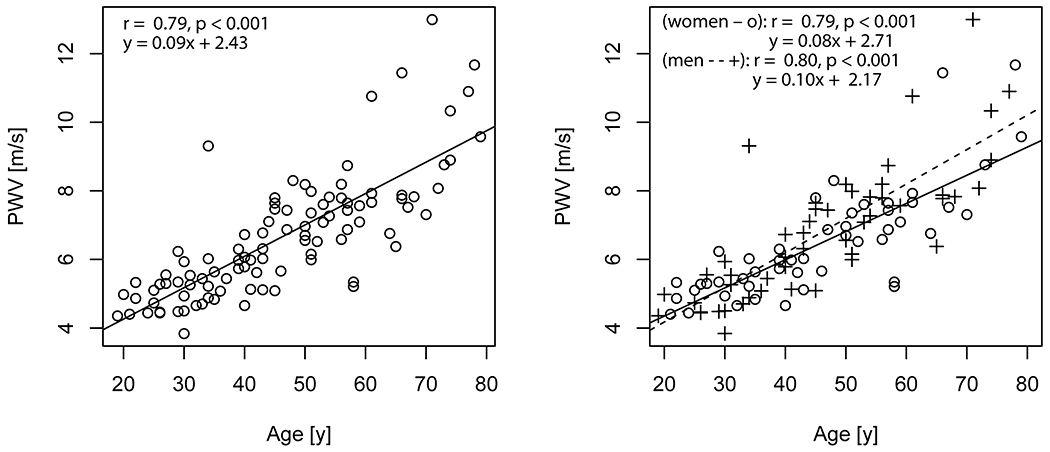
Aortic PWV with age. On left, is the linear trend for all participants. On right, linear trends for women and men are shown separately (o are women, + are men). The solid line (−) is the trendline for women and dashed line (- -) for men.
Figure 5:
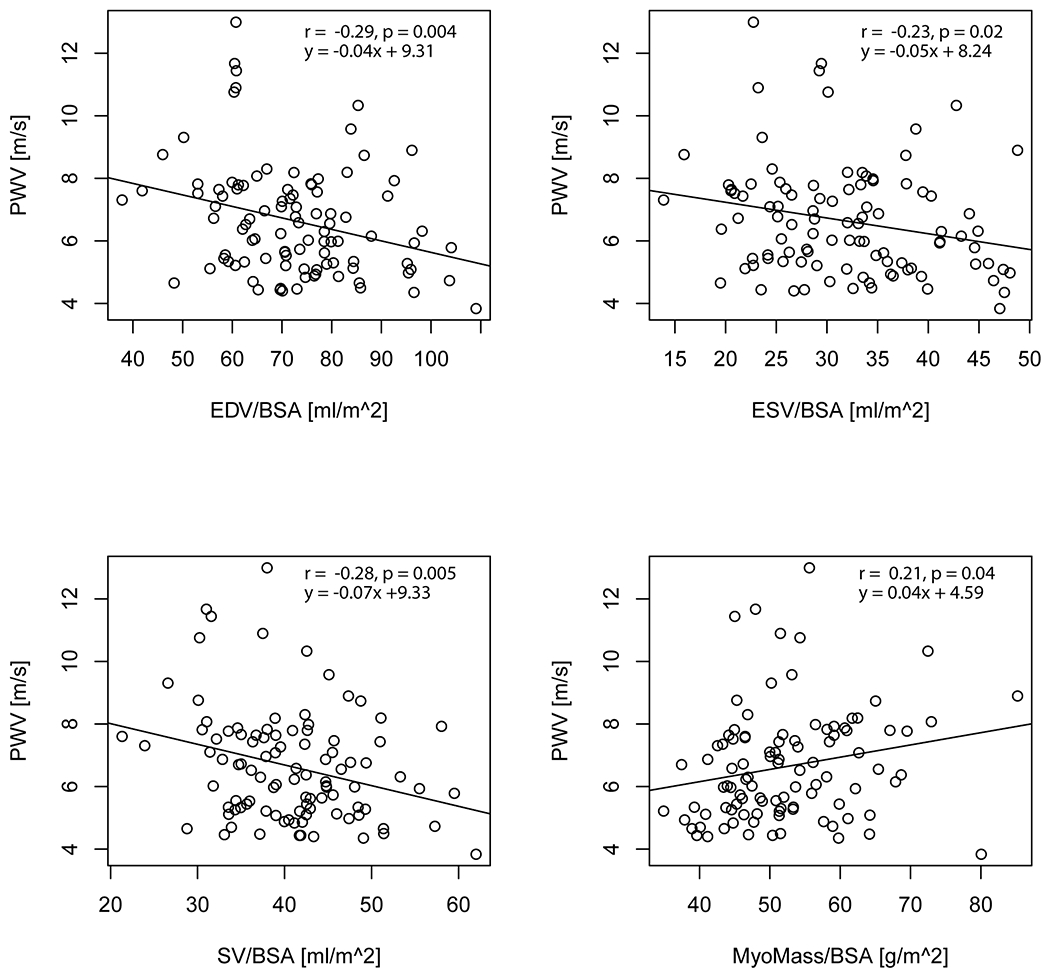
Aortic PWV with cardiac functional parameters (EDV, ESV, SV and myocardial mass) for all study participants.
Figure 6:
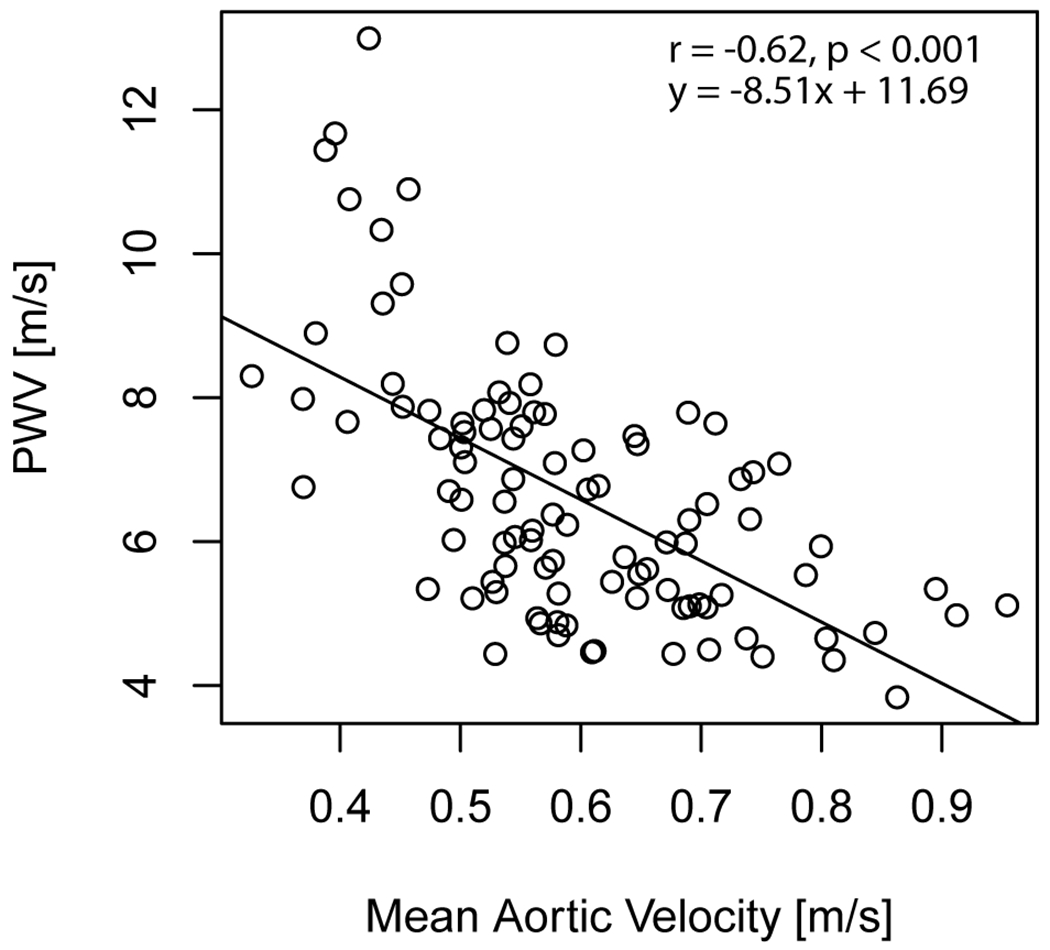
Aortic PWV with aortic blood flow velocity for all study participants.
Discussion
This study used 4D flow MRI to characterize age-related differences in aortic PWV across the adult lifespan. Aortic PWV was higher (i.e. worsened) with age in both women and men, increasing by approximately 1 m/s per decade, and showed a significant increase with each stage of adulthood. In our analysis, aortic PWV did not differ in women and men in the same stage of life. It also showed similar change between young adulthood and later life in both women and men. Aortic PWV differed between life stages and may provide improved characterization and insights to mechanisms of normal aging.
The 4D flow MRI aortic PWV quantification method used in this study generated PWV estimate distributions for each scan using cross-correlation in a repeated approach. Aortic PWV values quantified in this study were comparable to previous results (9,12–16,30). A 4D flow MRI study in 126 healthy individuals (13) evaluated PWV by several methods (time-to-foot, 50%-rule and cross correlation) and found cross-correlation to be favorable, showing fewest outliers. That study showed that aortic PWV increased from 4.93 ± 0.54 m/s in young adults (20-30 years) to 8.06 ± 1.03 m/s in later life (70-80 years). Our PWV results were similar despite having lower acquired temporal resolution of 4D flow MRI data (40 ms vs. 20 ms). Aortic PWV correlated with age which is likely due to changes in elastin fibers during the aging process (31). Our correlation results for PWV with age agree well with a study also using cross-correlation in 57 healthy individuals (16), demonstrating agreement between institutions using different scanner platforms and different 4D flow MRI acquisition and analysis tools. However, our study did not find lower PWV in women compared to men as in previous work (13). This may be due to differences in cohorts as well as differences in 4D flow MRI acquisition and analysis methods. Similar to previous work (13), we did not find sex differences in effects of aging on aortic PWV. Notably, some findings indicate increased arterial stiffening in women during menopause leading to lower arterial compliance in later life (18). Further study is needed of aortic PWV data by 4D flow MRI in healthy participants > 50 years and particularly later life.
Test-retest evaluation of reproducibility in a subset of participants showed good agreement between scans and small differences in nearly all cases. The greater discrepancy in PWV observed in one participant may be due to data quality issues that did not allow for full depiction of flow waveforms and increased the variability of the PWV estimate distribution in one of the scans. Characterization of PWV distribution generated by the algorithm for each scan may give additional insights into the quality of the resulting PWV estimation, e.g. high variability in PWV values may indicate an underlying issue in the acquisition or PWV estimation. However, further assessment in larger datasets of controls and patients is needed to fully understand sources of variation, ways to mitigate it and to assign appropriate threshold values for identifying potential outliers. In addition, using retrospective cardiac gating in the future will help ensure full depiction of flow waveforms.
In agreement with previous work (16), PWV correlated with left ventricular remodeling. These correlations were significant but not as strong as the relationship between PWV and age. This suggests that there may be additional factors involved in left ventricular changes with age and warrants future investigation of the underlying mechanisms.
Aortic blood flow velocity decreased across the lifespan from young adulthood to midlife and then later life. The relationship between aortic velocity and age in this cohort has been previously reported (20) and differences visualized using velocity maximum intensity projection maps. These results agreed with findings from a different cohort (age 7 months to 61 years) (32) using 2D phase contrast MRI of the aorta and intracranial 4D flow MRI, indicating that cardiac and cerebral flow parameters were highly associated with age (lower aortic flow after age 18 and lower cerebral blood flow after age 6). In our study, lower aortic blood flow velocity was associated with increased aortic PWV after adjusting for age. We speculate that higher levels of aortic stiffening can cause increased reflections of the aortic pulse waves and further reduction of blood flow velocity. Further study is needed to study factors that influence cardiovascular disease (smoking, diet, exercise) and the relationship to change in aortic PWV across time.
In this study, aortic PWV was highly differentiated between life stages, adding to the literature that shows the utility of 4D flow MRI for studying aging (20,32). This suggests that measurement of aortic PWV by 4D flow MRI may be a promising parameter to consider when evaluating aging models in larger studies. Growing evidence suggests that aortic stiffness may play an important role in progression of dementia-related disease (6,33). The proximal aorta acts as a buffer between highly pulsatile flow from the heart and minimally pulsatile flow in brain microcirculation (i.e. heart-brain coupling) (34). Future work is warranted to study the involvement of aortic PWV in the underlying mechanisms of aging.
Limitations
One limitation of our study is the relative imbalance in the number of participants in the three life stage groups (n = 14 in the later life group). These findings warrant a larger study to establish normative ranges for age and sex. The 4D flow MRI data were acquired at the typical temporal resolution of 40 ms. PWV estimation is sensitive to temporal resolution and thus a higher temporal resolution, e.g. 20 ms, as prescribed in previous work (13,28), would be preferred for reducing noise in PWV estimations. However, improving the temporal resolution from 40 ms to 20 ms would have required a doubling in scan time and reduced potential for clinical application.
Conclusion
In a large group of healthy adults with a wide age-range, 4D flow MRI quantified higher aortic PWV with age that differentiated each stage of life. Increased PWV was associated with other age-related changes, including reduced cardiac function and reduced aortic blood flow velocity. This study demonstrates the importance of using age-matched controls to detect abnormal PWV. Moreover, it demonstrates the utility of 4D flow MRI-derived aortic PWV to study age-related changes and the potential of this metric to contribute to futures aging studies.
Grant Support
This work was supported by the National Institutes of Health—National Institute on Aging (NIA) (T32AG020506), National Institute of Neurological Disorders and Stroke (NINDS) (R21NS122511) and National Heart, Lung and Blood Institute (NHLBI) (F30HL145995, R01HL133504, R01HL115828).
Gilles Soulat received grant support from the French College of Radiology Teachers (CERF) and French Radiology Society (SFR).
Disclosures:
JC receives institutional research grants from Siemens, Bayer, and Guerbet, speaker honoraria from Bayer and is on the advisory boards of Siemens, Bayer, and Bracco. MM has disclosures for research support from Siemens Healthineers, a research grant with Circle Cardiovascular Imaging, consulting with Circle Cardiovascular Imaging and a research grant with Cryolife Inc.
REFERENCES
- 1.Pereira T, Correia C, Cardoso J. Novel Methods for Pulse Wave Velocity Measurement. Journal of medical and biological engineering 2015;35(5):555–565. [DOI] [PMC free article] [PubMed] [Google Scholar]
- 2.Sethi S, Rivera O, Oliveros R, Chilton R. Aortic stiffness: pathophysiology, clinical implications, and approach to treatment. Integr Blood Press Control 2014;7:29–34. [DOI] [PMC free article] [PubMed] [Google Scholar]
- 3.Vlachopoulos C, Aznaouridis K, Stefanadis C. Prediction of cardiovascular events and all-cause mortality with arterial stiffness: a systematic review and meta-analysis. J Am Coll Cardiol 2010;55(13):1318–1327. [DOI] [PubMed] [Google Scholar]
- 4.Pereira T, Maldonado J, Pereira L, Conde J. Aortic stiffness is an independent predictor of stroke in hypertensive patients. Arq Bras Cardiol 2013;100(5):437–443. [DOI] [PubMed] [Google Scholar]
- 5.Laurent S, Cockcroft J, Van Bortel L, et al. Expert consensus document on arterial stiffness: methodological issues and clinical applications. European heart journal 2006;27(21):2588–2605. [DOI] [PubMed] [Google Scholar]
- 6.Pase MP, Beiser A, Himali JJ, et al. Aortic Stiffness and the Risk of Incident Mild Cognitive Impairment and Dementia. Stroke; a journal of cerebral circulation 2016;47(9):2256–2261. [DOI] [PMC free article] [PubMed] [Google Scholar]
- 7.Dyverfeldt P, Bissell M, Barker AJ, et al. 4D flow cardiovascular magnetic resonance consensus statement. Journal of cardiovascular magnetic resonance : official journal of the Society for Cardiovascular Magnetic Resonance 2015;17(1):72. [DOI] [PMC free article] [PubMed] [Google Scholar]
- 8.Markl M, Kilner PJ, Ebbers T. Comprehensive 4D velocity mapping of the heart and great vessels by cardiovascular magnetic resonance. Journal of cardiovascular magnetic resonance : official journal of the Society for Cardiovascular Magnetic Resonance 2011;13:7. [DOI] [PMC free article] [PubMed] [Google Scholar]
- 9.Wentland AL, Wieben O, Francois CJ, et al. Aortic pulse wave velocity measurements with undersampled 4D flow-sensitive MRI: comparison with 2D and algorithm determination. J Magn Reson Imaging 2013;37(4):853–859. [DOI] [PMC free article] [PubMed] [Google Scholar]
- 10.Wentland AL, Grist TM, Wieben O. Review of MRI-based measurements of pulse wave velocity: a biomarker of arterial stiffness. Cardiovasc Diagn Ther 2014;4(2):193–206. [DOI] [PMC free article] [PubMed] [Google Scholar]
- 11.Markl M, Wallis W, Strecker C, Gladstone BP, Vach W, Harloff A. Analysis of pulse wave velocity in the thoracic aorta by flow-sensitive four-dimensional MRI: reproducibility and correlation with characteristics in patients with aortic atherosclerosis. J Magn Reson Imaging 2012;35(5):1162–1168. [DOI] [PubMed] [Google Scholar]
- 12.Dyverfeldt P, Ebbers T, Lanne T. Pulse wave velocity with 4D flow MRI: systematic differences and age-related regional vascular stiffness. Magnetic resonance imaging 2014;32(10):1266–1271. [DOI] [PubMed] [Google Scholar]
- 13.Harloff A, Mirzaee H, Lodemann T, et al. Determination of aortic stiffness using 4D flow cardiovascular magnetic resonance - a population-based study. Journal of cardiovascular magnetic resonance : official journal of the Society for Cardiovascular Magnetic Resonance 2018;20(1):43. [DOI] [PMC free article] [PubMed] [Google Scholar]
- 14.Wehrum T, Gunther F, Kams M, et al. Quantification of aortic stiffness in stroke patients using 4D flow MRI in comparison with transesophageal echocardiography. The international journal of cardiovascular imaging 2018;34(10):1629–1636. [DOI] [PubMed] [Google Scholar]
- 15.Houriez-Gombaud-Saintonge S, Mousseaux E, Bargiotas I, et al. Comparison of different methods for the estimation of aortic pulse wave velocity from 4D flow cardiovascular magnetic resonance. Journal of cardiovascular magnetic resonance : official journal of the Society for Cardiovascular Magnetic Resonance 2019;21(1):75. [DOI] [PMC free article] [PubMed] [Google Scholar]
- 16.Soulat G, Gencer U, Kachenoura N, et al. Changes in segmental pulse wave velocity of the thoracic aorta with age and left ventricular remodelling. An MRI 4D flow study. Journal of hypertension 2020;38(1):118–126. [DOI] [PubMed] [Google Scholar]
- 17.Livingston G, Huntley J, Sommerlad A, et al. Dementia prevention, intervention, and care: 2020 report of the Lancet Commission. Lancet 2020;396(10248):413–446. [DOI] [PMC free article] [PubMed] [Google Scholar]
- 18.Łoboz-Rudnicka M, Jaroch J, Kruszyńska E, et al. Gender-related differences in the progression of carotid stiffness with age and in the influence of risk factors on carotid stiffness. Clin Interv Aging 2018;13:1183–1191. [DOI] [PMC free article] [PubMed] [Google Scholar]
- 19.Garcia J, van der Palen RLF, Bollache E, et al. Distribution of blood flow velocity in the normal aorta: Effect of age and gender. J Magn Reson Imaging 2018;47(2):487–498. [DOI] [PMC free article] [PubMed] [Google Scholar]
- 20.Scott MB, Huh H, van Ooij P, et al. Impact of age, sex, and global function on normal aortic hemodynamics. Magn Reson Med 2020;84(4):2088–2102. [DOI] [PMC free article] [PubMed] [Google Scholar]
- 21.Cheng S, Fernandes VR, Bluemke DA, McClelland RL, Kronmal RA, Lima JA. Age-related left ventricular remodeling and associated risk for cardiovascular outcomes: the Multi-Ethnic Study of Atherosclerosis. Circulation Cardiovascular imaging 2009;2(3):191–198. [DOI] [PMC free article] [PubMed] [Google Scholar]
- 22.Liu CY, Lai S, Kawel-Boehm N, et al. Healthy aging of the left ventricle in relationship to cardiovascular risk factors: The Multi-Ethnic Study of Atherosclerosis (MESA). PloS one 2017;12(6):e0179947. [DOI] [PMC free article] [PubMed] [Google Scholar]
- 23.Garcia J, Barker AJ, Murphy I, et al. Four-dimensional flow magnetic resonance imaging-based characterization of aortic morphometry and haemodynamics: impact of age, aortic diameter, and valve morphology. European heart journal cardiovascular Imaging 2016;17(8):877–884. [DOI] [PMC free article] [PubMed] [Google Scholar]
- 24.van Ooij P, Garcia J, Potters WV, et al. Age-related changes in aortic 3D blood flow velocities and wall shear stress: Implications for the identification of altered hemodynamics in patients with aortic valve disease. J Magn Reson Imaging 2016;43(5):1239–1249. [DOI] [PMC free article] [PubMed] [Google Scholar]
- 25.Markl M, Harloff A, Bley TA, et al. Time-resolved 3D MR velocity mapping at 3T: improved navigator-gated assessment of vascular anatomy and blood flow. J Magn Reson Imaging 2007;25(4):824–831. [DOI] [PubMed] [Google Scholar]
- 26.Schnell S, Entezari P, Mahadewia RJ, et al. Improved Semiautomated 4D Flow MRI Analysis in the Aorta in Patients With Congenital Aortic Valve Anomalies Versus Tricuspid Aortic Valves. Journal of computer assisted tomography 2016;40(1):102–108. [DOI] [PMC free article] [PubMed] [Google Scholar]
- 27.Bock J, Kreher BW, Hennig J, Markl M. Optimized pre-processing of time-resolved 2D and 3D Phase Contrast MRI data. 15th Annual Meeting of ISMRM. Berlin, Germany: Abstract 3138; 2007. [Google Scholar]
- 28.Jarvis K, Soulat G, Scott M, et al. Investigation of Aortic Wall Thickness, Stiffness and Flow Reversal in Patients With Cryptogenic Stroke: A 4D Flow MRI Study. J Magn Reson Imaging 2021;53(3):942–952. [DOI] [PMC free article] [PubMed] [Google Scholar]
- 29.Fielden SW, Fornwalt BK, Jerosch-Herold M, Eisner RL, Stillman AE, Oshinski JN. A new method for the determination of aortic pulse wave velocity using cross-correlation on 2D PCMR velocity data. J Magn Reson Imaging 2008;27(6):1382–1387. [DOI] [PubMed] [Google Scholar]
- 30.Markl M, Wallis W, Brendecke S, Simon J, Frydrychowicz A, Harloff A. Estimation of global aortic pulse wave velocity by flow-sensitive 4D MRI. Magn Reson Med 2010;63(6):1575–1582. [DOI] [PubMed] [Google Scholar]
- 31.Kohn JC, Lampi MC, Reinhart-King CA. Age-related vascular stiffening: causes and consequences. Front Genet 2015;6:112. [DOI] [PMC free article] [PubMed] [Google Scholar]
- 32.Wu C, Honarmand AR, Schnell S, et al. Age-Related Changes of Normal Cerebral and Cardiac Blood Flow in Children and Adults Aged 7 Months to 61 Years. Journal of the American Heart Association 2016;5(1). [DOI] [PMC free article] [PubMed] [Google Scholar]
- 33.de Roos A, van der Grond J, Mitchell G, Westenberg J. Magnetic Resonance Imaging of Cardiovascular Function and the Brain: Is Dementia a Cardiovascular-Driven Disease? Circulation 2017;135(22):2178–2195. [DOI] [PMC free article] [PubMed] [Google Scholar]
- 34.Scherbakov N, Doehner W. Heart-brain Interactions in Heart Failure. Card Fail Rev 2018;4(2):87–91. [DOI] [PMC free article] [PubMed] [Google Scholar]


