Abstract
Analysis of the transcriptional profile of graft biopsies represents a promising strategy to study T cell mediated-rejection (TCMR), also known as acute cellular rejection. However, bulk RNA sequencing of graft biopsies may not capture the focal nature of acute rejection. Herein, we used the whole exome GeoMX Digital Space Profiling platform to study five tubular and three glomerular regions of interest in the kidney graft biopsy from a patient with a chronic-active TCMR episode and in analogous areas from two different normal kidney control biopsies. All kidney sections were from paraffin blocks. Overall, inflammatory genes were significantly upregulated in the tubular areas of the TCMR biopsy and showed an enrichment for gene-ontology terms associated with T cell activation, differentiation, and proliferation. Enrichment analysis of the 100 genes with the highest coefficient of variation across the TCMR tubular regions of interest revealed that these highly-variable genes are involved in kidney development and injury, and interestingly do not associate with the 2019 Banff classification pathology scores within the individual regions of interest. Spatial transcriptomics allowed us to unravel a previously unappreciated variability across different areas of the TCMR biopsy related to the graft response to the alloimmune attack, rather than to the immune cells. Thus, our approach has the potential to decipher clinically relevant, new pathogenic mechanisms, and therapeutic targets in acute cellular rejection and other kidney diseases with a focal nature.
Keywords: kidney transplant, biopsy, spatial transcriptomic
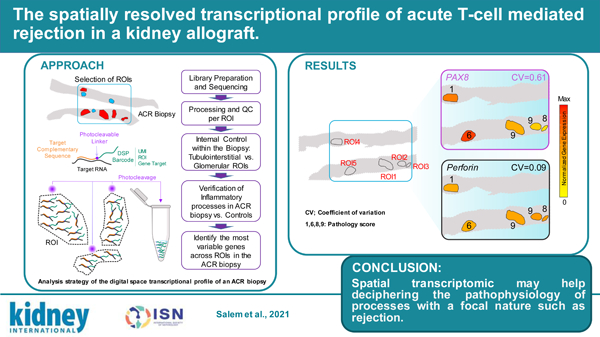
Graphical Abstract

INTRODUCTION
T Cell-medicated rejection (TCMR) represents the most common fate of any transplanted kidney graft in the absence of immunosuppression.1 Early studies of untreated cases show that this is a focal phenomenon, in which areas of severe graft immune infiltration alternate with areas of normal tissue. Currently available drugs have reduced the incidence of acute rejection below 10% in most centers,2 but this remarkable result has come with increased rates of opportunistic infections,3 cancer,4 and immunosuppressive therapy toxicities.5 Importantly, TCMR development still associates with a high long-term risk of graft failure.6
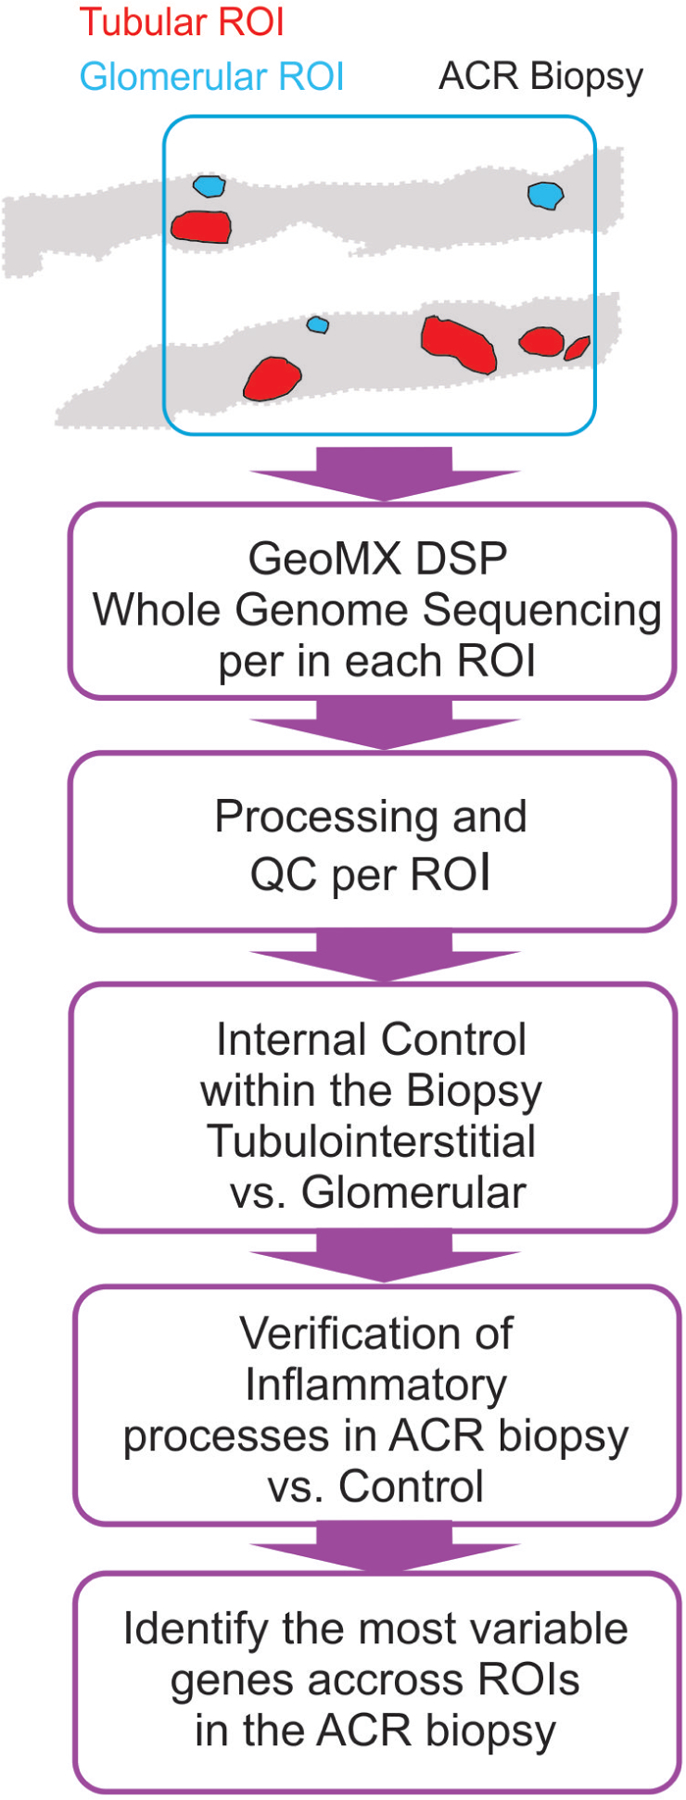
There is thus an unmet need for more selective, hypothesis-driven therapies to control alloimmune responses. This requires a deeper understanding of TCMR pathophysiology to identify proper therapeutic targets. Available murine models of organ transplantation only partially recapitulate human organ rejection.7 The study of human biopsies has provided important insights,8 but current techniques, both biased and unbiased, often fail to capture the focal nature of the TCMR. New spatial technologies offer the opportunity to analyze the transcriptional profile of variously affected areas of the graft biopsy separately.9 Herein, we report the first spatial whole-genome transcriptomic analysis of a kidney graft biopsy of a patient with chronic active TCMR (CA TCMR) (Figure 1) compared with a normal kidney control.
Figure 1. Analysis strategy of the digital space transcriptional profile of an ACR biopsy.

METHODS
Patient and control biopsies were obtained from paraffin blocks at pathology biorepositories at Mount Sinai Hospital, New York, NY and Gaslini Hospital, Genoa, Italy, respectively and deidentified. The Institutional Review Boards of both institutions approved the protocols for the collection of human samples. Informed consent for kidney biopsies was obtained from both participants. Whole exome sequencing was performed on selected ROIs using the GeoMX Digital Space Profiling platform and data analysis and processing performed in R (version 3.6.1). For a description of methodological details see Supplementary Information.
RESULTS
Histological analysis of the acute rejection biopsy
The biopsy was obtained from a 23-year old female recipient of a living-donor kidney transplant at 15 months after transplant. Immunosuppression consisted of steroids, tacrolimus and mycophenolate mofetil. The patient had a rise in serum creatinine of 2.1 mg/dl over her baseline value of less than 1 mg/dl (Supplemental Figure S1A). The kidney biopsy showed diffuse interstitial inflammation in the cortical parenchyma (i-IFTA3) with edema and severe tubulitis (t3), in addition to moderate cortical scarring associated with interstitial inflammation (i-IFTA3), consistent with CA TCMR grade IB (Supplemental Figure S1B).10 The treatment consisted of steroid pulse, thymoglobulin, and intravenous IgG, which resulted in a moderate reduction in serum creatinine (Supplemental Figure S1A). The patient eventually lost her graft 2.5 years after transplant.
The control biopsy was obtained from a 6-year old individual who underwent nephrectomy due to malignant hypertension secondary to renal artery stenosis. We used a biopsy from the non-tumorous portion a 70-year-old man with papillary urothelial carcinoma as an additional control.
Increased expression of inflammatory genes in the tubular regions but not in the glomeruli of ACR biopsy
In both the CA TCMR and control biopsies we identified 5 tubular regions of interest (ROIs) and 3 glomerular ROIs and performed individual whole exome sequencing for each ROI using the Nanostring Digital Space Profiling (DSP) GeoMX platform. As an internal control within the biopsy, we first compared the transcriptional program between 3 tubular and 3 glomerular ROIs in the CA TCMR biopsy. We detected increased expression of key glomerular genes in the glomerular regions (NPHS1, NPHS2, PODXL, PDGFRB, PLCE1, and ENPEP) confirming that the technique correctly captures the difference in transcriptional programs between nephron areas (Supplementary Figure S2A).
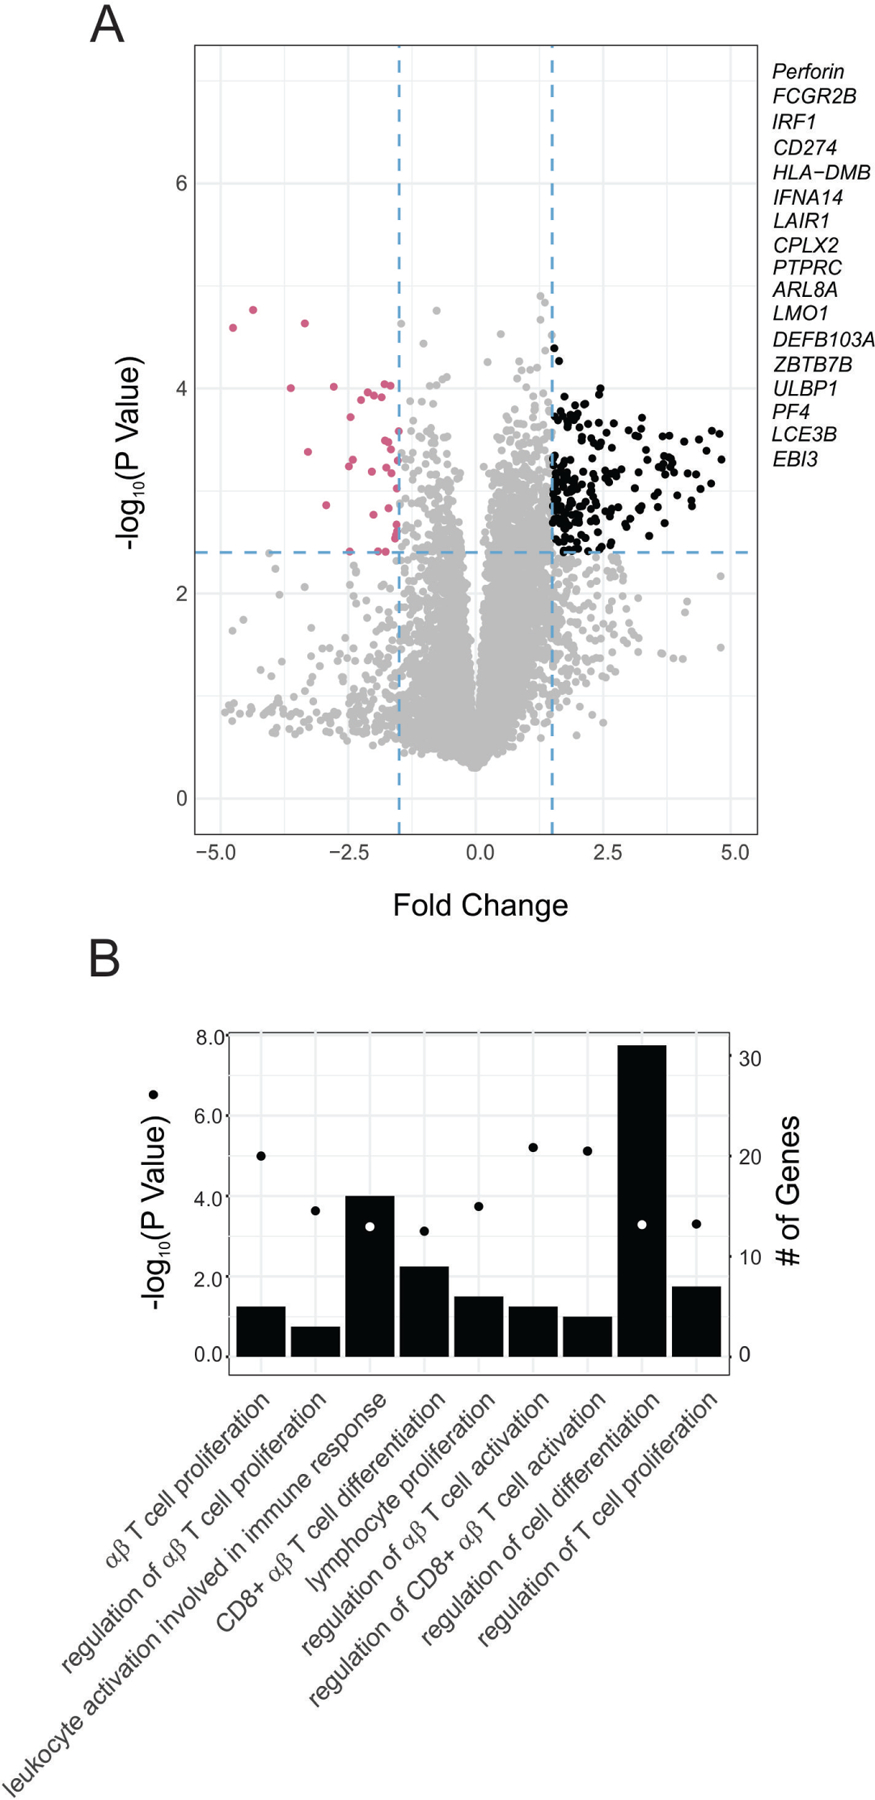
We next compared the differentially expressed genes between 5 tubular ROIs in the ACR biopsy and 5 analogous ROIs in the control biopsy. Our analysis identified 206 differentially increased genes in the ACR biopsy when compared to control (Figure 2A) which, in line with previous bulk microarray studies,11 showed an enrichment for gene-ontology terms associated with T cell activation, differentiation, and proliferation (Figure 2B). The genes with differentially decreased expression (n=36) did not show any significant enrichment, and the increased T cell transcriptional program was absent when comparing 3 glomerular ROIs between CA TCMR and control biopsies (Supplementary Figure S2B), indicating the selectivity of the finding to the tubular regions. Of note, we also observed an enrichment for T cell-related GO terms when we performed analogous analyses with the additional control (Supplementary Figure S3).
Figure 2. Higher expression of inflammatory genes in tubular ROIs in ACR biopsy.

(A) Volcano plot depicting the number of genes expressed differentially higher (black) and lower (purple) in tubular ROIs from the ACR biopsy when compared to the control biopsy (N=5 per biopsy). (B) Enriched Gene Ontology (GO) terms in the subset of genes differentially expressed higher. Enrichment P-values were obtained applying a hypergeometric test (see Statistical Analyses in Supplementary Information)
High variability in the kidney development transcriptional program across tubular areas in ACR
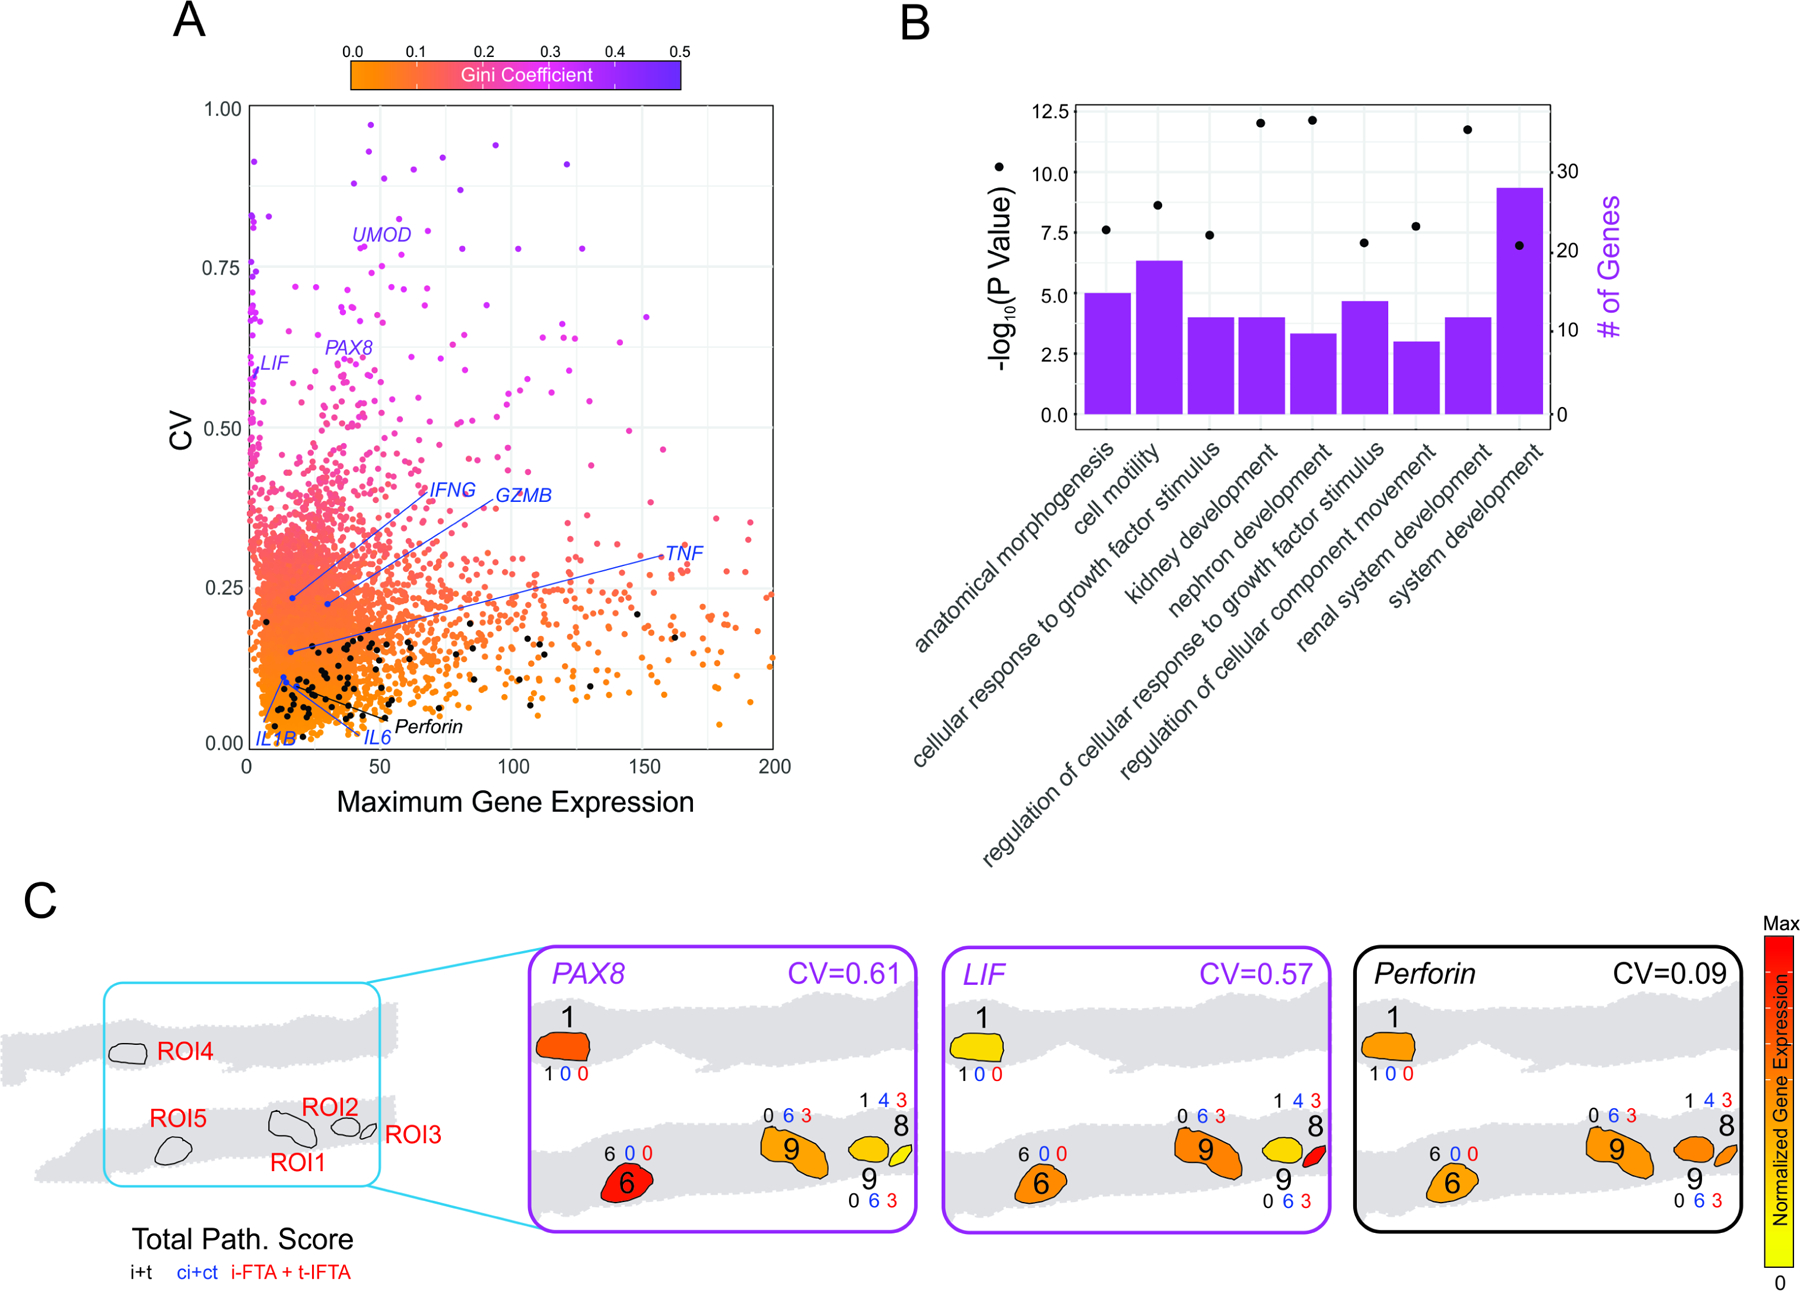
We hypothesized that the DSP approach would allow us to capture informative differences in gene transcriptional profiles across various tubular ROIs within the same biopsy that are missed by bulk approaches. To identify the genes with the highest variability, we started by calculating the coefficient of variation (CV) for each gene across the 5 ACR tubulo-interstitial ROIs (Figure 3A). To confidently establish that we were accurately capturing the most variable genes we simultaneously calculated the Gini coefficient, a robust nonparametric statistical measure of gene variation adopted from the field of economics 12. The CV and Gini coefficient were highly correlated Across ROIs (Pearson correlation coefficient 0.992019; p-value=2.2x10⁻⁶). Interestingly, none of the key differentially upregulated genes obtained when compared with control showed a high CV (see black dots Figure 3A and Supplementary Figure S4), nor did genes typically associated with inflammation in the graft (IL6, IL1B, IFNG or TNF), indicating limited variability of the immune-associated transcriptional within areas of the graft with inflammatory infiltrates.
Figure 3. High variably in kidney development transcriptional program across interstitial areas in ACR.

(A) Scatter plot depicting the maximum value of expression and the coefficient of variation across tubular ROIs in the ACR biopsy. Color shading indicates Gini coefficient. Upregulated genes when compared to control biopsy (Figure 2) are depicted in black, and classic inflammatory genes involved in ACR in blue. (B) Enriched Gene Ontology (GO) terms in upregulated genes for the 100 genes with the highest coefficient of variation. Enrichment P-values were obtained applying a hypergeometric test (see Statistical Analyses in Supplementary Information). (C) Representative graphical description of the spatial distribution of the three genes involved in kidney development with high variability and an inflammatory gene homogeneously expressed across ROI. Numbers indicate the total pathology score (see Supplementary Table 1). The expression levels of these highly variable ACR genes did not associate with the individual i+t, ci+ct, or iIFTA + tIFTA ROI pathology scores.
We next took the top 100 genes with the highest CV and performed a gene-ontology enrichment analysis which yielded terms involved in kidney development (Figure 3B) driven by genes such as PAX8 and LIF. These 100 genes had, for the most part, lower CV across tubulointerstitial ROIs in the control biopsy, suggesting their specificity and relevance for ACR. Furthermore, pathology scores of interstitial inflammation (i), tubulitis (t), interstitial fibrosis (ci), tubular atrophy (ct), inflammation and tubulitis in scarring areas, (i-ifta) and (t-ifta) respectively, were evaluated according to 2019 Banff classification.10 Pathology scores of each ROIs were added for a total score (Supplementary Table S1). Interestingly, the expression levels of these highly variable ACR genes did not associate with the individual i+t, ci+ct, or iIFTA + tIFTA ROI pathology scores (Fig. 3C).
We checked the overlap of these highly-variable genes with 19 pathogenesis-based transcript sets (PBTs) from the Halloran group at University of Alberta and the Banff Human Organ Transplant (B-HOT) gene panel (Supplementary Figure S5 and Supplementary Table S2). As predicted, the set of genes with increased expression in the ACR biopsy compared with control overlapped with B-HOT13 and PBTs associated with T cell-mediated rejection (GRIT214 and QCAT15). In contrast, the set of highly-variable genes did not overlap with any of the datasets associated with immune rejection, but instead with the IRRAT PBT proposed to be capable of distinguishing between early and late post-transplant kidney injury.16
Together, our results suggest that there are important biological processes that are not captured by histological analyses, which may be key to understand the state of the kidney during rejection.
DISCUSSION
The immune cell activation pathways associated with ACR have historically been one of the primary focus of transplant research.17 However, bulk biopsy analyses have not allowed to capture the changes in the transcriptional profiles across various regions of the graft. This is a major limitation, considering that graft response towards the alloimmune attack is likely characterized by a transcriptional response that is dynamic in time and does not occur simultaneously across the graft. Utilizing a spatial transcriptomic approach allowed us to study the transcriptional profile in various regions of CA TCMR biopsy separately and uncover the heterogeneity in the graft’s response across tubular areas. The use of a whole-genome transcriptomic technique as opposed to targeted techniques that focus on a pre-defined panel of transcripts (e.g. cancer-related or immune-related) has provided us with an unbiased finding regarding the biological processes at play in the graft.
When we analyzed the various tubular regions together, our data confirm previous reports indicating a significant enrichment for immune-associated processes in CA TCMR when compared to control.11 Importantly, the immune-associated processes identified by this analysis largely overlap with the genes and pathways previously identified by others in biopsies showing features of acute rejection (Supplemental Figure 5). Unexpectedly, our analysis newly showed that the immune transcriptional profile of those areas is relatively homogeneous, possibly because immune molecular abnormalities in the grafts are diffuse and not restricted to the areas of inflammation.18 In contrast, the transcriptional program that was highly variable across the same ROIs was related to kidney development and included PAX8 and LIF, two genes generally upregulated in kidney cancer19,20 and polycystic kidney disease.21 Of relevance, these genes are also upregulated in response to injury,22,23 which suggests that our transcriptional analysis was able to capture heterogeneity across different areas in the graft’s response to immune infiltrates, possibly as a result of different phases in the evolution of the ACR process.
This finding is consistent with the concept that accumulation of fibrosis is not primarily due to homogeneous collagen synthesis, but to limitations in the ability of the epithelium to repair itself, which may vary across different tubuli.24 Intriguingly, the identification of a transcriptional profile including both immune- and kidney graft-related genes in the acute rejection biopsy support the recent amendment of the Banff classification to include chronic-active TCMR as an individual criterion in ACR rejection.10
We also analyzed glomerular transcripts to test the hypothesis that, despite the absence of immune infiltrates, they also showed transcriptional abnormalities in the CA TCMR biopsy. Our analyses found no significant differences in the transcriptional profile of glomeruli between CA TCMR and control kidney, supporting the concept that glomeruli are largely unaffected by alloreactive cells, also at the transcriptional level. This is consistent with evidence that after ACR episodes signs of glomerular injury, such as proteinuria, are very uncommon.25 Moreover, our study provides important information concerning the normal kidney as they show that in the absence of disease the transcriptional profile across tubular and glomerular areas is quite homogeneous.
In this work we analyzed a single case of CA TCMR, therefore our results cannot be generalized to other ACR biopsies. However, this data provides the proof-of-concept that spatial transcriptomics represents a promising strategy to unravel pathophysiological mechanisms of rejection and confirming the recent amendment of the Banff classification to include chronic-active TCMR as an individual criterion in ACR rejection.10 The importance of DSP as an approach to study kidney may go beyond the transplant setting and likely apply to any conditions with a focal nature.
Supplementary Material
TRANSLATIONAL IMPACT.
Our data indicate that whole exome GeoMX Digital Space Profiling platform can be used to study the transcriptional profile in different regions of acute rejection biopsies. This allows to decipher patterns of gene expression across regions, which is particularly relevant for a biological process with a focal nature, such as rejection.
Since this technique can be performed on paraffin sections, transcriptional data can be correlated with long-term graft and/or patient outcomes, making this approach suitable for the identification of key, clinically relevant, pathogenic mechanisms and novel biomarkers.
ACKNOWLEDGEMENTS
The study was supported by a grant from the Renal Research Institute (RRI), New York, NY, USA. M.F. was supported by National Institute of Allergy and Infectious Diseases (NIAID) grant R01 AI141710.
Footnotes
Publisher's Disclaimer: This is a PDF file of an unedited manuscript that has been accepted for publication. As a service to our customers we are providing this early version of the manuscript. The manuscript will undergo copyediting, typesetting, and review of the resulting proof before it is published in its final form. Please note that during the production process errors may be discovered which could affect the content, and all legal disclaimers that apply to the journal pertain.
DISCLOSURE
All the authors declared no competing interests.
DATA and CODE AVAILABILITY
The data will be submitted to Gene Expression Omnibus (GEO, https://www.ncbi.nlm.nih.gov/geo/) before publication. Analysis scripts will be deposited in Github (http://github.com) before publication.
SUPPLEMENTARY MATERIALS
Supplementary Information. Detailed methods, data processing and statistical analyses.
REFERENCES
- 1.Halloran PF. Immunosuppressive drugs for kidney transplantation. N Engl J Med 2004;351(26):2715–2729. [DOI] [PubMed] [Google Scholar]
- 2.Hart A, Smith JM, Skeans MA, et al. OPTN/SRTR 2016 Annual Data Report: Kidney. Am J Transplant 2018;18 Suppl 1:18–113. [DOI] [PMC free article] [PubMed] [Google Scholar]
- 3.Karuthu S, Blumberg EA. Common infections in kidney transplant recipients. Clin J Am Soc Nephrol 2012;7(12):2058–2070. [DOI] [PubMed] [Google Scholar]
- 4.Au E, Wong G, Chapman JR. Cancer in kidney transplant recipients. Nat Rev Nephrol 2018;14(8):508–520. [DOI] [PubMed] [Google Scholar]
- 5.Wiseman AC. Immunosuppressive Medications. Clin J Am Soc Nephrol 2016;11(2):332–343. [DOI] [PMC free article] [PubMed] [Google Scholar]
- 6.Clayton PA, McDonald SP, Russ GR, Chadban SJ. Long-Term Outcomes after Acute Rejection in Kidney Transplant Recipients: An ANZDATA Analysis. J Am Soc Nephrol 2019;30(9):1697–1707. [DOI] [PMC free article] [PubMed] [Google Scholar]
- 7.Chong AS, Alegre ML, Miller ML, Fairchild RL. Lessons and limits of mouse models. Cold Spring Harb Perspect Med 2013;3(12):a015495. [DOI] [PMC free article] [PubMed] [Google Scholar]
- 8.O’Connell PJ, Zhang W, Menon MC, et al. Biopsy transcriptome expression profiling to identify kidney transplants at risk of chronic injury: a multicentre, prospective study. Lancet 2016;388(10048):983–993. [DOI] [PMC free article] [PubMed] [Google Scholar]
- 9.Tripodo C, Zanardi F, Iannelli F, et al. A Spatially Resolved Dark- versus Light-Zone Microenvironment Signature Subdivides Germinal Center-Related Aggressive B Cell Lymphomas. iScience 2020;23(10):101562. [DOI] [PMC free article] [PubMed] [Google Scholar]
- 10.Loupy A, Haas M, Roufosse C, et al. The Banff 2019 Kidney Meeting Report (I): Updates on and clarification of criteria for T cell- and antibody-mediated rejection. Am J Transplant 2020;20(9):2318–2331. [DOI] [PMC free article] [PubMed] [Google Scholar]
- 11.Reeve J, Einecke G, Mengel M, et al. Diagnosing rejection in renal transplants: a comparison of molecular- and histopathology-based approaches. Am J Transplant 2009;9(8):1802–1810. [DOI] [PubMed] [Google Scholar]
- 12.Wright Muelas M, Mughal F, O’Hagan S, Day PJ, Kell DB. The role and robustness of the Gini coefficient as an unbiased tool for the selection of Gini genes for normalising expression profiling data. Sci Rep 2019;9(1):17960. [DOI] [PMC free article] [PubMed] [Google Scholar]
- 13.Mengel M, Loupy A, Haas M, et al. Banff 2019 Meeting Report: Molecular diagnostics in solid organ transplantation-Consensus for the Banff Human Organ Transplant (whole) gene panel and open source multicenter validation. Am J Transplant 2020;20(9):2305–2317. [DOI] [PMC free article] [PubMed] [Google Scholar]
- 14.Famulski KS, Einecke G, Reeve J, et al. Changes in the transcriptome in allograft rejection: IFN-gamma-induced transcripts in mouse kidney allografts. Am J Transplant 2006;6(6):1342–1354. [DOI] [PubMed] [Google Scholar]
- 15.Hidalgo LG, Einecke G, Allanach K, et al. The transcriptome of human cytotoxic T cells: measuring the burden of CTL-associated transcripts in human kidney transplants. Am J Transplant 2008;8(3):637–646. [DOI] [PubMed] [Google Scholar]
- 16.Famulski KS, de Freitas DG, Kreepala C, et al. Molecular phenotypes of acute kidney injury in kidney transplants. J Am Soc Nephrol 2012;23(5):948–958. [DOI] [PMC free article] [PubMed] [Google Scholar]
- 17.Moreau A, Varey E, Anegon I, Cuturi MC. Effector mechanisms of rejection. Cold Spring Harb Perspect Med 2013;3(11). [DOI] [PMC free article] [PubMed] [Google Scholar]
- 18.Madill-Thomsen KS, Wiggins RC, Eskandary F, Bohmig GA, Halloran PF. The Effect of Cortex/Medulla Proportions on Molecular Diagnoses in Kidney Transplant Biopsies: Rejection and Injury Can Be Assessed in Medulla. Am J Transplant 2017;17(8):2117–2128. [DOI] [PMC free article] [PubMed] [Google Scholar]
- 19.Bleu M, Gaulis S, Lopes R, et al. PAX8 activates metabolic genes via enhancer elements in Renal Cell Carcinoma. Nat Commun 2019;10(1):3739. [DOI] [PMC free article] [PubMed] [Google Scholar]
- 20.Kellokumpu-Lehtinen P, Talpaz M, Harris D, Van Q, Kurzrock R, Estrov Z. Leukemia-inhibitory factor stimulates breast, kidney and prostate cancer cell proliferation by paracrine and autocrine pathways. Int J Cancer 1996;66(4):515–519. [DOI] [PubMed] [Google Scholar]
- 21.Grimley E, Dressler GR. Are Pax proteins potential therapeutic targets in kidney disease and cancer? Kidney Int 2018;94(2):259–267. [DOI] [PMC free article] [PubMed] [Google Scholar]
- 22.Peired AJ, Antonelli G, Angelotti ML, et al. Acute kidney injury promotes development of papillary renal cell adenoma and carcinoma from renal progenitor cells. Sci Transl Med 2020;12(536). [DOI] [PubMed] [Google Scholar]
- 23.Yoshino J, Monkawa T, Tsuji M, Hayashi M, Saruta T. Leukemia inhibitory factor is involved in tubular regeneration after experimental acute renal failure. J Am Soc Nephrol 2003;14(12):3090–3101. [DOI] [PubMed] [Google Scholar]
- 24.Halloran PF, Famulski KS, Reeve J. Molecular assessment of disease states in kidney transplant biopsy samples. Nat Rev Nephrol 2016;12(9):534–548. [DOI] [PubMed] [Google Scholar]
- 25.Knoll GA. Proteinuria in kidney transplant recipients: prevalence, prognosis, and evidence-based management. Am J Kidney Dis 2009;54(6):1131–1144. [DOI] [PubMed] [Google Scholar]
Associated Data
This section collects any data citations, data availability statements, or supplementary materials included in this article.


