

Abstract
The Human Connectome Project (HCP) was launched in 2010 as an ambitious effort to accelerate advances in human neuroimaging, particularly for measures of brain connectivity; apply these advances to study a large number of healthy young adults; and freely share the data and tools with the scientific community. NIH awarded grants to two consortia; this retrospective focuses on the “WU-Minn-Ox” HCP consortium centered at Washington University, the University of Minnesota, and University of Oxford. In just over 6 years, the WU-Minn-Ox consortium succeeded in its core objectives by: 1) improving MR scanner hardware, pulse sequence design, and image reconstruction methods, 2) acquiring and analyzing multimodal MRI and MEG data of unprecedented quality together with behavioral measures from more than 1100 HCP participants, and 3) freely sharing the data (via the ConnectomeDB database) and associated analysis and visualization tools. To date, more than 27 Petabytes of data have been shared, and 1508 papers acknowledging HCP data use have been published. The “HCP-style” neuroimaging paradigm has emerged as a set of best-practice strategies for optimizing data acquisition and analysis. This article reviews the history of the HCP, including comments on key events and decisions associated with major project components. We discuss several scientific advances using HCP data, including improved cortical parcellations, analyses of connectivity based on functional and diffusion MRI, and analyses of brain-behavior relationships. We also touch upon our efforts to develop and share a variety of associated data processing and analysis tools along with detailed documentation, tutorials, and an educational course to train the next generation of neuroimagers. We conclude with a look forward at opportunities and challenges facing the human neuroimaging field from the perspective of the HCP consortium.
Keywords: diffusion imaging, functional MRI, parcellation, magnetoencephalography, connectivity, behavior, informatics
1. Introduction
The historical roots of the Human Connectome Project (HCP) lie in two sets of advances in neuroscience in the late 20th century. One is the emergence of complementary MRI-based modalities for noninvasive imaging of brain structure, function, and connectivity using structural MRI, resting-state functional MRI (rfMRI), task-evoked functional MRI (tfMRI), and diffusion imaging (dMRI). A second set of advances was inspired by the drive to understand the complete ‘wiring diagram’ of the nervous system, an aspiration of neuroanatomists since the pioneering studies of Cajal early in the 20th century (Cajal 1909). A major milestone was the electron microscopic charting of all synaptic connections in the nematode (White et al. 1986), revealing remarkable complexity for even a ‘simple’ nervous system. Another milestone was the compilation of a connectivity matrix for hundreds of anatomical pathways interconnecting dozens of macaque visual cortical areas (Felleman and Van Essen 1991), revealing an unexpected degree of complexity at a macroscopic level. The term ‘connectome’ to describe such connectivity matrices was introduced in 2005, when it was invoked in the spirit of the genome, proteome, and other ‘-omics’ terminology (Sporns et al. 2005). The authors speculated that in vivo tractography and rfMRI might enable generation of structural and functional ‘connectomes’ for the human brain, but noted that several major methodological limitations would need to be addressed for these aspirations to be realized.
The decision to invest in mapping the human connectome was made by the NIH Blueprint for Neuroscience Research, a group of Institutes and Centers that since 2004 has pooled resources to support large-scale efforts that benefit the neuroscience community broadly. In 2009, the Blueprint leadership team identified the Human Connectome Project (HCP) as the first in a series of Blueprint Grand Challenges, with Michael Huerta as the lead NIH contact and Story Landis (NINDS), Thomas Insel (NIMH), and Nora Volkow (NIDA) as major supporters among NIH Directors. The announcement of the HCP open competition sparked widespread interest in the neuroimaging community (see Section 2).
In 2010, the National Institutes of Health (NIH) awarded ~$40 million total to two Human Connectome Project (HCP) consortia to accelerate advances in neuroimaging methods and to generate and share high quality data that would better characterize whole brain area-to-area connections in healthy adults. The “WU-Minn-Ox” HCP consortium, centered at Washington University, the University of Minnesota, and University of Oxford, aimed to comprehensively map structural and functional connectivity in 1200 healthy young adults (ages 22–35) and to explore relationships with behavior and lifestyle. The HCP (subsequently identified as HCP-Young Adult [HCP-YA] to distinguish it from the follow-on Lifespan HCP studies, HCP-Aging and HCP-Development) would push the limits of available multimodal imaging technology, apply it at a scale never before attempted in a single study, and openly share all methods, analysis tools, and resulting imaging, behavioral, and genetic data using accessible, user-friendly platforms. With the assembled expertise and commitment to build upon several emerging advances (e.g., accelerated imaging acquisition, improvements in preprocessing and analysis approaches, and multimodal analysis), the WU-Minn-Ox consortium had a vision to create a new standard for human neuroimaging that would provide a foundation for future large studies of different age groups and disease cohorts. The “MGH-UCLA” consortium focused on producing a specialized 3T scanner with exceptionally high maximal gradient strength (300 mT/m) for diffusion imaging (Setsompop et al. 2013), which would be located at Massachusetts General Hospital (MGH), with informatics support provided by a team at the University of California at Los Angeles.
The NIH request for applications (RFA) encouraged an unusual 2 years of methodological development and optimization prior to beginning data collection of the main sample. The WU-Minn-Ox consortium proposed two years of extensive piloting (Phase 1) to test new MR hardware, develop pulse sequences and image acquisition protocols, reconstruction algorithms, data processing and analysis tools, and establish standard operating procedures for all aspects of data collection, before recruited participants were enrolled in the production phase (Phase 2) of the project. To enable heritability and imaging genetic analyses of individual variability in brain connectivity, the 1200 participants were to be recruited as families of twins and non-twin siblings. All would undergo extensive behavioral testing, genotyping, and be scanned on a single 3T scanner using a common MRI protocol including structural MRI, rfMRI, tfMRI, and high angular resolution dMRI. In addition to the core 3T scanning, a targeted subset of 100 same-sex twin pairs (200 participants) were to be studied at 7T using rfMRI, movie watching, retinotopy, and dMRI. To acquire high temporal resolution information about connectome dynamics, a targeted subset of 50 same-sex twin pairs (100 subjects) were to be additionally studied by magnetoencephalography (MEG), including resting-state (rMEG) and task-evoked (tMEG) datasets (Van Essen et al. 2013).
Although ambitious and daunting in scope, the WU-Minn-Ox HCP fulfilled its core goals in just over 6 years, providing a valuable, freely shared collection of ~1100 high-quality, high-temporal and spatial resolution multimodal 3T MRI datasets (including 45 Test-Retest datasets), 184 7T MRI datasets, 95 rMEG and tMEG datasets, behavioral data for 1206 participants, and genotyping data for 1142 participants. Equally importantly, several major HCP-generated innovations upon which this achievement depended have also been made widely available, including a set of optimized MRI pulse sequences and image reconstruction algorithms, improved preprocessing and analysis pipelines, and a host of neuroimaging analysis and informatics tools designed for the new CIFTI format, which allows for combined analyses of cortical surface and subcortical volume “grayordinates”.
In aggregate, these advances emerged as an integrated “HCP-style” paradigm for neuroimaging data acquisition, analysis, and sharing (Glasser et al. 2016b), whose impact on the field continues to grow. One manifestation of this has been a series of large-scale follow-up projects, including the Lifespan HCP Development and Aging studies (Bookheimer et al. 2019; Somerville et al. 2018), a set of Connectomes Related to Human Disease projects, and several others that are all modeled on the HCP-style paradigm (see Section 12.2). Equally importantly, a growing number of individual investigators, including those studying nonhuman primates as well as humans, are applying this paradigm to their own research endeavors and also invoking its principles of data acquisition, analysis, and sharing when reviewing grants and manuscripts.
Given the multifaceted nature of the HCP, there are numerous topics of interest to cover in this retrospective, which is divided into 12 sections. Section 2 covers additional information about origins and design of HCP, including ‘behind-the-scenes’ observations on selected events and decisions that had major impact. Section 3 comments on the custom scanner hardware for both the WU-Minn-Ox HCP and the MGH-UCLA HCP. Sections 4–7 cover data acquisition and analysis for structural MRI, fMRI, diffusion MRI, and MEG. Sections 8–10 discuss non-imaging data types (behavior, genotyping), multimodal analyses, informatics, data sharing, and outreach. Sections 11 and 12 discuss HCP’s overall impact, what went especially well, what might have been done better or differently, underexplored aspects of HCP data, a host of ‘HCP-style’ projects that followed the Young Adult HCP, the roles of the Connectome Coordination Facility (CCF) and NIMH Data Archive (NDA), and a brief look forward at broader opportunities and challenges facing the human neuroimaging field.
2. HCP consortium origins and project design
2.1. Responding to a Grand Challenge.
In the initial public announcement of the Human Connectome Project competition in May of 2009, NIH expressed an intent to make a single award of up to $30M over 5 years to “develop and share knowledge about the structural and functional connectivity of the human brain”. The expected deliverables were “1) A set of integrated, non-invasive imaging tools to obtain connectivity data from humans in vivo; 2) A high quality and well characterized, quantitative set of human connectivity data linked to behavioral and genetic data as well as to general, existing architectonic data, and associated models, from up to hundreds of healthy adult female and male subjects; and 3) Rapid, user-friendly dissemination of connectivity data, models, and tools to the research community via outreach activities and an informatics platform.” This Grand Challenge was initiated by the NIH Blueprint for Neuroscience Research, a pooled resource for investing in large-scale neuroscience efforts that benefit researchers across disciplines.
Given the broad scope outlined for the HCP, potential applicants naturally countenanced collaborations among multiple institutions when formulating their plans. The June 2009 meeting of the Organization for Human Brain Mapping (OHBM) in San Francisco provided a convenient venue for many exploratory conversations amongst investigators who were potential collaborators – but also with those who were potential competitors! Extensive discussions and negotiations continued on throughout the summer, with the November deadline for grant submissions adding pressure to sort out arrangements expeditiously.
2.2. The WU-Minn-Ox HCP consortium.
At Washington University, an ad hoc group led by David Van Essen had begun in May to discuss possible approaches that would capitalize on WashU’s institutional strengths in rfMRI, tfMRI, cortical parcellation, neuroinformatics databases, and brain-mapping software, including surface-based analysis and visualization of cerebral cortex. To bring on board complementary strengths in other mission-critical domains, exploratory conversations resulted in convergence with two other institutions – the University of Minnesota (UMinn) and University of Oxford – to form the “WU-Minn-Ox” HCP consortium. The UMinn Center for Magnetic Resonance Research (CMRR) group led by Kamil Ugurbil provided world-class strength in MRI hardware and pulse sequence development. The Oxford FMRIB (Functional MRI of the Brain) group led by Steve Smith and Tim Behrens provided expertise in brain connectivity and MRI analysis software (FSL). In addition, a magnetoencephalography (MEG) component emerged that involved St. Louis University, WashU, and several European institutions.
2.3. A fortuitous “parcellation challenge”.
In 2009, prior to the HCP announcement, Walter Schneider (U. of Pittsburgh) organized the annual Brain Connectivity Competition with the serendipitously chosen challenge project to generate a parcellated human connectome using a common multimodal in vivo neuroimaging dataset provided to competitors. The advisory committee that helped determine the specifics for this competition (e.g., imaging parameters for data acquisition) included David Van Essen (WashU) and Tim Behrens (Oxford). Among the competitors (and eventual co-winners announced at OHBM 2009) were 3 WashU MD/PhD students (Alex Cohen, Matt Glasser, and Tim Laumann) from the Steve Petersen and Van Essen labs. Their experience in striving to parcellate the brain and generate connectome data brought many complex technical issues into sharper focus. This helped the WU-Minn-Ox consortium hit the ground running when formulating specific plans for data acquisition and analysis to be included in the WU-Minn-Ox proposal.
2.4. Key features of the WU-Minn-Ox collaboration and proposal design.
As planning for the grant commenced, two operating principles were adopted. (i) During weekly planning sessions, a major part of each session was devoted to presentations led by domain experts that brought others in the consortium ‘up to speed’ in understanding and appreciating the complex technical and conceptual issues underlying major components of the nascent proposal. (ii) An open and egalitarian work ethic encouraged contributions, questions, and challenges based on scientific merit and not on academic status, as the team intensively discussed and debated critical issues.
Other distinctive features of the WU-Minn-Ox proposal warrant comment. (i) Twin family study. The commitment to study twins and their siblings benefitted from collaborator Andrew Heath’s long experience with the Missouri Family Registry and led to the decision to recruit exclusively at WashU. A corollary decision was to aim for 1200 subjects (rather than ‘up to several hundred’ as stipulated in the RFA) in order to maximize the power of heritability and genetic analyses under the constraints of the available funding (but with awareness that this N was smaller than for typical genome-wide association studies). Among the significant trade-offs was a decision not to map receptor ligand binding patterns using positron emission tomography (PET) – an option with high scientific appeal but a large budgetary impact. (ii) Customized 3T scanner. Discussions with Siemens engineers indicated the feasibility of a new scanner with improved maximal gradient strength for dMRI to be used for the high-throughput scanning at WashU. During the Phase 1 testing and piloting period, it was essential to situate this scanner at CMRR, where the MR physics expertise was concentrated, before shipping to WashU. (iii) Pulse sequence optimization. Major refinements were proposed for pulse sequences to be used for fMRI and dMRI, using multiband imaging and related strategies to improve resolution in space and time. These were implemented during Phase 1. (iv) 7T scans. Given that ultra-high-field scanners provide higher resolution and contrast-to-noise, but pose challenges in sustaining high-throughput daily sessions, it was decided to fly 200 twin subjects initially scanned at WashU to Minneapolis to be scanned again using a 7T scanner at UMinn. (v) Improved preprocessing. Major efforts were proposed in order to reduce artifacts and distortions that are major confounds in both fMRI and dMRI and improve inter-subject alignment using cortical surface-based registration and information from structural MRI, rfMRI, tfMRI, and dMRI. For the mission-critical process of cortical segmentation, FreeSurfer (Fischl 2012) was selected over various alternatives because of its accuracy and robust performance. (vi) Cortical parcellation. Extensive efforts were proposed to parcellate the cerebral cortex, using multiple modalities (especially rfMRI and dMRI) and a combination of surface-based connectivity gradients and ICA-based parcellation. (vii) Magnetoencephalography. In order to acquire information about rapid (neuronal timescale) temporal events, 100 twin subjects were to be scanned using an MEG scanner at St. Louis University using combined EEG/MEG, if technical challenges could be resolved. (viii) Extensive phenotypic characterization. The proposed phenotypic characterization included diverse measures of cognitive, sensory, and motor performance and of emotion, substance use and mental health. (ix) Informatics infrastructure. For data sharing, the XNAT database platform previously used primarily for structural MRI and internal data organization would be expanded into a public-facing ConnectomeDB platform to support user-friendly sharing of multiple imaging modalities and behavioral measures. For data visualization and analysis, CARET software would be converted into the Connectome Workbench platform designed for flexible handling of multiple image modalities with resulting connectomes displayed on surfaces and volumes.
2.5. Decision time!
NIH convened a special study section to review the 7 proposals submitted in response to the HCP RFA. In early April 2010, NIH decided to award the full $30M, 5 year grant to the WU-Minn-Ox collaboration with David Van Essen and Kamil Ugurbil as PI’s, enabling it to proceed full-speed on its large-scale ‘leading edge’ connectomics endeavor. A second award was made to the MGH-UCLA consortium for their ‘bleeding edge’ project to produce a specialized 3T scanner with exceptionally high maximal gradient strength for diffusion imaging, but which is less well suited for high-throughput connectomics (Setsompop et al. 2013).
2.6. A timeline of key HCP milestones.
Fig. 1 shows key milestones associated with the HCP, including data releases (bold font). Also shown (in red font) are milestones for the Lifespan HCP-Development and HCP-Aging and Connectomes Related to Human Disease projects, since these were spurred by the success of the HCP, and the Lifespan projects involved many members of the original HCP consortium (see Section 12.2).
Figure 1. Major Milestones for the WU-Minn-Ox HCP.
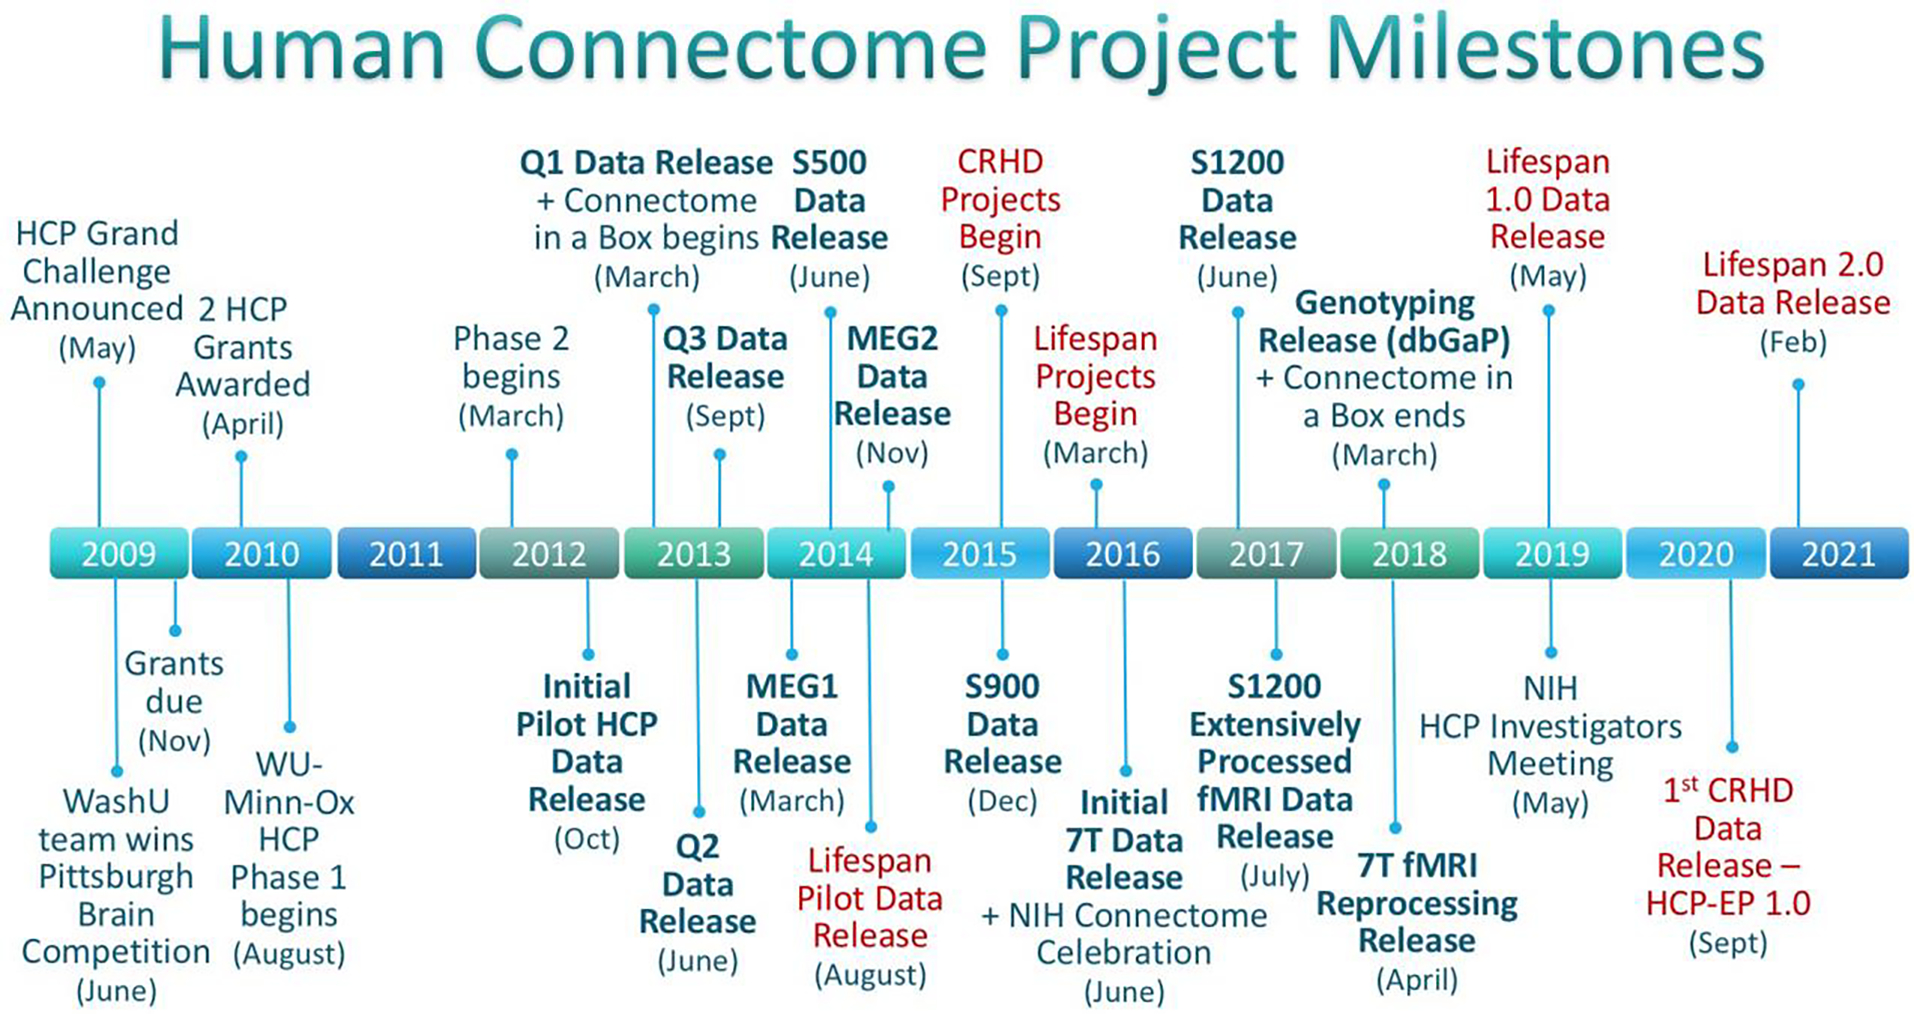
Milestones over the entire Human Connectome Project timeline, including projects directly sparked by HCP. Releases of HCP data are bolded, Lifespan HCP-Development & HCP-Aging and Connectomes Related to Human Disease (CRHD) Projects are in red, including HCP Early Psychosis (HCP-EP), a CRHD project based at Brigham & Women’s Hospital/Indiana University.
3. Improved MRI hardware
3.1. The WU-Minn-Ox Connectom scanner.
The WU-Minn-Ox consortium aimed to attain higher performance than a conventional 3T scanner while also assuring reliable performance suitable for scanning 1200 participants over 3 years. A key objective was to increase the maximum gradient amplitude (Gmax) in order to enhance the signal-to-noise ratio (SNR) for diffusion imaging. We proposed to Siemens that they adapt the high performance SC72 gradient set previously used on the Siemens 7T systems for a 3T Skyra scanner. By also including upgrades of the gradient amplifier, the resultant customized ‘Connectom’ scanner achieved a Gmax of 100 mT/m per axis and slew rates of 200 mT/m/ms compared to 40 mT/m (and lower slew rates) for conventional 3T scanners at the time. This choice was based on two main considerations. (i) The overarching objective of scanning each of 1200 participants for several hours using high duty-cycle fMRI and dMRI pulse sequences necessitated robust hardware performance with minimal down-time for repairs. Hence, our preferred strategy was to customize an existing gradient system, rather than to design and implement a first of its kind gradient set. (ii) SNR simulations indicated that for our proposed maximum b-value of 3000 s/mm2, a Gmax of 100 mT/m would provide a large SNR gain, but that further tripling the maximum gradient to 300 mT/m would yield only a modest additional increase in SNR (Ugurbil et al. 2013).
Siemens delivered the customized scanner to CMRR in the fall of 2010, a few months after the HCP award began. After extensive piloting of pulse sequences at CMRR (see Sections 4.1, 5.1, 6.1), the scanner was shipped to WashU in June 2012, and scanning of twin families commenced on schedule in August 2012. Once all HCP-related scanning was completed in 2016, the scanner was decommissioned and was later replaced by a 3T Prisma, the product line introduced by Siemens based in large part on the technical advances demonstrated by the WU-Minn-Ox HCP custom scanner. A standard product scanner with 80 mT/m gradients is easier to maintain in the long term, and the Prisma also addresses some of the design compromises of the customized Skyra.
3.2. HCP MRI scan protocols.
The scan protocols for all modalities used by the HCP on the 3T Connectom scanner are available [1] (full protocols in Appendix 1). Full 7T scanning protocols are available [2] as well.
3.3. The MGH Connectom scanner.
The MGH-UCLA consortium (more recently called the MGH-USC consortium) chose a complementary path by working with Siemens to design and construct a customized 3T scanner equipped with a gradient capable of 300 mT/m and a slew rate of 200 mT/m/ms and a 64-channel phased-array receiver coil (Keil et al. 2012). The maximum gradient strength offers maximal benefit when using very high b-values (e.g., 10,000 s/mm2), where the SNR gain is ~2-fold that of the WU-Minn-Ox Connectom scanner and ~3-fold that of a conventional scanner with Gmax of 40 mT/m (Setsompop et al. 2013). In Section 6.3, we comment briefly on the important contributions emerging from the MGH Connectom as well as the WU-Minn-Ox Connectom scanners.
4. Advances in structural imaging
4.1. Structural scans and FreeSurfer segmentation.
Two key objectives of the HCP approach to structural imaging were (i) to segment the cerebral cortical ribbon as accurately as possible, and (ii) to use the T1w/T2w ratio as an indicator of cortical myelin content to aid in identifying areal boundaries (Glasser and Van Essen 2011). These objectives were achieved with advances along four methodological fronts: (i) Rather than the conventional 1mm isotropic resolution, high spatial resolution (0.7mm isotropic) 3D T1w and T2w images were collected, thereby enabling more accurate FreeSurfer surface placement, especially in thin, heavily myelinated regions such as visual or somatosensory cortex (Glasser et al. 2013; Glasser et al. 2014; Glasser and Van Essen 2011). (ii) To achieve even spacing of white matter, gray matter, and CSF tissue peaks and maximal intracortical myelin contrast, contrast parameters for 3D T1w and T2w imaging were optimized (TI=1000ms, 8 degrees flip angle, TE was minimized for the T1w MPRAGE acquisition; and TE was set to 565ms for the T2w SPACE acquisition). (iii) In the absence of motion, B1− receive coil fields can be corrected using the ratio of T1w/T2w and the HCP acquired matched gradient echo images using the 32-channel head coil and the body coil for recieve to enable offline computation of the B1− receive field, analogous to the online Siemens “Prescan Normalize” approach. However, B1+ transmit effects differ between gradient echo T1w and spin echo T2w (as the latter involves greater transmit RF exposure). For this reason, the HCP acquired “Actual Flip angle Imaging” (AFI) scans (Yarnykh 2007) that provide an explicit map of the B1+ field. These AFI scans have recently been used (Glasser et al. 2021) to perform a more principled B1+ correction than the bias field correction (‘_BC’ files) originally applied in the HCP Pipelines (Glasser et al. 2013). (iv) The T2w acquisition was also incorporated into pial surface estimation (in FreeSurfer) to help exclude dura and blood vessels (Glasser et al. 2013), and white surfaces were fine-tuned using the full 0.7mm resolution available (rather than the initial FreeSurfer positioning using 1mm resolution). These improvements in white and pial surface positioning lead to higher quality estimates of T1w/T2w myelin content, cortical thickness, and functional and diffusion MRI based cortical measures. However, they required many code changes across multiple FreeSurfer versions; indeed, the current release (FreeSurfer 7.1.1) does not currently achieve the surface placement quality of FreeSurfer versions 5.3HCP or 6.0 customized for HCP. One reason why surface positioning remains challenging is that the underlying tissue classification does not incorporate prior information about expected regional differences in cortical gray matter myelin content, making errors more common in regions with particularly dense or light myelination that deviate from average cortical gray matter intensities.
4.2. Cortical surfaces, CIFTI grayordinates, and HCP-style preprocessing.
The advantages of surface-based analysis and visualization over traditional volume-based methods have been evident from the earliest fMRI studies of human visual cortex (e.g., Sereno et al. 1995) and have been articulated repeatedly over many years (e.g., Van Essen et al. 1998). However, for whole-brain analyses of fMRI data, it is important to include subcortical gray matter structures that are best represented volumetrically. To handle this efficiently, the HCP devised a new approach to defining standard space for comparing between subjects, termed “CIFTI-grayordinates”, which combine the advantages of 2D surface meshes for cortical surfaces with 3D volume coordinates for subcortical volume data. The CIFTI format also enables ‘parcel-constrained smoothing’, thereby reducing noise while avoiding blurring across tissue boundaries and functionally distinct parcel boundaries.
This CIFTI-grayordinates space, together with an emphasis on correcting distortions and motion between imaging modalities, minimizing spatial smoothing, and improving cross-subject cortical alignment are of arguably greater importance than the technical acquisition improvements that enabled higher spatial, temporal, and angular resolution multimodal MRI. Indeed, applying traditional volumetric MRI analysis methods to HCP-style acquired data leads to a major loss in spatial localization – essentially squandering the benefits of using HCP-style data. Conversely, even relatively low-resolution legacy MRI data can significantly benefit from HCP-style preprocessing (Coalson et al. 2018). These preprocessing advances arising from the HCP are applicable across structural, functional, and diffusion modalities and benefit the field broadly as investigators increasingly adopt the HCP Pipelines (https://github.com/Washington-University/HCPpipelines) (Glasser et al. 2013) or similar approaches (Dickie et al. 2019; Esteban et al. 2019) in their own research. It is notable that these advances stemmed largely from the simple observations that in structural MRI data, T1w/T2w myelin maps visualized at the group level only get blurrier when smoothed at the individual-subject level (smoothing does not improve alignment) and are uninterpretable in many regions within the cortical ribbon when aligned volumetrically (even with non-linear registration). These insights formed the basis of the fresh and critical look at each step of traditional brain imaging preprocessing and analysis undertaken by the HCP.
5. fMRI acquisition and preprocessing
5.1. Multiband (Simultaneous Multi-Slice) data acquisition.
Prior to the HCP, the standard fMRI protocol for 3T scans achieved ~3–4mm spatial resolution and ~2–4 second temporal resolution. This coarse spatial resolution relative to brain anatomy (especially cortical thickness) was historically justified by the higher signal-to-noise ratio (SNR) afforded with larger voxels and the long repetition time (TR) needed for whole brain coverage. Indeed, these technical limitations led many in the field to tolerate low spatial and temporal resolution for fMRI, along with the aforementioned preprocessing strategies of heavy spatial and temporal smoothing. The advent of parallel imaging and high-density radio frequency (RF) coil arrays made higher spatial and temporal resolutions feasible. The HCP put considerable effort into reevaluating all aspects of acquisition, preprocessing, and analysis methods to take full advantage of these new technologies.
Prior to the HCP, investigators at UMinn had been working on accelerated imaging approaches for 7T fMRI. Early applications, such as mapping of cortical columns and layers in V1, capitalized on the increased sensitivity and specificity of the higher (7T) magnetic field to achieve ultra-high spatial resolution while covering a small part of the brain. However, demand for full brain coverage along with high resolution for other applications drove development of what is known today as slice accelerated or simultaneous multi-slice (SMS), and what UMinn introduced as multiband (MB), for fMRI applications (Moeller et al. 2010). Often technical or engineering developments introduced first for high-field MRI are relatively straightforward to implement when transferred to lower magnetic fields and also provide significant benefits. For SMS, this was indeed the case. One issue considered was whether to combine 3T SMS with in-plane acceleration, which is required at 7T to achieve a short enough TE appropriate to the shorter T2*s, which would otherwise result in increases in geometric distortions, signal dropout, and blurring. Notably, the 3T HCP acquisitions benefited from the choice of Left/Right phase encoding direction, which reduced the TE by reducing the total readout length compared to the more conventional Anterior/Posterior phase encoding directions (due to smaller required spatial coverage). The use of Left/Right phase encoding for echo-planar imaging (EPI) on the customized ‘Connectom’ scanner was possible because Siemens configured it as a “head” only system, giving it more flexibility in allowable echo spacings compared to a whole body system like the Prisma (for which certain echo spacings are locked out or limited by the peripheral nerve stimulation [PNS] monitor when using Left/Right phase encoding, such that no practical benefit is obtained relative to Anterior/Posterior phase encoding). Also, the HCP acquisition protocol was one of the first protocols to implement full acquisitions in the opposite phase encoding directions, rather than just acquiring a few volumes in the reverse direction. Such an approach reduced the overall signal dropout (in the aggregate, across scans) compared to acquiring only a single phase encode direction. Ultimately, with the proposed EPI readout times and resulting images, the HCP team was satisfied with the performance of the distortion corrections and the level of signal dropout without using in-plane acceleration.
The introduction of controlled aliasing for slice accelerated EPI (Setsompop et al. 2012) permitted even higher slice accelerations. Implementing these with a commercially available 32-channel coil immediately reduced the volume acquisition time several-fold for whole brain EPI acquisitions at 3T. Importantly, these reductions in TR provided improved power for statistical modeling compared to conventional EPI (Feinberg et al. 2010), because SMS does not inherently incur a penalty in per-image SNR, as would conventional undersampling based accelerations, though it is sensitive to 'leakage artifacts' if the MB factor is pushed too high (Ugurbil et al. 2013). The net result was that high quality fMRI scans at 2–2.5mm (vs. 3–4mm) spatial resolution and TR of 1 second or less (vs. 2–4 s) became feasible.
We also attempted to accelerate beyond what was feasible with multiband EPI alone by combining it with the SIR (Simultaneous Image Refocused) approach (Feinberg et al. 2002). We referred to this as Multiplexed-EPI (M-EPI) (Feinberg et al. 2010). In this approach, a single echo train can sample simultaneously excited and temporally shifted slices. The end result is a combined total slice acceleration much higher than either technique can achieve alone. While we demonstrated the feasibility and some advantages of this technique for rfMRI and dMRI, it does necessitate in-plane acceleration due to the much longer readout trains needed to sample the temporally shifted slices. Since the HCP was interested in higher spatial resolutions, which impose even longer readout trains, the technique was not well suited for the HCP’s goals and was not adopted in the final protocol.
After extensive piloting, using varying amounts of slice acceleration to explore a range of spatial and temporal resolutions, the HCP consortium converged on a 2mm whole brain isotropic resolution with a TR of 0.72 seconds and a slice acceleration factor of 8. At the time, such a protocol was widely considered to be risky, but many within the consortium felt this was a golden opportunity to dramatically advance the field and collect the maximum amount of data per minute of subject scan time. In order to gain acceptance and eventual widespread community adoption of collecting high spatial and temporal resolution fMRI, the HCP needed to demonstrate a robust implementation on a commercial scanner with reliable image quality across hundreds of subjects. It also required that the pulse sequence and image reconstruction technology be disseminated not just from UMinn to WashU, but also to other investigators seeking to replicate the HCP methods. Accordingly, UMinn investigators provided the neuroimaging community access to the sequence and reconstruction software in use by the HCP, even in the early days of the project. The interest in emulating HCP methods, the ease of availability and installation of the software, and the corresponding robust images produced by the protocols, drove (and is still driving) the demand and growth of the use of the HCP-style protocol.
Some HCP-style projects (see Section 12.2) have elected to scan with a slightly coarser fMRI spatial resolution, such as the 2.4mm isotropic voxels used in the ABCD Study (Casey et al. 2018) vs. 2.0mm for HCP-YA. This can enhance SNR/CNR in subcortical and other deep brain regions while maintaining voxel size less than mean cortical thickness (Glasser et al. 2016b). Other projects have adopted alternative fMRI pulse sequences such as multi-echo scans that claim advantages in denoising and artifact reduction (Lynch et al. 2020). Thus, while different groups have chosen to optimize their protocols in different ways for their respective projects, the core strategy of acquiring highly accelerated and high spatial and temporal resolution fMRI data is emerging as the norm for fMRI applications around the world. The UMinn pulse sequence software package (https://www.cmrr.umn.edu/multiband) and a corresponding HCP-style fMRI protocol are in use today by over 400 sites, more than 10 years after the start of the HCP. This is a testament to the UMinn team, which has streamlined the dissemination of their pulse sequence and reconstruction code as much as feasible. To make the code even more accessible, Siemens has implemented an online pulse sequence exchange site that does not require a separate license for each pulse sequence. In the meantime, the 3 major vendors have introduced product implementations of SMS and marketed their systems around compatibility with HCP-style protocols. However, these vendor implementations are not identical, do not provide all of the options available with the UMinn pulse sequences, and are difficult to compare across implementations due to, for example, differences in SMS image reconstruction algorithms.
5.2. fMRI Preprocessing – Spatial aspects.
The “luxury” of collecting imaging sessions of greater length than is typically feasible, coupled with significant HCP improvements in fMRI acquisition, enabled multiple downstream advances in fMRI analysis, including rfMRI analysis. Accurate cross-modal alignment between fMRI and structural images by correcting for distortions in the EPI data, such as those arising from B0 inhomogeneity and gradient nonlinearity (Smith et al. 2013) and using boundary based registration (Greve and Fischl 2009), were critical to ensure that fMRI data were accurately mapped to cortical surfaces. With these changes, marked improvements were immediately apparent in terms of higher spatial ICA dimensionalities when estimated automatically from the data (Beckmann and Smith 2004) and in run-to-run reproducibility of spatial ICA decompositions. These findings were made possible by the increased numbers of timepoints permitted by high temporal resolution acquisitions and the increased scan lengths (4 × 14.4-minute runs) that improve the stability of connectivity estimates. Having a large number of both signal and artifact ICA components from each 14-minute rfMRI run facilitated development of a highly robust automated machine learning classifier that identified artifact vs. non-artifact components and enabled structured artifact removal. High spatial and temporal resolution HCP data were well cleaned with this approach, with accuracies in component classification greater than 99% and a major improvement in effective contrast-to-noise (Salimi-Khorshidi et al. 2014). The large number of timepoints permitted moving beyond applying only spatial ICA, to also applying temporal ICA (Smith et al. 2012) which enables generation of temporally orthogonal decompositions that work well on HCP data (see Section 5.3).
The large number of HCP subjects (~1000 with complete fMRI datasets vs. 12 to 30 subjects in a typical study) posed challenges for group analyses. For example, while it had previously been feasible to temporally concatenate across small groups of subjects prior to performing group ICA for functional connectivity, the storage and RAM requirements of such concatenation quickly became untenable in the setting of HCP-style data, even with the more compact representation afforded by the use of CIFTI grayordinates. The “MIGP” (MELODIC’s Incremental Group PCA) algorithm was developed to answer this challenge, enabling large groups of subjects’ fMRI data to be efficiently collapsed into a PCA series of spatial maps, upon which subsequent analyses were based (Smith et al. 2014). With such data, group spatial ICA was readily performed at a variety of dimensionalities and subject-wise connectomes generated using the ‘FSLNets’ tool.
5.3. fMRI Preprocessing – Global signal regression and temporal ICA.
Among the many methodological issues debated within the HCP consortium over the years, a particularly challenging one was the question of how to handle the so-called “global signal” (Power et al. 2017; Glasser et al. 2016b) – i.e., the spatially non-specific timeseries averaged across all of the gray matter (or even all of the brain). The global signal was initially thought to mainly reflect noise arising from motion, but subsequently was more convincingly linked to some combination of respiratory effects and globally-averaged neural activity (Glasser et al. 2018; Power et al. 2018; Power et al. 2015; Power et al. 2014). Early in the project, some consortium members questioned the appropriateness of simple removal (subtracting or regressing out) of such ‘noise’, particularly those who favored multivariate approaches to rfMRI analysis. Others who preferred univariate approaches (e.g., seed-correlation rfMRI maps, and parcellated connectivity using full correlation) favored “global signal regression” to remove the mean timecourse from rfMRI data, especially because respiratory noise may differ across age ranges or clinical populations and lead to elevated correlations induced by respiratory effects in univariate analyses (“everything correlated with everything”).
As is often the case in such scientific debates, both sides were partly right. Progress was facilitated by focusing on critical data rather than just the rhetorical arguments. Those using multivariate analyses were arguably addressing the problem already, insofar as such approaches including spatial ICA and functional connectivity based on partial correlation, implicitly achieve the goal of global signal regression. On the other hand, those using univariate approaches had identified a real problem in fMRI data that if left unaddressed would cause biases in univariate rfMRI analyses and even task analyses (Glasser et al. 2018). A sticking point was that both groups lacked an approach that selectively removed global respiratory noise while retaining global and semi-global neural signal. Spatial ICA is mathematically incapable of removing global respiratory noise due to its spatial orthogonality constraint (i.e., global effects do not manifest as a spatial ICA component), whereas global signal regression induces spurious anti-correlations in resting-state functional connectivity (rsFC) and can shift connectivity gradients (Glasser et al. 2018). The HCP approach to this conundrum started with the observation in the initial temporal ICA paper (Smith et al. 2012) that temporal ICA produces global (spatial) components. When this approach was applied to HCP data (concatenated temporally across subjects), clear global respiratory components were identified, separated from global/semi-global neural components at the group level, and subsequently regressed out of the data as part of a “temporal ICA cleanup” (Glasser et al. 2018). Importantly, validation of this approach relied on the use of HCP’s task fMRI data to demonstrate that temporal ICA cleanup did not remove neural signal, as indexed by task activation maps. This approach enables removal of non-neural global temporal components from the data, but a large number of timepoints (subjects x scan-duration/TR) are needed to achieve robust temporal ICA performance, and manual classification of components is required until an automated classifier becomes available. It will be important for the rest of the field to gain experience and comfort with the temporal ICA cleanup approach, once it is widely available, and help identify any undiscovered limitations.
Thanks to the combination of advances in structured noise removal, long scan sessions, and high spatial and temporal resolution, the HCP rfMRI datasets have enabled many novel or important applications for rsFC, including “fingerprinting” and prediction of behavioral data (Finn et al. 2015; Greene et al. 2018; Liegeois et al. 2019; Dubois et al. 2018; Li et al. 2019). An easily overlooked advance is that the great increase in the effective temporal degrees-of-freedom allows for a significant gain in the statistical power for multivariate modelling (much more so than for simpler univariate models); these benefits extend even to basic advances like moving from full correlation network models to the more interpretable partial correlation modelling (Pervaiz et al. 2020).
5.4. Task fMRI.
After a healthy debate among proponents for each modality, it was established early in the planning process that rfMRI, tfMRI, and dMRI would each be allotted comparable amounts of scanner time. (In the end, it was ~58 min of rfMRI, ~49 min of tfMRI, and ~59 min of dMRI). For tfMRI, much effort went into choosing specific tasks and paradigms and allocating time to each task. Since the customized ‘Connectom’ scanner was sited at UMinn during Phase 1 (see Section 2.4), task piloting occurred at WashU on a Siemens 3T Trio scanner. Details and results from this piloting, including alternative tasks that were explored and justifications for the final selections, are in the Supplement of Barch et al. (2013).
Here, we focus on the inherent tension between breadth vs. depth as regards the tfMRI protocol. The HCP-YA is distinctive in the breadth of its task fMRI, as it spans 7 functional domains. Six domains pertained to higher-order constructs of cognition, language, and emotion; the seventh involved a lower-level sensorimotor task that proved vital for validating our parcellation technique in regions where strong knowledge of functional boundaries exists (Glasser et al. 2016a). Another notable point is that the Working Memory task was designed to assess multiple constructs without increasing imaging time. Specifically, task blocks used four separate categories of stimuli (faces, places, tools, and body parts, as separate ‘blocks’), as an efficient way to explore category-specific activations. Additionally, this task included an out-of-scanner Recognition Memory task, which opens the prospect of making inferences about activation related to episodic memory at the time of encoding. The ABCD Study followed this approach in the design of its working memory task, albeit with places and emotional faces as the stimuli, so that its working memory task can also be used to assess emotional processing (Casey et al. 2018).
The breadth of the tfMRI protocol provides many “hooks” for investigators having diverse domain interests to engage with the HCP-YA data. It also has allowed important questions to be asked regarding commonalities across task domains (Assem et al. 2020), the ability to predict differences in task activity from rfMRI data (Tavor et al. 2016), the similarities of functional connectivity computed from rfMRI and tfMRI data (Cole et al. 2014), and the reliability of task fMRI broadly.
For the task activation paradigms, we chose 'blocked' task designs, which are efficient in providing strong task contrast in a short acquisition time. However, this limits the ability to investigate some 'event-related' questions, such as differences between correct and incorrect trials. Time constraints also led to other design choices, such as excluding ‘fixation’ blocks in the Emotion and Language tasks, where the main focus for those tasks was the contrast between two task conditions (Emotion: FACES-SHAPES; Language: STORY-MATH). Unfortunately, the contrasts of individual task conditions versus 'baseline' are difficult to interpret without fixation blocks, yet may still contain neurobiologically useful information (Glasser et al. 2016a).
Shorter scan durations allowed for greater breadth in acquired task data, but increased the influence of random measurement error, potentially affecting reliability of individual difference effects (at the group level this is countered by the large number of subjects scanned). Furthermore, while differential contrasts (e.g., Condition A - Condition B) are typically considered to be a way to obtain more specific measurement of a construct, they may also reduce sensitivity to detect individual differences to the extent that individual differences variance is captured by both conditions being subtracted (Hedge et al. 2018; Infantolino et al. 2018).
The reliability of task fMRI is a broad and topical issue in the field (Elliott et al. 2020; Marek 2020; Frohner et al. 2020; Herting et al. 2018; Bennett and Miller 2010; Chaarani et al. 2021). Several studies have collected lengthy scan data for individual tasks (Poldrack et al. 2015; Laumann et al. 2015; Gordon et al. 2017; Naselaris et al. 2021) but only for a small number of participants. In that regard, the 4.5–10 min of data that HCP collected for each task was quite typical and indeed remains so (Casey et al. 2018). It will be interesting to follow how the field balances breadth vs. depth (i.e., several different tasks versus longer sampling of the same task) of task fMRI data and the distinction between detecting activation shared across individuals versus differences between individuals, especially in light of the increasing focus on “precision functional mapping” and predictive modeling in individuals.
Within the consortium, another methodological debate arose over how best to process the HCP’s task fMRI data. On the one hand, rapid progress was being made, particularly with rfMRI, on adapting analysis methods such as ICA and functional connectivity to the combined surface and volume-based standard space of the newly introduced CIFTI grayordinates. However, at the outset, consortium members had limited experience with surface-based task fMRI analysis, and a concern arose as to how to handle multiple comparison corrections given the field’s previous reliance on cluster-based thresholding dependent on Gaussian random field theory. Close collaboration between WashU and Oxford enabled generation of a CIFTI-compliant task analysis pipeline that maintained putative statistical validity up to the stage of producing spatially uncorrected statistics (Barch et al. 2013). However, for early HCP data releases no method was available for applying multiple comparison corrections to CIFTI (combined surface-volume) data. Hence, the HCP initially released two versions of task fMRI data, one processed using the HCP’s grayordinates task analysis pipeline and another generated using a traditional pipeline that used cross-subject volume-based alignment and varying levels of smoothing (despite the aforementioned objections to volume registration and spatial smoothing). Fortunately, subsequent development of PALM software enabled more sensitive multiple comparison corrections using threshold-free cluster enhancement and permutation testing within CIFTI grayordinates standard space (Winkler et al. 2014). Also, it was reported that many previous traditional analyses of the extent of spatial activation likely had inflated false positive rates because the spatial autocorrelation of functional activity is non-Gaussian (Eklund et al. 2016), likely due to the complex neuroanatomy of cortical convolutions. Moreover, later work conclusively demonstrated the severe penalties in spatial localization inherent in traditional volume-based alignment and spatial smoothing (Coalson et al. 2018). Consequently, later HCP data releases omitted data generated with volume-based fMRI processing.
5.5. 7T fMRI.
The HCP acquired three types of 7T fMRI data for the 184 subjects scanned at UMinn, including ~1 h of rfMRI plus two tfMRI tasks very different from any of the 3T tfMRI tasks: ~1 h with concatenated clips from Hollywood movies as visual stimuli, and 30 min of retinotopic visual stimuli. All 7T scans were acquired at higher spatial resolution (1.6mm isotropic voxels) than the 2mm used for 3T fMRI scans. By using a multiband factor of 5 in combination with an in-plane acceleration factor (iPAT) of 2, the TR was kept low (1 s), which was beneficial for spatial and temporal ICA-based denoising. A major advantage of the 7T scans is that CNR is generally higher than for 3T, particularly in deep (subcortical and cerebellar) regions (Vu et al. 2018). Preprocessing of the 7T data also included accurate intersubject alignment using areal features (see Section 9.1).
We did not acquire structural MRI scans at 7T, as it would have been challenging to improve substantially over the 0.7mm isotropic high resolution T1w and T2w scans already collected at 3T. Also there were benefits to using a single version of surfaces and volumes when comparing 3T and 7T functional and diffusion data. We instead resampled the 3T structural data to a 1.6mm resolution and 59k surface mesh (as opposed 2mm and 32k surface mesh) to provide an option to work with the 7T functional data at a higher spatial resolution and made it available as separate “Structural Preprocessed for 7T” packages within ConnectomeDB. The preprocessed fMRI packages are available in both 2.0mm/32k and 1.6mm/59k CIFTI versions. It has yet to be determined, however, whether there are substantial benefits to analyzing the higher-resolution 1.6mm/59k fMRI CIFTI data vs. the downsampled 2.0mm/32k version.
Having both rfMRI and movie-tfMRI 7T scans in a large number of HCP subjects has set the stage for a variety of interesting analyses that are only recently being explored. For example, connectome predictive modeling indicates that functional connectivity during movie watching outperforms rsFC in predicting trait-like behavioral measures in both cognitive and emotion domains (Finn and Bandettini 2021).
The retinotopic 7T data have been processed by a model-based approach that generated both group average and high-quality individual-subject retinotopic maps (Benson et al. 2018). The maps are freely accessible (https://osf.io/bw9ec/ and https://balsa.wustl.edu/study/9Zkk), can be compared to other published parcellations of human visual cortex (Glasser et al. 2016a; Wang et al. 2015), and have already proven useful for identifying strikingly atypical retinotopic maps in early extrastriate visual areas (specifically dorsal V2 and V3) in a small number of subjects (Van Essen and Glasser 2018, https://balsa.wustl.edu/ZLV7).
6. Diffusion Imaging
6.1. Acquisition of dMRI data.
The HCP introduced many advances in dMRI acquisition, image reconstruction, preprocessing and analysis, and the publicly-released HCP dMRI data have been used in numerous applications as exemplar cutting-edge datasets for tractography. Prior to the HCP, conventional diffusion MRI scans obtained on a standard 3T scanner (e.g., Siemens Trio) typically had a spatial resolution of 2–2.5mm isotropic and consisted of 30–60 diffusion directions with a maximum b-value of ~1500 s/mm2 or less. The HCP pioneered high slice accelerations and unprecedented spatial-temporal resolutions across the whole brain. We took advantage of the increased maximum gradient strength of the 3T Connectom scanner (100 mT/m vs. 40 mT/m, see Section 3.1), the incorporation of multiband/SMS pulse sequences, and novel preprocessing methods for distortion and motion correction to markedly improve spatial resolution (1.25mm isotropic) and angular sampling (~90 unique directions in each of 3 shells) while maintaining relatively high diffusion contrast weighting (b = 1000, 2000, and 3000 s/mm2). For 7T, spatial resolution was 1.05mm isotropic, and angular sampling was ~65 directions in each of 2 shells (b = 1000 and 2000 s/mm2). Optimization focused on maximizing the fidelity of fiber orientation modeling and tractography (high angular resolution for accuracy, multiple b-values for better partial volume estimation), while keeping spatial resolution as high as possible. The robustness of these high-resolution protocols, applied to hundreds of individuals, was demonstrated for both 3T (Sotiropoulos et al. 2013; Ugurbil et al. 2013) and 7T (Vu et al. 2015).
Advances in slice (multiband) acceleration (Moeller et al. 2010; Ugurbil et al. 2013) dramatically decreased the scan time per dMRI volume, enabling higher spatial and angular resolution with minimal noise amplification penalties (Xu et al. 2013). Much effort was put into optimizing multiband image reconstruction, including evaluation of signal leakage (Xu et al. 2013). Additionally, because of the need for multi-channel coil signal combination and the noise properties (low SNR) of the dMRI data, the HCP team used sensitivity-based channel combinations for dMRI image reconstruction, which minimized the noise floor and its effects on fiber orientation estimation (Sotiropoulos et al. 2013) and avoided rectification of the dMRI signal at low SNR (high b-value and/or high spatial resolution) regimes (Jones and Basser 2004). We also determined that gradient non-linearities significantly impacted the amplitude and orientation of diffusion-sensitizing gradients (cf Bammer et al. 2003) due to the bore size and the custom HCP gradient set (Sotiropoulos et al. 2013). Along with the HCP data, we distribute the necessary information for applying gradient non-linearity correction as part of the subsequent modeling of the diffusion signal.
6.2. dMRI preprocessing.
Preprocessing advances, including spin-echo-fieldmap susceptibility corrections (Andersson et al. 2003) and comprehensive eddy current distortion and motion-correction (Andersson et al. 2018; Andersson et al. 2017; Andersson et al. 2016; Andersson and Sotiropoulos 2016) helped achieve unprecedented dMRI image quality. Development and optimization of preprocessing methods were done in parallel with acquisition optimization, as some HCP acquisition choices that contributed to higher SNR and angular resolution of dMRI acquisitions had corollary effects of making distortions worse. Specifically, increasing SNR entailed reducing the echo time, which in turn meant that a basic Stejskal-Tanner diffusion weighting was preferred over eddy-current nulled (bipolar) acquisition schemes. Also, using SMS slice acceleration to increase angular resolution necessitated a low in-plane parallel imaging factor (no in-plane acceleration for 3T, and reduced in-plane acceleration at 7T), which in turn exacerbated distortions by increasing the sensitivity to the eddy current- and susceptibility-induced off-resonance fields. Last, the overall HCP dMRI acquisition time was long (4 scans, each ~15 minutes), so appreciable subject movement was expected.
The improved pre-processing involved an integrated approach to correct for eddy current- and susceptibility-induced distortions as well as direct and secondary effects of subject movement. The susceptibility-induced off-resonance field was estimated from b=0 s/mm2 images acquired with opposite phase-encoded directions (Andersson et al. 2003). The eddy current-induced fields and subject movement were estimated by aligning each volume to Gaussian Process-based prediction conditional on all other volumes (Andersson and Sotiropoulos 2016). Using the predictions as a target for the registration enables correction of even very high b-value data, which proved difficult with previous approaches. The data was also corrected for movement-induced signal loss by comparing the observed slices to those predicted by the Gaussian process, and replacing them by the latter if they met the criteria for an outlier (Andersson et al. 2016). More recent methods development, such as estimating and correcting for intra-volume movement (Andersson et al. 2017) and for movement-induced changes in susceptibility-induced distortions (Andersson et al. 2018) were not available in time for the final (“S1200”) HCP-YA release but will be applied to the Lifespan HCP-A and HCP-D data releases. These distortion correction methods are widely used by the community, and have also been used for piloting and preprocessing the MGH HCP ultra-high b-value acquisitions (Setsompop et al. 2013), and for scanning very challenging populations, such as neonates (Bastiani et al. 2019a; Fitzgibbon et al. 2020).
Increased spatial and angular resolution in HCP dMRI data (while preserving high SNR) results in higher specificity when reconstructing white matter bundles (Sotiropoulos et al. 2013) and reduced partial volume close to tissue boundaries, allowing more orientation information to be extracted in or near the cortical ribbon (Sotiropoulos et al. 2016; Sotiropoulos et al. 2013; Fan et al. 2017; De Luca et al. 2020), as also shown in earlier ex-vivo studies (McNab et al. 2009; Miller et al. 2012). This in turn has spurred efforts to improve analysis methods, including multi-tissue spherical deconvolution (Jeurissen et al. 2014), within-voxel multiple fiber orientation distributions (De Luca et al. 2020), superficial white matter tracking (Sotiropoulos and Zalesky 2019), modeling within gyral blades (Cottaar et al. 2021) and surface-based tractography (Hernandez-Fernandez et al. 2019).
The HCP dMRI data allows whole-brain structural connectomes to be estimated at a higher (“dense”) resolution than before, demonstrating potential for extracting high-resolution connectivity patterns (even in a data-driven manner) (O'Muircheartaigh and Jbabdi 2018; Thompson et al. 2020), but also highlighting deficiencies of conventional streamline tractography paradigms, particularly in accurately estimating termination points of white matter connections on a dense white/gray-matter boundary sheet. The so-called “gyral bias” reflects a strong tendency of tractography streamlines to preferentially avoid sulcal fundi and walls and instead terminate on gyral crowns (Van Essen 2014; Reveley et al. 2015; Sotiropoulos and Zalesky 2019; Schilling et al. 2018; Donahue et al. 2016). The observed bias far exceeds that predicted from simple models of cortical folding (Van Essen 2014) and likely contributes to the mismatch between connection weights predicted by tractography vs. anatomical tracers (Donahue et al. 2016). A preference to focus first on these methodological challenges was a major reason why the HCP consortium placed less emphasis to date on systematic analyses of structural connectivity in the full HCP dataset (see also Section 12.5).
Several approaches have been devised for addressing the gyral bias. Higher spatial resolution (e.g., in the 7T dMRI data) has been shown to be beneficial for mitigating gyral bias effects (Sotiropoulos et al. 2016). Data fusion approaches have integrated complementary information from high-spatial/low-angular and low-spatial/high-angular resolution data (Sotiropoulos et al. 2016; Fan et al. 2017), as more appropriate for superficial and deep white matter modelling, respectively. Approaches that combine guided superficial white matter tracking with conventional deep white matter tractography (Cottaar et al. 2021; St-Onge et al. 2018) reduce the gyral bias. Asymmetric fiber orientation distributions that better model within-voxel fanning and bending (Bastiani et al. 2017) have been also utilized with a similar aim (Wu et al. 2020).
6.3. Contributions from MGH and WU-Minn-Ox Connectom scanners.
The WU-Minn-Ox and MGH Connectom scanners have together not only helped push the envelope in improving dMRI data acquisition and preprocessing, but they have provided the community with multiple datasets of unprecedented quality. The HCP dMRI data, with complete diffusion data in 973 subjects in the S1200 data release, have served as a valuable reference dataset for many subsequent studies. This includes high-quality tractography atlases (Warrington et al. 2020), substrates for tractography competitions (http://www.tractometer.org, Maier-Hein et al. 2017, Schilling et al. 2020) whole-brain models of functional dynamics (Demirtas et al. 2019), analyses of image-quality transfer (Alexander et al. 2017; Tanno et al. 2021), and using white matter tracts to compare ‘connectivity blueprints’ in humans and non-human primates (Mars et al. 2018). Altogether, the HCP helped set new standards for dMRI acquisition and analysis and has stimulated new approaches to analyzing brain connectivity.
From the MGH Connectom scanner a high quality dataset from 35 healthy adults scanned at 1.5mm isotropic voxels (b-values 1k, 3k, 5k, 10k) is available on ConnectomeDB [3] and has been widely used. A recent data resource (Wang et al. 2021) is based on a single subject scanned for 18 hours (9 two-hour sessions, with head stabilization) at 0.76mm isotropic resolution, with 420 directions at b=1,000 s/mm2 and 840 directions at b=2,500 s/mm2. Another promising approach will be to compare HCP-style diffusion MRI acquired in macaque monkeys (Autio et al. 2020) to gold standard tracer datasets (Hayashi et al. 2021; Safadi et al. 2018; Yendiki et al 2021).
7. Magnetoencephalography (MEG)
7.1. MEG data acquisition.
Magnetoencephalography (MEG) is highly complementary to fMRI insofar as it provides temporal resolution that is several orders of magnitude higher (ms vs. sec) but much lower spatial resolution (cm vs. mm). In designing data acquisition paradigms for MEG, the HCP consortium aimed to emulate the resting-state and task paradigms as closely as possible to those used for fMRI, even though they were acquired on different days and used hardware that imposed different constraints. A block design was chosen for MEG task activation paradigms, just as for tfMRI, in order to let the participants have the same ‘cognitive experience’, and thus to have better matched brain activity across the recording modalities. Moreover, task timings for the motor and working memory tasks were approximately matched between MEG and tfMRI, in spite of the fact that the MEG signal quality might have benefitted from a higher stimulus presentation rate, and more repetitions per condition.
High quality MEG datasets were acquired using standard experimental protocols and a MAGNES 3600 MEG scanner housed at St. Louis University. A total of 95 subjects were successfully scanned, including 45 MZ twin pairs, nearly all with complete multimodal 3T imaging and 41 with 7T data collected as well. For the MEG community, these data represent a unique open-access, high quality and well-curated dataset, with open-access processing pipelines provided in an open-source, well-utilized and well-maintained analysis suite (Oostenveld et al. 2011, https://github.com/fieldtrip/fieldtrip).
7.2. MEG data analysis.
The HCP team provided two significant innovations in data analysis: a set of semi-automated artifact reduction algorithms for which source code was made freely accessible, and a file organization that included version tracking and a clearly defined set of information (provenance) in each level. This file system presaged the development of an extension to the Brain Imaging Data Structure (BIDS) that has recently been published for MEG (Niso et al. 2018).
The HCP MEG datasets have proven valuable in a number of studies to date. These include a demonstration of heritability of MEG alpha- and beta-band power (Colclough et al. 2017), and a demonstration of dorso-ventral cross-frequency coupling during working memory (Popov et al. 2018). There are also some impediments to more widespread utilization. The HCP MEG anatomical pipeline output differs from that expected by many MEG researchers using other software tools (Gramfort et al. 2013; Tadel et al. 2011), particularly when mapping data from sensor space into source space. Because the ‘defaced’ high resolution HCP T1w structural MRI may lack adequate coverage for head surface-based MEG coregistration, users must rely on the coregistration provided and the HCP-provided head models. This is incompatible with standard MEG analysis pipelines that start from non-defaced and full head coverage anatomical MRIs. The HCP decision to share only defaced (de-identified) data was arguably forward-thinking from an ethics and privacy perspective (Prior et al. 2009; Milchenko and Marcus 2013; Schwarz et al. 2021) and may likely apply to future MEG-related databases. Algorithms and approaches for the use of coregistered defaced MRI images for electrophysiological source reconstruction need to be added to currently available software packages. Another challenge is that software for MEG/EEG source visualization in relation to multimodal MRI is currently limited. Efforts are underway to address these limitations by refinements in Connectome Workbench software (see Section 10.6).
Some HCP users have used raw and minimally processed MEG data to develop their own algorithms and pipelines relevant to their specific research programs (Galinsky et al. 2018; Niso et al. 2019). The freely shared HCP analysis algorithms developed for preprocessing and artifact reduction have many useful features but would benefit from more detailed methods descriptions. The HCP MEG team also implemented innovations in post-processing and connectivity analysis. The HCP decision to match the MEG tasks and task parameters as closely as possible to their tfMRI counterparts and to focus on whole brain connectomic analyses resulted in the task MEG data being suboptimal for some conventional MEG analyses. An area of high potential for future MEG analyses is to combine data across modalities, e.g., combining MEG with fMRI (Colclough et al. 2017) or with tractography.
8. Non-imaging data acquisition
8.1. Behavioral assessments.
Although the primary goal of the HCP-YA was to characterize normative patterns of structural and functional connectivity of the adult human brain, such information is of interest in large part because of how it helps us understand variation in human behavior. Three principles guided our choice of behavioral assessments in the HCP-YA: (i) cover as many domains as possible so that the dataset could be broadly useful for investigators with varying interests and goals; (ii) be considerate of participant burden; and (iii) where possible, use assessment measures with known reliability and validity (Barch et al. 2013). As mandated by NIH, the core of our behavioral assessment was the NIH Toolbox for Assessment of Neurological and Behavioral function (http://www.nihtoolbox.org), which was developed to create a comprehensive battery of assessment tools for large scale projects such as HCP (Gershon et al. 2010; Gershon et al. 2013; Heaton et al. 2014; Weintraub et al. 2013; Reuben et al. 2013). In its original “beta” form, the NIH Toolbox included measures of cognitive function (task-based measures), emotion (self-report), motor (grip strength, walking) and sensory processes (smell, taste, hearing, and vision). Based on input from our External Advisory Board and internal discussions, we broadened our behavioral assessments to assess additional dimensions likely to be of broad interest and relevance to the field: (i) dimensions of mood, anxiety, and substance abuse; (ii) additional measures of visual, memory and emotion processing; (iii) personality (e.g., the “big five” dimensions); (iv) delay discounting to assess decision-making and self-control (Shamosh et al. 2008; Dalley et al. 2008); (v) fluid intelligence using a variation on matrix reasoning – a measure of higher-order relational reasoning (Bilker et al. 2012); (vi) menstrual cycle and hormonal function for women; and (vii) sleep function using the Pittsburgh Sleep Quality Index (Buysse et al. 1989).
The benefits of including assessments of a wide range of behaviors have become increasingly apparent in relation to the diverse ways that the scientific community has explored and utilized the HCP behavioral data. Many investigators have examined a wide range of brain structure and function characteristics in relationship to the broad HCP battery, both across behavioral domains broadly (Smith et al. 2015) and within specific domains, ranging from cognition (Moser et al. 2018), emotion (Michalski et al. 2017), mental health (Lancaster 2018), substance use (Karcher et al. 2019), personality (Dubois et al. 2018), and sleep (Curtis et al. 2016). Thus, for large scale studies designed for public dissemination it is advisable to think broadly about the assessment battery, and to seek diverse input as to what types of domains are likely to be of interest and value to the broader scientific community beyond the expertise and immediate interests of those involved in setting up the data collection.
It was also important to include measures that span the range of “typical” and “atypical” variation. While the HCP-YA was designed to assess normative brain structure and function, there is still much variation even among typically developed healthy adult populations, making it important to capture that diversity. For example, the NIH Toolbox was designed to capture a wide range of performance levels, including potentially clinically relevant impairments, ensuring sufficient variation to relate to brain structure and function. Further, we included both clinical measures of mental health such as the Semi-Structured Assessment for the Genetics of Alcoholism (SSAGA) that allowed us to identify individuals meeting diagnostic criteria for mental health and substance use disorders, as well as instruments that captured typical variation in depression, anxiety and stress that did not cross clinical thresholds. Some investigators using HCP-YA data have focused on typical variation, whereas others have focused more on behavioral extremes. The availability of assessments that span this diversity benefited both types of research.
8.2. Genotyping.
An important part of the HCP was the collection of genetic material to supplement and enhance the analysis and interpretation of the acquired imaging data. For example, for heritability analyses it would be particularly important to confirm or correct self-reported family relationships. Either whole blood or saliva was collected from each family participant. These samples were shipped to the NIMH Repository and Genomics Resource (NRGR; https://www.nimhgenetics.org), a collaborative venture between the National Institute of Mental Health and several academic institutions, including Rutgers University. NRGR conducted HCP’s biosample processing, storage, and distribution.
The HCP originally proposed to carry out genotyping, but had hoped that the cost of full-genome sequencing would continue to plummet. This did not transpire, but by 2015, excellent single-nucleotide polymorphism (SNP) genotyping options were available. Aliquots of each available DNA sample were sent to the Genome Technology Access Center (GTAC) at Washington University, where they were applied to a custom Illumina microarray chip consisting of the Illumina MEGA Chip (which has an enhanced number of multiethnic SNPs), immune-related SNPs from the Illumina ImmunoArray, and psychiatric-related SNPs from the Illumina PsychArray. Samples were also processed on a second Illumina Neuro Consortium chip, covering SNPs particularly relevant to neuroimaging studies, for a total of over 2 million SNPs. We were able to collect usable genetic data on 1142 of our 1206 participants, including 149 pairs of genetically-confirmed monozygotic twins (298 participants) and 94 pairs of genetically-confirmed dizygotic twins (188 participants). Overall, there are 457 different families in the study, as determined by genetic analysis. HCP’s SNP data is available through dbGaP [4].
Examples of studies that have used HCP genotyping data include using SNPs combined with dMRI to find evidence for genetic influences on hub connectivity (Arnatkevičiūtė et al. 2021); using SNPs combined with rsfMRI and tfMRI to show that higher schizophrenia polygenic risk scores are significantly correlated with lower functional connectivity in a large-scale brain network (Cao et al. 2020); showing associations between basal ganglia volumes (putamen and pallidum) and rare AD-risk variant SNPs (Lancaster 2019); and using SNPs and rfMRI to find evidence for a genetic correlation between chronic pain and sleep disturbance that may be mediated by shared functional connectivity (Sun et al. 2020).
To date, 65 investigators have requested HCP-YA genotyping data from dbGaP, which is only ~0.3% of the ~18,000 who have downloaded imaging data (see Section 11.1). This likely reflects in part the practical impediments to accessing dbGaP datasets but also the fact that 1142 subjects is on the low side for identifying strong genetic candidates in GWAS studies. In the original HCP grant proposal we had estimated a total sample size of 1200 individuals (300 sibships) yields 80% power to detect a genetic variant accounting for 1% of the variance (Sham et al. 2000; Purcell et al. 2003).
8.3. Open Access and Restricted Access data types.
The decision to focus HCP recruitment on twins and their non-twin siblings provided an exciting opportunity to study the heritability of brain connectivity. However, it also posed challenges in balancing the protection of research participants’ privacy while fulfilling our charge to share the data broadly and openly. The informed consent document signed by HCP-YA participants, explicitly stated that we would broadly share their data, including over the internet (i.e., through ConnectomeDB). Further, the consent stated: “The data we share... with other scientists or the general public will not have your name on it, only a code number, so people will not know your name or which data are yours... [and] will not include data that we think might help people who know you guess which data are yours.” Since HCP-YA specifically recruited approximately 400 families of twins born in Missouri, a concern was whether combined demographic information might uniquely identify a family, e.g., monozygotic, female, Latina twins aged 28 years [5]. Even individual data not considered protected health information (PHI) (e.g., handedness) could increase the likelihood of such family identification, especially in the early data releases when numbers of subjects were small [6]. We were particularly concerned that some participants might recognize themselves and their family members by virtue of knowing some unique familial information. It would be a breach to an individual’s privacy if their data were identifiable to their siblings.
To manage privacy concerns while still providing broad access, we divided HCP-YA data into two tiers: Open Access Data and Restricted Access Data. The former comprises defaced structural images, other imaging data, and most types of behavioral data. Anyone can access this data by registering on ConnectomeDB and agreeing to a limited set of legally-required data use terms. These terms do not include a requirement for institutional sign-off (as is required, e.g., by NDA and dbGaP), and allow for re-sharing of the Open Access Data with approval of the sharing investigator’s IRB or Ethics Board. Restricted Access Data includes family structure information, most types of demographic data, health and mental health measures, and substance use. Investigators requesting access to restricted data have their credentials vetted by the HCP PI or a delegate, to ensure that they are bona fide researchers. Approved users may not share that data except to others who have also been approved for Restricted Access and must agree to restrictions on what data from individual participants can be published, to avoid possible participant identification. The full text of HCP’s Open Access and Restricted Access Data Use Terms are available online [7].
Over 11,400 users have registered for Open Access Data, and there are over 2000 approved users of Restricted Data. Thus, HCP’s establishment of different rules for Open vs. Restricted data does not appear to have been a major impediment to widespread use of both data categories. We are aware of only a single instance in which the restrictions on publishing individual data were inadvertently violated; this instance was rapidly addressed by the journal publisher and the PI of the study in question.
The movement to implement Open Data and FAIR (Findable, Accessible, Interoperable, and Reusable) research data management practices in neuroimaging began around 2014 just as HCP was beginning to release data. Since then, these concepts have gained considerable traction with many funding agencies and research institutes including these in their policies. Notwithstanding this trend, human neuroimaging studies continue to balance the tension between maintaining research participants’ privacy and sharing data under these broader policies (Nichols et al. 2017). The HCP’s example of careful planning for data sharing and aligning the informed consent procedure with specific data use terms helped inspire and guide more recent data sharing initiatives (Bannier et al. 2021).
9. Cross-modality innovations
9.1. Cross-subject registration.
In addition to the many within-modality innovations described above, the HCP made major advances in cross-modal integration, including improved cross-subject registration (alignment) and multimodal parcellation. Cross-subject registration has been a long-standing challenge in human neuroimaging because cortical folding varies dramatically across individuals, as does the relationship of areal boundaries to these folds (Van Essen and Glasser 2018). Importantly, traditional volume-based registration (even using high-dimensional nonlinear warping) is incapable of accurately aligning functionally corresponding areas in regions of high folding variability (Coalson et al. 2018). The HCP’s registration implementation uses the Multimodal Surface Matching algorithm (MSM) (Robinson et al. 2018; Robinson et al. 2014) in a two-stage process. In the first stage, cortical surfaces from each individual are initially aligned to an atlas (surface template), gently constrained by folding information only, thereby not overfitting the folding patterns, which are imperfectly correlated with cortical areal locations outside of a few regions like the central sulcus, calcarine sulcus, and insula (Glasser et al. 2016a). In the second stage, termed “areal-feature-based” surface registration or “MSMAll”, registration is constrained by multiple areal features, including the T1w/T2w myelin map information, rsfMRI network information, and visuotopic information derived from a multiple-regression-based analysis of rsfMRI gradients (Glasser et al. 2016a). This markedly improves the cross-subject alignment of cortical areas and consequently reduces the alignment of cortical folds (Coalson et al. 2018; Glasser et al. 2016a). MSMAll achieves sharp group average maps having fine, reproducible details including a lightly myelinated boundary between face and upper extremity sensory cortex (Glasser et al. 2016a; Kuehn et al. 2017) and highly specific functional activation during tasks in small individual cognitive cortical areas such as 55b (Glasser et al. 2016a). Indeed, a key validation of the multimodal registration approach involved showing that task fMRI data, which was not part of calculating the MSMAll registration, showed improved statistics when aligned with multiple other modalities, versus when aligned with folding (Robinson et al. 2018; Robinson et al. 2014). A quantitative analysis indicates that areal-feature-based registration contributes about one quarter of the improvement in spatial localization of HCP-style analyses; another quarter arises from using surface-based registration instead of volume-based registration; the remaining half derives from not smoothing in the volume (Coalson et al. 2018).
9.2. Cortical parcellation.
From the outset, a key HCP goal was to accurately parcellate the brain, particularly cerebral cortex, into areas, or nodes that provide a functionally relevant basis for defining a connectome (Felleman and Van Essen 1991; Sporns et al. 2005). Indeed, this had been an aspiration of several HCP investigators prior to the HCP, but the HCP offered a unique opportunity to generate a new map of human cortical areas based on high quality multimodal MRI data in hundreds of subjects. As reviewed in detail (Van Essen and Glasser 2018), we borrowed heavily from knowledge gained from invasive studies in animals, particularly the mouse and macaque monkey, and from observer independent, semi-automated histological approaches developed by Karl Zilles, Katrin Amunts, and others (Amunts and Zilles 2015) and previously applied to fMRI data (Cohen et al. 2008). Earlier partial human and complete macaque parcellation studies (Van Essen et al. 2012a,b) suggested that human cortex contains between 150 and 200 areas per hemisphere. We used locations of strong change (gradients) in group average multimodal MRI data from hundreds of HCP subjects, which covered the cortical properties of architecture, function, connectivity, and topography, to identify 180 cortical areas in each human cerebral hemisphere (HCP’s multimodal parcellation version 1.0) (Glasser et al. 2016a) using a neuroanatomist-driven semi-automated approach.
All areal boundaries showed differences across the boundary in two or more modalities that were significant after multiple comparisons correction, and the vast majority of these differences were also large in standardized effect size. Relative to existing neuroanatomical literature, 83 areas matched previously reported areas and 97 were new or were subdivisions of existing areas. Notably, the areas show striking bilateral symmetry across the two hemispheres, in contrast to fully automated unimodal parcellations (Gordon et al. 2016; Schaefer et al. 2018). In addition, the same gradient-based approach allowed delineation of within-area heterogeneity such as the 5 well-defined subregions related to major body parts (face, upper limb, etc.) in the somatomotor strip (see https://balsa.wustl.edu/QwnL; https://balsa.wustl.edu/Vj1pq). Finally, a machine learning algorithm (an ‘areal classifier’) was able to learn the multimodal “fingerprint” of each cortical area so that it could be automatically delineated in individual subjects, even when areas were atypical and not aligned by areal-feature-based surface registration (Glasser et al. 2016a). The HCP_MMP1.0 parcellation is assuredly not the final word in human cortical parcellation, as significant refinements will almost certainly be needed to arrive at a ‘gold standard’ or ‘ground truth’ parcellation. However, the numerous other published parcellations based on unimodal approaches are likely to be even farther from ground truth. For example, parcellations based solely on rfMRI typically capture boundaries between some (but not all) somatomotor subregions related to body parts but completely fail to detect boundaries between architectonic early somatosensory and motor areas (see Van Essen and Glasser 2018).
Many investigators have requested a “NIFTI volume-based” version of the HCP multimodal parcellation so that they can use it in conjunction with the traditional volumetric analyses of MRI data, which typically includes processing steps such as volume-based intersubject alignment and spatial smoothing that irrevocably degrade data fidelity for reasons noted above. The HCP instead urges investigators to adopt the HCP-style approach to data analysis using surfaces and CIFTI-grayordinates and maximizing data quality at each step (Glasser et al. 2016b; Coalson et al. 2018). Although the use of surfaces and HCP-style methods is growing rapidly, human neuroimaging publications continue to be dominated by traditional volumetric analyses. A major factor is inertia, as many laboratories rely on familiar software tools that are not yet compatible with surface and CIFTI analyses. But using such older tools requires acceptance of preprocessing steps and strategies that are demonstrably and substantially inferior. Together with small sample sizes and publication biases, traditional methods have contributed to a reproducibility crisis in brain imaging (Botvinik-Nezer et al. 2020), where it can be difficult or impossible to know whether two studies have found the same “blobs” or not. In contrast, HCP-style approaches enable very high reproducibility of group average multimodal maps, parcellations (Glasser et al. 2016b), and cognitive neuroscientific results (Assem et al. 2021). Additionally, although low resolution legacy MRI data still benefit from HCP-style analysis approaches, the converse is not true, as traditional approaches do not accrue comparable benefits from importing high resolution HCP-style data (Coalson et al. 2018). It behooves manuscript and grant reviewers, funding agencies, and graduate-level educators as well as neuroimaging investigators to be mindful of these issues going forward.
10. Informatics, software tools, data sharing, and outreach
The overarching responsibilities of the HCP informatics team were to (i) evaluate the quality and ensure the consistency of the imaging and behavioral data to be released; (ii) reliably process the imaging data through preprocessing pipelines developed for each modality; (iii) share the data freely in a user-friendly way to facilitate widespread utilization by the scientific community; and (iv) share tools, pipeline code, and documentation, and provide education so as to enable investigators to apply HCP-style analyses in their own research. Detailed descriptions of how this was achieved are presented elsewhere (Marcus et al. 2013; Hodge et al. 2016; Glasser et al. 2013). Here we provide general observations and comments on key features/aspects that contributed to success on the informatics and data sharing fronts.
10.1. IntraDB and ConnectomeDB.
The core of the HCP informatics infrastructure is the XNAT database platform previously developed for handling structural imaging data (Marcus et al. 2007). However, XNAT required extensive adaptation in order to handle the additional modalities and data types generated by the HCP and support high speed, targeted download of relevant subsets of the vast volume of data released under the HCP. A key initial decision was to establish two independent XNAT-based databases. The first was an internal private database (‘IntraDB’) used to store acquired data (including behavioral data), the initial preprocessing outputs, and outputs from a variety of QC procedures. After passing QC steps, a “session building” process handled the details of merging the data for each participant across multiple (typically four) separate scanning sessions, including flagging situations with more nominally ‘usable’ scans than expected for a given modality, and bundling associated scans together (e.g., field maps with the appropriate fMRI scans). Considerable time and effort went into writing algorithms and rules for this internal process, which is largely hidden from the end user but is fundamental to the easy-to-use nature of the HCP-YA ‘unprocessed’ data packages. Once the HCP pipelines were run on the unprocessed data, outputs were directed into modality-specific release packages, then transferred to ConnectomeDB (https://db.humanconnectome.org), a second XNAT-based system customized for HCP’s data sharing and data mining services. Dataset packaging was designed to maintain the directory structures produced by the HCP Pipelines to allow for users to reduce time, bandwidth and storage requirements by targeting their downloads only to the data most relevant for their analyses.
10.2. Storing k-space data.
As the transition from Phase 1 to Phase 2 approached, decisions needed to be made as to whether ‘raw’ k-space data should be preserved for any or all modalities. The main reason to preserve k-space data was in case later improvements in reconstruction algorithms would allow reprocessing and an eventual overall improvement in the quality of both the unprocessed MRI volume data and the minimally preprocessed data. Reasons for avoiding this option include (i) the complexity of capturing this data in an automated fashion on the Siemens platform; (ii) the impact of saving k-space data on reconstruction performance (a factor early-on); (iii) the large increase in overall data storage requirement, because of the much larger size of k-space data compared to the unprocessed DICOM/NIFTI data; and (iv) the burden on staff and the potential delays in data release by initiating a ‘retro-recon’ process followed by re-running the minimal processing pipelines. After much discussion, the initial decision was to save the k-space data for the dMRI but not the fMRI scans because it seemed more likely that there would be improved reconstructions that would warrant retro-recon for dMRI than fMRI. The k-space data were automatically written to a remote disk in real-time via the pulse sequence. This process did not interfere with scanning and no operator intervention was required. In retrospect, this was a “penny-wise, pound-foolish” decision, in that in the spring of 2013, several months after the commencement of Phase 2 scanning in August 2012, an improved reconstruction algorithm was developed that reduced spatial blurring in fMRI and dMRI acquisitions. This improvement was deemed worthy of upgrading the reconstruction algorithm on the scanner, which occurred in late April 2013. Subsequently, we invested considerable time to retro-recon and reprocess the dMRI acquisitions, such that starting with the ‘S500’ release (November 2014) all the dMRI data was reconstructed in a consistent manner. This was not possible for the fMRI data acquired prior to April 2013 (since its k-space data wasn’t saved).
The impact of the reconstruction change on the fMRI is readily evident as decreased spatial smoothness following the change (~12% decrease), which is detectable in various analyses. For this reason, ConnectomeDB codes this change in the ‘fMRI_3T_ReconVrs’ variable, so that users can readily use the fMRI recon version as a covariate in their analyses, or conduct an analysis using just the fMRI data with the post-April 2013 reconstruction algorithm (‘r227’). We did begin saving the raw k-space data for the fMRI scans in April 2013, but somewhat ironically, following this early change to the reconstruction algorithm, no further reconstruction improvements were achieved that would have warranted another retro-recon of the HCP data. That said, having k-space datasets has proven useful in other contexts, such as ongoing evaluations of newer reconstruction methods (Moeller et al. 2021). In considering this issue for future studies, it is worth noting that the HCP method for saving k-space data worked only with the HCP sequences, and the file format was unconventional, making re-use of these data additionally cumbersome. While saving k-space data indeed proved useful for the HCP dMRI data, current SMS reconstruction methods have been in use for around a decade and by a large number of other investigators and projects. Hence, the risk from not saving raw data has significantly diminished. Nonetheless, certain studies naturally call for saving raw data (e.g., for investigating different reconstruction algorithms), and in this regard it would be helpful if all scanner vendors made it easy and efficient to store raw k-space data in an automated fashion.
10.3. HCP Pipelines.
Earlier sections touch on many of the preprocessing steps and strategies the HCP implemented for each imaging modality (Glasser et al. 2013). Here, we comment briefly on some of the organizational challenges in generating a robust set of pipelines combined with the pressure to incorporate improvements as they became available and were tested, but also maintain consistency in how data for all subjects were processed and distributed. The HCP Pipelines were originally and are still in open, active development on GitHub (see Section 4.2) by a team of modality experts across the WU-Minn-Ox consortium. From the outset, HCP Pipeline development focused on identifying and implementing a series of processing steps that take full advantage of the unprecedented high quality of the data acquired. Pilot data for each modality were processed in multiple ways with different settings, and results compared and discussed as a team before finalizing key analysis steps. These important aspects of the HCP Pipelines development approach have resulted in as yet unmatched quality of analysis outputs and remain unique to the HCP Pipelines. In later years, HCP has devoted efforts to annotation of individual steps/settings within sub pipelines for user understanding and ease of use, something that has been a greater focus of other efforts from the outset (e.g., Esteban et al. 2019; https://fmriprep.org).
The informatics pipelines developers worked closely with the analysis team to accommodate up to date, and sometimes custom versions of essential software tools (e.g., FreeSurfer, FSL, eddy, melodic), generate processing results for vetting changes, and adapt the pipelines where needed. In the early stages of HCP, all processing occurred on a local Sun Grid Engine cluster at WashU. Over time, HCP-style processing was migrated to the WashU supercomputer (Center for High Performance Computing, CHPC) to maximize processing throughput and to take advantage of fits GPU nodes for diffusion processing. CHPC queueing and node configurations were customized and prioritized for HCP Pipeline processing. This additional processing capacity was critical to meeting release deadlines.
10.4. Quality control processes.
The HCP established an extensive set of quality control (QC) processes, particularly for the imaging data. Upon transfer of data from scanners to the internally-facing ‘IntraDB’ database, validation pipelines performed initial checks, utilizing information from acquisition metadata embedded in the DICOM header, to ensure that data was acquired according to protocol.
All participants' structural scans were subject to a standard quality control process that included manual viewing and rating of scan quality and anatomical abnormalities by an experienced rater. Brain anomalies evident in T1w and T2w scans were noted and further reviewed by a neuroradiologist. Participants with major radiologic anomalies likely to substantially impact brain connectivity were removed from the study, and their imaging and behavioral data were not included in the released data. Some subjects had focal anomalies that are considered as normal variants or benign findings. We released their data, but because of their altered anatomy, using data from these subjects may affect some analyses, and they are identified in an HCP Public Wiki page [8]. Since HCP-YA collected two T1w and T2w scans in almost every participant, we generally had the luxury of limiting structural processing to the scans that received at least a ‘good’ rating in a four tiered manual QC rating scale (excellent, good, fair, poor; see Marcus et al. 2013), although ‘fair’ scans were permitted, if necessary to allow participant inclusion. Following FreeSurfer cortical surface reconstruction, a second round of manual QC occurred, which reviewed the white and gray matter surface placement. The T1w/T2w ratio myelin maps are particularly valuable in this process as they provide an easily visualized surface map that usually highlights errors in surface placement. Participants with identified focal surface quality issues from this ‘SurfaceQC’ process are separately flagged with an “issue code” in ConnectomeDB, and snapshots of the error are provided on the HCP Public Wiki so that users can conveniently review the nature and extent of the problem when making decisions about whether or not to include a given participant in their analysis.
Another set of pipelines performed in-depth QC analyses of fMRI data, to determine signal-to-noise ratios, search for motion outliers and compute other measures affecting data quality, and produce graphs and summary images, which were then readily available if questions arose about specific runs. Given the sheer number of fMRI runs, and the challenges in identifying appropriate ‘binary’ thresholds for fMRI quality, HCP-YA rarely excluded fMRI data from release solely due to motion (e.g., only in cases of extremely bad motion). QC outputs for dMRI, built on FSL’s ‘eddy’ tool, were not ready in time for HCP-YA releases, but have been incorporated into the Lifespan HCP processing, and can be readily applied to the released HCP-YA data (Bastiani et al. 2019b).
10.5. Multiple modes of data sharing.
ConnectomeDB (see Section 10.1) has been the primary mode for sharing HCP data, and it has proven to be a very popular platform for several reasons. (i) HCP-YA’s Open Access Data Use Terms are easy to review and accept (see Section 9.3); (ii) A user-friendly, highly flexible ‘dashboard’ enables exploration, filtering by behavioral values, and selection of subjects to be downloaded; (iii) Each data release includes a variety of standard data packages, so that users interested in downloading specific data modalities (e.g., rfMRI vs. dMRI) or particular classes of processed data (e.g., cleaned vs. minimally preprocessed) can easily add just those selections to a “shopping cart”; (iv) Downloading is mediated by Aspera (https://www.ibm.com/products/aspera), which enables consistently high download rates (~300 Mbps maximum).
A second mode of data sharing, which we termed ‘Connectome-In-a-Box’, involved packaging the entire contents of a given data release onto a set of hard drives and shipping them directly to recipients at cost. Many of these recipients then transferred the HCP datasets to servers that could be accessed broadly within their institution, thereby avoiding the redundancy of many investigators from the same lab or institution separately downloading the same large dataset. A third mode involved HCP data hosted on the cloud by the Amazon Web Services Public Datasets program (https://registry.opendata.aws/hcp-openaccess/).
The first HCP Q1 data release in March 2013 included data from an initial group of 68 subjects, sufficient to allow the scientific community to begin gaining familiarity with HCP data and its outputs. Subsequent major releases included the ‘S500’, ‘S900’, and ‘S1200’ datasets in 2014, 2015, and 2017, respectively (see dates in Fig. 1 above and Fig. 2 below). Each was accompanied by a reference manual [9] that provides extensive information of practical use to investigators working with HCP data (see Section 10.7).
Figure 2. A. Data downloaded via ConnectomeDB.
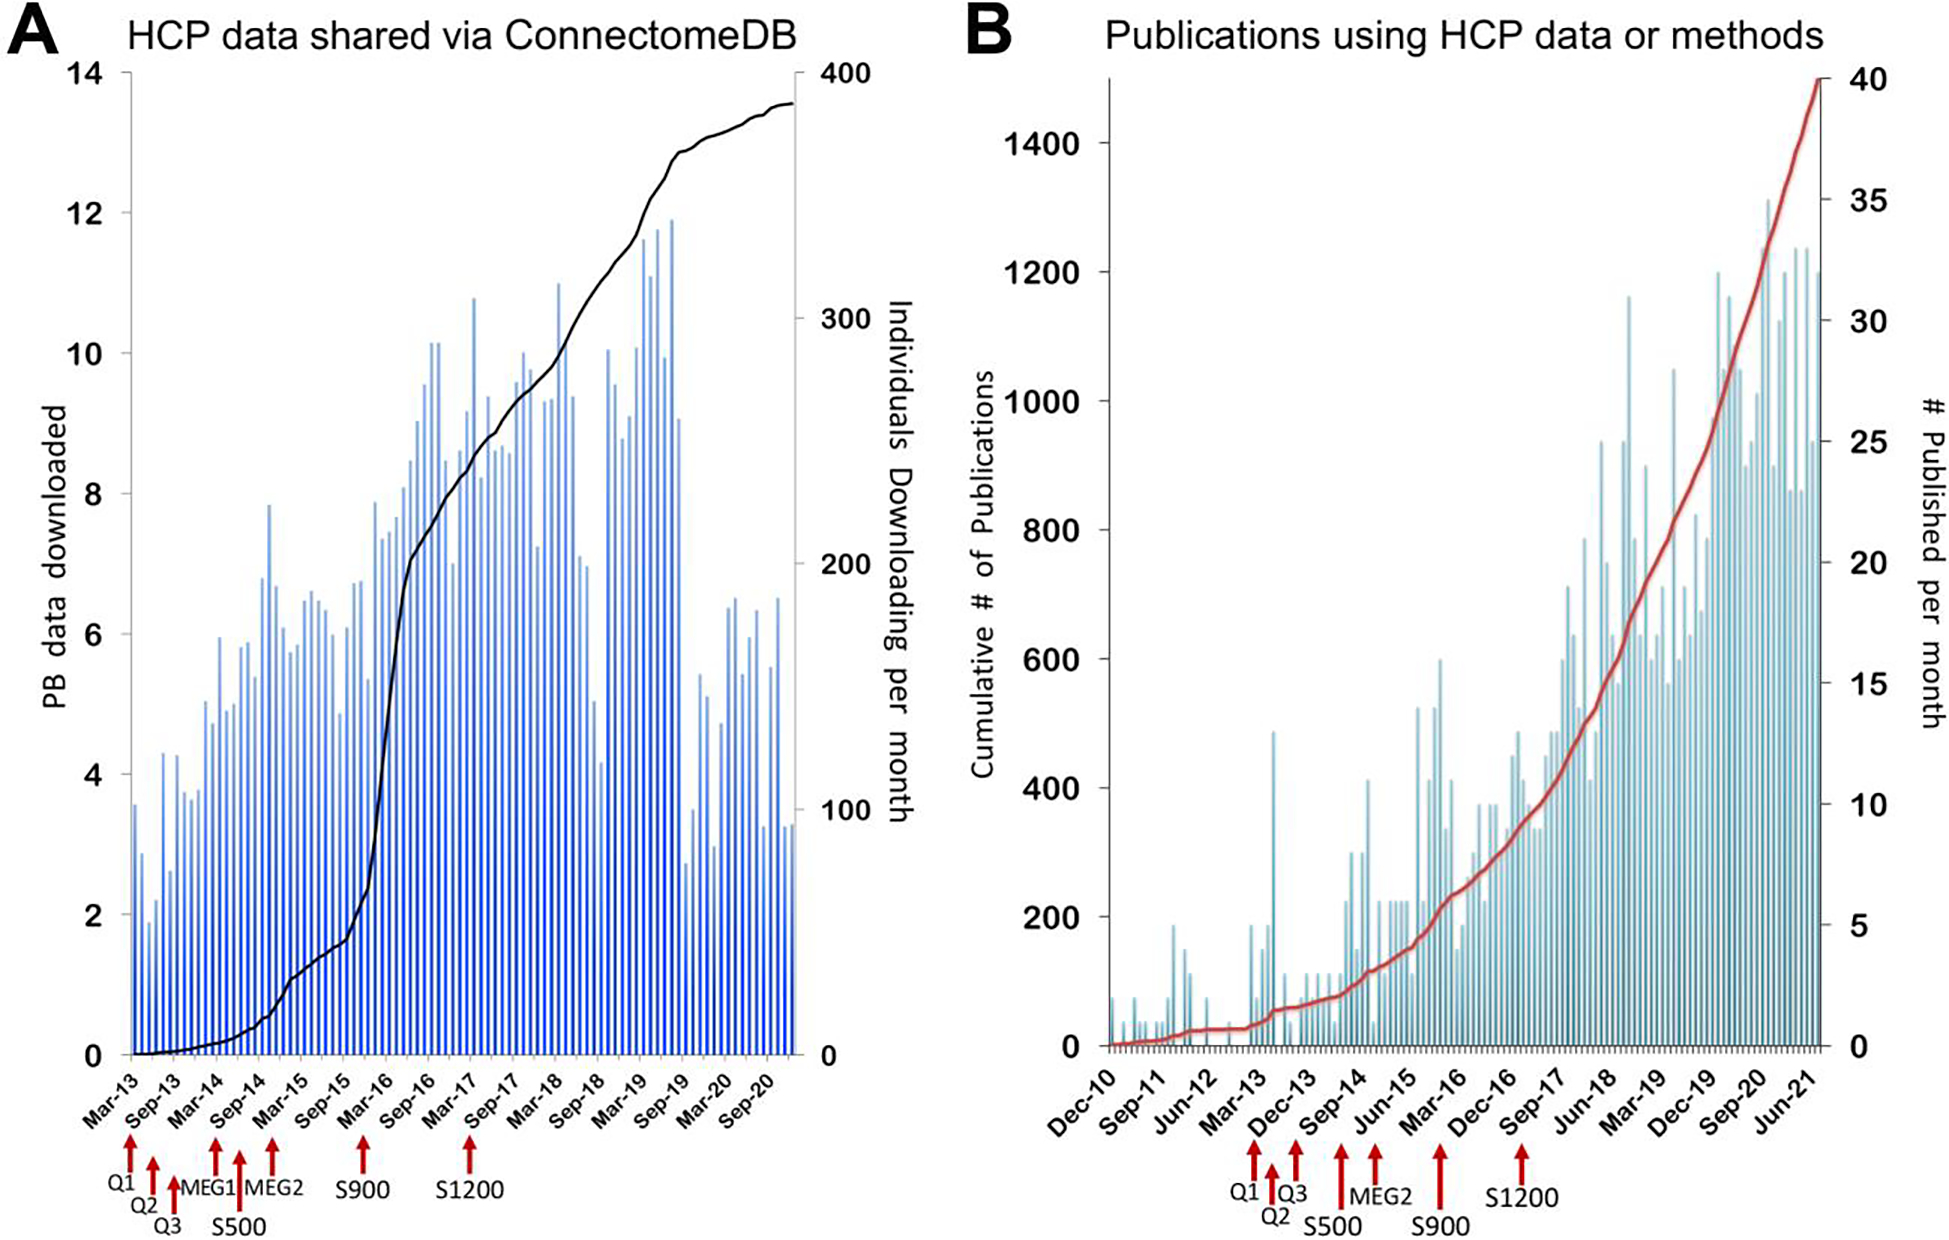
Cumulative downloads from the March 2013 Q1 first major release to December 2020 (when database infrastructure changes affected the tracking of downloads) are indicated by the black line in petabytes (PB) of data. Number of individuals downloading by month is represented by the blue bars. HCP data release dates are indicated with red arrows on the X-axis. B. Publications citing HCP since inception. Citations listed in PubMed using the search string: "MH091657"[All Fields] OR "Human Connectome Project"[All Fields]. Publication month is determined by Epublish date/month, if available, or final published date, if not. HCP data release dates are indicated with red arrows on the X-axis.
10.6. Connectome Workbench and BALSA database platforms.
The introduction of the ‘CIFTI’ data format (grayordinates representing surface vertices plus subcortical gray matter voxels) necessitated an HCP platform that would support CIFTI command-line and visualization capabilities as well as ‘conventional’ surface and volume data. Rather than grafting this major new format onto an existing platform (e.g., Caret software developed during the preceding two decades), the Van Essen lab elected to start afresh by implementing a new Connectome Workbench platform (https://www.humanconnectome.org/software) with a codebase re-engineered from the ground up. The ‘Workbench’ command-line tool (‘wb_command’) carries out a major portion of the operations in the HCP Pipelines, particularly for data in CIFTI format. The Workbench visualization tool (‘wb_view’) includes many features not currently available in other brain imaging platforms, such as flexible tiling of multiple ‘tabs’ within a single window; ‘annotations’ that facilitate generation of complex figures without recourse to conventional applications like Photoshop or PowerPoint; ‘charts’ that display histograms, timeseries data, and connectivity matrices; and multiple overlay options on surface models or volume slices that can be yoked for some tabs but not others. A ‘Help’ section within wb_view provides guidance on these diverse features and capabilities, and the more than 1200 individuals on the ‘HCP-Users’ listserv [10] provide an invaluable resource for answering a variety of technical questions.
A distinctive feature of Workbench involves ‘scene files’ that contain all of the information needed to regenerate an exact replica of how a given set of data files are displayed and annotated, even for complex multipanel figures. Workbench scene files containing extensively analyzed data (in preparation or publication-ready) also provide the core mode of transferring datasets to the BALSA (Brain Analysis Library of Spatial Maps and Atlases) neuroimaging database (https://balsa.wustl.edu; Van Essen et al. 2017). BALSA contains published datasets from a rapidly growing number of studies using HCP and HCP-style datasets, but it accepts data from any neuroimaging study that uses Workbench scene files (and aims to accept similar files from other platforms in the future).
10.7. HCP Outreach Mission.
The methods, data, and tools generated by the HCP are numerous and complex, as is evident from this Retrospective. A primary aspiration of the HCP was to ensure that these outputs be accessible, understandable, and usable by anyone from imaging experts to first-year graduate students, in accordance with principles that would become the Open and FAIR data movement that began in 2014 (Wilkinson et al. 2016, https://www.go-fair.org/fair-principles/). HCP made great efforts to do this well, starting before the first data release by launching a website containing organizational and protocol information, building relationships with the community via presentations and exhibit booths at meetings of the Organization for Human Brain mapping and Society for Neuroscience, producing tutorials and setup guides for all released tools, establishing a user community interested in HCP data and methods in the form of two listservs (HCP-Announce [11] and HCP-Users [10]), and publishing 8 papers with details on the project’s goals and parameters in a special issue of NeuroImage (Van Essen et al. 2013, Ŭgurbil et al. 2013, Glasser et al. 2013, Smith et al. 2013, Barch et al., 2013, Sotiropoulos et al., 2013, Marcus et al., 2013, and Larson-Prior et al., 2013). Once releases began, clear messaging in announcements, documentation detailing the latest data features and processes, a wiki space for noting any identified issues and plans for fixes, and ongoing specific support for users on the HCP-Users list were all key for enabling users to “sink their teeth into'' the data offered. In 2015, we launched an annual, week-long HCP Course, featuring presentations on all aspects of the project and practical sessions designed to prime students for applying HCP-style methods to their own data collection and analyses. The course materials available online (https://store.humanconnectome.org/courses/) provide a valuable resource for training in HCP-style methods and results. We continue to maintain major outreach efforts well after the final data release, as the data are still very much being used by the community.
11. Impact and Measures of success
11.1. Measures of success.
The HCP has been highly successful by a variety of objective measures, including the aggregate amount of data shared, the number of resulting publications, the software tools distributed, projects that emulate HCP, data used in courses and hackathons [12], and tools to access HCP data on the cloud [13].
As of July 2021, more than 22 Petabytes of data have been shared directly from HCP, representing ~14 Petabytes downloaded from ConnectomeDB to >18,000 unique users (Fig. 2A) and ~8 Petabytes distributed as ‘Connectome-In-a-Box’ hard drives to 229 unique users/groups. Another 5 Petabytes of HCP data has been downloaded or used on the cloud through the Amazon Web Services public datasets program (See Section 10.5). Overall, HCP-YA data releases averaged 400TB of downloads per month for 3+ months after each release announcement, and ongoing data access almost 8 years after initial release still averages 40TB per month.
In terms of publications, to date 1508 papers cite the HCP grant (U54MH091657)(Fig. 2B). The great majority of publications (~1200) originate from authors outside the HCP consortium. Notably, citations per month have ~20–30/month for the past 3 years, indicating that the HCP data continues to be used actively in many research projects. Nine publications have >1,000 citations, including 3 originating from non-HCP authors.
Another indicator involves HCP data that has been extensively analyzed, published, and then uploaded to the BALSA database, typically as Connectome Workbench scenes that replicate part or all of what is seen in the published figures (see Section 10.6). This constitutes a second and conceptually distinct level of data sharing. Currently, the majority of datasets available in BALSA contain HCP-derived data shared under the HCP data use terms. To date, BALSA downloads of HCP-derived data include >10 TB from 26 studies and 2 reference datasets that have been accessed by ~2,000 unique users.
Software tools emerging from the HCP include the aforementioned UMinn pulse sequence software package (https://www.cmrr.umn.edu/multiband) and a corresponding HCP-style fMRI protocol, currently used by over 400 sites (see Section 5.1), HCP Pipelines (Section 10.3), multiple new FSL tools including FIX, MSM, and eddy, and Connectome Workbench, with at least 1200 users (Section 10.6). In addition, a growing number of tools developed outside the HCP emulate key ‘HCP-style’ features. This includes fMRIPrep (https://fmriprep.org/) and the ABCD pipeline (https://www.nitrc.org/projects/abcd_study). However, only a minority of investigators who stand to benefit have fully embraced the majority of HCP-style practices. The gap is even greater with regard to clinical neuroimaging, where HCP-style acquisition and analysis does occur, (e.g., Koike et al. 2021; Lamichhane et al. 2021; Chandrasekaran et al. 2021; Moreno-Ortega et al. 2019, 2020) but it is still relatively rare. This will hopefully change, given the availability of FDA approved product solutions for multi-band/SMS EPI. Motion corrected 3D MPRAGE and SPACE sequences (see Section 11.3) are not yet available as FDA approved product sequences, which is surprising given the routine problems with head motion in clinical scans.
11.2. Keys to success and lessons learned.
Many factors contributed to the success of the HCP. Developing a shared vision of scientific goals based on open discussions involving the entire team set the tone early on. Recruiting project managers to assist in coordinating the 100+ team members with interdependent workflows helped keep the project on task and on schedule. Running meetings so discussions stayed focused and decisions were converted into explicit action items (‘who does what by when?’) was critical. The two-phase design of the project allowed sufficient time and resources for critical methods development, improving the overall quality of the data produced. Careful quality control was carried out on anatomical scans and cortical surfaces, rejecting some datasets altogether and categorizing specific anomalies with others. Making access to the data easy and user-friendly was critical to its wide dissemination. Sharing detailed project documentation and providing ongoing education and support to the user community empowered users to capitalize on the high quality data and methods generated.
Once the project was underway, investigators were organized into cross-institutional operational teams to divide the methods development work according to various areas of expertise, with many consortium members participating in multiple teams. The work of some operational teams depended on the conclusion of the work of other teams. For example, until scanner customization was complete, pulse sequences could not be finalized, and the scanner could not be moved from UMinn to WashU; until the scanner was operational at WashU, tfMRI tasks could not be finalized and 3T study staff could not train on the scanner. This required establishing timelines for key developmental stages, but also some flexibility until nearing the end of Phase 1. The transition from Phase 1 to Phase 2 was managed carefully, aiming for a balance between incorporating additional late-breaking refinements while ensuring robust methods for use throughout Phase 2 in order to make all of the study data comparable.
In-person two-day ‘All-Hands’ meetings were held each fall at WashU and each spring at UMinn. Besides reviewing progress, whatever challenges were thorniest at the time were intensively discussed. This often led to a plan to collect additional data, and agreement on what decisions would be made based on the experimental outcomes. The External Advisory Committee [14] was invited to participate actively in these meetings and provided valuable advice. Whether in-person or by teleconference, experimental data guided team decisions: “let’s look at the data” became a go-to process for addressing disagreements, when possible.
Another priority was careful documentation of HCP study methods and information needed to use and interpret the shared data, an effort that was led by the outreach coordinator with input from the PIs, staff scientists, and study coordinators. The resultant reference manual for each data release [15] detailed the standard operating procedures (SOPs) followed by the research staff during subject visits; acquisition protocols; processing pipelines; file structure and contents of shared data; definitions of data variables; and data access instructions. Much of this information is also available in the 8 HCP-related papers in the 2013 NeuroImage special issue (see Section 10.7). Despite having SOPs for all aspects of data collection, unanticipated complexities and potential confounds occasionally arose (e.g., coil instabilities, changes in NIH Toolbox instrument versions, etc.), requiring special documentation in order to ensure the interpretability of the data. These “late breaking” and between release notes/explanations were typically documented on the HCP public wiki and, if not fixable by the time of the next data release, included in the Reference Manual as a notable issue.
Even with this extensive documentation, questions naturally arise as users dig into the data and try out new methods and tools. Throughout the project and continuing today the HCP team has provided customized, timely support for user questions via the HCP-Users listserv. More extensive training on HCP-style methods and tools has been available at the intensive annual HCP Course (and online materials) since 2015. The HCP team’s commitment to ongoing support and education has been essential to the longevity of the data and our continued development of HCP-style methods and analysis tools.
A challenge we encountered throughout HCP-YA that persists into the Lifespan projects and CCF activities, is to balance multiple concurrent efforts, particularly in data processing and preparing for data release. User requests always outpace our processing and release schedule and expectations grow as data is released. Maintaining data storage and distribution capabilities for over 2 PB of data as infrastructure ages out and changes over years has been a major challenge that has been difficult to plan for, being costly in both funds and effort.
11.3. What didn’t go right?
Not everything went as planned, and some decisions in retrospect appear less than optimal. (i) As noted in Section 10.2, we decided against preserving the ‘raw’ k-space fMRI data for a variety of reasons. Consequently, when we switched to a better multiband reconstruction method for fMRI about 9 months into Phase 2, we were precluded from generating a data release with identical multiband reconstruction of the fMRI data across the whole project. (ii) In an effort to reduce the deleterious impact of head motion on structural scans, HCP invested in a system for tracking in real-time the motion of a marker affixed to the face. However, its performance did not meet expectations (likely owing to movement of facial skin relative to the skull and the limitation at that time to only one marker). An alternative approach that became available more recently and has worked well for structural scans in the Lifespan HCP projects is to detect head movement in real time and to re-acquire corrupted data using internal EPI navigators during pulse sequence dead time (Tisdall et al. 2012). (iii) The decision against using Siemens Prescan Normalize for all scans was not optimal. Using Prescan Normalize would have reduced the detrimental impact of head motion within a heterogeneous B1− receive field (an effect not well appreciated when the HCP-YA protocol was created). This would have then reduced (or perhaps even eliminated) the need to model and correct for these effects in processing. For fMRI, sICA+FIX denoising does a good job of removing the structured spatial artifact that arises from head motion within the B1− field. For the structurals, compensation for these effects entails post-hoc modeling (Glasser et al. 2021). For dMRI, appropriate compensation has yet to be modeled. The use of Prescan Normalize would also have led to easier correction of the intensity bias of gradient echo fMRI data and would have enabled improved normalization of beta or variance maps in the released data. (iv) The decision to acquire 3T fMRI at 2.0mm rather than 2.4mm (still below mean cortical thickness) provided high spatial resolution that benefitted cortical analyses in high SNR regions close to the head coils, but yielded lower SNR in subcortical and deep cortical regions. This tradeoff was debated at the time, and other projects have chosen 2.4mm resolution in other HCP-style projects such as the ABCD Study and UK Biobank (see Section 12.2). (v) The lack of eye monitoring during 3T scans made it difficult to monitor awake vs. drowsy vs. asleep during rfMRI scans. Eye monitoring was achieved for the 7T fMRI scans and later for most Lifespan HCP subjects using cameras located outside of the scanner bore, to avoid RF leakage from cables/equipment within the bore; (vi) physiological monitoring was not available for all 3T scans due to technical failures and artifacts and was not available at all at 7T. (vii) The decision to acquire seven relatively short tasks during the 1 hour for tfMRI scans represented a trade-off, as it provided broad coverage of major cortical regions, but reduced sensitivity for some tasks (e.g., Gambling and Relational Processing) and some types of analyses (e.g., individual differences). (viii) Another trade-off that in retrospect may not have been the best decision was to (approximately) match the MEG and fMRI task timings for the motor and working memory tasks. This likely reduced MEG signal quality, which would have benefitted from a higher stimulus presentation rate and more repetitions per condition. (ix) For the Lifespan HCP projects (see Section 12.2) we decided to use multi-echo MPRAGE in order to maintain the overall SNR of the MPRAGE while also increasing its bandwidth to match that of the SPACE acquisition, thereby equalizing readout distortions (Harms et al. 2018). In theory, the multi-echo MPRAGE should have decreased distortions but maintained equal or better SNR than single echo after combining across the echos. Unfortunately, during Lifespan piloting we failed to detect artifacts in the longer echos that were later found to occur frequently and to substantially reduce cortical surface accuracy, causing artifacts in myelin and cortical thickness maps. The only tractable solution was to use the mean of the shortest two echos (i.e., exclude the longest two of four echos) as the T1w input for analysis of Lifespan HCP data, which somewhat reduced the available SNR (~10% relative to the four echo root-mean-square), such that using a single echo MPRAGE from the outset (with lower, unmatched bandwidth to the SPACE scan, as done for HCP-YA) may have been preferable. In retrospect, this was an “unforced error” as the HCP already had implemented readout distortion correction of MPRAGE and SPACE acquisitions in the original HCP-YA, which addressed this issue (Glasser et al. 2013).
12. Looking Forward
12.1. Underexplored aspects and still-unreleased components of HCP data.
Several HCP data types have yet to be extensively explored. This includes the 7T datasets (movies and retinotopy task-fMRI plus 1 h rfMRI), which have substantially higher CNR than at 3T and are available at both 1.6mm/59k and 2.0mm/32k resolutions (see Section 5.5). While many heritability studies have used the HCP family structure, many other aspects of heritability have yet to be systematically examined. In addition, the amount of available genetic data could be expanded if full-genome sequencing were conducted on the samples, which remain available via NRGR (NIMH Repository & Genomics Resource, https://www.nimhgenetics.org/). The MEG data, especially in relation to multimodal HCP MRI data, warrant further exploration using refined analysis and visualization tools.
Development of the HCP Pipelines continues, and future data releases are planned of improved preprocessing and new data analysis products for the HCP-YA dataset. For example, a method for B1+ transmit field correction of myelin maps has been developed and will be applicable both to HCP-YA and the Lifespan HCP studies (Glasser et al. 2021). 3T and 7T rfMRI and tfMRI data cleaned by temporal ICA (Glasser et al. 2018, see Section 5.3) with improved spatial ICA and intensity bias field correction will be made available. These refinements will better harmonize the HCP-YA processing with the ongoing Lifespan HCP and CRHD processing, and will also enable the HCP to finally release individual-subject parcellations using the multimodal areal classifier (Glasser et al. 2016a). Such parcellations will enable generation of individual subject functional and structural connectomes and task activation profiles – a rich collection of imaging data phenotypes. Given that these improvements and refinements entail considerable re-processing of HCP-YA data, which competes for bandwidth with the ongoing processing and data releases for the Lifespan and CHRD projects (see Section 12.2), it is difficult to provide a firm date for another major HCP-YA data release, but hopefully one will occur in 2022. Similarly, future efforts may attempt to better capitalize on the cutting-edge diffusion MRI data made available by the HCP.
12.2. Many additional HCP-style projects.
The HCP-YA provided an excellent start in mapping normative patterns of structural and functional brain connectivity and relationships to individual differences in a wide range of cognitive, affective, and behavioral functions. However, the age range covered was limited to young adulthood (22–35), which naturally raised the question of how these patterns and relationships emerge over the course of development, and how they evolve and change as humans age. In 2015, the NIH Blueprint launched three additional HCP projects, collectively termed the Lifespan HCP. The Baby Connectome Project covers birth to 5 years and involves the University of North Carolina and UMinn (Howell et al. 2019). The HCP-Development (HCP-D), covering ages 5 to 21, and the HCP-Aging (HCP-A), covering ages 36 to 100+, involve WashU, UMinn, UCLA, and Oxford in both projects plus MGH (HCP-A) and Harvard (HCP-D). Each of these projects embodies the same principles as the original HCP-YA (Glasser et al. 2016b), including the use of cutting-edge methods to obtain high-resolution assessments of brain structure, function, and connectivity, and relating these to individual differences in behavior over the course of the lifespan. The Lifespan HCP made various data acquisition modifications that were motivated or necessitated by hardware changes, the need to reduce the total amount of scanning per participant, and/or the additional challenges of working with young children and the elderly, including the use of modified behavioral assessments appropriate to age (Bookheimer et al. 2019; Harms et al. 2018; Somerville et al. 2018; Howell et al., 2019). In addition to mapping normative age-related changes in the brain, including novel data in healthy 90+ year old’s and follow-up imaging assessments in approximately half of the sample, HCP-A includes a focus on capturing pre-, peri-, and post-menopausal relationships in women, including hormonal assessments. HCP-D includes a focus on pubertal development and hormonal assays, including a subset of youth studied longitudinally over three time points bracketing pubertal onset and evolution.
Three additional large HCP-style projects further enrich the repository of information about normative human brain development and aging. The UK-based Developing Human Connectome Project (Fitzgibbon et al. 2020; Bastiani et al. 2019a; Makropoulos et al. 2018; Hughes et al. 2017) scanned over 300 fetuses in utero (20–44 gestational weeks) plus more than 800 neonates. The NIH-funded Adolescent, Brain, and Cognitive Development (ABCD) Study is an ambitious project that has enrolled ~12,000 participants at ages 9–10 years and plans to follow them for a decade (Volkow et al. 2018; Jernigan et al. 2018). The UK Biobank project has acquired imaging data from 43,000 British subjects to date, drawn from the population at large (Littlejohns et al. 2020; Miller et al. 2016), with 7 scan modalities obtained in ~35 min total scan time per participant, and plans to scan a total of 100,000. The huge number of participants in this prospective epidemiological study necessitated limited imaging time per subject. Therefore, being able to directly implement HCP pulse sequences and preprocessing was critical to being able to obtain useful data from a range of modalities including structural and functional connectivity.
The NIH Blueprint also funded 14 Connectomes Related to Human Disease (CRHD) R01 projects initiated between 2015 and 2017 (https://www.humanconnectome.org/disease-studies). These span a wide range of brain disorders, including dementia, psychosis, and depression, with a total of ~4,000 participants to be studied (including healthy controls). Many of these projects nearly matched their imaging protocols with that of the Lifespan HCP projects and all are being supported by the Connectome Coordination Facility (CCF) for project advice, data processing, and sharing (see Section 12.3). The Japanese Brain/MINDS Beyond project aims to establish clinically relevant imaging biomarkers with multi-site harmonization using HCP-style acquisition and analysis approaches from at least 2,000 patients with psychiatric and neurological disorders across the lifespan at 13 research sites plus data from 75 healthy traveling subjects scanned with a high-quality harmonization protocol to facilitate cross-site harmonization of results (Koike et al. 2021).
Making the unprocessed and minimally preprocessed multimodal data available to the scientific community for each of these projects will enable a plethora of detailed analyses, even just using the data from each individual project. Another set of challenges is to develop and implement methods for integration and harmonization of data across the different projects, thereby enabling a better understanding of the evolution of brain structure, function, and connectivity across the lifespan in health and disease. As one example, the behavioral assessments for HCP-D were designed to be as parallel as possible to those being collected in the ABCD Study (Barch et al. 2013; Karcher and Barch 2021), to allow these two datasets to be harmonized and to serve as test and replication datasets. The HCP-D includes cross-sectional assessments from ages 5 to 21, and an accelerated longitudinal cohort design around puberty, allowing for data driven analyses of developmental relationships. Such findings can be replicated in the ABCD Study, which is a fully within-youth longitudinal design, which has advantages in terms of assessing within person change, but comes at the cost of a much longer time horizon for data collection. The HCP-D includes longer rfMRI and dMRI acquisitions than the ABCD, which will afford the opportunity for highly sophisticated and complex analyses of both function and structural connectomes across the course of development. These results can be used to inform the eventual analyses of the less extensive rfMRI and dMRI data being collected in the ABCD, which are constrained by the needs of a study involving ten-fold more participants with many sites and many competing needs for participant testing time. A recently awarded supplement to the ABCD grant will generate a within-subject, cross-project harmonization dataset aimed at increasing the scientific utility and usability of five large-scale neuroimaging datasets (ABCD, Lifespan HCP, ADNI, UK Biobank, and Baby Connectome Project). This may allow: i) using one dataset as a replication data set for analyses conducted on other datasets; and ii) aggregating data across projects in order to generate even larger sample sizes for sophisticated modeling and data-driven analyses, including the ability to have out-of-sample generalization analyses.
HCP-style neuroimaging can also be applied to other species, particularly macaques, marmosets, and other nonhuman primates. This entails adjustments in hardware (e.g., head coils) and pulse sequences in order to compensate for species differences in overall brain size and cortical thickness (Hayashi et al. 2021; Autio et al. 2020; Autio et al. 2021).
12.3. CCF, Pipeline Containerization, and the NDA.
In conjunction with launching the three Lifespan HCP projects and the CRHD (‘Disease Connectome’) projects, the NIH Blueprint in 2016 also funded the Connectome Coordination Facility (CCF) centered at WashU and UMinn with a mandate to handle key aspects of data preprocessing and data sharing for these projects. The CCF includes many members of the HCP-YA informatics team, thus bringing considerable experience and expertise to these new projects.
The preprocessing pipelines for the Lifespan and CRHD projects were based on those used for the HCP-YA, but the differences were numerous enough that CCF decided to implement the revised pipelines using the containerization approach that has gained momentum in recent years. In particular, the HCP pipelines have been incorporated into the QuNex (Quantitative Neuroimaging Environment & ToolboX) software suite (https://qunex.yale.edu) developed in the laboratories of Grega Repovš (University of Ljubljana) and Alan Anticevic and John Murray (Yale University). QuNex provides a robust environment that efficiently manages the dependencies on specific versions of various platforms (FSL, FreeSurfer, Workbench, etc). The containerization provides flexibility for implementation of updates, integration of new software, and functionality improvements that can be deployed on a local computer, lab server, high-performance compute cluster, or in cloud environments. This not only benefits the CCF during preprocessing of Lifespan and CRHD projects, but also other investigators interested in applying HCP-style pipelines to their own data.
The CCF initially planned to handle data sharing by expanding the popular and user-friendly ConnectomeDB service centered at WashU. However, the NIH decided that the expanded effort of sharing data from multiple projects warranted a transition to a centralized approach involving data sharing via the NIMH Data Archive (NDA). Going forward, datasets generated by the Lifespan HCP and CRHD projects are being shared exclusively via the NDA, which is hosted on Amazon Web Services (AWS). In the long run, the NIH anticipates that investigators will increasingly carry out their analyses on the AWS cloud. However, this poses significant technical and practical challenges, as the process for accessing NDA datasets and executing analyses on the cloud are currently not straightforward nor economically competitive with institutional compute infrastructures. In the near term, many investigators may prefer to download datasets from the NDA for local analysis. Since the Lifespan 2.0 data release (February 2021), NDA downloads have averaged ~50TB per month for HCP-D and HCP-A combined. This is about 20% of the pace which HCP-YA experienced via ConnectomeDB in 2016–18 (around the time of the S900 and S1200 releases) and about half of what is still occurring for HCP-YA data 4 years after the final release (see Fig. 2A), perhaps reflecting challenges facing users who attempt to access data through the NDA.
The data use terms for NDA are substantially more restrictive than what the HCP-YA requires for its Open Access data (and what is required by the Lifespan HCP consent). This includes restrictions on sharing of extensively analyzed individual-subject data that may impede scientific advances. In addition, downloading data from NDA involves many steps and currently is significantly slower than ConnectomeDB or downloading from AWS directly. In principle, allowing Lifespan HCP and CRHD data to also be shared via alternate sources (e.g., an institutional repository) as well as NDA might alleviate some of these impediments, but this is not permitted by current NDA policy. An alternative would be funding to develop tools that bridge the gap between the NDA’s cloud infrastructure and ConnectomeDB’s user friendly design. Absent progress on this front, it will be challenging for the Lifespan HCP and CRHD projects to match the broad impact of the HCP-YA.
12.4. What might a “Connectome II” scanner and project look like?
It is also instructive to consider what types of innovations would be most promising should an opportunity arise for a future ‘Connectome II’ project. Regarding hardware, we focus on a scanner that would be suitable for high-throughput studies of many subjects, rather than the ‘bleeding edge’ of technology such as the 10.5T scanner at CMRR (Sadeghi-Tarakameh et al. 2020, Ugurbil 2021) or the MGH HCP high gradient strength 3T scanner (Setsompop et al. 2013). Such a Connectome II scanner would likely be a head only system with substantially stronger and faster gradients. Such a system would enable obtaining higher spatial resolution with shorter readout trains, enabling reduced distortions and signal loss. The head coil would have increased channel counts to enable higher slice accelerations as well, maintaining or increasing temporal and angular resolution. The b0 field strength would be at least 7T, maintaining signal to noise ratio. Parallel transmit (pTx) would be employed to improve B1 inhomogeneities, to capture the increased SNR and contrast-to-noise (CNR) uniformly over the brain, and to reduce power deposition so as to allow higher accelerations and SNR per unit time (Wu et al 2018; Wu et al 2019; Gras et al 2019). Further improvements in pulse sequences (e.g., Vu et al. 2018; Park et al. 2021) and in denoising methods (e.g., Moeller et al. 2021; Vizioli et al. 2021) may yield higher spatial resolution while preserving SNR and whole-brain coverage. For example, if the spatial resolution of fMRI could be reduced below 1.3mm isotropic (half mean cortical thickness of 2.6mm) while maintaining the fast temporal sampling needed for effective denoising, this would open up the possibility of assessing laminar connectivity (to top half or bottom half) of the entire cerebral cortex, likely providing information about feedforward vs. feedback signaling. Structural scans 0.5mm isotropic and below would begin to enable assessment of laminar myeloarchitecture and offer the possibility of more accurate surface construction of thinner cortical structures such as the cerebellum (mean thickness ~1mm) and hippocampus, but such long scans will require high quality on-scanner motion correction to prevent blurring. Diffusion MRI remains, even at the 1.05mm isotropic resolution achieved by the HCP-YA at 7T, a resolution starved problem, but continued progress to higher spatial resolution will improve the accuracy of structural connectivity measurements. On the behavioral side, a major enhancement would involve incorporation of wearable mobile technology for acquiring various types of behavioral data.
12.5. Concluding remarks.
In this article, we have reviewed progress in the field of human connectomics over the past decade and the major role of the HCP in spearheading these advances. While progress has been impressive in many respects, it is important to be mindful of the vastness of the gulf that remains between our current level of understanding and what might ultimately constitute a comprehensive map of the human connectome. One obvious aspect of this gulf is in spatial resolution. In vivo human neuroimaging currently operates at a spatial scale of millimeters, whereas comprehensive mapping of anatomical connectivity entails whole-brain reconstructions at a scale of 10’s of nanometers, as has been achieved in the nematode (Cook et al. 2019) and is not far from completion for Drosophila (Scheffer et al. 2020). Achieving this in the mouse would be a massive undertaking that might take a decade or two (Abbott et al. 2020). Advances in postmortem human brain reconstructions may help reduce this gap (Yendiki et al. 2021; Schmitz et al. 2018), but knowing that the human brain is ~2,000 times larger in volume than the mouse brain underscores the scope of the challenge.
Another key issue involves quantification of connectivity measures. As noted above (Sections 5.3 and 6.2), correlation-based estimates of functional connectivity (FC) from resting-state fMRI and streamline-based estimates of structural connectivity (SC) from diffusion imaging and tractography are far from veridical measures of direct anatomical connectivity. But the degree to which FC and SC each deviate from ground truth is difficult to address in humans, given the lack of ground-truth connectivity data. However, it is sobering that a direct comparison between SC and FC using HCP data and the HCP_MMP1.0 cortical parcellation (Rosen and Halgren 2021) reveals an SC-FC correlation that is very weak (r = 0.061), albeit highly significant statistically. This implies that at least one measure (but most likely both) is poorly correlated with anatomical connectivity. Indeed, in the macaque monkey, direct comparisons with tracer-based anatomical connectivity report only moderate correlations of 0.59 for SC (Donahue et al. 2016) and r = 0.42 (full correlation) or r = 0.39 (partial correlation) for FC (Hayashi et al. 2021). These observations point to a critical need for progress in estimating anatomical connectivity using MRI-based methods. In the spirit of the HCP-style paradigm, this calls for improved methods of data acquisition and analysis, as well as in data sharing so that investigators focusing on analysis methods can apply their efforts to the highest quality datasets. Intensive efforts on non-human primates will be vital for these advances in order to make optimal use of ground truth anatomical connectivity (Milham et al. 2020; Messinger et al. 2021; Hayashi et al. 2021).
On a different but equally important front, much effort has gone into using MRI-based measures to account for distinct aspects of cognition and/or behavior in healthy individuals and in brain disorders. Progress in recent years includes evidence that the predictive power is greater for some tasks than for other tasks or for resting-state data (Greene et al. 2018) and that HCP data can outperform other large-scale datasets in brain-behavior correlations (Gao et al. 2019). Continued advances in human neuroimaging may bring us into an era of ‘personalized neuroscience’ based on the ability to systematically examine a wide range of attributes related to brain structure, function, and connectivity in large numbers of behaviorally well-characterized individuals across the lifespan. This will hopefully lead to deeper insights about the neurobiological basis of individual variability in behavior, health and disease.
Figure 4.
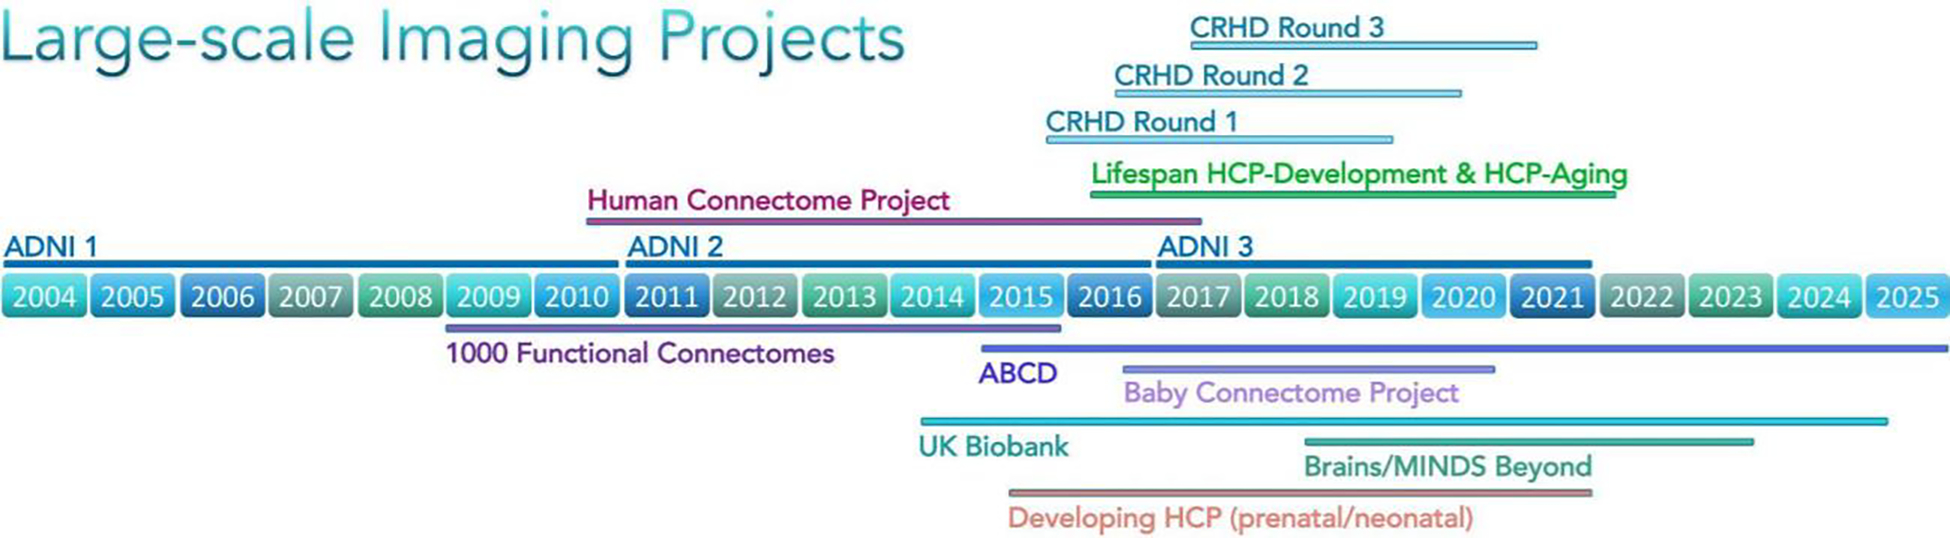
Timeline of large-scale imaging projects predating and postdating HCP. Years of project span for several large scale imaging projects. ADNI, Alzheimer’s Disease Neuroimaging Initiative (3 waves of funding, Mueller et al. 2005); 1000 Functional Connectomes (Biswal et al. 2010); ABCD, Adolescent Brain and Cognitive Development Study (Casey et al. 2018); UK Biobank (Miller et al. 2016); Developing HCP (Bastiani et al. 2019a); CRHD, Connectomes Related to Human Disease; Lifespan HCP-Development & HCP-Aging (Bookheimer et al. 2019; Harms et al. 2018; Somerville et al. 2018); Baby Connectome Project (Howell et al. 2019); Brain/MINDS Beyond (Koike et al. 2021). All projects except ADNI 1–3 and 1000 Functional Connectomes involved HCP-style scanning and preprocessing.
Acknowledgements
We thank the many members of the WU-Minn-Ox HCP consortium for their dedicated efforts on this project and the HCP-style projects that have followed. Supported by U54MH091657 (HCP-YA: Mapping the Human Connectome: Structure, Function, and Heritability), U01MH109589 (HCP-D: Mapping the Human Connectome During Typical Development), U01AG052564 (HCP-A: Mapping the Human Connectome During Typical Aging), 5R24MH108315 (Connectome Coordination Facility (CCF I), and 1R24MH122820 (Connectome Coordination Facility II).
Footnotes
HCP data shows the age of the participant at the time of the study (in years for Restricted Access data and in 5-year bins for Open Access data). Dates such as date of birth are Protected Health Information and therefore would not be shared. At the beginning of the study, age in years could have revealed the year of the participant’s birth, but with the passing of time this is much less likely.
Experts in the nuances of U.S. Health Insurance Portability and Accountability Act (HIPAA) regulations might notice that our concern that some combinations of non-PHI data could identify study participants implied that we could not use the U.S. HIPAA law’s so-called ‘Safe Harbor’ method of de-identifying data simply by removing names, zip codes, birthdates, visit/assessment dates, and other specific identifiers from the data (https://www.hhs.gov/hipaa/for-professionals/privacy/special-topics/de-identification/index.html). Instead, to ensure that our Open/Restricted data plan met HIPAA requirements, we used the Expert Determination method to verify that our shared data neither identifies nor provides a reasonable basis to identify an individual participant. This expert opinion was reviewed and endorsed by a consultant outside of our consortium who had expertise in family studies.
Courses and Hackathons using HCP data: Neuromatch Academy https://academy.neuromatch.io/, HBM Hackathon Seattle http://ohbm.github.io/seattle/datasets/, Brainstorm https://neuroimage.usc.edu/brainstorm/Tutorials/HCP-MEG.
Tools for accessing HCP data on the cloud: Datalad (http://datasets.datalad.org/?dir=/hcp-openaccess ) and others such as: https://cran.r-project.org/web/packages/neurohcp/vignettes/hcp.html
Russ Poldrack, chair, Peter Basser, Ed Bullmore, Alan Evans, Michael Gazzaniga, David Glahn, Mike Hawrylycz, Juergen Hennig, Geoff Parker, and Riita Salmelin
References
- Abbott LF, Bock DD, Callaway EM, Denk W, Dulac C, Fairhall AL, Fiete I, Harris KM, Helmstaedter M, Jain V, Kasthuri N, LeCun Y, Lichtman JW, Littlewood PB, Luo L, Maunsell J, Reid RC, Rosen BR, Rubin GM, Sejnowski TJ, … Van Essen DC (2020). The Mind of a Mouse. Cell, 182(6), 1372–1376. 10.1016/j.cell.2020.08.010 [DOI] [PubMed] [Google Scholar]
- Alexander DC, Zikic D, Ghosh A, Tanno R, Wottschel V, Zhang J, Kaden E, Dyrby TB, Sotiropoulos SN, Zhang H, & Criminisi A (2017). Image quality transfer and applications in diffusion MRI. NeuroImage, 152, 283–298. 10.1016/j.neuroimage.2017.02.089 [DOI] [PubMed] [Google Scholar]
- Amunts K, & Zilles K (2015). Architectonic Mapping of the Human Brain beyond Brodmann. Neuron, 88(6), 1086–1107. 10.1016/j.neuron.2015.12.001 [DOI] [PubMed] [Google Scholar]
- Andersson J, Graham MS, Drobnjak I, Zhang H, & Campbell J (2018). Susceptibility-induced distortion that varies due to motion: Correction in diffusion MR without acquiring additional data. NeuroImage, 171, 277–295. 10.1016/j.neuroimage.2017.12.040 [DOI] [PMC free article] [PubMed] [Google Scholar]
- Andersson J, Graham MS, Drobnjak I, Zhang H, Filippini N, & Bastiani M (2017). Towards a comprehensive framework for movement and distortion correction of diffusion MR images: Within volume movement. NeuroImage, 152, 450–466. 10.1016/j.neuroimage.2017.02.085 [DOI] [PMC free article] [PubMed] [Google Scholar]
- Andersson J, Graham MS, Zsoldos E, & Sotiropoulos SN (2016). Incorporating outlier detection and replacement into a non-parametric framework for movement and distortion correction of diffusion MR images. NeuroImage, 141, 556–572. 10.1016/j.neuroimage.2016.06.058 [DOI] [PubMed] [Google Scholar]
- Andersson J, & Sotiropoulos SN (2016). An integrated approach to correction for off-resonance effects and subject movement in diffusion MR imaging. NeuroImage, 125, 1063–1078. 10.1016/j.neuroimage.2015.10.019 [DOI] [PMC free article] [PubMed] [Google Scholar]
- Andersson JL, Skare S, & Ashburner J (2003). How to correct susceptibility distortions in spin-echo echo-planar images: application to diffusion tensor imaging. NeuroImage, 20(2), 870–888. 10.1016/S1053-8119(03)00336-7 [DOI] [PubMed] [Google Scholar]
- Arnatkeviciute A, Fulcher BD, Oldham S, Tiego J, Paquola C, Gerring Z, Aquino K, Hawi Z, Johnson B, Ball G, Klein M, Deco G, Franke B, Bellgrove MA, & Fornito A (2021). Genetic influences on hub connectivity of the human connectome. Nature communications, 12(1), 4237. 10.1038/s41467-021-24306-2 [DOI] [PMC free article] [PubMed] [Google Scholar]
- Assem M, Glasser MF, Van Essen DC, & Duncan J (2020). A Domain-General Cognitive Core Defined in Multimodally Parcellated Human Cortex. Cerebral cortex (New York, N.Y. : 1991), 30(8), 4361–4380. 10.1093/cercor/bhaa023 [DOI] [PMC free article] [PubMed] [Google Scholar]
- Assem M, Shashidhara S, Glasser MF, & Duncan J (2021). Precise topology of adjacent domain-general and sensory-biased regions in the human brain. BioRxiv. 10.1101/2021.02.21.431622 [DOI] [PMC free article] [PubMed] [Google Scholar]
- Autio JA, Glasser MF, Ose T, Donahue CJ, Bastiani M, Ohno M, Kawabata Y, Urushibata Y, Murata K, Nishigori K, Yamaguchi M, Hori Y, Yoshida A, Go Y, Coalson TS, Jbabdi S, Sotiropoulos SN, Kennedy H, Smith S, Van Essen DC, … Hayashi T (2020). Towards HCP-Style macaque connectomes: 24-Channel 3T multi-array coil, MRI sequences and preprocessing. NeuroImage, 215, 116800. 10.1016/j.neuroimage.2020.116800 [DOI] [PMC free article] [PubMed] [Google Scholar]
- Autio JA, Zhu Q, Li X, Glasser MF, Schwiedrzik CM, Fair DA, Zimmermann J, Yacoub E, Menon RS, Van Essen DC, Hayashi T, Russ B, & Vanduffel W (2021). Minimal specifications for non-human primate MRI: Challenges in standardizing and harmonizing data collection. NeuroImage, 236, 118082. 10.1016/j.neuroimage.2021.118082 [DOI] [PMC free article] [PubMed] [Google Scholar]
- Bammer R, Markl M, Barnett A, Acar B, Alley MT, Pelc NJ, Glover GH, & Moseley ME (2003). Analysis and generalized correction of the effect of spatial gradient field distortions in diffusion-weighted imaging. Magnetic resonance in medicine, 50(3), 560–569. 10.1002/mrm.10545 [DOI] [PubMed] [Google Scholar]
- Bannier E, Barker G, Borghesani V, Broeckx N, Clement P, Emblem KE, Ghosh S, Glerean E, Gorgolewski KJ, Havu M, Halchenko YO, Herholz P, Hespel A, Heunis S, Hu Y, Hu CP, Huijser D, de la Iglesia Vayá M, Jancalek R, Katsaros VK, … Zhu H (2021). The Open Brain Consent: Informing research participants and obtaining consent to share brain imaging data. Human brain mapping, 42(7), 1945–1951. 10.1002/hbm.25351 [DOI] [PMC free article] [PubMed] [Google Scholar]
- Barch DM, Burgess GC, Harms MP, Petersen SE, Schlaggar BL, Corbetta M, Glasser MF, Curtiss S, Dixit S, Feldt C, Nolan D, Bryant E, Hartley T, Footer O, Bjork JM, Poldrack R, Smith S, Johansen-Berg H, Snyder AZ, Van Essen DC, … WU-Minn HCP Consortium (2013). Function in the human connectome: task-fMRI and individual differences in behavior. NeuroImage, 80, 169–189. 10.1016/j.neuroimage.2013.05.033 [DOI] [PMC free article] [PubMed] [Google Scholar]
- Bastiani M, Andersson J, Cordero-Grande L, Murgasova M, Hutter J, Price AN, Makropoulos A, Fitzgibbon SP, Hughes E, Rueckert D, Victor S, Rutherford M, Edwards AD, Smith SM, Tournier JD, Hajnal JV, Jbabdi S, & Sotiropoulos SN (2019a). Automated processing pipeline for neonatal diffusion MRI in the developing Human Connectome Project. NeuroImage, 185, 750–763. 10.1016/j.neuroimage.2018.05.064 [DOI] [PMC free article] [PubMed] [Google Scholar]
- Bastiani M, Cottaar M, Dikranian K, Ghosh A, Zhang H, Alexander DC, Behrens TE, Jbabdi S, & Sotiropoulos SN (2017). Improved tractography using asymmetric fibre orientation distributions. NeuroImage, 158, 205–218. 10.1016/j.neuroimage.2017.06.050 [DOI] [PMC free article] [PubMed] [Google Scholar]
- Bastiani M, Cottaar M, Fitzgibbon SP, Suri S, Alfaro-Almagro F, Sotiropoulos SN, Jbabdi S, & Andersson J (2019b). Automated quality control for within and between studies diffusion MRI data using a non-parametric framework for movement and distortion correction. NeuroImage, 184, 801–812. 10.1016/j.neuroimage.2018.09.073 [DOI] [PMC free article] [PubMed] [Google Scholar]
- Beckmann CF, & Smith SM (2004). Probabilistic independent component analysis for functional magnetic resonance imaging. IEEE transactions on medical imaging, 23(2), 137–152. 10.1109/TMI.2003.822821 [DOI] [PubMed] [Google Scholar]
- Bennett CM, & Miller MB (2010). How reliable are the results from functional magnetic resonance imaging?. Annals of the New York Academy of Sciences, 1191, 133–155. 10.1111/j.1749-6632.2010.05446.x [DOI] [PubMed] [Google Scholar]
- Benson NC, Jamison KW, Arcaro MJ, Vu AT, Glasser MF, Coalson TS, Van Essen DC, Yacoub E, Ugurbil K, Winawer J, & Kay K (2018). The Human Connectome Project 7 Tesla retinotopy dataset: Description and population receptive field analysis. Journal of vision, 18(13), 23. 10.1167/18.13.23 [DOI] [PMC free article] [PubMed] [Google Scholar]
- Bilker WB, Hansen JA, Brensinger CM, Richard J, Gur RE, & Gur RC (2012). Development of abbreviated nine-item forms of the Raven's standard progressive matrices test. Assessment, 19(3), 354–369. 10.1177/1073191112446655 [DOI] [PMC free article] [PubMed] [Google Scholar]
- Biswal BB, Mennes M, Zuo XN, Gohel S, Kelly C, Smith SM, Beckmann CF, Adelstein JS, Buckner RL, Colcombe S, Dogonowski AM, Ernst M, Fair D, Hampson M, Hoptman MJ, Hyde JS, Kiviniemi VJ, Kötter R, Li SJ, Lin CP, … Milham MP (2010). Toward discovery science of human brain function. Proceedings of the National Academy of Sciences of the United States of America, 107(10), 4734–4739. 10.1073/pnas.0911855107 [DOI] [PMC free article] [PubMed] [Google Scholar]
- Bookheimer SY, Salat DH, Terpstra M, Ances BM, Barch DM, Buckner RL, Burgess GC, Curtiss SW, Diaz-Santos M, Elam JS, Fischl B, Greve DN, Hagy HA, Harms MP, Hatch OM, Hedden T, Hodge C, Japardi KC, Kuhn TP, Ly TK, … Yacoub E (2019). The Lifespan Human Connectome Project in Aging: An overview. NeuroImage, 185, 335–348. 10.1016/j.neuroimage.2018.10.009 [DOI] [PMC free article] [PubMed] [Google Scholar]
- Botvinik-Nezer R, Holzmeister F, Camerer CF, Dreber A, Huber J, Johannesson M, Kirchler M, Iwanir R, Mumford JA, Adcock RA, Avesani P, Baczkowski BM, Bajracharya A, Bakst L, Ball S, Barilari M, Bault N, Beaton D, Beitner J, Benoit RG, … Schonberg T (2020). Variability in the analysis of a single neuroimaging dataset by many teams. Nature, 582(7810), 84–88. 10.1038/s41586-020-2314-9 [DOI] [PMC free article] [PubMed] [Google Scholar]
- Buysse DJ, Reynolds CF 3rd, Monk TH, Berman SR, & Kupfer DJ (1989). The Pittsburgh Sleep Quality Index: a new instrument for psychiatric practice and research. Psychiatry research, 28(2), 193–213. 10.1016/0165-1781(89)90047-4 [DOI] [PubMed] [Google Scholar]
- Cajal Santiago Ramon y. 1909. Histologie du système nerveux de l'homme & des vertébrés (Maloine: Paris: ). [Google Scholar]
- Cao H, Zhou H, & Cannon TD (2020). Functional connectome-wide associations of schizophrenia polygenic risk. Molecular psychiatry, 10.1038/s41380-020-0699-3x. Advance online publication. 10.1038/s41380-020-0699-3 [DOI] [PMC free article] [PubMed] [Google Scholar]
- Casey BJ, Cannonier T, Conley MI, Cohen AO, Barch DM, Heitzeg MM, Soules ME, Teslovich T, Dellarco DV, Garavan H, Orr CA, Wager TD, Banich MT, Speer NK, Sutherland MT, Riedel MC, Dick AS, Bjork JM, Thomas KM, Chaarani B, … ABCD Imaging Acquisition Workgroup (2018). The Adolescent Brain Cognitive Development (ABCD) study: Imaging acquisition across 21 sites. Developmental cognitive neuroscience, 32, 43–54. 10.1016/j.dcn.2018.03.001 [DOI] [PMC free article] [PubMed] [Google Scholar]
- Chaarani B, Hahn S, Allgaier N, Adise S, Owens MM, Juliano AC, Yuan DK, Loso H, Ivanciu A, Albaugh MD, Dumas J, Mackey S, Laurent J, Ivanova M, Hagler DJ, Cornejo MD, Hatton S, Agrawal A, Aguinaldo L, Ahonen L, … ABCD Consortium (2021). Baseline brain function in the preadolescents of the ABCD Study. Nature neuroscience, 24(8), 1176–1186. 10.1038/s41593-021-00867-9 [DOI] [PMC free article] [PubMed] [Google Scholar]
- Chandrasekaran S, Bickel S, Herrero JL, Kim JW, Markowitz N, Espinal E, Bhagat NA, Ramdeo R, Xu J, Glasser MF, Bouton CE, & Mehta AD (2021). Evoking highly focal percepts in the fingertips through targeted stimulation of sulcal regions of the brain for sensory restoration. Brain stimulation, S1935–861X(21)00147–9. Advance online publication. 10.1016/j.brs.2021.07.009 [DOI] [PMC free article] [PubMed] [Google Scholar]
- Coalson TS, Van Essen DC, & Glasser MF (2018). The impact of traditional neuroimaging methods on the spatial localization of cortical areas. Proceedings of the National Academy of Sciences of the United States of America, 115(27), E6356–E6365. 10.1073/pnas.1801582115 [DOI] [PMC free article] [PubMed] [Google Scholar]
- Cohen AL, Fair DA, Dosenbach NU, Miezin FM, Dierker D, Van Essen DC, Schlaggar BL, & Petersen SE (2008). Defining functional areas in individual human brains using resting functional connectivity MRI. NeuroImage, 41(1), 45–57. 10.1016/j.neuroimage.2008.01.066 [DOI] [PMC free article] [PubMed] [Google Scholar]
- Colclough GL, Smith SM, Nichols TE, Winkler AM, Sotiropoulos SN, Glasser MF, Van Essen DC, & Woolrich MW (2017). The heritability of multi-modal connectivity in human brain activity. eLife, 6, e20178. 10.7554/eLife.20178 [DOI] [PMC free article] [PubMed] [Google Scholar]
- Cole MW, Bassett DS, Power JD, Braver TS, & Petersen SE (2014). Intrinsic and task-evoked network architectures of the human brain. Neuron, 83(1), 238–251. 10.1016/j.neuron.2014.05.014 [DOI] [PMC free article] [PubMed] [Google Scholar]
- Cook SJ, Jarrell TA, Brittin CA, Wang Y, Bloniarz AE, Yakovlev MA, Nguyen K, Tang LT, Bayer EA, Duerr JS, Bülow HE, Hobert O, Hall DH, & Emmons SW (2019). Whole-animal connectomes of both Caenorhabditis elegans sexes. Nature, 571(7763), 63–71. 10.1038/s41586-019-1352-7 [DOI] [PMC free article] [PubMed] [Google Scholar]
- Cottaar M, Bastiani M, Boddu N, Glasser MF, Haber S, van Essen DC, Sotiropoulos SN, & Jbabdi S (2021). Modelling white matter in gyral blades as a continuous vector field. NeuroImage, 227, 117693. 10.1016/j.neuroimage.2020.117693 [DOI] [PMC free article] [PubMed] [Google Scholar]
- Curtis BJ, Williams PG, Jones CR, & Anderson JS (2016). Sleep duration and resting fMRI functional connectivity: examination of short sleepers with and without perceived daytime dysfunction. Brain and behavior, 6(12), e00576. 10.1002/brb3.576 [DOI] [PMC free article] [PubMed] [Google Scholar]
- Dalley JW, Mar AC, Economidou D, & Robbins TW (2008). Neurobehavioral mechanisms of impulsivity: fronto-striatal systems and functional neurochemistry. Pharmacology, biochemistry, and behavior, 90(2), 250–260. 10.1016/j.pbb.2007.12.021 [DOI] [PubMed] [Google Scholar]
- De Luca A, Guo F, Froeling M, & Leemans A (2020). Spherical deconvolution with tissue-specific response functions and multi-shell diffusion MRI to estimate multiple fiber orientation distributions (mFODs). NeuroImage, 222, 117206. 10.1016/j.neuroimage.2020.117206 [DOI] [PubMed] [Google Scholar]
- Demirtaş M, Burt JB, Helmer M, Ji JL, Adkinson BD, Glasser MF, Van Essen DC, Sotiropoulos SN, Anticevic A, & Murray JD (2019). Hierarchical Heterogeneity across Human Cortex Shapes Large-Scale Neural Dynamics. Neuron, 101(6), 1181–1194.e13. 10.1016/j.neuron.2019.01.017 [DOI] [PMC free article] [PubMed] [Google Scholar]
- Dickie EW, Anticevic A, Smith DE, Coalson TS, Manogaran M, Calarco N, Viviano JD, Glasser MF, Van Essen DC, & Voineskos AN (2019). Ciftify: A framework for surface-based analysis of legacy MR acquisitions. NeuroImage, 197, 818–826. 10.1016/j.neuroimage.2019.04.078 [DOI] [PMC free article] [PubMed] [Google Scholar]
- Donahue CJ, Sotiropoulos SN, Jbabdi S, Hernandez-Fernandez M, Behrens TE, Dyrby TB, Coalson T, Kennedy H, Knoblauch K, Van Essen DC, & Glasser MF (2016). Using Diffusion Tractography to Predict Cortical Connection Strength and Distance: A Quantitative Comparison with Tracers in the Monkey. The Journal of neuroscience : the official journal of the Society for Neuroscience, 36(25), 6758–6770. 10.1523/JNEUROSCI.0493-16.2016 [DOI] [PMC free article] [PubMed] [Google Scholar]
- Dubois J, Galdi P, Han Y, Paul LK, & Adolphs R (2018). Resting-state functional brain connectivity best predicts the personality dimension of openness to experience. Personality neuroscience, 1, e6. 10.1017/pen.2018.8 [DOI] [PMC free article] [PubMed] [Google Scholar]
- Eklund A, Nichols TE, & Knutsson H (2016). Cluster failure: Why fMRI inferences for spatial extent have inflated false-positive rates. Proceedings of the National Academy of Sciences of the United States of America, 113(28), 7900–7905. 10.1073/pnas.1602413113 [DOI] [PMC free article] [PubMed] [Google Scholar]
- Elliott ML, Knodt AR, Ireland D, Morris ML, Poulton R, Ramrakha S, Sison ML, Moffitt TE, Caspi A, & Hariri AR (2020). What Is the Test-Retest Reliability of Common Task-Functional MRI Measures? New Empirical Evidence and a Meta-Analysis. Psychological science, 31(7), 792–806. 10.1177/0956797620916786 [DOI] [PMC free article] [PubMed] [Google Scholar]
- Esteban O, Markiewicz CJ, Blair RW, Moodie CA, Isik AI, Erramuzpe A, Kent JD, Goncalves M, DuPre E, Snyder M, Oya H, Ghosh SS, Wright J, Durnez J, Poldrack RA, & Gorgolewski KJ (2019). fMRIPrep: a robust preprocessing pipeline for functional MRI. Nature methods, 16(1), 111–116. 10.1038/s41592-018-0235-4 [DOI] [PMC free article] [PubMed] [Google Scholar]
- Fan Q, Nummenmaa A, Polimeni JR, Witzel T, Huang SY, Wedeen VJ, Rosen BR, & Wald LL (2017). HIgh b-value and high Resolution Integrated Diffusion (HIBRID) imaging. NeuroImage, 150, 162–176. 10.1016/j.neuroimage.2017.02.002 [DOI] [PMC free article] [PubMed] [Google Scholar]
- Feinberg DA, Moeller S, Smith SM, Auerbach E, Ramanna S, Gunther M, Glasser MF, Miller KL, Ugurbil K, & Yacoub E (2010). Multiplexed echo planar imaging for sub-second whole brain FMRI and fast diffusion imaging. PloS one, 5(12), e15710. 10.1371/journal.pone.0015710 [DOI] [PMC free article] [PubMed] [Google Scholar]
- Feinberg DA, Reese TG, & Wedeen VJ (2002). Simultaneous echo refocusing in EPI. Magnetic resonance in medicine, 48(1), 1–5. 10.1002/mrm.10227 [DOI] [PubMed] [Google Scholar]
- Felleman DJ, & Van Essen DC (1991). Distributed hierarchical processing in the primate cerebral cortex. Cerebral cortex (New York, N.Y. : 1991), 1(1), 1–47. 10.1093/cercor/1.1.1-a [DOI] [PubMed] [Google Scholar]
- Finn ES, & Bandettini PA (2021). Movie-watching outperforms rest for functional connectivity-based prediction of behavior. NeuroImage, 235, 117963. 10.1016/j.neuroimage.2021.117963 [DOI] [PMC free article] [PubMed] [Google Scholar]
- Finn ES, Shen X, Scheinost D, Rosenberg MD, Huang J, Chun MM, Papademetris X, & Constable RT (2015). Functional connectome fingerprinting: identifying individuals using patterns of brain connectivity. Nature neuroscience, 18(11), 1664–1671. 10.1038/nn.4135 [DOI] [PMC free article] [PubMed] [Google Scholar]
- Fischl B (2012). FreeSurfer. NeuroImage, 62(2), 774–781. 10.1016/j.neuroimage.2012.01.021 [DOI] [PMC free article] [PubMed] [Google Scholar]
- Fitzgibbon SP, Harrison SJ, Jenkinson M, Baxter L, Robinson EC, Bastiani M, Bozek J, Karolis V, Cordero Grande L, Price AN, Hughes E, Makropoulos A, Passerat-Palmbach J, Schuh A, Gao J, Farahibozorg SR, O'Muircheartaigh J, Ciarrusta J, O'Keeffe C, Brandon J, … Andersson J (2020). The developing Human Connectome Project (dHCP) automated resting-state functional processing framework for newborn infants. NeuroImage, 223, 117303. 10.1016/j.neuroimage.2020.117303 [DOI] [PMC free article] [PubMed] [Google Scholar]
- Fröhner JH, Teckentrup V, Smolka MN, & Kroemer NB (2020). Corrigendum to "Addressing the reliability fallacy in fMRI: Similar group effects may arise from unreliable individual effects" [NeuroImage 195 (2019) 174–189/1053–8119]. NeuroImage, 222, 117233. 10.1016/j.neuroimage.2020.117233 [DOI] [PubMed] [Google Scholar]
- Galinsky VL, Martinez A, Paulus MP, & Frank LR (2018). Joint Estimation of Effective Brain Wave Activation Modes Using EEG/MEG Sensor Arrays and Multimodal MRI Volumes. Neural computation, 30(7), 1725–1749. 10.1162/neco_a_01087 [DOI] [PMC free article] [PubMed] [Google Scholar]
- Gao S, Greene AS, Constable RT, & Scheinost D (2019). Combining multiple connectomes improves predictive modeling of phenotypic measures. NeuroImage, 201, 116038. 10.1016/j.neuroimage.2019.116038 [DOI] [PMC free article] [PubMed] [Google Scholar]
- Gershon RC, Cella D, Fox NA, Havlik RJ, Hendrie HC, & Wagster MV (2010). Assessment of neurological and behavioural function: the NIH Toolbox. The Lancet. Neurology, 9(2), 138–139. 10.1016/S1474-4422(09)70335-7 [DOI] [PubMed] [Google Scholar]
- Gershon RC, Wagster MV, Hendrie HC, Fox NA, Cook KF, & Nowinski CJ (2013). NIH toolbox for assessment of neurological and behavioral function. Neurology, 80(11 Suppl 3), S2–S6. 10.1212/WNL.0b013e3182872e5f [DOI] [PMC free article] [PubMed] [Google Scholar]
- Glasser MF, Coalson TS, Bijsterbosch JD, Harrison SJ, Harms MP, Anticevic A, Van Essen DC, & Smith SM (2018). Using temporal ICA to selectively remove global noise while preserving global signal in functional MRI data. NeuroImage, 181, 692–717. 10.1016/j.neuroimage.2018.04.076 [DOI] [PMC free article] [PubMed] [Google Scholar]
- Glasser MF, Coalson TS, Harms MP, Baum GL, Autio JA, Auerbach EJ, Xu J, Greve DN, Yacoub E, Van Essen DC, Bock NA & Hayashi T (2021). Transmit Field Bias Correction of T1w/T2w Myelin Maps. BioRxiv. 10.1101/2021.08.08.455570 [DOI] [PMC free article] [PubMed] [Google Scholar]
- Glasser MF, Coalson TS, Robinson EC, Hacker CD, Harwell J, Yacoub E, Ugurbil K, Andersson J, Beckmann CF, Jenkinson M, Smith SM, & Van Essen DC (2016a). A multi-modal parcellation of human cerebral cortex. Nature, 536(7615), 171–178. 10.1038/nature18933 [DOI] [PMC free article] [PubMed] [Google Scholar]
- Glasser MF, Goyal MS, Preuss TM, Raichle ME, & Van Essen DC (2014). Trends and properties of human cerebral cortex: correlations with cortical myelin content. NeuroImage, 93 Pt 2, 165–175. 10.1016/j.neuroimage.2013.03.060 [DOI] [PMC free article] [PubMed] [Google Scholar]
- Glasser MF, Smith SM, Marcus DS, Andersson JL, Auerbach EJ, Behrens TE, Coalson TS, Harms MP, Jenkinson M, Moeller S, Robinson EC, Sotiropoulos SN, Xu J, Yacoub E, Ugurbil K, & Van Essen DC (2016b). The Human Connectome Projecťs neuroimaging approach. Nature neuroscience, 19(9), 1175–1187. 10.1038/nn.4361 [DOI] [PMC free article] [PubMed] [Google Scholar]
- Glasser MF, Sotiropoulos SN, Wilson JA, Coalson TS, Fischl B, Andersson JL, Xu J, Jbabdi S, Webster M, Polimeni JR, Van Essen DC, Jenkinson M, & WU-Minn HCP Consortium (2013). The minimal preprocessing pipelines for the Human Connectome Project. NeuroImage, 80, 105–124. 10.1016/j.neuroimage.2013.04.127 [DOI] [PMC free article] [PubMed] [Google Scholar]
- Glasser MF, & Van Essen DC (2011). Mapping human cortical areas in vivo based on myelin content as revealed by T1- and T2-weighted MRI. The Journal of neuroscience : the official journal of the Society for Neuroscience, 31(32), 11597–11616. 10.1523/JNEUROSCI.2180-11.2011 [DOI] [PMC free article] [PubMed] [Google Scholar]
- Gordon EM, Laumann TO, Adeyemo B, Huckins JF, Kelley WM, & Petersen SE (2016). Generation and Evaluation of a Cortical Area Parcellation from Resting-State Correlations. Cerebral cortex (New York, N.Y. : 1991), 26(1), 288–303. 10.1093/cercor/bhu239 [DOI] [PMC free article] [PubMed] [Google Scholar]
- Gordon EM, Laumann TO, Gilmore AW, Newbold DJ, Greene DJ, Berg JJ, Ortega M, Hoyt-Drazen C, Gratton C, Sun H, Hampton JM, Coalson RS, Nguyen AL, McDermott KB, Shimony JS, Snyder AZ, Schlaggar BL, Petersen SE, Nelson SM, & Dosenbach N (2017). Precision Functional Mapping of Individual Human Brains. Neuron, 95(4), 791–807.e7. 10.1016/j.neuron.2017.07.011 [DOI] [PMC free article] [PubMed] [Google Scholar]
- Gramfort A, Luessi M, Larson E, Engemann DA, Strohmeier D, Brodbeck C, Goj R, Jas M, Brooks T, Parkkonen L, & Hämäläinen M (2013). MEG and EEG data analysis with MNE-Python. Frontiers in neuroscience, 7, 267. 10.3389/fnins.2013.00267 [DOI] [PMC free article] [PubMed] [Google Scholar]
- Gras V, Poser BA, Wu X, Tomi-Tricot R, & Boulant N (2019). Optimizing BOLD sensitivity in the 7T Human Connectome Project resting-state fMRI protocol using plug-and-play parallel transmission. NeuroImage, 195, 1–10. 10.1016/j.neuroimage.2019.03.040 [DOI] [PubMed] [Google Scholar]
- Greene AS, Gao S, Scheinost D, & Constable RT (2018). Task-induced brain state manipulation improves prediction of individual traits. Nature communications, 9(1), 2807. 10.1038/s41467-018-04920-3 [DOI] [PMC free article] [PubMed] [Google Scholar]
- Greve DN, & Fischl B (2009). Accurate and robust brain image alignment using boundary-based registration. NeuroImage, 48(1), 63–72. 10.1016/j.neuroimage.2009.06.060 [DOI] [PMC free article] [PubMed] [Google Scholar]
- Hagler DJ Jr, Hatton S, Cornejo MD, Makowski C, Fair DA, Dick AS, Sutherland MT, Casey BJ, Barch DM, Harms MP, Watts R, Bjork JM, Garavan HP, Hilmer L, Pung CJ, Sicat CS, Kuperman J, Bartsch H, Xue F, Heitzeg MM, … Dale AM (2019). Image processing and analysis methods for the Adolescent Brain Cognitive Development Study. NeuroImage, 202, 116091. 10.1016/j.neuroimage.2019.116091 [DOI] [PMC free article] [PubMed] [Google Scholar]
- Harms MP, Somerville LH, Ances BM, Andersson J, Barch DM, Bastiani M, Bookheimer SY, Brown TB, Buckner RL, Burgess GC, Coalson TS, Chappell MA, Dapretto M, Douaud G, Fischl B, Glasser MF, Greve DN, Hodge C, Jamison KW, Jbabdi S, … Yacoub E (2018). Extending the Human Connectome Project across ages: Imaging protocols for the Lifespan Development and Aging projects. NeuroImage, 183, 972–984. 10.1016/j.neuroimage.2018.09.060 [DOI] [PMC free article] [PubMed] [Google Scholar]
- Hayashi T, Hou Y, Glasser MF, Autio JA, Knoblauch K, Inoue-Murayama M, Coalson T, Yacoub E, Smith S, Kennedy H, & Van Essen DC (2021). The nonhuman primate neuroimaging and neuroanatomy project. NeuroImage, 229, 117726. 10.1016/j.neuroimage.2021.117726 [DOI] [PMC free article] [PubMed] [Google Scholar]
- Heaton RK, Akshoomoff N, Tulsky D, Mungas D, Weintraub S, Dikmen S, Beaumont J, Casaletto KB, Conway K, Slotkin J, & Gershon R (2014). Reliability and validity of composite scores from the NIH Toolbox Cognition Battery in adults. Journal of the International Neuropsychological Society : JINS, 20(6), 588–598. 10.1017/S1355617714000241 [DOI] [PMC free article] [PubMed] [Google Scholar]
- Hedge C, Powell G, & Sumner P (2018). The reliability paradox: Why robust cognitive tasks do not produce reliable individual differences. Behavior research methods, 50(3), 1166–1186. 10.3758/s13428-017-0935-1 [DOI] [PMC free article] [PubMed] [Google Scholar]
- Hernandez-Fernandez M, Reguly I, Jbabdi S, Giles M, Smith S, & Sotiropoulos SN (2019). Using GPUs to accelerate computational diffusion MRI: From microstructure estimation to tractography and connectomes. NeuroImage, 188, 598–615. 10.1016/j.neuroimage.2018.12.015 [DOI] [PMC free article] [PubMed] [Google Scholar]
- Herting MM, Gautam P, Chen Z, Mezher A, & Vetter NC (2018). Test-retest reliability of longitudinal task-based fMRI: Implications for developmental studies. Developmental cognitive neuroscience, 33, 17–26. 10.1016/j.dcn.2017.07.001 [DOI] [PMC free article] [PubMed] [Google Scholar]
- Hodge MR, Horton W, Brown T, Herrick R, Olsen T, Hileman ME, McKay M, Archie KA, Cler E, Harms MP, Burgess GC, Glasser MF, Elam JS, Curtiss SW, Barch DM, Oostenveld R, Larson-Prior LJ, Ugurbil K, Van Essen DC, & Marcus DS (2016). ConnectomeDB--Sharing human brain connectivity data. NeuroImage, 124(Pt B), 1102–1107. 10.1016/j.neuroimage.2015.04.046 [DOI] [PMC free article] [PubMed] [Google Scholar]
- Howell BR, Styner MA, Gao W, Yap PT, Wang L, Baluyot K, Yacoub E, Chen G, Potts T, Salzwedel A, Li G, Gilmore JH, Piven J, Smith JK, Shen D, Ugurbil K, Zhu H, Lin W, & Elison JT (2019). The UNC/UMN Baby Connectome Project (BCP): An overview of the study design and protocol development. NeuroImage, 185, 891–905. 10.1016/j.neuroimage.2018.03.049 [DOI] [PMC free article] [PubMed] [Google Scholar]
- Hughes EJ, Winchman T, Padormo F, Teixeira R, Wurie J, Sharma M, Fox M, Hutter J, Cordero-Grande L, Price AN, Allsop J, Bueno-Conde J, Tusor N, Arichi T, Edwards AD, Rutherford MA, Counsell SJ, & Hajnal JV (2017). A dedicated neonatal brain imaging system. Magnetic resonance in medicine, 78(2), 794–804. 10.1002/mrm.26462 [DOI] [PMC free article] [PubMed] [Google Scholar]
- Infantolino ZP, Luking KR, Sauder CL, Curtin JJ, & Hajcak G (2018). Robust is not necessarily reliable: From within-subjects fMRI contrasts to between-subjects comparisons. NeuroImage, 173, 146–152. 10.1016/j.neuroimage.2018.02.024 [DOI] [PMC free article] [PubMed] [Google Scholar]
- Jernigan TL, Brown SA, & ABCD Consortium Coordinators (2018). Introduction. Developmental cognitive neuroscience, 32, 1–3. 10.1016/j.dcn.2018.02.002 [DOI] [PMC free article] [PubMed] [Google Scholar]
- Jeurissen B, Tournier JD, Dhollander T, Connelly A, & Sijbers J (2014). Multi-tissue constrained spherical deconvolution for improved analysis of multi-shell diffusion MRI data. NeuroImage, 103, 411–426. 10.1016/j.neuroimage.2014.07.061 [DOI] [PubMed] [Google Scholar]
- Jones DK, & Basser PJ (2004). "Squashing peanuts and smashing pumpkins": how noise distorts diffusion-weighted MR data. Magnetic resonance in medicine, 52(5), 979–993. 10.1002/mrm.20283 [DOI] [PubMed] [Google Scholar]
- Karcher NR, & Barch DM (2021). The ABCD study: understanding the development of risk for mental and physical health outcomes. Neuropsychopharmacology : official publication of the American College of Neuropsychopharmacology, 46(1), 131–142. 10.1038/s41386-020-0736-6 [DOI] [PMC free article] [PubMed] [Google Scholar]
- Karcher NR, Barch DM, Demers CH, Baranger D, Heath AC, Lynskey MT, & Agrawal A (2019). Genetic Predisposition vs Individual-Specific Processes in the Association Between Psychotic-like Experiences and Cannabis Use. JAMA psychiatry, 76(1), 87–94. 10.1001/jamapsychiatry.2018.2546 [DOI] [PMC free article] [PubMed] [Google Scholar]
- Keil B, Blau JN, Biber S, Hoecht P, Tountcheva V, Setsompop K, Triantafyllou C, & Wald LL (2013). A 64-channel 3T array coil for accelerated brain MRI. Magnetic resonance in medicine, 70(1), 248–258. 10.1002/mrm.24427 [DOI] [PMC free article] [PubMed] [Google Scholar]
- Koike S, Tanaka SC, Okada T, Aso T, Yamashita A, Yamashita O, Asano M, Maikusa N, Morita K, Okada N, Fukunaga M, Uematsu A, Togo H, Miyazaki A, Murata K, Urushibata Y, Autio J, Ose T, Yoshimoto J, Araki T, … Brain/MINDS Beyond Human Brain MRI Group (2021). Brain/MINDS beyond human brain MRI project: A protocol for multi-level harmonization across brain disorders throughout the lifespan. NeuroImage. Clinical, 30, 102600. 10.1016/j.nicl.2021.102600 [DOI] [PMC free article] [PubMed] [Google Scholar]
- Kuehn E, Dinse J, Jakobsen E, Long X, Schäfer A, Bazin PL, Villringer A, Sereno MI, & Margulies DS (2017). Body Topography Parcellates Human Sensory and Motor Cortex. Cerebral cortex (New York, N.Y. : 1991), 27(7), 3790–3805. 10.1093/cercor/bhx026 [DOI] [PMC free article] [PubMed] [Google Scholar]
- Lamichhane B, Jayasekera D, Jakes R, Glasser MF, Zhang J, Yang C, Grimes D, Frank TL, Ray WZ, Leuthardt EC, & Hawasli AH (2021). Multi-modal biomarkers of low back pain: A machine learning approach. NeuroImage. Clinical, 29, 102530. 10.1016/j.nicl.2020.102530 [DOI] [PMC free article] [PubMed] [Google Scholar]
- Lancaster TM (2018). Evidence for association between familial bipolar risk and ventral striatal volume. Journal of affective disorders, 232, 69–72. 10.1016/j.jad.2018.02.015 [DOI] [PMC free article] [PubMed] [Google Scholar]
- Lancaster TM (2019). Associations between rare microglia-linked Alzheimer's disease risk variants and subcortical brain volumes in young individuals. Alzheimer's & dementia (Amsterdam, Netherlands), 11, 368–373. 10.1016/j.dadm.2019.03.005 [DOI] [PMC free article] [PubMed] [Google Scholar]
- Laumann TO, Gordon EM, Adeyemo B, Snyder AZ, Joo SJ, Chen MY, Gilmore AW, McDermott KB, Nelson SM, Dosenbach NU, Schlaggar BL, Mumford JA, Poldrack RA, & Petersen SE (2015). Functional System and Areal Organization of a Highly Sampled Individual Human Brain. Neuron, 87(3), 657–670. 10.1016/j.neuron.2015.06.037 [DOI] [PMC free article] [PubMed] [Google Scholar]
- Li J, Kong R, Liégeois R, Orban C, Tan Y, Sun N, Holmes AJ, Sabuncu MR, Ge T, & Yeo B (2019). Global signal regression strengthens association between resting-state functional connectivity and behavior. NeuroImage, 196, 126–141. 10.1016/j.neuroimage.2019.04.016 [DOI] [PMC free article] [PubMed] [Google Scholar]
- Liégeois R, Li J, Kong R, Orban C, Van De Ville D, Ge T, Sabuncu MR, & Yeo B (2019). Resting brain dynamics at different timescales capture distinct aspects of human behavior. Nature communications, 10(1), 2317. 10.1038/s41467-019-10317-7 [DOI] [PMC free article] [PubMed] [Google Scholar]
- Littlejohns TJ, Holliday J, Gibson LM, Garratt S, Oesingmann N, Alfaro-Almagro F, Bell JD, Boultwood C, Collins R, Conroy MC, Crabtree N, Doherty N, Frangi AF, Harvey NC, Leeson P, Miller KL, Neubauer S, Petersen SE, Sellors J, Sheard S, … Allen NE (2020). The UK Biobank imaging enhancement of 100,000 participants: rationale, data collection, management and future directions. Nature communications, 11(1), 2624. 10.1038/s41467-020-15948-9 [DOI] [PMC free article] [PubMed] [Google Scholar]
- Lynch CJ, Power JD, Scult MA, Dubin M, Gunning FM, & Liston C (2020). Rapid Precision Functional Mapping of Individuals Using Multi-Echo fMRI. Cell reports, 33(12), 108540. 10.1016/j.celrep.2020.108540 [DOI] [PMC free article] [PubMed] [Google Scholar]
- Maier-Hein KH, Neher PF, Houde JC, Côté MA, Garyfallidis E, Zhong J, Chamberland M, Yeh FC, Lin YC, Ji Q, Reddick WE, Glass JO, Chen DQ, Feng Y, Gao C, Wu Y, Ma J, He R, Li Q, Westin CF, … Descoteaux M (2017). The challenge of mapping the human connectome based on diffusion tractography. Nature communications, 8(1), 1349. 10.1038/s41467-017-01285-x [DOI] [PMC free article] [PubMed] [Google Scholar]
- Makropoulos A, Robinson EC, Schuh A, Wright R, Fitzgibbon S, Bozek J, Counsell SJ, Steinweg J, Vecchiato K, Passerat-Palmbach J, Lenz G, Mortari F, Tenev T, Duff EP, Bastiani M, Cordero-Grande L, Hughes E, Tusor N, Tournier JD, Hutter J, … Rueckert D (2018). The developing human connectome project: A minimal processing pipeline for neonatal cortical surface reconstruction. NeuroImage, 173, 88–112. 10.1016/j.neuroimage.2018.01.054 [DOI] [PMC free article] [PubMed] [Google Scholar]
- Marcus DS, Harms MP, Snyder AZ, Jenkinson M, Wilson JA, Glasser MF, Barch DM, Archie KA, Burgess GC, Ramaratnam M, Hodge M, Horton W, Herrick R, Olsen T, McKay M, House M, Hileman M, Reid E, Harwell J, Coalson T, … WU-Minn HCP Consortium (2013). Human Connectome Project informatics: quality control, database services, and data visualization. NeuroImage, 80, 202–219. 10.1016/j.neuroimage.2013.05.077 [DOI] [PMC free article] [PubMed] [Google Scholar]
- Marcus DS, Olsen TR, Ramaratnam M, & Buckner RL (2007). The Extensible Neuroimaging Archive Toolkit: an informatics platform for managing, exploring, and sharing neuroimaging data. Neuroinformatics, 5(1), 11–34. 10.1385/ni:5:1:11 [DOI] [PubMed] [Google Scholar]
- Marek S, Tervo-Clemmens B, Calabro FJ,Montez DF, Kay BP, Hatoum AS, Donohue MR, Foran W, Miller RL, Feczko E, Miranda-Dominguez O, Graham AM, Earl AE, Perrone AJ, Cordova M, Doyle O, Moore LA, Conan G, Uriarte J, Snider K, Tam A, Chen J, Newbold DJ, Zheng A, Seider NA, Van AN, Laumann TO, Thompson WK, Greene DJ, Petersen SE, Nichols TE, Yeo BTT, Barch DM, Garavan H, Luna B, Fair DA, Dosenbach NUF (2020). Towards reproducible brain-wide association studies. BioRxiv. 10.1101/2020.08.21.257758 [DOI] [Google Scholar]
- Mars RB, Sotiropoulos SN, Passingham RE, Sallet J, Verhagen L, Khrapitchev AA, Sibson N, & Jbabdi S (2018). Whole brain comparative anatomy using connectivity blueprints. eLife, 7, e35237. 10.7554/eLife.35237 [DOI] [PMC free article] [PubMed] [Google Scholar]
- McNab JA, Jbabdi S, Deoni SC, Douaud G, Behrens TE, & Miller KL (2009). High resolution diffusion-weighted imaging in fixed human brain using diffusion-weighted steady state free precession. NeuroImage, 46(3), 775–785. 10.1016/j.neuroimage.2009.01.008 [DOI] [PubMed] [Google Scholar]
- Messinger A, Sirmpilatze N, Heuer K, Loh KK, Mars RB, Sein J, Xu T, Glen D, Jung B, Seidlitz J, Taylor P, Toro R, Garza-Villarreal EA, Sponheim C, Wang X, Benn RA, Cagna B, Dadarwal R, Evrard HC, Garcia-Saldivar P, … Klink PC (2021). A collaborative resource platform for non-human primate neuroimaging. NeuroImage, 226, 117519. 10.1016/j.neuroimage.2020.117519 [DOI] [PMC free article] [PubMed] [Google Scholar]
- Milham MP & PRIMatE Data Exchange (PRIME-DE) Global Collaboration Workshop and Consortium. Electronic address: michael.milham@childmind.org, & PRIMatE Data Exchange (PRIME-DE) Global Collaboration Workshop and Consortium (2020). Accelerating the Evolution of Nonhuman Primate Neuroimaging. Neuron, 105(4), 600–603. 10.1016/j.neuron.2019.12.023 [DOI] [PMC free article] [PubMed] [Google Scholar]
- Michalski LJ, Demers CH, Baranger D, Barch DM, Harms MP, Burgess GC, & Bogdan R (2017). Perceived stress is associated with increased rostral middle frontal gyrus cortical thickness: a family-based and discordant-sibling investigation. Genes, brain, and behavior, 16(8), 781–789. 10.1111/gbb.12404 [DOI] [PMC free article] [PubMed] [Google Scholar]
- Milchenko M, & Marcus D (2013). Obscuring surface anatomy in volumetric imaging data. Neuroinformatics, 11(1), 65–75. 10.1007/s12021-012-9160-3 [DOI] [PMC free article] [PubMed] [Google Scholar]
- Miller KL, Alfaro-Almagro F, Bangerter NK, Thomas DL, Yacoub E, Xu J, Bartsch AJ, Jbabdi S, Sotiropoulos SN, Andersson JL, Griffanti L, Douaud G, Okell TW, Weale P, Dragonu I, Garratt S, Hudson S, Collins R, Jenkinson M, Matthews PM, … Smith SM (2016). Multimodal population brain imaging in the UK Biobank prospective epidemiological study. Nature neuroscience, 19(11), 1523–1536. 10.1038/nn.4393 [DOI] [PMC free article] [PubMed] [Google Scholar]
- Miller KL, McNab JA, Jbabdi S, & Douaud G (2012). Diffusion tractography of post-mortem human brains: optimization and comparison of spin echo and steady-state free precession techniques. NeuroImage, 59(3), 2284–2297. 10.1016/j.neuroimage.2011.09.054 [DOI] [PMC free article] [PubMed] [Google Scholar]
- Moeller S, Pisharady PK, Ramanna S, Lenglet C, Wu X, Dowdle L, Yacoub E, Uğurbil K, & Akçakaya M (2021). NOise reduction with DIstribution Corrected (NORDIC) PCA in dMRI with complex-valued parameter-free locally low-rank processing. NeuroImage, 226, 117539. 10.1016/j.neuroimage.2020.117539 [DOI] [PMC free article] [PubMed] [Google Scholar]
- Moeller S, Yacoub E, Olman CA, Auerbach E, Strupp J, Harel N, & Uğurbil K (2010). Multiband multislice GE-EPI at 7 tesla, with 16-fold acceleration using partial parallel imaging with application to high spatial and temporal whole-brain fMRI. Magnetic resonance in medicine, 63(5), 1144–1153. 10.1002/mrm.22361 [DOI] [PMC free article] [PubMed] [Google Scholar]
- Moreno-Ortega M, Kangarlu A, Lee S, Perera T, Kangarlu J, Palomo T, Glasser MF, & Javitt DC (2020). Parcel-guided rTMS for depression. Translational psychiatry, 10(1), 283. 10.1038/s41398-020-00970-8 [DOI] [PMC free article] [PubMed] [Google Scholar]
- Moreno-Ortega M, Prudic J, Rowny S, Patel GH, Kangarlu A, Lee S, Grinband J, Palomo T, Perera T, Glasser MF, & Javitt DC (2019). Resting state functional connectivity predictors of treatment response to electroconvulsive therapy in depression. Scientific reports, 9(1), 5071. 10.1038/s41598-019-41175-4 [DOI] [PMC free article] [PubMed] [Google Scholar]
- Moser DA, Doucet GE, Ing A, Dima D, Schumann G, Bilder RM, & Frangou S (2018). An integrated brain-behavior model for working memory. Molecular psychiatry, 23(10), 1974–1980. 10.1038/mp.2017.247 [DOI] [PMC free article] [PubMed] [Google Scholar]
- Mueller SG, Weiner MW, Thal LJ, Petersen RC, Jack C, Jagust W, Trojanowski JQ, Toga AW, & Beckett L (2005). The Alzheimer's disease neuroimaging initiative. Neuroimaging clinics of North America, 15(4), 869–xii. 10.1016/j.nic.2005.09.008 [DOI] [PMC free article] [PubMed] [Google Scholar]
- Naselaris T, Allen E, & Kay K (2021). Extensive sampling for complete models of individual brains. Current Opinion in Behavioral Sciences, 40, 45–51. 10.1016/j.cobeha.2020.12.008 [DOI] [Google Scholar]
- Nichols TE, Das S, Eickhoff SB, Evans AC, Glatard T, Hanke M, Kriegeskorte N, Milham MP, Poldrack RA, Poline JB, Proal E, Thirion B, Van Essen DC, White T, & Yeo BT (2017). Best practices in data analysis and sharing in neuroimaging using MRI. Nature neuroscience, 20(3), 299–303. 10.1038/nn.4500 [DOI] [PMC free article] [PubMed] [Google Scholar]
- Niso G, Gorgolewski KJ, Bock E, Brooks TL, Flandin G, Gramfort A, Henson RN, Jas M, Litvak V, T Moreau J, Oostenveld R, Schoffelen JM, Tadel F, Wexler J, & Baillet S (2018). MEG-BIDS, the brain imaging data structure extended to magnetoencephalography. Scientific data, 5, 180110. 10.1038/sdata.2018.110 [DOI] [PMC free article] [PubMed] [Google Scholar]
- Niso G, Tadel F, Bock E, Cousineau M, Santos A, & Baillet S (2019). Brainstorm Pipeline Analysis of Resting-State Data From the Open MEG Archive. Frontiers in neuroscience, 13, 284. 10.3389/fnins.2019.00284 [DOI] [PMC free article] [PubMed] [Google Scholar]
- O'Muircheartaigh J, & Jbabdi S (2018). Concurrent white matter bundles and grey matter networks using independent component analysis. NeuroImage, 170, 296–306. 10.1016/j.neuroimage.2017.05.012 [DOI] [PMC free article] [PubMed] [Google Scholar]
- Oostenveld R, Fries P, Maris E, & Schoffelen JM (2011). FieldTrip: Open source software for advanced analysis of MEG, EEG, and invasive electrophysiological data. Computational intelligence and neuroscience, 2011, 156869. 10.1155/2011/156869 [DOI] [PMC free article] [PubMed] [Google Scholar]
- Park S, Torrisi S, Townsend JD, Beckett A, & Feinberg DA (2021). Highly accelerated submillimeter resolution 3D GRASE with controlled T2 blurring in T2 -weighted functional MRI at 7 Tesla: A feasibility study. Magnetic resonance in medicine, 85(5), 2490–2506. 10.1002/mrm.28589 [DOI] [PMC free article] [PubMed] [Google Scholar]
- Pervaiz U, Vidaurre D, Woolrich MW, & Smith SM (2020). Optimising network modelling methods for fMRI. NeuroImage, 211, 116604. 10.1016/j.neuroimage.2020.116604 [DOI] [PMC free article] [PubMed] [Google Scholar]
- Poldrack RA, Laumann TO, Koyejo O, Gregory B, Hover A, Chen MY, Gorgolewski KJ, Luci J, Joo SJ, Boyd RL, Hunicke-Smith S, Simpson ZB, Caven T, Sochat V, Shine JM, Gordon E, Snyder AZ, Adeyemo B, Petersen SE, Glahn DC, … Mumford JA (2015). Long-term neural and physiological phenotyping of a single human. Nature communications, 6, 8885. 10.1038/ncomms9885 [DOI] [PMC free article] [PubMed] [Google Scholar]
- Popov T, Jensen O, & Schoffelen JM (2018). Dorsal and ventral cortices are coupled by cross-frequency interactions during working memory. NeuroImage, 178, 277–286. 10.1016/j.neuroimage.2018.05.054 [DOI] [PubMed] [Google Scholar]
- Power JD, Mitra A, Laumann TO, Snyder AZ, Schlaggar BL, & Petersen SE (2014). Methods to detect, characterize, and remove motion artifact in resting state fMRI. NeuroImage, 84, 320–341. 10.1016/j.neuroimage.2013.08.048 [DOI] [PMC free article] [PubMed] [Google Scholar]
- Power JD, Plitt M, Gotts SJ, Kundu P, Voon V, Bandettini PA, & Martin A (2018). Ridding fMRI data of motion-related influences: Removal of signals with distinct spatial and physical bases in multiecho data. Proceedings of the National Academy of Sciences of the United States of America, 115(9), E2105–E2114. 10.1073/pnas.1720985115 [DOI] [PMC free article] [PubMed] [Google Scholar]
- Power JD, Plitt M, Laumann TO, & Martin A (2017). Sources and implications of whole-brain fMRI signals in humans. NeuroImage, 146, 609–625. 10.1016/j.neuroimage.2016.09.038 [DOI] [PMC free article] [PubMed] [Google Scholar]
- Power JD, Schlaggar BL, & Petersen SE (2015). Recent progress and outstanding issues in motion correction in resting state fMRI. NeuroImage, 105, 536–551. 10.1016/j.neuroimage.2014.10.044 [DOI] [PMC free article] [PubMed] [Google Scholar]
- Prior FW, Brunsden B, Hildebolt C, Nolan TS, Pringle M, Vaishnavi SN, & Larson-Prior LJ (2009). Facial recognition from volume-rendered magnetic resonance imaging data. IEEE transactions on information technology in biomedicine : a publication of the IEEE Engineering in Medicine and Biology Society, 13(1), 5–9. 10.1109/TITB.2008.2003335 [DOI] [PubMed] [Google Scholar]
- Purcell S, Cherny SS, & Sham PC (2003). Genetic Power Calculator: design of linkage and association genetic mapping studies of complex traits. Bioinformatics (Oxford, England), 19(1), 149–150. 10.1093/bioinformatics/19.1.149 [DOI] [PubMed] [Google Scholar]
- Reuben DB, Magasi S, McCreath HE, Bohannon RW, Wang YC, Bubela DJ, Rymer WZ, Beaumont J, Rine RM, Lai JS, & Gershon RC (2013). Motor assessment using the NIH Toolbox. Neurology, 80(11 Suppl 3), S65–S75. 10.1212/WNL.0b013e3182872e01 [DOI] [PMC free article] [PubMed] [Google Scholar]
- Reveley C, Seth AK, Pierpaoli C, Silva AC, Yu D, Saunders RC, Leopold DA, & Ye FQ (2015). Superficial white matter fiber systems impede detection of long-range cortical connections in diffusion MR tractography. Proceedings of the National Academy of Sciences of the United States of America, 112(21), E2820–E2828. 10.1073/pnas.1418198112 [DOI] [PMC free article] [PubMed] [Google Scholar]
- Robinson EC, Garcia K, Glasser MF, Chen Z, Coalson TS, Makropoulos A, Bozek J, Wright R, Schuh A, Webster M, Hutter J, Price A, Cordero Grande L, Hughes E, Tusor N, Bayly PV, Van Essen DC, Smith SM, Edwards AD, Hajnal J, … Rueckert D (2018). Multimodal surface matching with higher-order smoothness constraints. NeuroImage, 167, 453–465. 10.1016/j.neuroimage.2017.10.037 [DOI] [PMC free article] [PubMed] [Google Scholar]
- Robinson EC, Jbabdi S, Glasser MF, Andersson J, Burgess GC, Harms MP, Smith SM, Van Essen DC, & Jenkinson M (2014). MSM: a new flexible framework for Multimodal Surface Matching. NeuroImage, 100, 414–426. 10.1016/j.neuroimage.2014.05.069 [DOI] [PMC free article] [PubMed] [Google Scholar]
- Rosen BQ, & Halgren E (2021). A Whole-Cortex Probabilistic Diffusion Tractography Connectome. eNeuro, 8(1), ENEURO.0416–20.2020. 10.1523/ENEURO.0416-20.2020 [DOI] [PMC free article] [PubMed] [Google Scholar]
- Sadeghi-Tarakameh A, DelaBarre L, Lagore RL, Torrado-Carvajal A, Wu X, Grant A, Adriany G, Metzger GJ, Van de Moortele PF, Ugurbil K, Atalar E, & Eryaman Y (2020). In vivo human head MRI at 10.5T: A radiofrequency safety study and preliminary imaging results. Magnetic resonance in medicine, 84(1), 484–496. 10.1002/mrm.28093 [DOI] [PMC free article] [PubMed] [Google Scholar]
- Safadi Z, Grisot G, Jbabdi S, Behrens TE, Heilbronner SR, McLaughlin N, Mandeville J, Versace A, Phillips ML, Lehman JF, Yendiki A, & Haber SN (2018). Functional Segmentation of the Anterior Limb of the Internal Capsule: Linking White Matter Abnormalities to Specific Connections. The Journal of neuroscience : the official journal of the Society for Neuroscience, 38(8), 2106–2117. 10.1523/JNEUROSCI.2335-17.2017 [DOI] [PMC free article] [PubMed] [Google Scholar]
- Salimi-Khorshidi G, Douaud G, Beckmann CF, Glasser MF, Griffanti L, & Smith SM (2014). Automatic denoising of functional MRI data: combining independent component analysis and hierarchical fusion of classifiers. NeuroImage, 90, 449–468. 10.1016/j.neuroimage.2013.11.046 [DOI] [PMC free article] [PubMed] [Google Scholar]
- Schaefer A, Kong R, Gordon EM, Laumann TO, Zuo XN, Holmes AJ, Eickhoff SB, & Yeo B (2018). Local-Global Parcellation of the Human Cerebral Cortex from Intrinsic Functional Connectivity MRI. Cerebral cortex (New York, N.Y. : 1991), 28(9), 3095–3114. 10.1093/cercor/bhx179 [DOI] [PMC free article] [PubMed] [Google Scholar]
- Scheffer LK, Xu CS, Januszewski M, Lu Z, Takemura SY, Hayworth KJ, Huang GB, Shinomiya K, Maitlin-Shepard J, Berg S, Clements J, Hubbard PM, Katz WT, Umayam L, Zhao T, Ackerman D, Blakely T, Bogovic J, Dolafi T, Kainmueller D, … Plaza SM (2020). A connectome and analysis of the adult Drosophila central brain. eLife, 9, e57443. 10.7554/eLife.57443 [DOI] [PMC free article] [PubMed] [Google Scholar]
- Schilling K, Gao Y, Janve V, Stepniewska I, Landman BA, & Anderson AW (2018). Confirmation of a gyral bias in diffusion MRI fiber tractography. Human brain mapping, 39(3), 1449–1466. 10.1002/hbm.23936 [DOI] [PMC free article] [PubMed] [Google Scholar]
- Schilling KG, Petit L, Rheault F, Remedios S, Pierpaoli C, Anderson AW, Landman BA, & Descoteaux M (2020). Brain connections derived from diffusion MRI tractography can be highly anatomically accurate-if we know where white matter pathways start, where they end, and where they do not go. Brain structure & function, 225(8), 2387–2402. 10.1007/s00429-020-02129-z [DOI] [PMC free article] [PubMed] [Google Scholar]
- Schmitz D, Muenzing S, Schober M, Schubert N, Minnerop M, Lippert T, Amunts K, & Axer M (2018). Derivation of Fiber Orientations From Oblique Views Through Human Brain Sections in 3D-Polarized Light Imaging. Frontiers in neuroanatomy, 12, 75. 10.3389/fnana.2018.00075 [DOI] [PMC free article] [PubMed] [Google Scholar]
- Schwarz CG, Kremers WK, Wiste HJ, Gunter JL, Vemuri P, Spychalla AJ, Kantarci K, Schultz AP, Sperling RA, Knopman DS, Petersen RC, Jack CR Jr, & Alzheimer's Disease Neuroimaging Initiative (2021). Changing the face of neuroimaging research: Comparing a new MRI de-facing technique with popular alternatives. NeuroImage, 231, 117845. 10.1016/j.neuroimage.2021.117845 [DOI] [PMC free article] [PubMed] [Google Scholar]
- Sereno MI, Dale AM, Reppas JB, Kwong KK, Belliveau JW, Brady TJ, Rosen BR, & Tootell RB (1995). Borders of multiple visual areas in humans revealed by functional magnetic resonance imaging. Science (New York, N.Y.), 268(5212), 889–893. 10.1126/science.7754376 [DOI] [PubMed] [Google Scholar]
- Setsompop K, Gagoski BA, Polimeni JR, Witzel T, Wedeen VJ, & Wald LL (2012). Blipped-controlled aliasing in parallel imaging for simultaneous multislice echo planar imaging with reduced g-factor penalty. Magnetic resonance in medicine, 67(5), 1210–1224. 10.1002/mrm.23097 [DOI] [PMC free article] [PubMed] [Google Scholar]
- Setsompop K, Kimmlingen R, Eberlein E, Witzel T, Cohen-Adad J, McNab JA, Keil B, Tisdall MD, Hoecht P, Dietz P, Cauley SF, Tountcheva V, Matschl V, Lenz VH, Heberlein K, Potthast A, Thein H, Van Horn J, Toga A, Schmitt F, … Wald LL (2013). Pushing the limits of in vivo diffusion MRI for the Human Connectome Project. NeuroImage, 80, 220–233. 10.1016/j.neuroimage.2013.05.078 [DOI] [PMC free article] [PubMed] [Google Scholar]
- Sham PC, Cherny SS, Purcell S, & Hewitt JK (2000). Power of linkage versus association analysis of quantitative traits, by use of variance-components models, for sibship data. American journal of human genetics, 66(5), 1616–1630. 10.1086/302891 [DOI] [PMC free article] [PubMed] [Google Scholar]
- Shamosh NA, Deyoung CG, Green AE, Reis DL, Johnson MR, Conway AR, Engle RW, Braver TS, & Gray JR (2008). Individual differences in delay discounting: relation to intelligence, working memory, and anterior prefrontal cortex. Psychological science, 19(9), 904–911. 10.1111/j.1467-9280.2008.02175.x [DOI] [PubMed] [Google Scholar]
- Smith SM, Beckmann CF, Andersson J, Auerbach EJ, Bijsterbosch J, Douaud G, Duff E, Feinberg DA, Griffanti L, Harms MP, Kelly M, Laumann T, Miller KL, Moeller S, Petersen S, Power J, Salimi-Khorshidi G, Snyder AZ, Vu AT, Woolrich MW, … WU-Minn HCP Consortium (2013). Resting-state fMRI in the Human Connectome Project. NeuroImage, 80, 144–168. 10.1016/j.neuroimage.2013.05.039 [DOI] [PMC free article] [PubMed] [Google Scholar]
- Smith SM, Hyvärinen A, Varoquaux G, Miller KL, & Beckmann CF (2014). Group-PCA for very large fMRI datasets. NeuroImage, 101, 738–749. 10.1016/j.neuroimage.2014.07.051 [DOI] [PMC free article] [PubMed] [Google Scholar]
- Smith SM, Miller KL, Moeller S, Xu J, Auerbach EJ, Woolrich MW, Beckmann CF, Jenkinson M, Andersson J, Glasser MF, Van Essen DC, Feinberg DA, Yacoub ES, & Ugurbil K (2012). Temporally-independent functional modes of spontaneous brain activity. Proceedings of the National Academy of Sciences of the United States of America, 109(8), 3131–3136. 10.1073/pnas.1121329109 [DOI] [PMC free article] [PubMed] [Google Scholar]
- Smith SM, Nichols TE, Vidaurre D, Winkler AM, Behrens TE, Glasser MF, Ugurbil K, Barch DM, Van Essen DC, & Miller KL (2015). A positive-negative mode of population covariation links brain connectivity, demographics and behavior. Nature neuroscience, 18(11), 1565–1567. 10.1038/nn.4125 [DOI] [PMC free article] [PubMed] [Google Scholar]
- Somerville LH, Bookheimer SY, Buckner RL, Burgess GC, Curtiss SW, Dapretto M, Elam JS, Gaffrey MS, Harms MP, Hodge C, Kandala S, Kastman EK, Nichols TE, Schlaggar BL, Smith SM, Thomas KM, Yacoub E, Van Essen DC, & Barch DM (2018). The Lifespan Human Connectome Project in Development: A large-scale study of brain connectivity development in 5–21 year olds. NeuroImage, 183, 456–468. 10.1016/j.neuroimage.2018.08.050 [DOI] [PMC free article] [PubMed] [Google Scholar]
- Sotiropoulos SN, Hernández-Fernández M, Vu AT, Andersson JL, Moeller S, Yacoub E, Lenglet C, Ugurbil K, Behrens T, & Jbabdi S (2016). Fusion in diffusion MRI for improved fibre orientation estimation: An application to the 3T and 7T data of the Human Connectome Project. NeuroImage, 134, 396–409. 10.1016/j.neuroimage.2016.04.014 [DOI] [PMC free article] [PubMed] [Google Scholar]
- Sotiropoulos SN, Jbabdi S, Xu J, Andersson JL, Moeller S, Auerbach EJ, Glasser MF, Hernandez M, Sapiro G, Jenkinson M, Feinberg DA, Yacoub E, Lenglet C, Van Essen DC, Ugurbil K, Behrens TE, & WU-Minn HCP Consortium (2013). Advances in diffusion MRI acquisition and processing in the Human Connectome Project. NeuroImage, 80, 125–143. 10.1016/j.neuroimage.2013.05.057 [DOI] [PMC free article] [PubMed] [Google Scholar]
- Sotiropoulos SN, Moeller S, Jbabdi S, Xu J, Andersson JL, Auerbach EJ, Yacoub E, Feinberg D, Setsompop K, Wald LL, Behrens TE, Ugurbil K, & Lenglet C (2013). Effects of image reconstruction on fiber orientation mapping from multichannel diffusion MRI: reducing the noise floor using SENSE. Magnetic resonance in medicine, 70(6), 1682–1689. 10.1002/mrm.24623 [DOI] [PMC free article] [PubMed] [Google Scholar]
- Sotiropoulos SN, & Zalesky A (2019). Building connectomes using diffusion MRI: why, how and but. NMR in biomedicine, 32(4), e3752. 10.1002/nbm.3752 [DOI] [PMC free article] [PubMed] [Google Scholar]
- Sporns O, Tononi G, & Kötter R (2005). The human connectome: A structural description of the human brain. PLoS computational biology, 1(4), e42. 10.1371/journal.pcbi.0010042 [DOI] [PMC free article] [PubMed] [Google Scholar]
- St-Onge E, Daducci A, Girard G, & Descoteaux M (2018). Surface-enhanced tractography (SET). NeuroImage, 169, 524–539. 10.1016/j.neuroimage.2017.12.036 [DOI] [PubMed] [Google Scholar]
- Sun J, Yan W, Zhang XN, Lin X, Li H, Gong YM, Zhu XM, Zheng YB, Guo XY, Ma YD, Liu ZY, Liu L, Gao JH, Vitiello MV, Chang SH, Liu XG, & Lu L (2020). Polygenic evidence and overlapped brain functional connectivities for the association between chronic pain and sleep disturbance. Translational psychiatry, 10(1), 252. 10.1038/s41398-020-00941-z [DOI] [PMC free article] [PubMed] [Google Scholar]
- Tadel F, Baillet S, Mosher JC, Pantazis D, & Leahy RM (2011). Brainstorm: a user-friendly application for MEG/EEG analysis. Computational intelligence and neuroscience, 2011, 879716. 10.1155/2011/879716 [DOI] [PMC free article] [PubMed] [Google Scholar]
- Tanno R, Worrall DE, Kaden E, Ghosh A, Grussu F, Bizzi A, Sotiropoulos SN, Criminisi A, & Alexander DC (2021). Uncertainty modelling in deep learning for safer neuroimage enhancement: Demonstration in diffusion MRI. NeuroImage, 225, 117366. 10.1016/j.neuroimage.2020.117366 [DOI] [PubMed] [Google Scholar]
- Tavor I, Parker Jones O, Mars RB, Smith SM, Behrens TE, & Jbabdi S (2016). Task-free MRI predicts individual differences in brain activity during task performance. Science (New York, N.Y.), 352(6282), 216–220. 10.1126/science.aad8127 [DOI] [PMC free article] [PubMed] [Google Scholar]
- Thompson E, Mohammadi-Nejad AR, Robinson EC, Andersson J, Jbabdi S, Glasser MF, Bastiani M, & Sotiropoulos SN (2020). Non-negative data-driven mapping of structural connections with application to the neonatal brain. NeuroImage, 222, 117273. 10.1016/j.neuroimage.2020.117273 [DOI] [PMC free article] [PubMed] [Google Scholar]
- Tisdall MD, Hess AT, Reuter M, Meintjes EM, Fischl B, & van der Kouwe AJ (2012). Volumetric navigators for prospective motion correction and selective reacquisition in neuroanatomical MRI. Magnetic resonance in medicine, 68(2), 389–399. 10.1002/mrm.23228 [DOI] [PMC free article] [PubMed] [Google Scholar]
- Uğurbil K, Xu J, Auerbach EJ, Moeller S, Vu AT, Duarte-Carvajalino JM, Lenglet C, Wu X, Schmitter S, Van de Moortele PF, Strupp J, Sapiro G, De Martino F, Wang D, Harel N, Garwood M, Chen L, Feinberg DA, Smith SM, Miller KL, … WU-Minn HCP Consortium (2013). Pushing spatial and temporal resolution for functional and diffusion MRI in the Human Connectome Project. NeuroImage, 80, 80–104. 10.1016/j.neuroimage.2013.05.012 [DOI] [PMC free article] [PubMed] [Google Scholar]
- Uğurbil K (2021). ULTRAHIGH FIELD and ULTRAHIGH RESOLUTION fMRI. Current opinion in biomedical engineering, 18, 100288. 10.1016/j.cobme.2021.100288 [DOI] [PMC free article] [PubMed] [Google Scholar]
- Van Essen DC, Drury HA, Joshi S, & Miller MI (1998). Functional and structural mapping of human cerebral cortex: solutions are in the surfaces. Proceedings of the National Academy of Sciences of the United States of America, 95(3), 788–795. 10.1073/pnas.95.3.788 [DOI] [PMC free article] [PubMed] [Google Scholar]
- Van Essen DC, & Glasser MF (2018). Parcellating Cerebral Cortex: How Invasive Animal Studies Inform Noninvasive Mapmaking in Humans. Neuron, 99(4), 640–663. 10.1016/j.neuron.2018.07.002 [DOI] [PMC free article] [PubMed] [Google Scholar]
- Van Essen DC, Glasser MF, Dierker DL, & Harwell J (2012a). Cortical parcellations of the macaque monkey analyzed on surface-based atlases. Cerebral cortex (New York, N.Y. : 1991), 22(10), 2227–2240. 10.1093/cercor/bhr290 [DOI] [PMC free article] [PubMed] [Google Scholar]
- Van Essen DC, Glasser MF, Dierker DL, Harwell J, & Coalson T (2012b). Parcellations and hemispheric asymmetries of human cerebral cortex analyzed on surface-based atlases. Cerebral cortex (New York, N.Y. : 1991), 22(10), 2241–2262. 10.1093/cercor/bhr291 [DOI] [PMC free article] [PubMed] [Google Scholar]
- Van Essen DC, Smith J, Glasser MF, Elam J, Donahue CJ, Dierker DL, Reid EK, Coalson T, & Harwell J (2017). The Brain Analysis Library of Spatial maps and Atlases (BALSA) database. NeuroImage, 144(Pt B), 270–274. 10.1016/j.neuroimage.2016.04.002 [DOI] [PMC free article] [PubMed] [Google Scholar]
- Van Essen DC, Smith SM, Barch DM, Behrens TE, Yacoub E, Ugurbil K, & WU-Minn HCP Consortium (2013). The WU-Minn Human Connectome Project: an overview. NeuroImage, 80, 62–79. 10.1016/j.neuroimage.2013.05.041 [DOI] [PMC free article] [PubMed] [Google Scholar]
- Van Essen DC, Jbabdi S, Sotiropoulos SN, Chen C, Dikranian K, Coalson T, Harwell J, Behrens TE and Glasser MF 2014. 'Mapping connections in humans and non-human primates: aspirations and challenges for diffusion imaging.' in Johansen-Berg Heidi Behrens Timothy E.J. (ed.), Diffusion MRI (Academic Press; ). [Google Scholar]
- Vizioli L, Moeller S, Dowdle L, Akcakaya M, De Martino F, Yacoub E, & Ugurbil K (2021). Lowering the Thermal Noise Barrier in Functional Brain Mapping with Magnetic Resonance Imaging. Nature Communications (in press). bioRxiv, 2020–11. 10.1101/2020.11.04.368357 [DOI] [PMC free article] [PubMed] [Google Scholar]
- Volkow ND, Koob GF, Croyle RT, Bianchi DW, Gordon JA, Koroshetz WJ, Pérez-Stable EJ, Riley WT, Bloch MH, Conway K, Deeds BG, Dowling GJ, Grant S, Howlett KD, Matochik JA, Morgan GD, Murray MM, Noronha A, Spong CY, Wargo EM, … Weiss S (2018). The conception of the ABCD study: From substance use to a broad NIH collaboration. Developmental cognitive neuroscience, 32, 4–7. 10.1016/j.dcn.2017.10.002 [DOI] [PMC free article] [PubMed] [Google Scholar]
- Vu AT, Auerbach E, Lenglet C, Moeller S, Sotiropoulos SN, Jbabdi S, Andersson J, Yacoub E, & Ugurbil K (2015). High resolution whole brain diffusion imaging at 7T for the Human Connectome Project. NeuroImage, 122, 318–331. 10.1016/j.neuroimage.2015.08.004 [DOI] [PMC free article] [PubMed] [Google Scholar]
- Vu AT, Beckett A, Setsompop K, & Feinberg DA (2018). Evaluation of SLIce Dithered Enhanced Resolution Simultaneous MultiSlice (SLIDER-SMS) for human fMRI. NeuroImage, 164, 164–171. 10.1016/j.neuroimage.2017.02.001 [DOI] [PMC free article] [PubMed] [Google Scholar]
- Wang F, Dong Z, Tian Q, Liao C, Fan Q, Hoge WS, Keil B, Polimeni JR, Wald LL, Huang SY, & Setsompop K (2021). In vivo human whole-brain Connectom diffusion MRI dataset at 760 μm isotropic resolution. Scientific data, 8(1), 122. 10.1038/s41597-021-00904-z [DOI] [PMC free article] [PubMed] [Google Scholar]
- Wang L, Mruczek RE, Arcaro MJ, & Kastner S (2015). Probabilistic Maps of Visual Topography in Human Cortex. Cerebral cortex (New York, N.Y. : 1991), 25(10), 3911–3931. 10.1093/cercor/bhu277 [DOI] [PMC free article] [PubMed] [Google Scholar]
- Warrington S, Bryant KL, Khrapitchev AA, Sallet J, Charquero-Ballester M, Douaud G, Jbabdi S, Mars RB, & Sotiropoulos SN (2020). XTRACT - Standardised protocols for automated tractography in the human and macaque brain. NeuroImage, 217, 116923. 10.1016/j.neuroimage.2020.116923 [DOI] [PMC free article] [PubMed] [Google Scholar]
- Weintraub S, Dikmen SS, Heaton RK, Tulsky DS, Zelazo PD, Bauer PJ, Carlozzi NE, Slotkin J, Blitz D, Wallner-Allen K, Fox NA, Beaumont JL, Mungas D, Nowinski CJ, Richler J, Deocampo JA, Anderson JE, Manly JJ, Borosh B, Havlik R, … Gershon RC (2013). Cognition assessment using the NIH Toolbox. Neurology, 80(11 Suppl 3), S54–S64. 10.1212/WNL.0b013e3182872ded [DOI] [PMC free article] [PubMed] [Google Scholar]
- White JG, Southgate E, Thomson JN, & Brenner S (1986). The structure of the nervous system of the nematode Caenorhabditis elegans. Philosophical transactions of the Royal Society of London. Series B, Biological sciences, 314(1165), 1–340. 10.1098/rstb.1986.0056 [DOI] [PubMed] [Google Scholar]
- Wilkinson MD, Dumontier M, Aalbersberg IJ, Appleton G, Axton M, Baak A, Blomberg N, Boiten JW, da Silva Santos LB, Bourne PE, Bouwman J, Brookes AJ, Clark T, Crosas M, Dillo I, Dumon O, Edmunds S, Evelo CT, Finkers R, Gonzalez-Beltran A, … Mons B (2016). The FAIR Guiding Principles for scientific data management and stewardship. Scientific data, 3, 160018. 10.1038/sdata.2016.18 [DOI] [PMC free article] [PubMed] [Google Scholar]
- Winkler AM, Ridgway GR, Webster MA, Smith SM, & Nichols TE (2014). Permutation inference for the general linear model. NeuroImage, 92(100), 381–397. 10.1016/j.neuroimage.2014.01.060 [DOI] [PMC free article] [PubMed] [Google Scholar]
- Wu X, Auerbach EJ, Vu AT, Moeller S, Lenglet C, Schmitter S, Van de Moortele PF, Yacoub E, & Uğurbil K (2018). High-resolution whole-brain diffusion MRI at 7T using radiofrequency parallel transmission. Magnetic resonance in medicine, 80(5), 1857–1870. 10.1002/mrm.27189 [DOI] [PMC free article] [PubMed] [Google Scholar]
- Wu X, Auerbach EJ, Vu AT, Moeller S, Van de Moortele PF, Yacoub E, & Uğurbil K (2019). Human Connectome Project-style resting-state functional MRI at 7 Tesla using radiofrequency parallel transmission. NeuroImage, 184, 396–408. 10.1016/j.neuroimage.2018.09.038 [DOI] [PMC free article] [PubMed] [Google Scholar]
- Wu Y, Hong Y, Feng Y, Shen D, & Yap PT (2020). Mitigating gyral bias in cortical tractography via asymmetric fiber orientation distributions. Medical image analysis, 59, 101543. 10.1016/j.media.2019.101543 [DOI] [PMC free article] [PubMed] [Google Scholar]
- Xu J, Moeller S, Auerbach EJ, Strupp J, Smith SM, Feinberg DA, Yacoub E, & Uğurbil K (2013). Evaluation of slice accelerations using multiband echo planar imaging at 3 T. NeuroImage, 83, 991–1001. 10.1016/j.neuroimage.2013.07.055 [DOI] [PMC free article] [PubMed] [Google Scholar]
- Yarnykh VL (2007). Actual flip-angle imaging in the pulsed steady state: a method for rapid three-dimensional mapping of the transmitted radiofrequency field. Magnetic resonance in medicine, 57(1), 192–200. 10.1002/mrm.21120 [DOI] [PubMed] [Google Scholar]
- Yendiki A, Aggarwal M, Axer M, Howard AF, van Walsum AMVC, & Haber SN (2021). Post mortem mapping of connectional anatomy for the validation of diffusion MRI. BioRxiv. 10.1101/2021.04.16.440223 [DOI] [PMC free article] [PubMed] [Google Scholar]