

Abstract
Previous research has described the criminal justice system as a “labor market institution.” In recent years, however, research on the relationship between the criminal justice system and the labor market has focused primarily on the negative impact of criminal justice involvement on an individual’s ability to find work post-release. This article explores how workers’ exposure to the criminal justice system is related to labor organization—a labor market institution through which workers in the United States have secured benefits for themselves and which, structurally, has mitigated income inequality. Across four analyses, we find a negative relationship between exposure to the criminal justice system and involvement in labor organizations; and we present evidence that this relationship results from employers’ increased power over those so exposed. Mass incarceration may discipline low-wage workers by decreasing their likelihood of participating in organizations through which they might gain economic power individually and collectively.
The Disciplining Effect of Mass Incarceration on Labor Organization
Despite a large and growing body of scholarship on the rise of mass incarceration and its collateral social, political, economic, and public health consequences (Drucker 2011; Lerman and Weaver 2014; Manza and Uggen 2006; Rose and Clear 1998; Weaver and Lerman 2010), there have been few attempts to examine how the contemporary criminal justice system influences the structure of the labor market as a whole. Instead, those interested in the relationship between mass incarceration and the labor market have, in recent years, tended to focus on the effect of the “mark” of a criminal record on job attainment, an individual-level outcome (Pager 2003). This paper revives an older tradition in the sociology of punishment (Rusche and Kirchheimer 2003[1939]) to argue that workers’ exposure to the criminal justice system increases employers’ power over them, making workers less likely to advocate for themselves on the job. In so doing, the article offers a new angle on the drivers of contemporary economic inequality, and a more critical perspective on recent research and advocacy observing the workplace productivity of those recently released from prison (Lundquist et al 2018).
We demonstrate that exposure to the criminal justice system may have a more direct impact on worker disempowerment and disorganization than previously recognized. Across three separate analyses, which focus on different levels of exposure to the criminal justice system (zip code, state, county, individual) and distinct but related outcomes (individuals’ likelihood of joining a workplace voluntary association, and bargaining units’ likelihood of winning an NLRB election), we show that high rates of criminal justice exposure are negatively associated with involvement in labor organization. Our fourth and final analysis explores a possible causal mechanism driving these associations—increased employer power over those in contact with the criminal justice system—by examining the impact of incarceration on an individual’s likelihood of quitting a job.
Building on an emerging scholarship that links exposure to the criminal justice system to individuals’ and communities’ withdrawal from civic life—through declining political participation (Lerman and Weaver 2014; Manza and Uggen 2006; Rose and Clear 1998; Weaver and Lerman 2010) or “system avoidance” (Brayne 2014)—we conclude that exposure to the criminal justice system is associated with reduced workplace collective action because it enhances employers’ power over workers, and thus impacts the structure of the low-wage labor market in ways that further disadvantage those already most marginalized. In the next section, we review scholarship on the relationship between incarceration and the labor market and scholarship on the predictors of involvement in workplace collective action. Next, we outline our four separate analyses, which we then present sequentially. We conclude by considering the implications of our analysis for the sociology of punishment, as well as for the labor movement, and outline possible directions for future research.
The Criminal Justice System and the Labor Market
Despite a large and growing interest in the collateral consequences of mass incarceration for individuals, families, and communities, there have been few attempts at measuring the impact of the criminal justice system on the structure of the labor market as a whole. One important exception is the work of Bruce Western and Katherine Beckett (1999) who argue that the prison ought to be understood as a “labor market institution” in so far as it reduces conventional measures of unemployment in the short-term by “concealing joblessness among able-bodied, working-age men” (see also Jankovic 1977); and exacerbates unemployment in the long-term by “damaging the job prospects of ex-convicts after release” (p. 1031). Western and Beckett reject the conventional wisdom that the United States is the exemplar of neoclassical (“free”) labor markets, arguing instead that “incarceration generate[s] a sizeable, nonmarket reallocation of labor, overshadowing state intervention through social policy” (p. 1031). The free U.S. labor market, they argue, is embedded within and dependent on institutions like the U.S. criminal justice system.1
It remains somewhat unclear in this formative work how, exactly, we ought to conceptualize the criminal justice system as a labor market institution. While Western and Beckett begin their article by comparing the criminal justice system with the labor market institutions of Europe, where “[u]nions set wages for entire economies, and welfare states significantly influence the supply and demand of labor” (p. 1031), they end the article by acknowledging that the criminal justice system “may not directly regulate markets like labor unions or social policy” though “this broader institutional context still strongly influences labor market outcomes” (p. 1053).
But to argue that the criminal justice system impacts the economic outcomes of those who come into contact with it—an important point, by now well established in the literature (Pager 2003)—is different from arguing that the criminal justice system impacts the distribution (Rose 1985) of economic fortunes available in the U.S. labor market, which is implied by the idea of a labor market institution (Freeman, Hersch, and Mishel 2007). On this latter idea the existing empirical evidence is surprisingly thin (Western and Muller 2013). Indeed, by a 2001 article, Beckett and Western (2001) discuss the evolution of mass incarceration without explicit reference to the labor market. Here they argue that the criminal justice system has become an institutional substitute for the social welfare system with respect to the governance of the “marginal,” and observe a state-level association between rising incarceration rates and declining social welfare spending in the years 1975–1995. But whether and how this new governance relates to the labor market is no longer at issue.
Loïc Wacquant (2009) extends theoretically the idea of the criminal justice system as a labor market institution. Like Western and Beckett, he identifies a conjunction between the criminal justice and the social welfare systems insofar as they each “govern” the poor. But Wacquant goes further by arguing that the advent of mass incarceration and the retreat of social welfare are a part of the same neoliberal transformation of the state, in which “the state stridently reasserts its responsibility, potency, and efficiency in the narrow register of crime management at the very moment when it proclaims and organizes its own impotence on the economic front….” (p. xviii).
Wacquant suggests that the expansion of the criminal justice system regulates the contemporary labor market in two distinct ways. First, the criminal justice system “neutralizes and warehouses…those rendered wholly superfluous by the recomposition of the demand for labor” (p. 7).2 Such an idea is broadly consistent with Western and Beckett’s notion that the prison artificially deflates unemployment rates by imprisoning the otherwise unemployed. In this sense, the prison does not impact the structure of the labor market so much as it responds to an exogenous shock which has left poor Black men systematically excluded from it (Gilmore 2007).
Second, Wacquant argues, the criminal justice system “works to bend the fractions of the working class recalcitrant to the discipline of the new fragmented service wage-labor…” (Ibid.). Here, he argues that the criminal justice system plays a more active role in the job market—the “invisible hand” of the low wage labor market is facilitated by an “iron fist” of carceral institutions that discipline poor male workers the same way that workfare programs discipline poor female workers. This interpretation of the function of the prison echoes Marxist accounts of the history of the workhouse and prison (Melossi and Pavarini 2018[1981]; Rusche and Kirchheimer 2003[1939]).3 But it is one of the first contemporary accounts of the rise of mass incarceration to consider the impact of an expanded criminal justice system on the structure of the low-wage labor market.4
How might this “iron fist” work? The intriguing though somewhat underdeveloped implication of Wacquant’s argument is that an expanded carceral state disciplines workers to accept low-wage, precarious jobs that they would otherwise resist—a point developed by Gretchen Purser (2012) in her searing ethnography of day labor agencies in Oakland and Baltimore. The criminal justice system does not only manage a surplus population but is a labor market institution in the more productive sense of the term, in that it encourages the compliance of low-wage workers with the demands of their employers and inhibits the development of other sorts of labor market institutions—like labor unions—that might alter the distribution of economic opportunities available (Farrell 2008; McLennan 2008; Thompson 2010).5 The criminal justice system may produce economic insecurity not only as a result of its effects on individual workers but also by its effects on the structure of the labor market as a whole. And its expansion may not just reflect a new governing logic, as contemporary scholars have argued (Garland 2001; Wacquant 2009; Western and Beckett 1999), but also help to constitute a new regime of low-wage work.
The Propensity to Organize
One basic assumption of this paper is that the propensity of individual workers, and groups of workers within particular workplaces, to engage in workplace collective action is an outcome worthy of study. This is because, particularly in the political economic context of the United States, workers are able to gain symbolic and material rewards in their jobs through such meso-level action (Card and Olson 1995; Fantasia 1989; Freeman and Medoff 1984).
In recent years, scholars interested in the labor movement have tended not to focus on workers’ propensity to organize so much as on a host of other factors responsible for labor’s declining power over time: on broad processes of globalization and skill-biased technological change, increasingly aggressive employer opposition to unionization, a political environment increasingly hostile to labor unions, and the bureaucratization and conservativism of American labor unions themselves (Fantasia and Voss 2004; Farber and Western 2001; Kristal and Cohen 2016; Rosenfeld 2014). In a decomposition of the decline in labor unions between 1973 and 1998, Farber and Western (2001) show that the vast majority of the decline can be explained as a result of differential growth rates between union and nonunion sectors, rather than changes in new organizing activity. The implication, they suggest, is that broad structural changes to the economy—rather than changes in worker subjectivity or union activities—are primarily responsible for union decline during the period.
That said, a focus on broad shifts in American economy and politics, undoubtedly important for explaining the decline of traditional labor unions, likely does not fully explain why labor continues to remain so weak today (Patterson 2004). Throughout American history, labor organization has tended to grow in “spurts” like the periods 1880–1886, 1897–1904, 1916–1921, 1934–1939, and 1942–1945 (Freeman 1988), often times of economic and political upheaval, outside of which labor organization has typically eroded. It is perhaps unsurprising, then, that an analysis of trends in union density outside of one of these spurts—like Farber and Western’s—finds a negligible contribution of variation in new organizing to union decline. The more relevant question, though difficult to answer empirically, may be why we have not seen another spurt in new organizing in recent years, despite periods of upheaval such as the 2007–2008 global financial crisis and the various movements it helped spawn. Farber and Western (2001, p. 461) themselves concede that “while future union growth may depend on another spurt occurring, we have little guide to what might trigger such an episode of dramatic growth.”
In sum, while it would be a mistake to attribute declines in labor’s bargaining power solely to workers’ declining propensity to organize, it also seems a mistake to try to understand contemporary economic inequality and working class powerlessness without attending to the situations of workers themselves; the ways in which changes in social and political life are refracted through the worldviews of workers in ways that make them less amenable to workplace collective action (see, for instance, Silva 2013). The ubiquity of the criminal justice system in the lives of many low-wage workers today may serve to increase the perceived risks of workplace collective action, and thus have a chilling effect on labor organization.
An older labor relations literature once attended in detail to the individual and ecological correlates of support for workplace collective action. This literature consistently found that workers of color and workers of lower socioeconomic status (SES) were more supportive of labor organization than white workers and higher SES workers, respectively (Cornfield 1991; Cornfield and Kim 1994; Fiorito and Greer 1982; Kochan 1979; Voos 1983). Why might this be the case? Cornfield and his colleagues (1991, 1994) offered the most nuanced account. First, they argued, these workers tended to be less satisfied in their jobs, though this seems likely to be a feature of a job more than of an individual and so may not explain different attitudes among similarly situated workers. Second, and more interestingly, they found that more disadvantaged workers tended to be more supportive of the collectivistic strategies pursued by unions, independent of job satisfaction. In this account, labor organization was viewed as a substitute for individual job mobility, mobility which was blocked either by one’s lack of human capital (for less-educated workers) or by employer discrimination (for workers of color) (Cornfield and Kim 1994). Such an account is echoed more recently by Rosenfeld and Kleykamp (2012), who interpret Black people’s disproportionate support for unions as a result of the protections these organizations have been able to offer against forms of racial discrimination embedded in patterns of arbitrary authority in the unorganized workplace.
In recent years, the relationships between racialized group membership, class, and union support and membership have been less central to the concerns of labor scholars. This seems not to be because these relationships have dissipated so much as because they are now taken for granted. At the individual level, for example, Black people continue to be far more supportive of labor unions than whites (Ferguson 2016c; Freeman and Rogers 1999). The fact that Black people have been overrepresented in labor unions since the Civil Rights Movement has meant that the decline of organized labor has exacerbated racial wage inequality (Rosenfeld and Kleykamp 2012). In comparison to historical accounts of American labor unions as exclusionary and racist institutions (Bonacich 1976; Frymer 2003), these more recent analyses suggest that today’s “labor movement [is] a remarkably inclusive institution vital for its economic support of African-American men and women” (Rosenfeld and Kleykamp 2012; see also Terry and Lee 2017). Based on this previous literature, we expect that workers of color and workers facing economic hardship will, all things equal, be more likely to support labor organization than their white and more economically secure counterparts.
However, studies of the individual correlates of union support, reviewed above, generally assume that an individual’s decision about joining a labor organization, adjusting for job quality, is determined by one’s beliefs in the efficacy of collective organization compared to one’s anticipated success navigating the job market individually. Yet as scholars of collective action have long been aware (Oliver, Marwell, and Teixeira 1985; Olson 1965) there is an important difference between one’s support for a public good like labor organization in the abstract and one’s likelihood of contributing to a labor organizing effort in practice. In the latter case, one’s decision is influenced not only by the potential rewards to union membership, but also by the potential personal costs of involvement. And one particularly noteworthy factor missing from the literature on the individual correlates of union involvement is the fear that workers may feel about employer retaliation for such organizing activity. Such an oversight may be explained in part by the dependent variable examined in most previous studies (union support rather than involvement in union organizing), and in part by the fact that many previous studies were conducted before the expansion and formalization of the anti-union industry, which has increased the risks associated with involvement in labor organizing (Bronfenbrenner 2009; Logan 2006).
In the contemporary period, one might expect workers’ fear of involvement in an organizing drive to be positively associated with their dependence on the particular employer for whom they work—that is, with an employer’s power over them within the labor market (Emerson 1962). To the extent that an employee can find a comparable job elsewhere, or to the extent that a social safety net buffers an employee from the worst consequences of unemployment, one might expect the threat of employer retaliation for labor organizing activities to be less acute. Conversely, to the extent that comparable work is not available, and to the extent that there is no safety net, one might expect the threat of employer retaliation to dissuade workers from organizing. Preliminary evidence for such a relationship can be found in studies showing that labor militancy is less likely to occur in periods of high unemployment (Fiorito and Greer 1982; Tope and Jacobs 2009). As Tope and Jacobs (2009, p. 848) write, “Higher unemployment reduces strikes and other forms of labor militancy because workers risk losing valuable jobs if they become combative during recessions.” This relationship, presumably, interacts with the degree to which employers pursue anti-union campaigns, and so may have grown alongside the diffusion and deepening of employer anti-union practices.
In sum, existing literature suggests that while some forms of disadvantage are likely to be positively associated with involvement in labor organizing, other forms of disadvantage are likely to suppress it. And exposure to the criminal justice system is a particularly good candidate for the sort of disadvantage that might reduce one’s likelihood for involvement in organizing efforts. First, since the mark of a criminal record has been shown to reduce one’s job prospects (Pager 2003), this necessarily implies that a jobholder with a criminal record is likely to be more dependent on his or her employer than a similarly situated jobholder without one. Such job dependence may deter workers from organizing either through explicit coercion, as in a parole requirement that one remain employed—thus amplifying the personal costs of termination—or implicit coercion, as in an understanding that, because most employers are prejudiced against hiring people with criminal records, this lack of other options enables the employer who will hire them to exploit their vulnerability.
Such an impact may also extend beyond the individual worker. To the extent that incarceration seems a likely alternative to low-wage work for many of those living in neighborhoods most impacted by the criminal justice system, it may serve as a community-level deterrent from involvement in labor organizing. The salience of mass incarceration in such communities may produce latent effects on the perceived risk of organizing their workplaces, as these workers observe the scarce labor market opportunities of friends, colleagues, and family members.
Second, and more generally, exposure to the criminal justice system has been shown to have depoliticizing effects on individuals and on neighborhoods (Burch 2013, 2014; Lerman and Weaver 2014; Weaver and Lerman 2010). Weaver and Lerman (2010) show that individuals’ contact with the criminal justice system is causally related to their withdrawal from politics—specifically, contact is strongly and consistently associated with declining trust in government and a reduction in one’s likelihood of voting, even when the sample is restricted to those who have not formally been excluded from voting. Burch (2013, 2014), in turn, has shown that exposure to the criminal justice system depoliticizes not just individuals but entire neighborhoods. Insofar as contributing to a labor organizing drive is a form of workplace political activity, one would expect that the same mechanisms by which criminal justice exposure reduces individual and neighborhood-level political activity generally would also reduce workers’ propensity to organize.
We do not necessarily expect that exposure to the criminal justice system will have more chilling effects for workers of color than for white workers, but race is nevertheless central to the analyses we present here. Given that Black people continue to be more supportive of labor unions than whites; and given that Black people are disproportionately impacted by all levels of the criminal justice system (Pattillo, Weiman, and Western 2004; Pettit and Western 2004; Western 2006), the negative impact of criminal justice exposure on workplace collective action is likely to be most pronounced within Black communities. While certainly not conclusive, Figure 1, based on data from Current Population Survey March Supplements, shows a sharp decline in Black people’s odds of being members of labor unions (relative to non-Black people) between 2000 and 2014.6 By the end of the first decade of the 21st century, Black people were no longer significantly more likely to be union members than their white counterparts after controlling for confounders like industry, occupation, and education.
Figure 1.
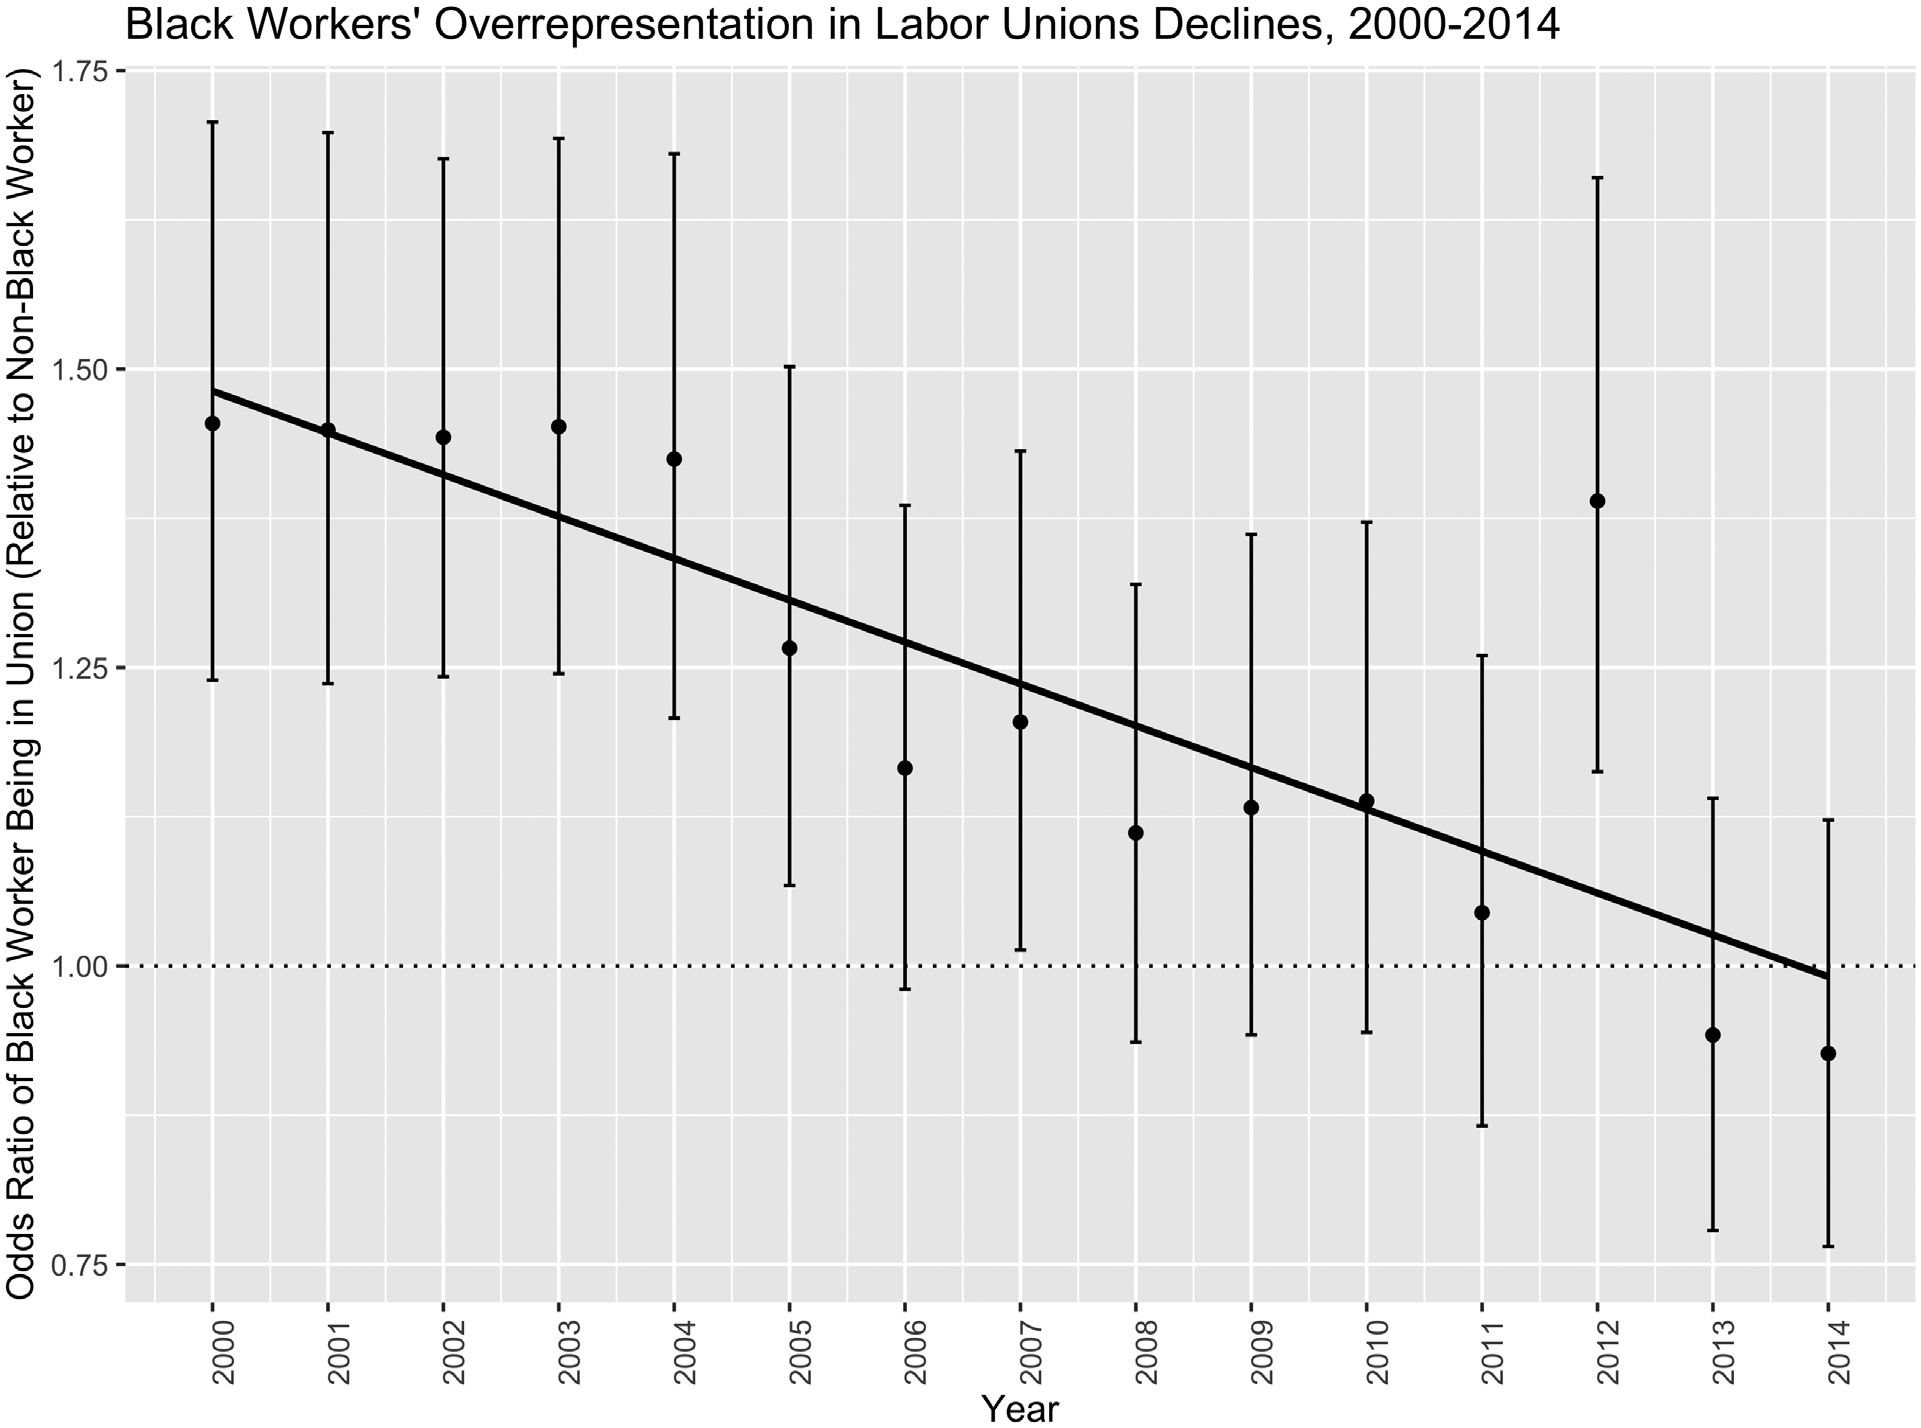
Declines in the overrepresentation of Black workers in labor unions, 2000–2014.
While Black people remain much more supportive of organized labor than their white counterparts, their relative overrepresentation in unions has mostly disappeared. And while there are likely many contributing causes to this trend, one may be the chilling, depoliticizing effect that mass incarceration has had on Black workers—suggesting yet another way in which the criminal justice system (re)makes the meaning of racialized group membership not only within the prison but without (Dunn and Walker 2016).
Methodological Approach
For those interested in the relationship between criminal justice contact and political activity, data availability is a persistent challenge (see Weaver and Lerman 2010, p. 820). The problem is exacerbated in the case of the relationship between criminal justice contact and involvement in labor organizing attempts. Those few established surveys that ask about criminal justice contact, like the National Longitudinal Study of Adolescent to Adult Health and the Fragile Families and Child Wellbeing Study, do not ask about involvement in labor organizing.7
In light of such limitations, data for our analyses come from several different sources, which we combine in a variety of ways to test our hypotheses. While none of our analyses is conclusive on its own, the fact that we see similar patterns across diverse settings and divergent levels of analysis increases our confidence in the validity of the results.
For ease of interpretation, we outline the four analyses here and then present them in detail sequentially (see Figure 2). Our first set of analyses (Analyses 1 and 2) focus on the Organization United for Respect at Walmart (OUR Walmart), a voluntary association of workers at Walmart. Walmart is the nation’s largest low-wage employer and was one of the first large employers in the United States to adopt “fair chance” hiring policies, which make it easier for those with criminal records to get hired (Emsellem and Rodriguez 2015).
Figure 2.
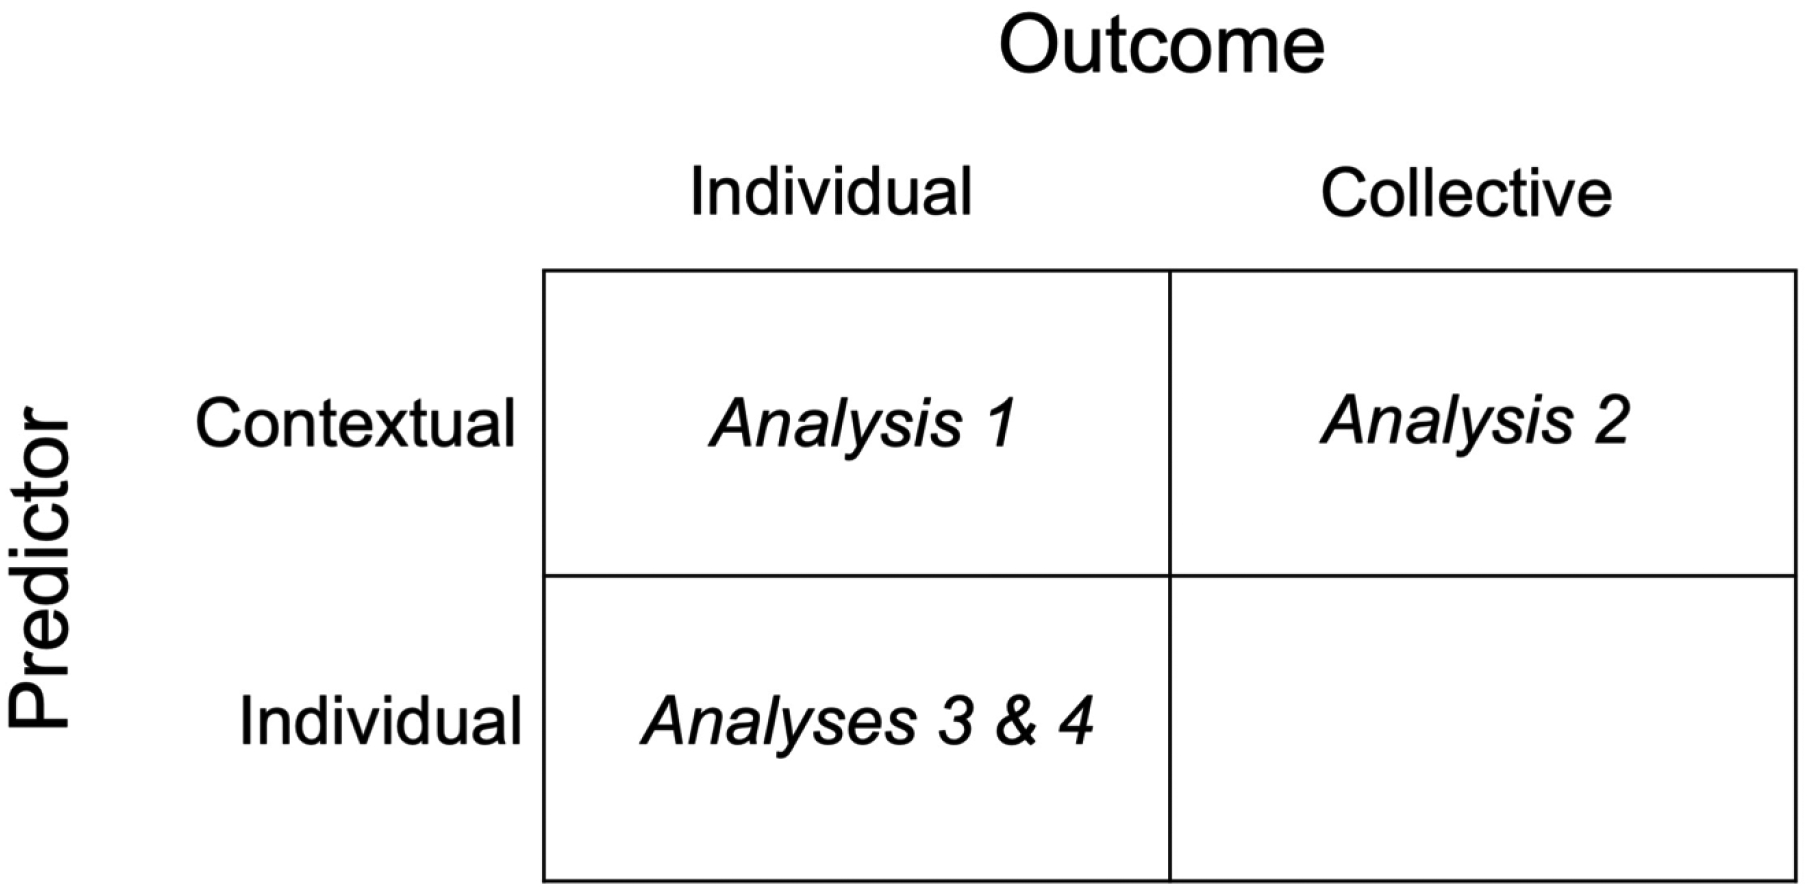
Outline of our analytic strategy.
Since our primary interest is in the effects of community-level criminal justice exposure on labor market outcomes, we begin with an analysis of the effects of community-level incarceration rates on individual-level workplace outcomes. Analysis 1 relies on anonymized administrative data from OUR Walmart and shows that, at the zip code and state levels, after adjusting for potential confounders, community incarceration rates are negatively and significantly associated with an individual’s odds of joining OUR Walmart.
In Analysis 2, in order to address concerns about possible community-level confounders or ecological fallacies, we deepen our analysis of the OUR Walmart data by looking at the relationship between individual-level exposure to the criminal justice system and individual-level workplace outcomes. We present findings from an individual-level survey we conducted with a subsample of OUR Walmart contacts. Here we find suggestive evidence that an individual’s contact with the criminal justice system is negatively associated with joining OUR Walmart.
In Analyses 3, we explore the broader labor market implications of the negative association between criminal justice exposure and workplace collective action. We use Department of Labor data on all National Labor Relations Board (NLRB) union representation elections between 2000 and 2009, and find that, after adjusting for potential confounders, the county-level jail incarceration rate in which a bargaining unit is located is significantly and negatively associated with its odds of winning a union election. This analysis supports the idea that high levels of community-level exposure are negatively associated with workplace-level organizing success, regardless of whether individuals in the unit have themselves been involved in the criminal justice system.
Our fourth and final analysis turns to a large longitudinal dataset, the National Longitudinal Survey of Youth (1979), to explore a potential causal mechanism for the findings in our previous analyses. While these data do not allow us to examine the effects of incarceration on people’s propensity for involvement in workplace collective action (“voice”), they do allow us to examine the consequences of incarceration on individuals’ likelihood of quitting their jobs (“exit”), an alternative strategy for responding to problems at one’s workplace (Hirschman 1970). We find that, conditional on having a job and other job attributes, incarceration persistently decreases one’s odds of quitting one’s job, which we interpret as evidence that, at the individual level, the experience of incarceration increases the extent to which a worker is beholden to an employer. Descriptive data for analyses 1 and 2 is displayed in Table 1 and for analyses 3 and 4 in Table 2.
Table 1.
Characteristics of the OUR Walmart samples
| OUR Walmart – zip code incarceration data | |
|---|---|
| N (%) | |
| Participants | 16,137 |
| States | 2 |
| Zip codes | 1,379 |
| Association member: Yes | 835 (5.2) |
| Association member: No | 15,302 (94.8) |
| Mean (standard deviation, min, max) | |
| Zip code prison admission rate per 1,000 | 5.3 (5.68, 0, 40.2) |
| Percent zip code black | 19.7 (19, 0, 96.7 |
| Percent zip code poor | 21.3 (11.5, 0, 76.3) |
| OUR Walmart – state incarceration data | |
| N (%) | |
| Participants | 68, 653 |
| States | 51 (including Washington, DC) |
| Association member: Yes | 3,215 (5.1) |
| Association member: No | 59,844 (94.9) |
| Mean (standard deviation, min, max) | |
| State incarceration rate per 1,000 | 4.5 (1.3, 1.3, 8.5) |
| Percent county black | 14.6 (12.8, 0.24, 82.6) |
| OUR Walmart – individual-level incarceration data | |
| N (%) | |
| Participants | 691 |
| Association member: Yes | 123 (17.8) |
| Association member: No | 567 (82.2) |
| White | 480 (69.5) |
| Person of color | 211 (30.5) |
| Male | 260 (37.6) |
| Female | 431 (62.4) |
| Ever incarcerated | 19 (2.8) |
| Any criminal justice contact | 27 (4.9) |
Table 2.
Characteristics of the National Labor Relations Board and National Longitudinal Survey of Youth 1979 samples
| National Labor Relations Board Election Data | |
|---|---|
| N (%) | |
| NLRB Cases | 18,318 |
| Years | 2000–2009 |
| States | 46 |
| Counties | 914 |
| NLRB Election Results: Loss | 8,568 (47) |
| NLRB Election Results: Win | 9,750 (53) |
| Mean (standard deviation, min, max) | |
| County jail average daily population rate per 1,000 | 2.40 (1.65, 0, 47.5) |
| County percent black | 15.4 (14.2, 0.03, 80.5) |
| County percent poor | 12.4 (4.7, 2.5, 42.2) |
| County total crime rate | 1 (1, 0, 6.6) |
| State-Industry percent Black | 10.9 (8.1, 0, 58) |
| State-Industry mean income ($) | 37,353 (10,074, 12,132, 85,908) |
| Party control of state legislature | Percent |
| Republican | 42 |
| Democratic | 35 |
| Split | 23 |
| National Longitudinal Survey of Youth 1979 Data | |
| N (%) | |
| Participants ever incarcerated | 697 |
| Race: Black | 345 (49) |
| Race: Hispanic | 137 (20) |
| Race: Non-Black, Non-Hispanic | 215 (31) |
| Male | 621 (89) |
| Female | 76 (11) |
| Years: | 1979–1994, 1996, 1998, 2000, 2002, |
| 2004, 2006, 2008, 2010, 2012, 2014 | |
| Quit Main Job (Person-Year): Yes | 1,312 (15) |
| Quit Main Job (Person-Year): No | 7,660 (85) |
| Job Satisfaction (Person-Year): Satisfied | 8,583 (88) |
| Job Satisfaction (Person-Year): Unsatisfied | 1,184 (12) |
| Mean (standard deviation, min, max) | |
| Age | 30.55 (10.34, 14, 58) |
| Hourly Wage | 16.98 (10.45, 1.76, 75.5) |
| Job Tenure (Weeks) | 213.38 (152.12, 1, 1561) |
| Weeks Worked (Weeks) | 24.49 (21.74, 0, 52) |
Analysis 1: Contextual Exposure to Criminal Justice System and Joining OUR Walmart
Our first set of analyses explores the relationship between individual-level participation in OUR Walmart, on the one hand, and local and state-level rates of criminal justice involvement, on the other.
Previous research has demonstrated extensive, persistent variation in the extent to which local neighborhoods are impacted by mass incarceration, even within the same regions of the country (Sampson and Loeffler 2010). This research has explored the consequences of such local contextual variation on a wide variety of outcomes, from individual-level mental health (Hatzenbuehler et al. 2015), to individual-level political participation and community engagement (Burch 2013, 2014), to community-level outcomes like neighborhood stability and crime (Clear 2008; Clear et al. 2003; Lynch and Sabol 2004; Morenoff and Harding 2014; National Research Council 2014). Our first set of models builds on this literature by examining the relationship between local rates of admission to prison at the zip code level and individual Walmart employees’ likelihood of becoming members of OUR Walmart, among a sample of potential members working in states for which zip code level data was available.
A separate line of research, consistent with but distinct from the first, has explored variation in penal regimes at the state and regional level (Barker 2009; Campbell and Schoenfeld 2013). This literature has demonstrated in rich historical detail the ways in which different political structures and cultures have combined to produce criminal justice systems of dramatically different scales and with different governing logics in different parts of the country. Our second set of models builds on this literature by examining the relationship between state incarceration rates and individual Walmart employees’ likelihood of becoming members of OUR Walmart, among the full sample of potential members. Across these analyses we find evidence that higher rates of exposure to the criminal justice system are associated with lower rates of participation in OUR Walmart, though in these analyses we are unable to rule out unobserved local and state factors that may confound these relationships.
Methods
Data.
OUR Walmart is composed of current and former8 employees of Walmart. The organization was founded in late 2010 in coordination with the United Food and Commercial Workers International Union (UFCW). Such voluntary associations are often discussed as a model for a “new” labor movement that operates outside the representation framework established by the National Labor Relations Act (NLRA) (Aronowitz 2014). OUR Walmart does not seek to win union recognition; rather, it advocates for workers through collective actions such as one-day strikes, through attendance at the company’s annual shareholders’ meeting, through earned and paid media, and through smaller-scale campaigns at specific stores. We make use of an administrative database maintained by OUR Walmart of those workers with whom the organization was in contact between 2010 and 2015. The database includes the stores for which employees worked and whether or not they had become members of the organization. For a subset of workers, we also had access to home zip codes and email addresses.
Zip code level data on prison admission rates for one year, 2008, are publicly available from the Justice Atlas of Sentencing and Corrections (Justice Mapping Center 2010). The Justice Atlas of Sentencing and Corrections (http://www.justiceatlas.org/) is an online tool for mapping at a micro-level the flow of people into and out of the criminal justice system during one year, 2008. Funded by the Ford Foundation, the Pew Charitable Trusts, and the Open Society Institute, it offers zip code level data for 22 states on variables such as rates of admission and release from state prisons and rates of people on probation and parole, though not every variable is available for every state. We limited our zip code level analysis to Texas and Ohio, the two states in which OUR Walmart was active that also had prison admission data at the zip code level. Our zip code level analysis is also limited to the workers for whom we have zip code information within these two states.
State incarceration rate data come from the National Prisoner Statistics Program (Bureau of Justice Statistics 2016c). This program produces annual national- and state-level data on the number of prisoners in state and federal prison facilities. Aggregate data are collected on the racialized group membership and sex of prison inmates, inmates held in private facilities, system capacity, noncitizens, and persons under age 18. Data are from the 50 states’ departments of corrections and the Federal Bureau of Prisons. We merged these data with our other sources by state and year.
Data on zip code crime rates comes from the Uniform Crime Reporting (UCR) Program Data: County-Level Detailed Arrest and Offense Data (Federal Bureau of Investigation 2016). These data include counts of arrests and offenses including murder, rape, robbery, aggravated assault, burglary, larceny, auto theft, and arson. We calculated zip code crime rates using the U.S. Department of Housing and Urban Development’s United States Postal Service Zip Code Crosswalk files, which provide weighting ratios between zip codes and counties. We applied these weights to the UCR’s county-level crime rate data, and then merged these data with our other sources by zip code and year.
Zip code demographic data come from a variety of sources. Zip-code-level racial composition and poverty data were obtained from the American Community Survey (US Census Bureau 2009). Zip code unemployment data come from county-level Bureau of Labor Statistics files, which we weighted as above to obtain zip-code-level estimates.
Measures.
In the analysis of administrative data from OUR Walmart, the outcome of interest is whether respondents signed a membership card (yes/no). This measure was obtained from administrative records. In order to become a member of the organization, a worker must sign a card and agree to pay a small amount ($5) in monthly dues. Members participate in regular meetings with one another, plan and execute local actions, and take part in a broader community of workers and community-members committed to changing company policy. A worker signing a membership card often represents the culmination of other steps at both the worker and store level. At the store level, this process tends to unfold in a predictable way. A paid organizer (some but not all of whom are former workers themselves) makes initial contact with workers in a store through brief and often surreptitious interactions on the floor.9 Oftentimes an organizer will form an organizing committee made up of particularly active members who, in turn, will help the organizer recruit other members. One limit of these data, however, is that we do not know precisely the process by which workers select into being potential members (or contacts) of the organization, or whether and how this process varies across space.
Our exposures of interest are the rate at which people in one’s zip code are admitted to state prisons and the incarceration rate in one’s state, which come from the data sources described above.
Potential confounders include the proportion of Black residents by zip code, proportion of residents living below the poverty line by zip code, unemployment rates by zip code, zip code crime rates, and political party control of the state legislature. Research has shown that people of color and people with low incomes are more likely to support unionization (Ferguson 2016c; Freeman and Rogers 1999) and also more likely to be incarcerated (Bureau of Justice Statistics 2016c). Unemployment rates have been shown to undermine support for labor organization (Tope and Jacobs 2009) and be positively associated with prison admissions. Likewise, zip code crime rates may be a prior common cause of both zip code incarceration rates and likelihood of joining OUR Walmart. Party control of state legislature over time comes from the National Conference of State Legislatures. Party control of the state legislature may influence specific policies and the political climates around criminal justice and organized labor; this in turn may influence incarceration rates and the outcomes of organizing efforts.
Analysis plan.
We fit two sets of three logistic multi-level models with R package ‘lme4’ (Bates et al. 2015). The first set of models estimates the effect of zip code prison admissions on the odds of signing an OUR Walmart membership card. The second set of models estimates the effect of state incarceration rate on the odds of signing an OUR Walmart membership card. For zip code prison admissions models, we included a random intercept for zip code, to account for clustering of individuals within zip codes. For the state incarceration rate models, we included random intercepts for zip code and state, to account for clustering of individuals within zip codes and zip codes within states.
Model 1 in both sets of models regresses union membership on zip code prison admission rate or state incarceration rate, respectively. We expected both exposures to be positively associated with participation in OUR Walmart, given the overrepresentation of Black people and individuals with low incomes in the criminal justice system and these groups’ higher levels of support for labor organizations.
In Model 2, we adjusted for the proportion of Black residents and proportion of poor residents per zip code or county. We expected these variables to confound the relationship between criminal justice involvement and labor organization participation, and that the resulting relationship between incarceration rates and OUR Walmart membership—once confounders were addressed—would be negative. In Model 3, we adjusted for crime rate, unemployment, and party control of state legislature. (There was no variation in party control of state legislature in the zip code prison admissions rate models, so it was added only to the state incarceration rate model.)
Results
Table 1 presents descriptive data for the reduced OUR Walmart zip code prison admissions data, and the complete OUR Walmart state incarceration data. In the zip code-level data, 16,137 workers were contacted from 2 states (Texas and Ohio) and 1,379 zip codes. Of the 16,137 workers contacted, 835 (5.2%) signed an OUR Walmart membership card. The average zip code prison admissions rate was 5.3 per 1,000 and ranged from 0 to 40.2 per 1,000. In the complete OUR Walmart data set, 68,653 workers were contacted from 50 states plus the District of Columbia, 5,139 (5.8%) of whom signed a membership card. The average state incarceration rate was 4.5 per 1,000, and ranged from 1.3 to 8.5 per 1,000.
Exponentiated coefficients (odds ratios), 95% confidence intervals, and p-values for all models are shown in Tables 2–3. The coefficients for the primary independent variables in Tables 2–3 are for a one-unit increase in admission and incarceration rates. We present odds ratios in the text below and in Figure 3.
Table 3.
Logistic multilevel models regressing OUR Walmart membership on zip code incarceration rates (odds ratio for a one-unit increase in rate per 1,000)
| Model 1 | Model 2 | Model 3 | ||||
|---|---|---|---|---|---|---|
| OR | 95% CI | OR | 95% CI | OR | 95% CI | |
| Intercept | 0.02 *** | 0.01 – 0.02 | 0.01 *** | 0.01 – 0.02 | 0.01 *** | 0.01 – 0.02 |
| Zip code incarceration rate | 1.04 * | 1.01 – 1.07 | 0.96 * | 0.92 – 1.00 | 0.96 * | 0.92 – 1.00 |
| Zip code % Black | 1.03 *** | 1.02 – 1.04 | 1.03 *** | 1.02 – 1.04 | ||
| Zip code % Poor | 1.01 | 0.99 – 1.03 | 1.01 | 1.00 – 1.03 | ||
| Zip code crime rate | 0.00 * | 0.00 – 0.00 | ||||
| Zip code unemployment rate | 0.98 | 0.67 – 1.42 | ||||
| Random Effects | ||||||
| σ2 | 3.29 | 3.29 | 3.29 | |||
| τ00 (zip code) | 2.24 | 1.54 | 1.56 | |||
| ICC | 0.41 | 0.32 | 0.32 | |||
| N (zip code) | 1379 | 1378 | 1377 | |||
| Observations | 16137 | 16136 | 16135 | |||
p<0.05
p<0.01
p<0.001
Figure 3.
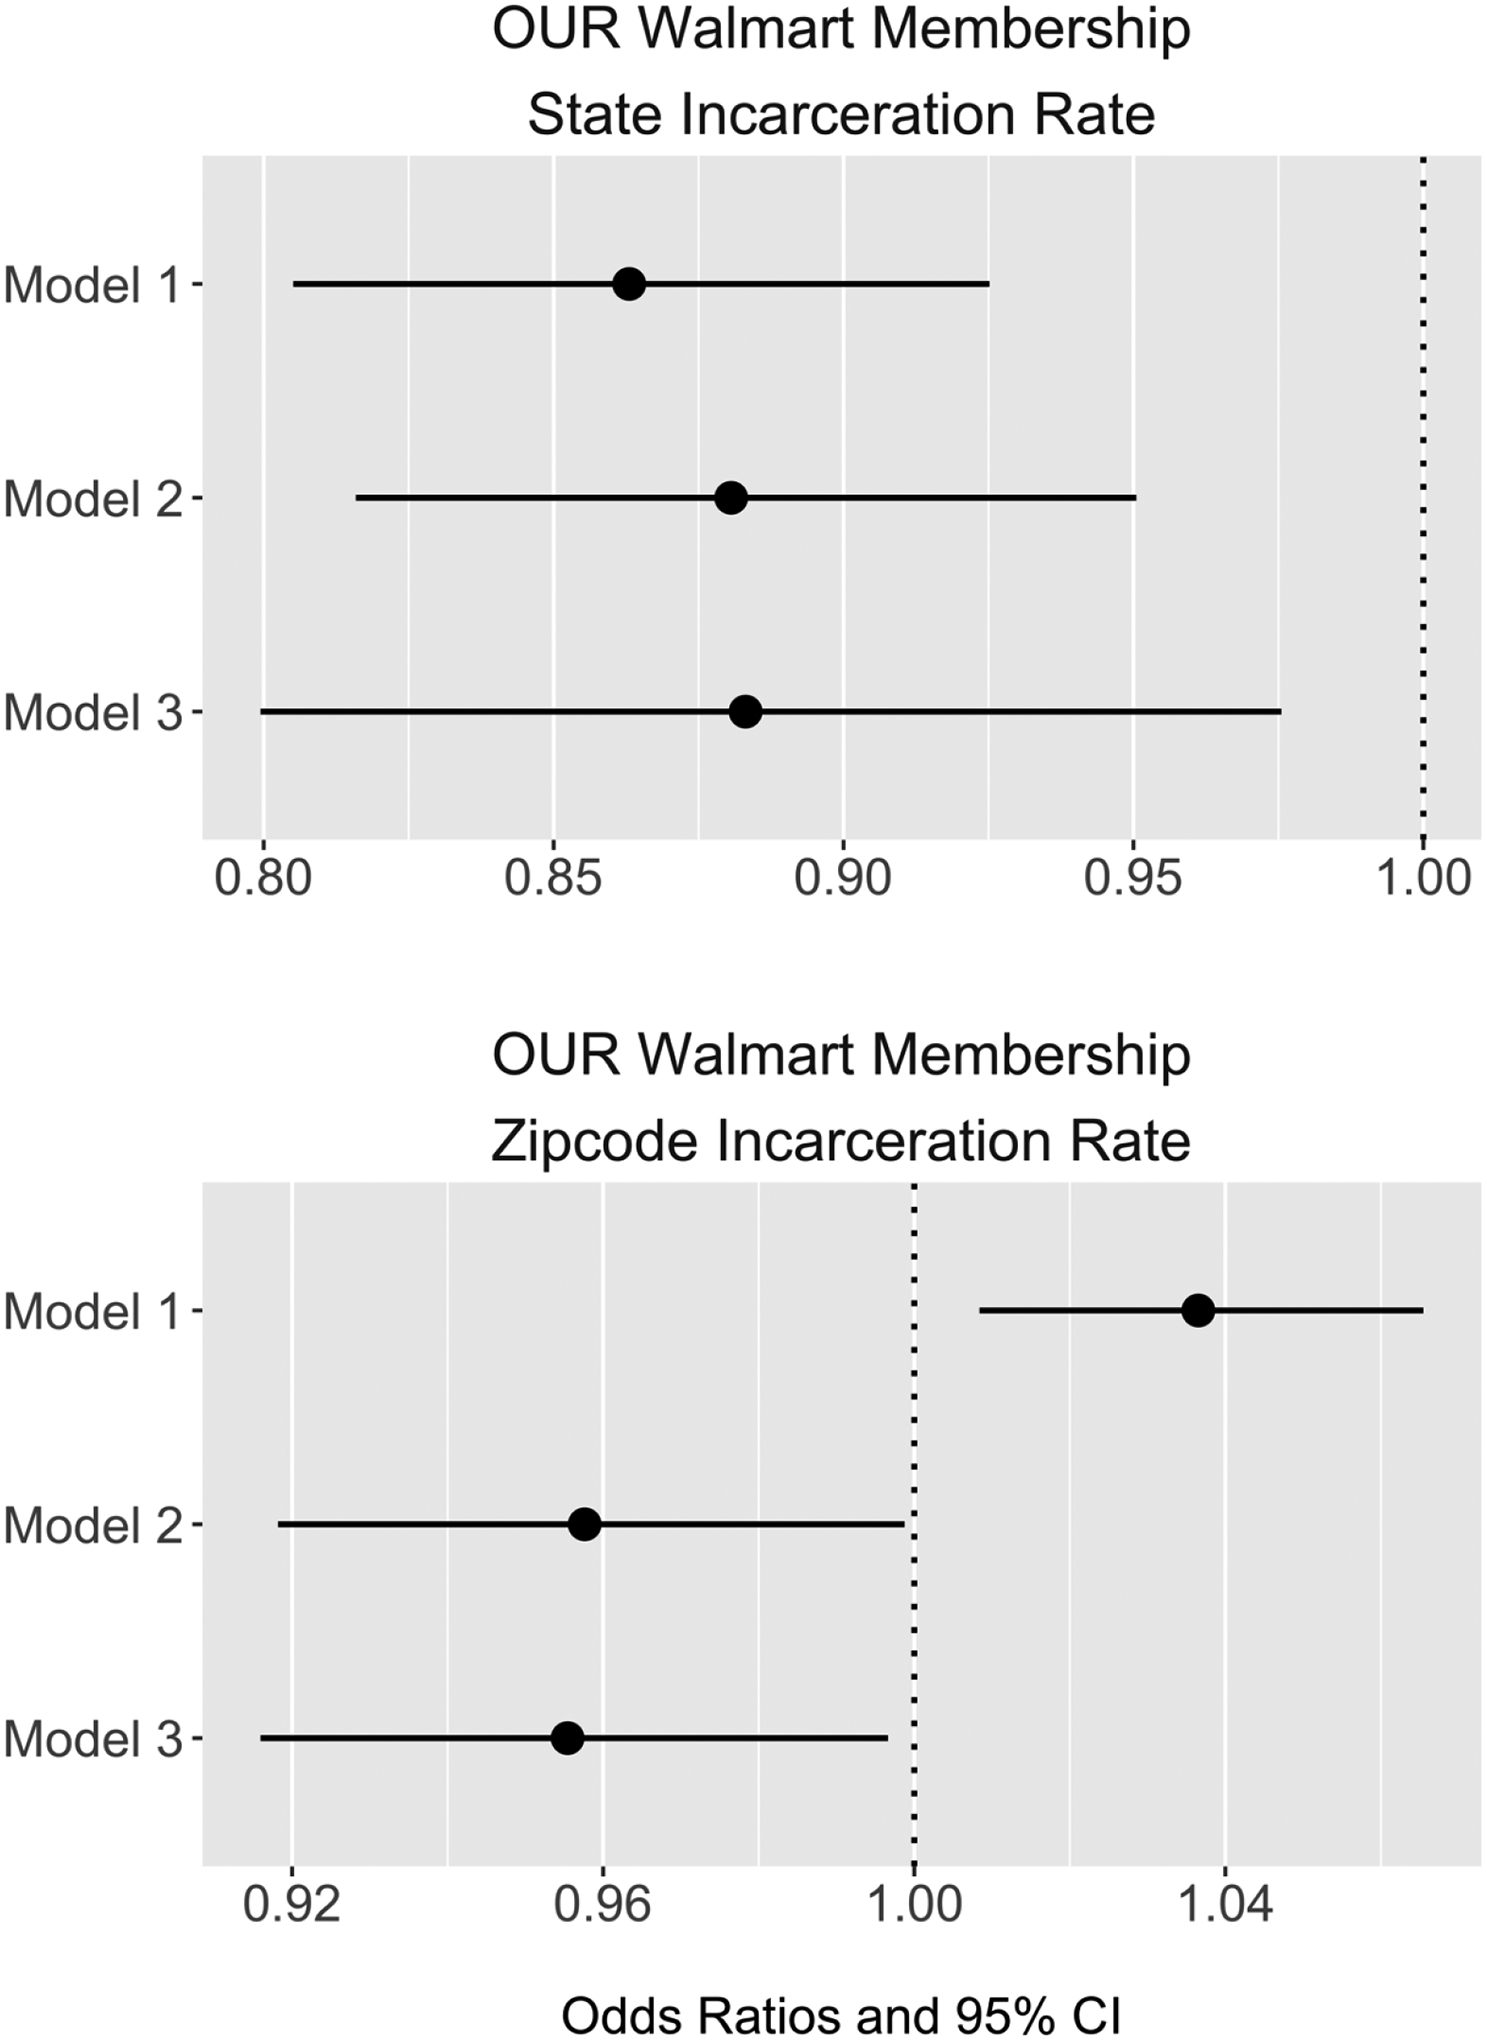
Relationship between a unit increase in zip code incarceration rate (bottom panel), state incarceration rate (top panel) and odds of signing an OUR Walmart membership card.
As we hypothesized, there was a main positive effect of zip code prison admissions rate on OUR Walmart membership. The odds ratio (OR) for signing a membership card was 1.04 (95% confidence interval [CI]: 1.01, 1.07) for a unit increase in zip code prison admissions rate (Figure 3, bottom panel, Model 1). In other words, the odds of signing were 4% higher for a unit increase in prison admissions rate. We hypothesized, however, that this positive relationship was confounded by racialized group membership and income, given that workers of color and poorer employees tend to be more supportive of unionization and overrepresented in the criminal justice system. As expected, after adjusting for the proportion of zip code Black and proportion of zip code poor (Figure 3, bottom panel, Model 2), the direction of this relationship was reversed: the odds of signing an OUR Walmart membership card dropped by 4% for each unit increase in the prison admission rate (OR: 0.96, 95% CI: 0.92, 1.00). This indicates that the proportion of zip code Black and proportion of zip code poor are strong positive confounders of the relationship between zip code prison admission rates and OUR Walmart membership: among zip codes of similar racialized and economic composition, higher prison admission rates reduce the odds of joining OUR Walmart. In Model 3 (Figure 3, bottom panel), we additionally adjust for zip code crime rates. Results were not appreciably different from Model 2. There was no multiplicative effect modification between prison admission rate and either proportion Black or proportion poor. Coefficients and 95% confidence intervals for the complete models are presented in Table 3. In analyses not shown but available upon request, we ran the zip code analyses separately by state for Texas and Ohio, and found results consistent with the results from the pooled sample displayed here.
We found a stronger relationship between state incarceration rates and OUR Walmart membership. All models revealed a negative relationship between state incarceration rate and OUR Walmart membership. Unlike in the zip code level model, there was not a positive main effect of state-level incarceration on OUR Walmart membership. This is likely because, while zip code-level race and income confound the relationship between zip code level prison admission rates and OUR Walmart membership, state level incarceration rates are not similarly confounded by zip code-level race and income.
In the fully adjusted model (Figure 3, top panel, Model 3), the OR for signing an OUR Walmart membership card was 0.88 (95% CI: 0.80, 0.98) for a unit increase in the state incarceration rate. In other words, the odds of signing were 12% lower for a unit increase in the state incarceration rate. There was no multiplicative effect modification between incarceration rate and either the proportion Black or proportion poor. Coefficients and 95% confidence intervals for complete models are presented in Table 4.
Table 4.
Logistic multilevel models regressing OUR Walmart membership on state incarceration rates (odds ratios for a one-unit increase in rate per 1,000)
| Model 1 | Model 2 | Model 3 | ||||
|---|---|---|---|---|---|---|
| OR | 95% CI | OR | 95% CI | OR | 95% CI | |
| Intercept | 0.03 *** | 0.02 – 0.04 | 0.05 *** | 0.03 – 0.07 | 1.53 | 0.91 – 2.55 |
| State incarceration rate | 0.86 *** | 0.81 – 0.93 | 0.88 ** | 0.82 – 0.95 | 0.88 * | 0.80 – 0.98 |
| Zip code % Black | 1.01 ** | 1.00 – 1.02 | 1.02 ** | 1.01 – 1.03 | ||
| Zip code % Poor | 0.95 *** | 0.94 – 0.97 | 1.08 *** | 1.05 – 1.11 | ||
| County code crime rate | 0.99 *** | 0.99 – 1.00 | ||||
| County unemployment rate | 0.49 *** | 0.47 – 0.52 | ||||
| Party control of state legislature | ||||||
| Democratic (reference) | ||||||
| Republican | 0.46 *** | 0.34 – 0.61 | ||||
| Split | 0.53 *** | 0.39 – 0.72 | ||||
| Random Effects | ||||||
| σ2 | 3.29 | 3.29 | 3.29 | |||
| τ00 | ||||||
| state/county | 1.22 | 1.32 | 1.92 | |||
| county | 0.43 | 0.41 | 1.36 | |||
| ICC | 0.33 | 0.35 | 0.50 | |||
| N | ||||||
| state | 51 | 51 | 50 | |||
| county | 2597 | 2596 | 2512 | |||
| Observations | 88557 | 88551 | 88072 | |||
p<0.05
p<0.01
p<0.001
In this first analysis, we find evidence to support the idea that mass incarceration—measured by local prison admission rates and state incarceration rates—is a contextual exposure that reduces individuals’ likelihood of joining a workplace voluntary association, OUR Walmart. In the next analysis, we examine the relationship between an individual worker’s odds of signing an OUR Walmart membership card and individual-level exposure to the criminal justice system.
Analysis 2: Individual Exposure to Criminal Justice and Joining OUR Walmart
Our first analysis provides support for the idea that higher rates of contextual exposure to the criminal justice system are negatively related to a Walmart worker’s odds of joining OUR Walmart. It is possible, however, that unobserved community-level variables might confound the relationships observed above; or that the relationships we observe might be a result of an ecological fallacy. As Sampson and Loeffler (2010) observe, even after controlling for crime rates, local incarceration rates are highly correlated with other forms of neighborhood social disadvantage, and it is difficult to rule out the possibility that these other forms of disadvantage—rather than incarceration rates—may be driving down individuals’ odds of joining OUR Walmart. While our models control for the most obvious confounders, and the positive correlation between some forms of social disadvantage and workplace collective action, reviewed above, complicates any simple story of unmeasured disadvantage confounding the relationships we observe, we nevertheless ought to be cautious in our interpretation of the above results.
Likewise, it is conceivable that community rates of exposure to the criminal justice system do not reduce individuals’ rates of involvement in collective action, but rather that the criminal justice system tends to select on those most likely to participate in workplace collective action, leaving behind those less likely to be involved. In this case the negative associations we find between rates of criminal justice exposure and workplace collective action would be a result of an ecological fallacy.
Our interpretation of the relationships observed above would be strengthened if we also saw a relationship between criminal justice exposure and workplace collective action at the individual level. For this reason, our second analysis examines the relationship between individual-level exposure to the criminal justice system, as reported in the results from a survey we conducted with a subsample of OUR Walmart contacts, and one’s odds of signing an OUR Walmart membership card.
Methods
Data.
Between February 24 and March 23, 2017, we sent an online survey to the subset of workers in OUR Walmart’s administrative dataset for whom we had valid email addresses. Of 19,672 people emailed, 690 (or 3.5%) completed the survey. This is, admittedly, a low response rate of the already selective group of low-wage retail workers who came into contact with OUR Walmart, which is why we present these results with caveats and emphasize that they be interpreted with caution. Nevertheless, these preliminary data allow us to match individual-level variables that are not captured in the administrative data, such as contact with the criminal justice system, as well as other forms of hardship and other demographic variables, with administrative records indicating whether or not workers joined OUR Walmart. Other data come from the sources described in the first two analyses.
Measures.
The outcome of interest is whether the individual signed an OUR Walmart membership card. Our online survey asked three questions related to respondents’ contact with the criminal justice system prior to getting a job at the retailer: whether the respondent had ever spent time in jail or prison, whether the respondent had ever been convicted of a felony, and whether the respondent had ever spent time on probation or parole. We created a measure of incarceration (ever spent time in jail or prison, yes/no), and a measure of any contact with the justice system by collapsing responses to all three questions into a dichotomous “any contact” versus “no contact” variable.
Potential confounders include racialized group membership, sex, wage, education, and state incarceration rate. We also controlled for a count of hardships that might be associated with criminal justice contact and with one’s odds of becoming a member of OUR Walmart, such as whether someone had experienced an eviction, used food stamps, gone hungry, gone into debt because of a medical emergency, or experienced or witnessed violence.
Analysis plan.
Model 1 regresses OUR Walmart membership on history of incarceration. In Model 2, we control for racialized group membership, wage, and sex. In Model 3, we control for a count of individual-level hardships, as described above. In Model 4, we control for state incarceration rate. In a second set of models, we regress OUR Walmart membership on a measure of any contact with the criminal justice system (any/none). We also explored whether there was multiplicative effect modification between incarceration rates and racialized and economic composition of zip codes or counties. We repeated this modeling strategy with “any contact” as the exposure of interest.
Results
Table 1 shows that, of the 691 respondents to the individual-level survey, 17.8% were OUR Walmart members, nearly 70% were white, 62.4% were women, 2.8% had ever been incarcerated, and 4.9% had any criminal justice system contact.
Our findings regarding the relationship between individual-level contact with the criminal justice system and OUR Walmart membership are preliminary, due to the limitations of these data, including a low response rate and a sample of respondents that is, relative to the workforce as a whole, disproportionately white and female, and therefore likely underrepresents individuals with incarceration histories. These findings are nevertheless suggestive (Figure 4 and Table 5).
Figure 4.
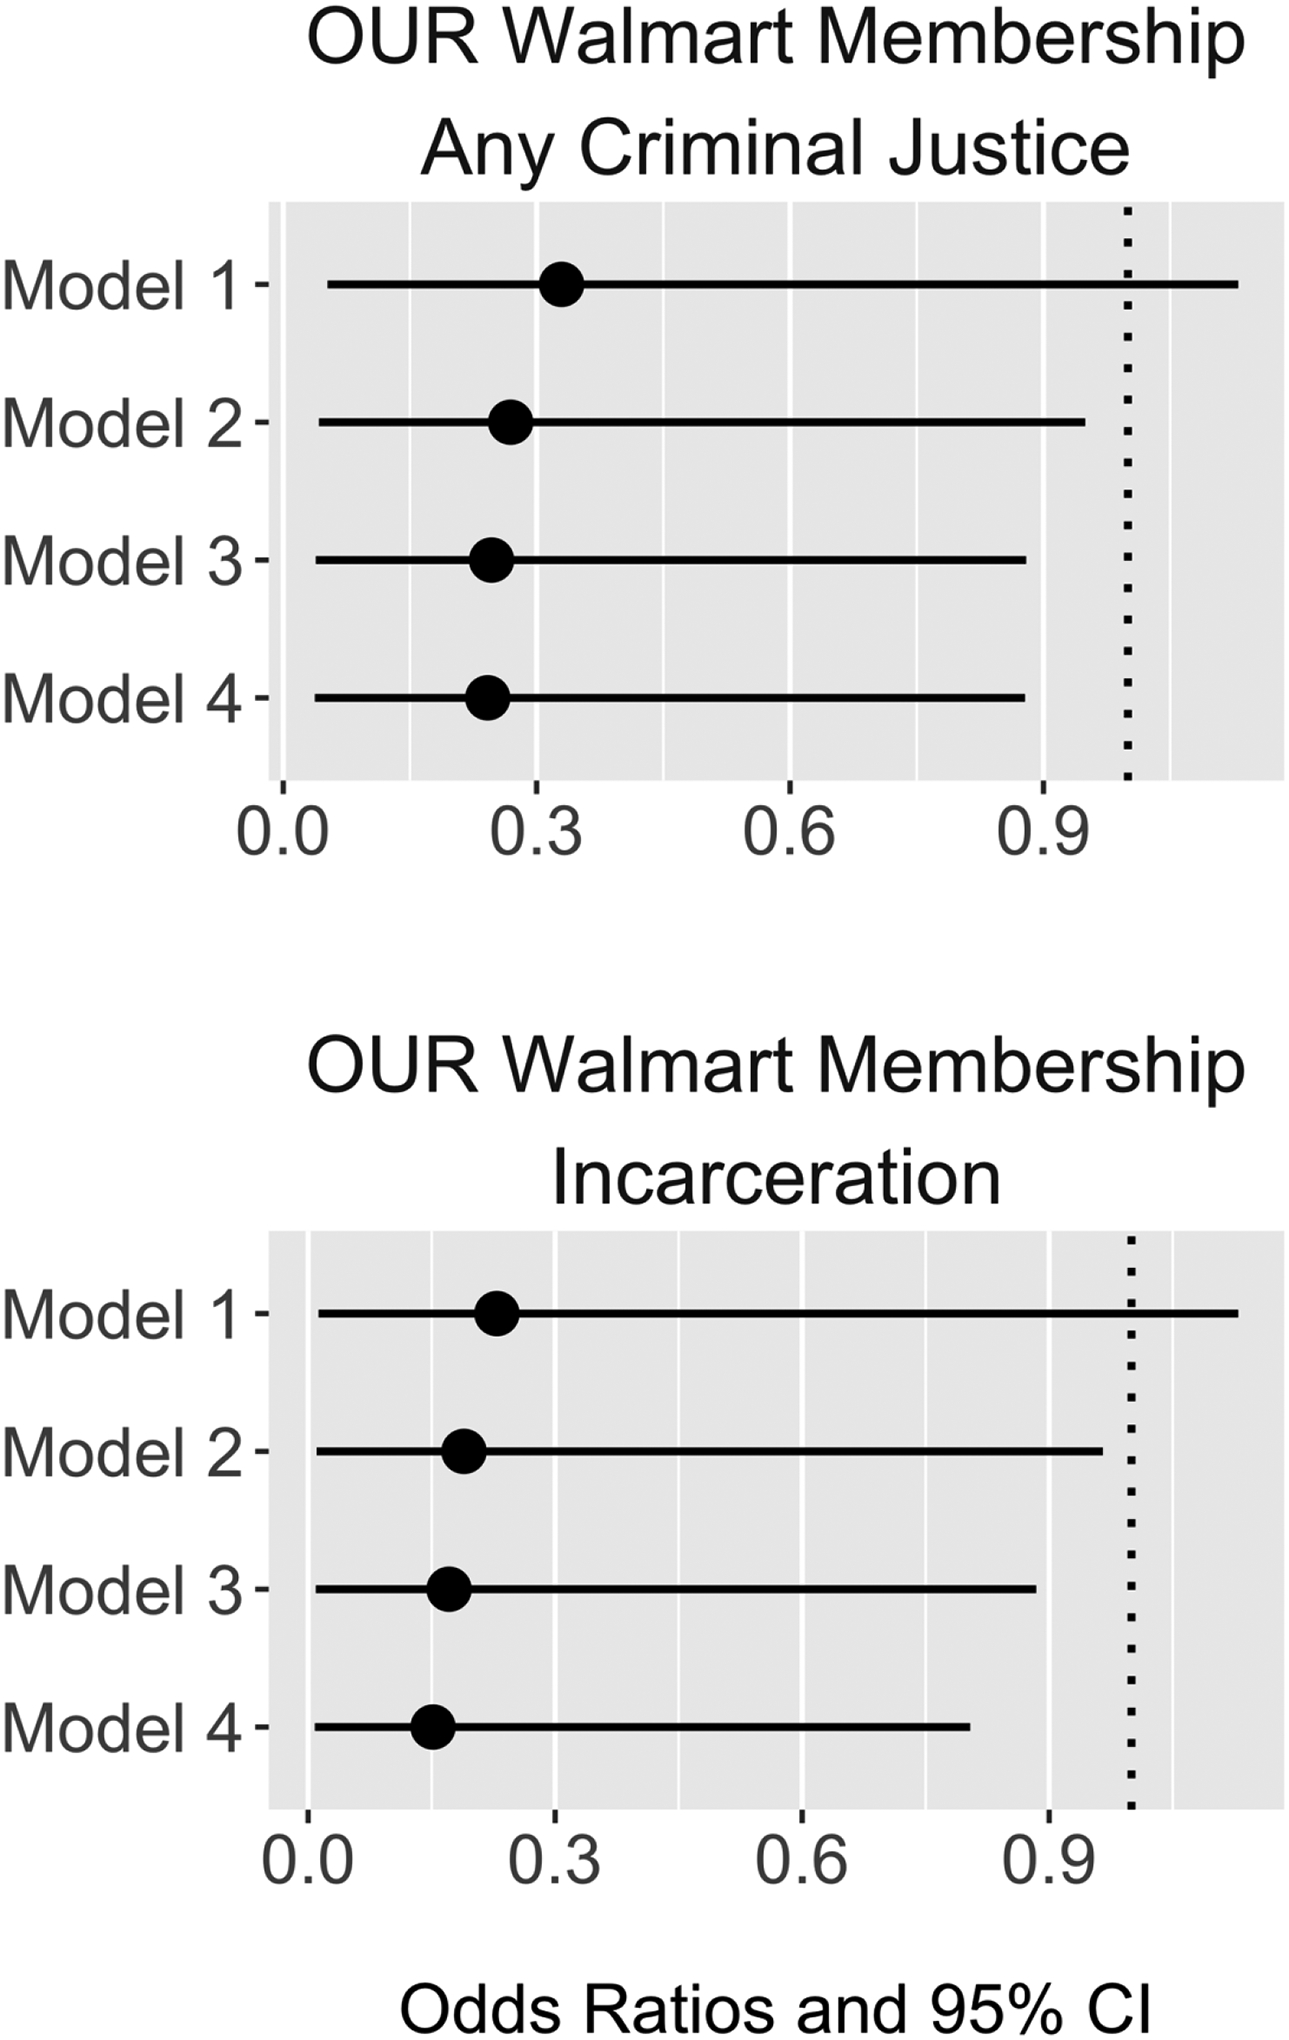
Relationship between individual history of incarceration (bottom panel), any criminal justice contact (top panel) and odds of signing an OUR Walmart membership card
Table 5.
Logistic multilevel models regressing OUR Walmart membership on individual-level contact with the criminal justice system (any/none) and history of incarceration (yes/no).
| Model 1 | Model 2 | Model 3 | Model 4 | |||||
|---|---|---|---|---|---|---|---|---|
| OR | 95% CI | OR | 95% CI | OR | 95% CI | OR | 95% CI | |
| Ever Incarcerated | ||||||||
| (Intercept) | 0.24*** | 0.19 – 0.30 | 0.86 | 0.30 −2.52 | 0.67 | 0.22 −2.09 | 2.17 | 0.57–8.71 |
| Ever Incarcerated | 0.23• | 0.01 – 1.13 | 0.19* | 0.01 −0.97 | 0.17* | 0.01 −0.88 | 0.15* | 0.01–0.80 |
| Racialized group | ||||||||
| POC (ref) | ||||||||
| White | 0.58* | 0.35 −0.96 | 0.6• | 0.36 −1.01 | 0.62• | 0.37 −1.05 | ||
| Sex | ||||||||
| Women (ref) | ||||||||
| Men | 1.41 | 0.90 −2.21 | 1.45 | 0.91 −2.28 | 1.55• | 0.97 −2.47 | ||
| Wage | 0.92* | 0.85 −0.99 | 0.92* | 0.86 −1.00 | 0.93* | 0.85 −1.00 | ||
| Education | ||||||||
| <= High school degree (ref) | ||||||||
| Some college | 1.21 | 0.70 −2.12 | 1.23 | 0.71 −2.16 | 1.21 | 0.69 −2.14 | ||
| Associates degree | 0.85 | 0.39 −1.78 | 0.88 | 0.40 −1.84 | 0.81 | 0.37 −1.72 | ||
| Bachelors degree | 0.53 | 0.21 −1.21 | 0.56 | 0.22 −1.28 | 0.52 | 0.20 −1.21 | ||
| > Bachelors degree | 1.37 | 0.54 −3.27 | 1.3 | 0.49 −3.19 | 1.19 | 0.45 −2.93 | ||
| Hardship count | 1.08 | 0.94 −1.24 | 1.08 | 0.94 −1.25 | ||||
| State incarceration rate | 0.997** | 0.61 −0.90 | ||||||
| Observations | 544 | 511 | 508 | 508 | ||||
| Any Criminal Justice Contact | ||||||||
| (Intercept) | 0.24 | 0.19–0.3 | 0.88 | 0.31–2.59 | 0.68 | 0.22–2.11 | 2.1 | 0.55–8.42 |
| Any criminal justice contact | 0.33• | 0.05–1.13 | 0.27* | 0.04–0.95 | 0.25* | 0.04–0.88 | 0.24* | 0.04–0.88 |
| Racialized group | ||||||||
| POC (ref) | ||||||||
| White | 0.63* | 0.35–0.97 | 0.61• | 0.37–1.02 | 0.63• | 0.38–1.06 | ||
| Sex | ||||||||
| Women (ref) | ||||||||
| Men | 1.40 | 0.89–2.21 | 1.45 | 0.92–2.29 | 1.55• | 0.97–2.47 | ||
| Wage | 0.91* | 0.85–0.99 | 0.93* | 0.86–1.00 | 0.92* | 0.85–0.99 | ||
| Education | ||||||||
| <= High school degree (ref) | ||||||||
| Some college | 1.15 | 0.69–2.09 | 1.21 | 0.7–2.13 | 1.18 | 0.68–2.1 | ||
| Associates degree | 0.78 | 0.38–1.73 | 0.85 | 0.39–1.79 | 0.8 | 0.36–1.69 | ||
| Bachelors degree | 0.55 | 0.21–1.2 | 0.55 | 0.22–1.27 | 0.51 | 0.2–1.2 | ||
| > Bachelors degree | 1.39 | 0.56–3.43 | 1.36 | 0.51–3.36 | 1.24 | 0.46–3.08 | ||
| Hardship count | 0.31–2.59 | 1.09 | 0.94–1.25 | 1.08 | 0.94–1.25 | |||
| State incarceration rate | 0.997** | 0.995–0.999 | ||||||
| Observations | 541 | 510 | 507 | 507 | ||||
<= 0.001,
<= 0.005,
<= 0.05,
< 0.1
After controlling for respondents’ racialized group membership, sex, wage, education, hardship count, and state incarceration rate, individuals with a history of incarceration had 0.15 (95% CI: 0.01, 0.80) times the odds (or an 85% reduction in odds) of joining OUR Walmart. Individuals who had experienced any contact with the criminal justice system (felony convictions, probation or parole, or incarceration) had 0.24 (95% CI: 0.04, 0.88) times the odds (or a 75% reduction in odds) of joining OUR Walmart.
This analysis finds preliminary evidence that individuals with prior contact with the criminal justice system may have lower odds of joining a workplace voluntary association. The following two analyses extend beyond the case of OUR Walmart, on the one hand to explore the broader implications of this negative relationship on the strength of the labor movement; and, on the other, to identify the causal impact of prior incarceration on a worker’s power in relationship to one’s employer.
Analysis 3: Contextual Exposure to Criminal Justice and NLRB Election Outcomes
Our first two analyses provide support for the idea that exposure to the criminal justice system—at both the contextual level and the individual level—is negatively related to a Walmart worker’s odds of joining OUR Walmart.
In this third analysis, we broaden our focus from Walmart workers to all workers involved in National Labor Relations Board (NLRB) elections between 2000 and 2009. We also shift our attention from an individual’s odds of joining a workplace voluntary association, an individual-level outcome, to a bargaining unit’s odds of winning an NLRB election, a collective outcome. If contextual exposure to the criminal justice system reduces an individual’s likelihood of participating in workplace collective action, we would expect that it would also reduce a group’s likelihood of winning a union representation election.
It is true that unions tend not to file for NLRB elections unless they have reason to believe they can win them. If anything, this means that our estimate of the chilling effect of exposure to the criminal justice system may be conservative, or biased towards the null, in that we are unable to observe the organizing campaigns that never get off the ground.
Like the zip code analysis above, the primary independent variable in which we are interested is local exposure to the criminal justice system. The NLRB records the county location for each bargaining unit involved in a representation election. We are thus able to match county-level election data to county-level criminal justice exposure, as indicated by the average daily incarceration rate of the county’s jail. Granted, criminal justice involvement in the county in which an NLRB election takes place is an imperfect measure of workers’ exposure to the criminal justice system, since workers may commute from another county to work. Yet any such commuting should, again, bias our results towards the null. Moreover, the county is the geographic level closest to the commuting zone for which we are also able to obtain precise estimates of criminal justice exposure, making it the most appropriate geographic level for our analysis. As in the analyses above, we hypothesize that higher levels of county-level exposure to the criminal justice system will be negatively associated with a bargaining unit’s odds of winning an NLRB election.
Methods
Data.
Data on NLRB union representation elections from 2000–2009 come from the NLRB’s Case Activity Tracking system, which the NLRB posted to data.gov under the Obama Administration. As noted by Ferguson (Ferguson 2016a, 2016b), there are a number of errors with the way these data were posted; for example, the 2000 and 2003 full-file links were pointed at the incorrect file names. Ferguson was able to use the NLRB’s standard naming conventions to find the correct files for download. Cleaned NLRB data are available on Ferguson’s Github repository (Ferguson 2016b). Each case in the NLRB data contains information on the results of the unionization vote (win/loss), the number of votes for and against, the number of eligible employees, the Federal Information Processing Standards (FIPS) county code of the employer, the North American Industry Classification System code, and other information about the bargaining unit and petitioning union. We de-duplicated the NRLB data and merged it with other data sources by FIPS county code and year, keeping cases in counties for which we had jail data, years 2000–2009.
Jail incarceration data come from the Annual Survey of Jails (Bureau of Justice Statistics 2016a), which provides yearly data on local jails and jail inmates. A stratified random sample procedure is used to select facilities for the survey. Facilities are stratified by size of average daily inmate population. A new sample panel is selected every five years. Data are collected every year, except in years when a complete Census of Jails is conducted (Bureau of Justice Statistics 2016b). The Annual Survey of Jails and Census of Jails tracks key characteristics of jails and jail inmates, and provide national estimates of the number of inmates by legal status, average daily population, admissions, releases, and facility characteristics such as capacity and jail programs. We combined the ASJ with the Census of Jails to create data for years 2000–2009. Because a new sample panel is created each year, we carried last observations forward and backward for those jails that were not surveyed every year. We cross-walked these data’s Government Integrated Directory (GID) codes with FIPS codes to merge with our other data sources, by county and year.
Data on county crime rates and county unemployment rates come from the same sources used in the first analysis.
Estimates of county racial demographics were obtained from the National Center for Health Statistics website. Bridged-race postcensal estimates are produced by the Population Estimates Program of the United States Census Bureau in collaboration with NCHS (National Center for Health Statistics 2010). Bridging involves the use of regression modeling to reduce multiple racial group population counts to four single-race categories (White, Black or African American, American Indian or Alaska Native, and Asian or Pacific Islander). Regression models with person-level and county-level covariates were used to generate the probability of selecting each single-race category possible for a multiple-race group; these probabilities are referred to as bridging proportions (National Center for Health Statistics 2010). The Census Bureau has applied these bridging proportions to the Census 2000 and Census 2010 counts, the annual postcensal series of estimates for 2000–2013, and the 2000–2009 intercensal estimates. This results in county-level estimates for each of the four single-race categories by county, age, Hispanic origin group, and sex. We retained estimates from years 2000–2009 for counties with jail data.
County-level poverty estimates come from the U.S. Census Small Area Income and Poverty Estimates (SAIPE) (United States Census Bureau 2015). These model-based estimates are produced for school districts, counties, and states. These estimates combine data from administrative records, postcensal population estimates, and the decennial census with direct estimates from the American Community Survey to provide consistent and reliable single-year estimates (United States Census Bureau 2015). We retained estimates from years 2000–2009. We merged county-level racial and poverty estimates with our other data sources by county and year.
Estimates of state-level industry racial demographics and average income levels come from the American Community Survey (ACS) (Ruggles et al 2020). For each state for each NAICS two-digit industry sector code, we calculated the proportion Black and the mean income (in 2009 dollars). In order to create stable estimates from data that was sparse across industries and years, we took the mean of values from the years 2000–2009 for these measures.
Measures.
The outcome of interest is the result of an NLRB election (win/loss). In a small number of instances (5.8% of cases), we found duplicate NLRB cases with conflicting vote tallies and win/loss results. This most likely occurred when the petitioner or employer challenged the conduct of the election (Ferguson, personal communication). As a result of such challenges, the NLRB may set aside votes on one side or another, which can alter the final results. In such cases, we followed Ferguson’s method (Ferguson, personal communication) for de-duplication: if one of the entries had an outcome (win/loss) that contradicted the vote tally, we kept that entry. This is because the existence of such a record strongly indicates there had been some reason to revisit the case after the initial tally count, and so the entry with conflicting results most likely reflects new information.
The exposure of interest is the county jail average daily population rate. We chose this measure because it comprises a year’s worth of daily population data, whereas other available measures, such as total population rate and admissions rate, comprise data from only a single day and single week, respectively. These data come from the Annual Survey of Jails and the Census of Jails. We calculated rates using each county’s total population. Rates are presented per 1,000 people.
Potential confounders include the proportion of Black residents by county (from the NCHS) and proportion of residents living below the poverty line by county (from the SAIPE). In addition, the proportion of Black and lower-income workers in the industry of the bargaining unit seeking to unionize is likely to influence both NLRB election outcomes and a bargaining unit’s relative exposure to local incarceration rates. We also control for county total crime rate (from the UCR), which may be a common prior cause of both jail incarceration rates and lower union participation. We also adjust for state incarceration rate and party control of state legislature of the county in which the NLRB election took place.
Analysis plan.
We fit logistic models to estimate the effect of one-year-lagged county jail average daily population (ADP) rates on the odds of winning an NLRB union representation election.10 We lagged jail ADP in order to better approximate the temporal order of the hypothesized effect. In the first set of models, we regressed NLRB election result on the ADP rate, in addition to year. In the second set of models, we additionally adjust for the proportion of the county that is Black, the proportion of the county that is poor, the proportion of Black workers in the industry of the bargaining unit, and the mean income in the industry of the bargaining unit, which again we hypothesize to be positive confounders. In the third set of models, we add county total crime rates and state incarceration rates. In the fourth set of models, we add county unemployment rate and the party in control of the state legislature.
Results
Table 3 shows that there were 18,318 union representation elections in 46 states and 914 counties between 2000 and 2009. Of the total number of elections, 9,750 (53%) resulted in wins. The mean county jail average daily population rate was 2.4 per 1,000 and ranged from 0 to 47.5 per 1,000. Republicans controlled 42% of the state legislatures in which NLRB elections were held between 2000–2009, Democrats controlled 35%, and 23% were split.
As in the OUR Walmart zip code-level analysis, given the overrepresentation of Black people and people with lower incomes in the criminal justice system, and these groups’ disproportionate support for labor unions, we expected there to be a positive main effect of county jail average daily population rate on the odds of winning an NLRB union representation election (Figure 5, Model 1). We did not find a significant positive main effect. After controlling for county and industry demographics, however, we find a significant negative relationship between county jail average daily population rates and the odds of winning an NLRB union representation election. This suggests—as hypothesized—that county and industry demographics are positive confounders of the relationship between local incarceration rates and the odds of winning an NLRB election.
Figure 5.
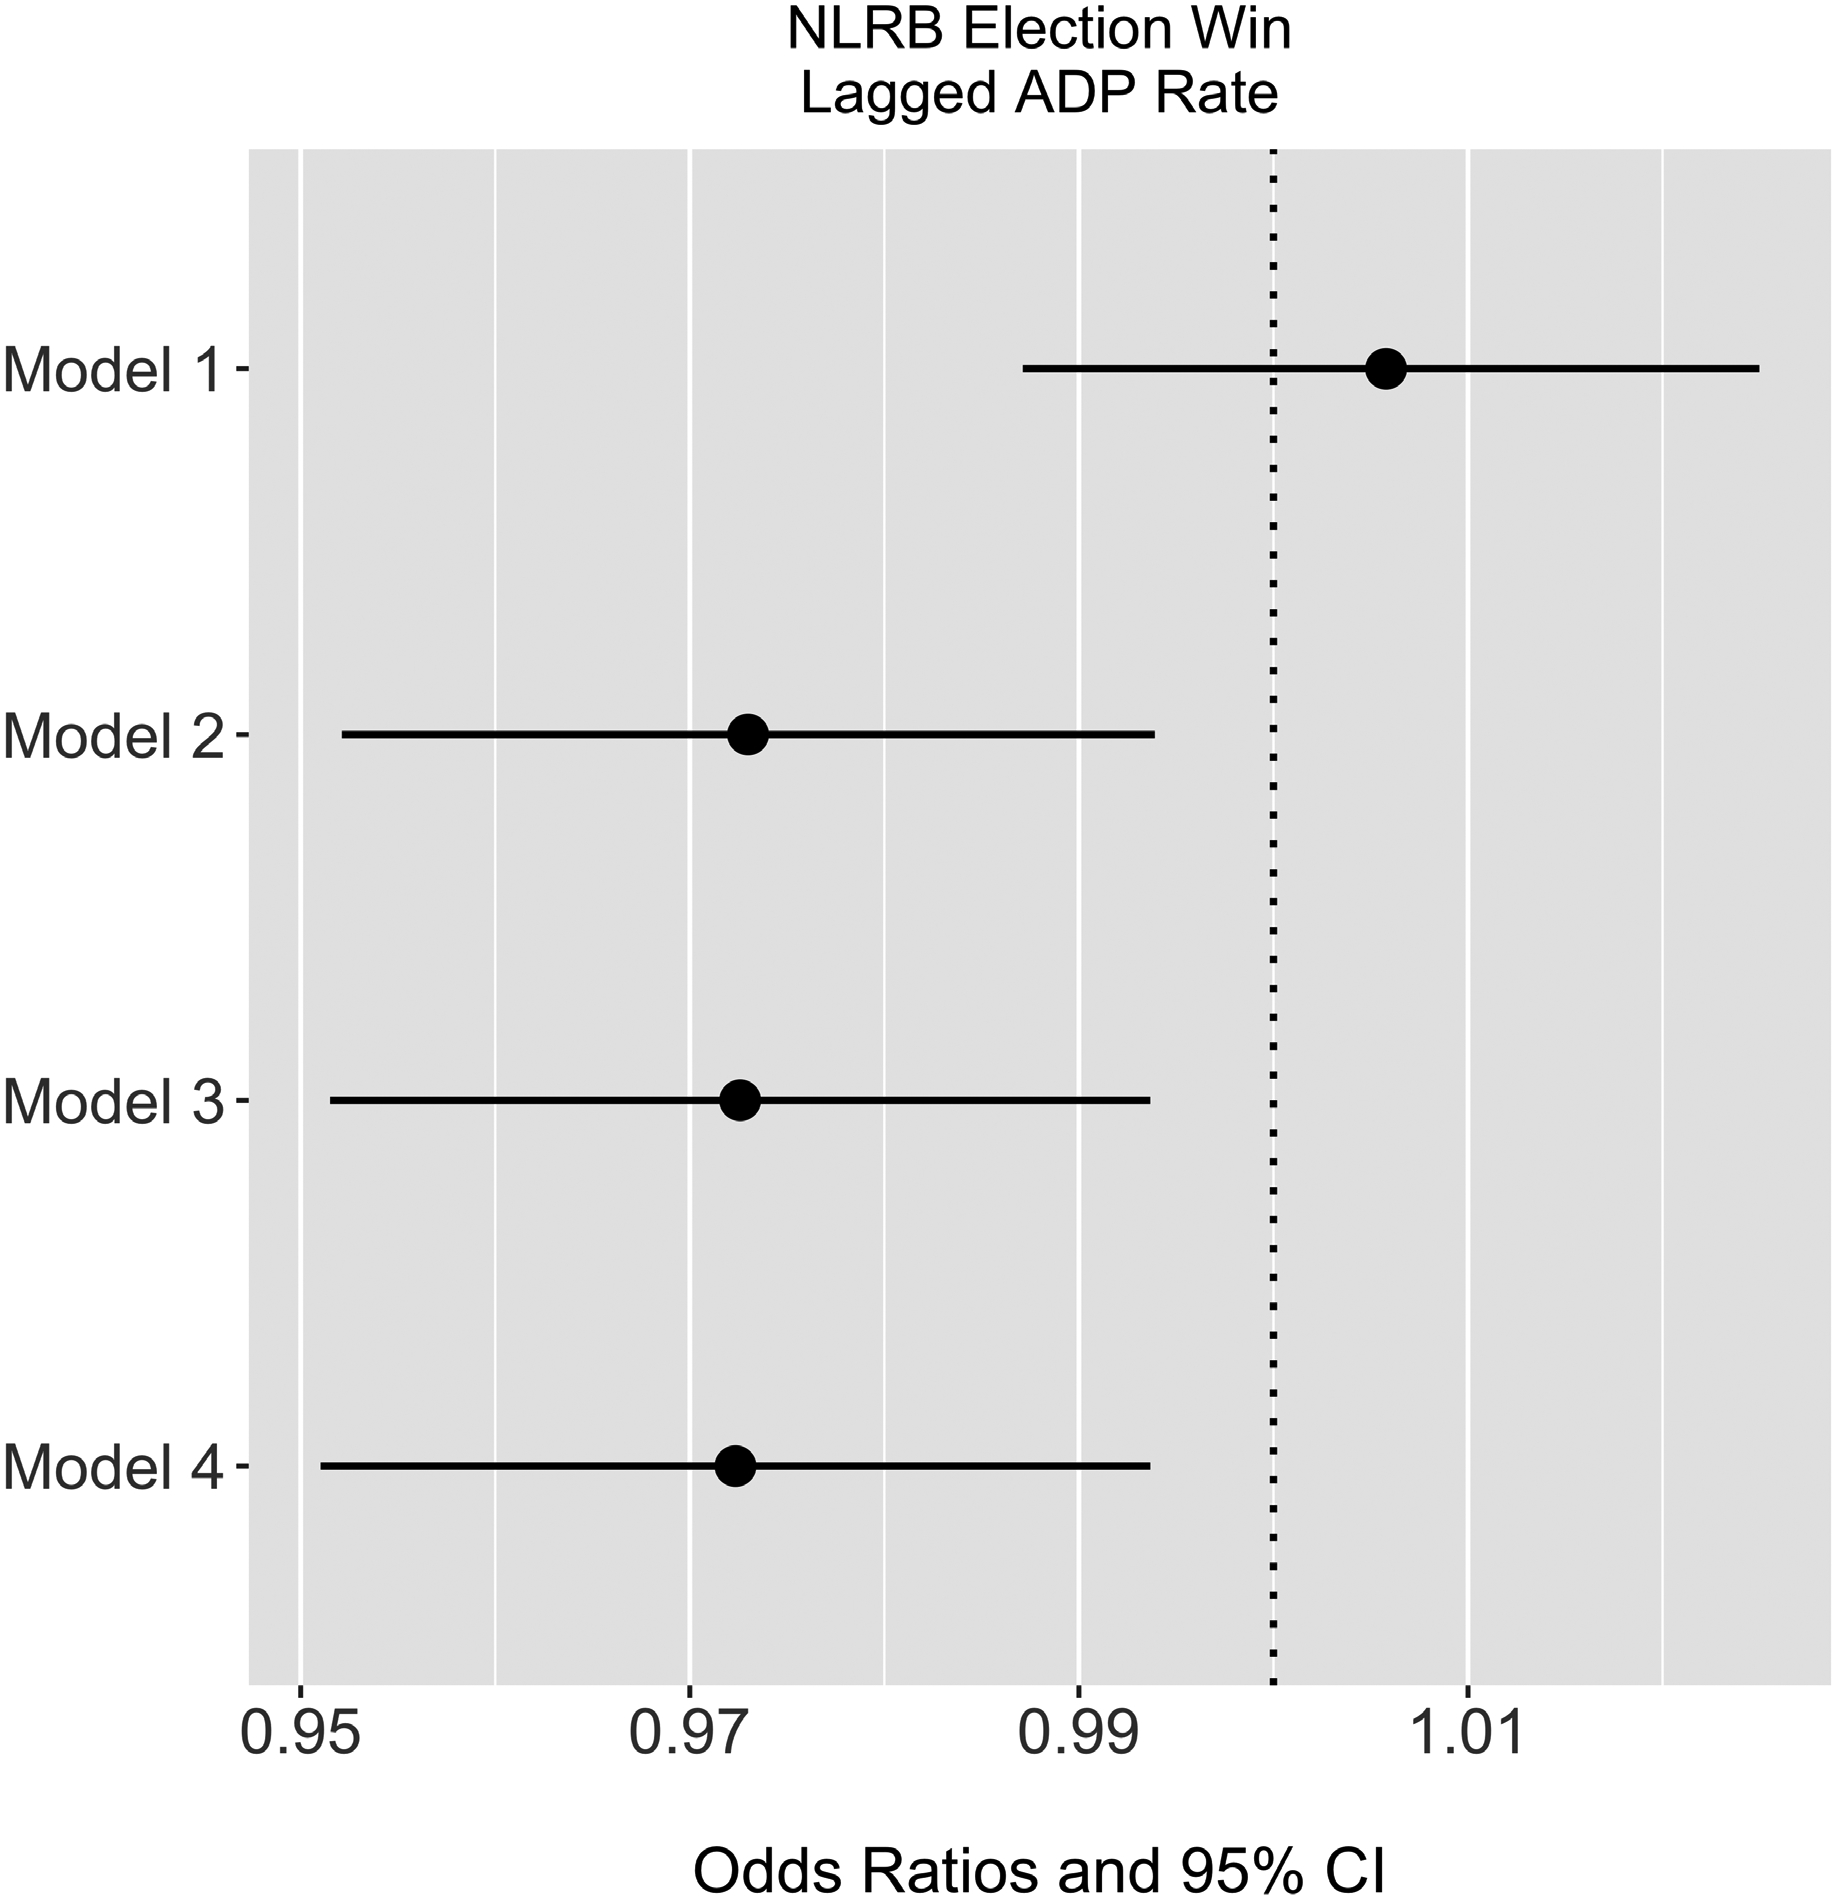
Relationship between a unit increase in county jail average daily population rate (ADP) and odds of winning a National Labor Relations Board (NLRB) union representation election.
After adjusting for the county proportion of Black residents, county proportion of residents living in poverty, proportion of industry Black, and mean industry income, we find a significant reduction in the odds of winning an NLRB election for a one unit increase in jail average daily population rate (Figure 5, Model 2), OR: 0.97 (95% CI: 0.95, 0.99). This is equivalent to 3% lower odds of winning an NLRB election for each unit increase in jail average daily population rate. Similar to the OUR Walmart analysis, this indicates that the proportion of Black and poor residents in a county and industry are strong positive confounders of the relationship between county jail average daily population and winning and NLRB election: among counties and industries of similar racialized and economic composition, higher jail average daily population rates reduce the odds of winning a union representation election. This effect was unaltered after adjusting for county total crime rate and state incarceration rate (Figure 5, Model 3), as well as industry, party control of state legislature, and unemployment rate (Figure 5, Model 4). There was no multiplicative effect modification between jail incarceration rates and either proportion Black, proportion poor, crime rates, state incarceration rates, industry, or party control of state legislature. Coefficients and 95% confidence intervals for complete models are presented in Table 6.
Table 6.
Logistic models regressing results of vote to unionize (win/loss) on jail average daily population rates (odds ratio for a unit increase in rate)
| Model 1 | Model 2 | Model 3 | Model 4 | |||||
|---|---|---|---|---|---|---|---|---|
| OR | 95% CI | OR | 95% CI | OR | 95% CI | OR | 95% CI | |
| (Intercept) | 0.97 | 0.89 – 1.06 | 1.12 | 0.95 – 1.32 | 1.27 * | 1.04 – 1.53 | 1.35 ** | 1.10 – 1.66 |
| Lagged ADP rate | 1.01 | 0.99 – 1.02 | 0.97 * | 0.95 – 0.99 | 0.97 * | 0.95 – 0.99 | 0.97 * | 0.95 – 0.99 |
| Year | ||||||||
| 2001 | 0.99 | 0.88 – 1.11 | 1 | 0.89 – 1.12 | 0.99 | 0.89 – 1.12 | 1 | 0.89 – 1.12 |
| 2002 | 1.04 | 0.92 – 1.16 | 1.03 | 0.92 – 1.15 | 1.03 | 0.92 – 1.15 | 1.03 | 0.92 – 1.17 |
| 2003 | 1.15 * | 1.02 – 1.30 | 1.13 * | 1.00 – 1.28 | 1.13 * | 1.00 – 1.27 | 1.14 | 1.00 – 1.29 |
| 2004 | 1.15 * | 1.02 – 1.29 | 1.12 | 0.99 – 1.26 | 1.11 | 0.99 – 1.25 | 1.11 | 0.98 – 1.26 |
| 2005 | 1.24 *** | 1.10 – 1.40 | 1.22 ** | 1.08 – 1.37 | 1.21 ** | 1.07 – 1.36 | 1.20 ** | 1.07 – 1.36 |
| 2006 | 1.16 * | 1.02 – 1.32 | 1.14 | 1.00 – 1.30 | 1.14 | 1.00 – 1.30 | 1.13 | 0.99 – 1.29 |
| 2007 | 1.17 * | 1.02 – 1.34 | 1.15 * | 1.01 – 1.32 | 1.15 * | 1.01 – 1.32 | 1.14 | 0.99 – 1.31 |
| 2008 | 1.53 *** | 1.34 – 1.75 | 1.50 *** | 1.31 – 1.73 | 1.50 *** | 1.31 – 1.72 | 1.47 *** | 1.28 – 1.70 |
| 2009 | 1.69 *** | 1.46 – 1.95 | 1.60 *** | 1.38 – 1.86 | 1.59 *** | 1.37 – 1.84 | 1.58 *** | 1.31 – 1.91 |
| % Industry Black | 1.00 *** | 1.00 – 1.00 | 1.00 *** | 1.00 – 1.00 | 1.00 *** | 1.00 – 1.00 | ||
| Mean industry income | 3.41 *** | 2.23 – 5.22 | 3.88 *** | 2.48 – 6.08 | 3.73 *** | 2.37 – 5.87 | ||
| % County Black | 1.00 | 1.00 – 1.00 | 1.00 | 1.00 – 1.00 | 1.00 | 1.00 – 1.00 | ||
| % County poor | 1.01 * | 1.00 – 1.02 | 1.01 ** | 1.00 – 1.02 | 1.01 * | 1.00 – 1.02 | ||
| County crime rate | 1.00 | 1.00 – 1.00 | 1.00 | 1.00 – 1.00 | ||||
| State incarceration rate | 0.66 ** | 0.49 – 0.89 | 0.70 * | 0.51 – 0.96 | ||||
| Party control of state legislature | ||||||||
| Republican | 0.92 * | 0.86 – 0.99 | ||||||
| Split | 0.94 | 0.87 – 1.02 | ||||||
| Unemployment rate | 1.00 | 0.97 – 1.02 | ||||||
| Observations | 18315 | 18112 | 18112 | 18112 | ||||
p<0.05
p<0.01
p<0.001
In this analysis, we found evidence to suggest that county level incarceration rates, represented by jail average daily populations, are a contextual exposure that is associated with a reduction in the odds of workers winning a union recognition election.
Analysis 4: Incarceration and Individuals’ Odds of Quitting Their Jobs
The three analyses above provide evidence, at different levels of analysis, of the negative relationship between exposure to the criminal justice system and workers’ involvement in workplace collective action. But these three analyses do not causally identify the association between criminal justice exposure and workers’ labor market power. That is to say, we are unable to rule out the possibility that there are unobserved differences among places (zip codes, states, and counties) or people, which lead both to higher levels of criminal justice exposure and to lower levels of support for labor organization.
Our fourth and final analysis seeks to identify the causal impact of incarceration on an individual’s power in relationship to their employer, operationalized as one’s likelihood of quitting their job. The intuition is that the experience of incarceration may make a person more likely to stay in a job that they otherwise would have quit. In an interview we conducted as part of a separate project, a Walmart employee from Texas discussed his felony record and, as a result, his lack of options outside of Walmart:
The reason why I’ve been at [this job] so long is I have a charge on my record. There was two decent jobs that my background denied me from getting those jobs. I’m stuck. That’s why, I kind of gave [this job] a better attitude, I tried not to worry about so much what was going on, try to just block that out and work.
Walmart was one of the few places around that would hire this employee in spite of his criminal record, so he was trying to change his attitude about the place—to keep his head down, “block that out and work” (Reich and Bearman 2018, p. 80).
Here we test whether this experience is generalizable across a sample of people who go to prison. Specifically, we are interested in understanding the within-person change in one’s odds of quitting a job after having been to prison. We use data from the National Longitudinal Survey of Youth, 1979 cohort, which has been used in some of the most rigorous observational research to date on the negative impact of a criminal record on employment post-release (Western and Beckett 1999; Western 2002).
Our hypothesis, based on the previous analyses, is that all else equal, the experience of incarceration reduces one’s odds of quitting their job. Compared to the other three analyses, all of which have been cross-sectional, this fourth analysis models the labor market behavior of the same individuals longitudinally, before and after the experience of incarceration, controlling for unobserved individual-level differences. The tradeoff, from the perspective of our argument, is that the outcome less directly pertains to individual-level workplace collective action. But it provides support for the same causal mechanism that we believe explains the results of the other analyses: namely, that exposure to the criminal justice system increases the degree to which people are beholden to their employers.
Methods
Data.
The National Longitudinal Survey of Youth 1979 is a nationally representative sample of 12,686 young men and women who were 14–22 years old when they were first surveyed in 1979. Individuals were interviewed annually through 1994 and since then have been interviewed on a biennial basis. We draw on all twenty-six waves of the survey currently available, from 1979 through 2014, though we restrict our analyses to those over the age of 18 at the time of interview.
Measures.
The outcome of interest is whether or not a respondent quit their “main” job (yes/no) in the survey year.11 This outcome is coded 1 when a respondent reports quitting their main job and 0 when a respondent reports not quitting their main job. If a respondent did not report having a main job, they were treated as missing.
The primary exposure of interest is prior incarceration. Correctional confinement in the NLSY79 is measured using an annual residence item, so we created a prior incarceration variable coded 1 for every year after someone was first interviewed in a correctional facility (Western 2002) and 0 otherwise.12 In order to explore the temporal duration of the effect of incarceration on quits, we also model incarceration lagged one, two, and three years.
A potential effect modifier is a dichotomous measure of job satisfaction (coded 1 if one reported liking one’s job “fairly well” or “very much” and 0 if one reported disliking one’s job “somewhat” or “very much”). If prior incarceration reduces the odds of quitting because it makes people feel compelled to remain in jobs they dislike, then prior incarceration should moderate the relationship between job satisfaction and quitting—i.e., quit decisions should be less sensitive to job satisfaction after incarceration than before.
While fixed-effects models adjust for stable, unobserved differences across individuals, they do not adjust for individuals’ different sensitivity to time-variant factors. We thus controlled for the following potential time-varying confounders: individuals’ log-transformed hourly wage (in 2014 dollars), individuals’ tenure in their current job (in weeks), number of weeks that a person worked during the previous year13, a person’s age, whether or not they are married (yes/no), years of schooling they have completed, and the survey year.
Analysis plan.
We fit conditional (fixed-effects) logistic regression models to estimate the within-person effect of change in prior incarceration status on quitting a job. We restrict our primary analyses to the 697 respondents who experienced a change in incarceration status (i.e., went to prison at some point between 1979 and 2014), as individuals who were never incarcerated have no within-person variation to contribute to the models (Firebaugh et al 2013).
Model 1 is a fixed effects conditional logistic model regressing quitting one’s job on prior incarceration, adjusting for age, marital status, education, and survey year. In Model 2 we additionally control for log-adjusted hourly wage, job tenure, and weeks worked. In Model 3 we include job satisfaction and an interaction term between job satisfaction and having ever been incarcerated, to determine whether incarceration modifies the effect of job satisfaction on quitting.
Results
Table 2 shows descriptive statistics for the 697 people (of 12,686 total participants in the NLSY79) who went to prison at some point in the period 1979–2014. Of those 697 respondents, 49% were Black, 31% were White, and 20% Latino. Among those who had a job, the average hourly wage for this group was $16.98 (in 2014 dollars), the average job tenure was 93.19 weeks, and people quit their jobs in 15% of job years.
Our primary interest in this final analysis is in how the experience of incarceration changes one’s odds of quitting their job, with the idea that, all things equal, a reduction in a worker’s odds of quitting reflects a higher degree of employer power over that worker.
Table 7 presents a series of fixed effects logistic models regressing quitting on prior incarceration. In Model 1, as expected, the experience of incarceration sharply reduces one’s odds of quitting their job. The odds of quitting were 51% lower (OR: 0.49, 95% CI: 0.4–0.61) after being incarcerated than before being incarcerated. Model 2 controls for job and employment characteristics, which did not appreciably change the negative association between prior incarceration and quitting one’s job. Model 3 introduces individuals’ self-reported job satisfaction to the model, in order to test whether incarceration modifies the effect of job satisfaction on quitting. The positive, significant interaction between prior incarceration and job satisfaction suggests that this is indeed the case. Figure 6 shows that before incarceration, high job satisfaction is associated with a lower probability of quitting relative to low job satisfaction. But after incarceration, that relative difference between low and high job satisfaction on quitting is virtually eliminated.
Table 7.
Fixed effects logistic models regressing quitting a job on incarceration status
| Model 1 | Model 2 | Model 3 | ||||
|---|---|---|---|---|---|---|
| OR | 95% CI | OR | 95% CI | OR | 95% CI | |
| Ever incarcerated | 0.49*** | 0.40–0.61 | 0.44*** | 0.35–0.55 | 0.29*** | 0.20–0.43 |
| Job satisfaction | 0.63*** | 0.50–0.81 | ||||
| Ever incarcerated*Job satisfaction | 1.48* | 1.02–2.13 | ||||
| Age | 0.97 | 0.81–1.17 | 0.99 | 0.81–1.2 | 0.99 | 0.81–1.21 |
| Years of school | 0.91* | 0.83–0.99 | 0.95 | 0.86–1.04 | 0.97 | 0.88–1.07 |
| Married (Yes) | 0.55*** | 0.45–0.66 | 0.60*** | 0.49–0.74 | 0.60*** | 0.48–0.74 |
| Year | ||||||
| 1980 | 0.27*** | 0.11–0.68 | 0.34* | 0.12–0.97 | 3.42 | 0.39–30.27 |
| 1981 | 0.14*** | 0.04–0.47 | 0.20** | 0.05–0.73 | 1.95 | 0.19–19.82 |
| 1982 | 1.81 | 0.91–3.61 | 2.42* | 1.08–5.39 | 22.44*** | 2.79–180.74 |
| 1983 | 1.39 | 0.60–3.24 | 1.67 | 0.64–4.36 | 2.61 | 0.25–27.57 |
| 1984 | 2.18 | 0.80–5.92 | 2.93 | 0.97–8.87 | 26.88*** | 2.88–250.88 |
| 1985 | 1.95 | 0.61–6.27 | 2.44 | 0.68–8.82 | 23.76** | 2.30–245.07 |
| 1986 | 1.76 | 0.45–6.87 | 2.43 | 0.55–10.74 | 23.21** | 1.98–272.67 |
| 1987 | 2.37 | 0.49–11.5 | 3.44 | 0.62–18.96 | 32.06** | 2.35–438.31 |
| 1988 | 2.74 | 0.46–16.46 | 3.95 | 0.57–27.33 | 37.09** | 2.29–599.72 |
| 1989 | 2.82 | 0.40–20.13 | 4.05 | 0.49–33.65 | 38.82** | 2.08–723.66 |
| 1990 | 3.51 | 0.41–30.3 | 4.95 | 0.49–50.42 | 48.29** | 2.19–1062.42 |
| 1991 | 3.05 | 0.3–31.12 | 4.35 | 0.36–52.38 | 43.62* | 1.72–1104.29 |
| 1992 | 3.38 | 0.28–41.54 | 4.71 | 0.32–69 | 46.68* | 1.56–1395.04 |
| 1993 | 2.93 | 0.20–42.89 | 4.08 | 0.23–72.2 | 40.08* | 1.14–1414.36 |
| 1994 | 4.50 | 0.25–79.81 | 6.43 | 0.30–139.3 | 64.49* | 1.53–2725.98 |
| 1996 | 5.73 | 0.23–142.88 | 7.99 | 0.26–248.32 | 79.81* | 1.35–4701.89 |
| 1998 | 6.11 | 0.17–215.99 | 8.35 | 0.19–376.26 | 80.89* | 0.97–6727.89 |
| 2000 | 5.54 | 0.11–290.39 | 8.41 | 0.12–573.63 | 82.35 | 0.67–10164.99 |
| 2002 | 3.48 | 0.05–261.83 | 5.31 | 0.05–529.54 | 51.72 | 0.29–9244.08 |
| 2004 | 2.54 | 0.02–290.25 | 4.17 | 0.03–645.82 | 40.96 | 0.15–11214.33 |
| 2006 | 3.47 | 0.02–535.53 | 5.68 | 0.03–1213.57 | 57.11 | 0.15–21494.15 |
| 2008 | 2.69 | 0.01–601.44 | 3.71 | 0.01–1182.65 | 37.17 | 0.07–20828.36 |
| 2010 | 2.83 | 0.01–882.79 | 5.09 | 0.01–2316.89 | 45.97 | 0.06–36880.65 |
| 2012 | 5.00 | 0.01–2580.74 | 6.78 | 0.01–5250.42 | 65.12 | 0.05–88840.01 |
| 2014 | 5.37 | 0.01–4127.53 | 10.00 | 0.01–11778.9 | 98.30 | 0.05–205055.27 |
| log(wages) | 0.92 | 0.79–1.07 | 1.00 | 0.85–1.19 | ||
| Job tenure | 1.00** | 1.00–1.00 | 1.00*** | 1.00–1.00 | ||
| Weeks worked | 0.98*** | 0.98–0.99 | 0.98*** | 0.98–0.99 | ||
p<0.05
p<0.01
p<0.001
Figure 6.
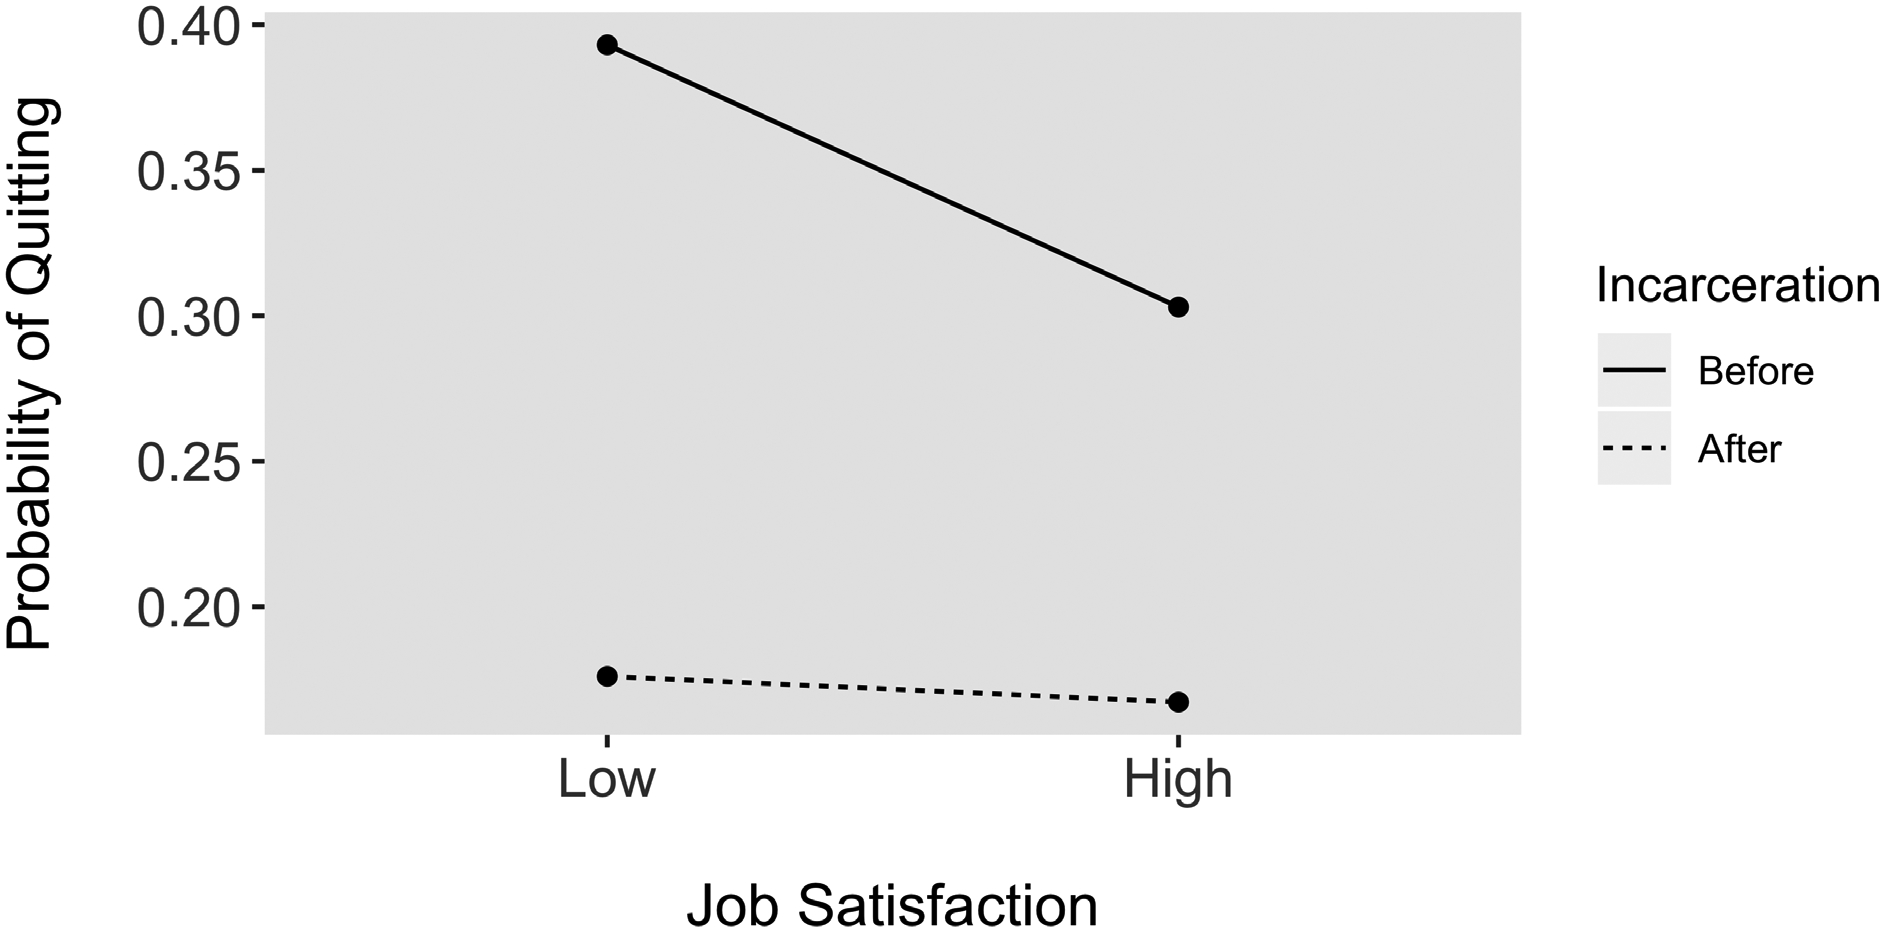
Effect modification of the relationship between incarceration and job satisfaction on quitting a job.
Discussion
In three separate analyses, across different levels of analysis, we have provided suggestive evidence that—once we control for appropriate confounders—there is a negative relationship between criminal justice exposure and local labor organization. Our fourth analysis supports the idea that this negative relationship may be driven by the power that employers are able to leverage over employees in high incarceration contexts.
Given the limitations of our data, none of these analyses on its own is conclusive. Together, they provide support for the idea that the criminal justice system has a disciplining effect on collective action in the workplace, and thus plays a previously unrecognized role in shaping inequality in the American economy. The criminal justice system is not just a sorting mechanism, determining individuals’ places on a preexisting distribution of job market outcomes; nor does it solely manage those already excluded from the labor market. We show one pathway by which the contemporary criminal justice system actively generates consent to low-wage work, and thus shapes the distribution of opportunities at the bottom of the labor market, in a way broadly consistent with the suppositions of classic Marxist criminology (Melossi & Pavarini 1981, Rusche & Kirchheimer 1939).
Our findings also provide a new, more critical perspective on an emerging line of thinking among criminal justice scholars and advocates that those exposed to the criminal justice system may make more reliable employees who will put in more effort than their peers and be less likely to leave. For example, Minor and colleagues (2017) suggest that the “average customer service worker with a criminal record is a better deal for the employer than the average worker without a record” (emphasis in original). Similarly, Lundquist and colleagues (2018) find that military personnel with felony records (and who had received waivers to serve) were more likely to be promoted than those without records, and write, “The scarcity of stable employment for felons is likely to generate greater commitment to an employer who is willing to take a chance on them.”
Such analyses are often mobilized to advocate for employment opportunities among ex-offenders. Without negating the importance of such efforts, our findings highlight the coercion that likely exists in the background of such findings. The same forces that make formerly incarcerated employees more productive and less likely to quit than their counterparts without records—the relative power that employers have over them—are likely those that here deter people from coming together to advocate for better wages and working conditions.
Advocates of “social movement unionism” have long argued that labor unions ought to connect their struggles for economic justice to other social movement issues and targets (Nissen 2003). Today, some labor organizations are actively involved in struggles for criminal justice reform and against police brutality (Terry and Lee 2017). This paper suggests that such recent efforts may be more directly in the interests of labor organizations than they realize, as reducing the scale and scope of the criminal justice system may create new space for labor organizations to reemerge.
Given the limitations of our data, this article is necessarily exploratory, and it is our hope that future research pursues two separate lines of research building on what we have found here. First, future research should work to identify high quality sources of data at both the individual and contextual levels that can test in a more rigorous way than we have been able to test here the causal effects of criminal justice exposure on workplace collective action. The infrequency of workplace collective action in the contemporary low-wage workplace makes this challenging. Yet labor unions and other worker organizations have, in recent years, become much more systematic in their own efforts to collect data about their members’ participation in workplace action, which may open up avenues for scholarly research. For example, if strict confidentiality could be assured, linking a labor union’s administrative database on particular card signing campaigns to local area- or individual-level criminal justice records would not only allow for a more robust test of the hypotheses explored here, but also inform organizing strategies that anticipate context-specific criminal justice system effects on particular unionization campaigns.
Second, future research ought to explore more precisely the mechanisms through which criminal justice exposure may reduce people’s odds of being involved in workplace collective action at the individual and contextual levels. At the community level, we have suggested that community-level criminal justice exposure increases workers’ perceived costs of being without a job, and so makes people less willing to take actions at work that they feel may risk the jobs they have. But it may be instead that community-level criminal justice exposure disrupts the community-level social networks and local institutions through which participation in workplace collective action often occurs (McAlevey 2016). Or it may be that policing and other state surveillance practices associated with high levels of community-level criminal justice involvement have a chilling effect on all kinds of contentious action, including those that take place at work.
Likewise, at the individual level, we have found evidence that an individual’s prior criminal justice involvement lessons their likelihood of participating in workplace collective action, and have found evidence that this may be because of the increased power that the employer has over a worker with a criminal record. But future research ought to explore the determinants of this power in more detail. Does the employer gain power over the worker simply because the worker has few other job opportunities? Or does the employer gain power over the worker in part because of probation and parole regulations that require employment, and so increase the risks of joblessness?
Despite the limitations of our data, and the questions we leave unanswered, this paper breaks new empirical ground by demonstrating a negative relationship between the reach of the criminal justice system and the success of workplace organizing. In so doing it adds a missing critical criminological perspective on the labor market consequences of mass incarceration.
Footnotes
This is consistent with a historical scholarship that has revealed the extent to which early “free” markets for labor relied on large state investments in disciplinary institutions like the workhouse: “[T]he New Poor Law, so solicitous of the natural laws of political economy, so determined to establish a free market in labor, so insistent upon the responsibility of the individual, was also the occasion for the most important extension of government power and of the administrative apparatus of the state in more than half a century” (Himmelfarb 1983, p. 166).
In earlier work, Wacquant suggests that this is the primary function served by an expanded criminal justice system: “What makes the racial intercession of the carceral system different today is that, unlike slavery, Jim Crow and the ghetto of the mid-century, it does not carry out a positive economic mission of recruitment and disciplining of the workforce: it serves only to warehouse the precarious and deproletarianized fractions of the black working class…” (Wacquant 2000, p. 385). Crises of surplus—of finance capital, land, labor, and state capacity—are also central to Ruth Wilson Gilmore’s analysis of the California prison boom in the 1980s and 1990s: “…prison building was and is not the inevitable outcome of these surpluses. It did, however, put certain state capacities into motion, make use of a lot of idle land, get capital invested via public debt, and take more than 160,000 low-wage workers off the streets” (Gilmore 2007).
Melossi and Pavarini (1981, pp. 37–38) wrote that the aim of the early workhouse “was to make the poor accept any conditions imposed by the employer.” Rusche and Kirscheimer (2003[1939]), early critical criminologists, observed that the relative brutality of systems of punishment tended to vary with the relative supply of labor. In those historical periods of labor surplus, when the economic value of the prisoner was small, prisoners were treated as disposable and punishments severe. Conversely, in periods of labor shortage, prisoners were treated more leniently, and were subjected to work discipline so as to be reintegrated into the market (and so that the goods produced in prison, which were only cost-competitive when free wages were high, could be sold on the market).
It is important to note that Wacquant rejects deterministic economic accounts of the neoliberal transformation of the criminal justice and social welfare systems, arguing that it cannot be understood without its moral and symbolic dimensions.
Heather Ann Thompson (2010) argues that mass incarceration helps to explain the decline of living standards for low-wage workers because convict labor has displaced the demand for free labor. While historians have convincingly illustrated the tension between convict labor and free labor in the late 19th century (see McLennan 2008), this explanation seems less convincing in the contemporary period given the very small percentage of inmates involved in production for private companies today (Farrell 2008).
Using data from the Current Population Survey (CPS) March Supplements, for each year between 2000 and 2014, we regressed one’s membership in a labor union on race (Black/non-Black), adjusting for age, education, occupation, and industry. Figure 1 reports the coefficient on the race variable for each year.
Each of these surveys does ask about the respondents’ membership in a union, but one’s membership status is rarely the result of an organizing drive and more often the result of having secured employment with a previously unionized employer—meaning that membership status is a poor indicator of one’s likelihood to be involved in labor organizing.
Almost all members of the worker center join at a time during which they are employed by the retailer, but some continue to belong to the organization after they have left (or have been fired from) the company.
These sorts of visits are legal but contested by retail employers.
We also fit multi-level models with a random intercept for county. Estimates were virtually identical to the results presented below, but these models had convergence issues, likely because there were frequently only one or two NLRB elections (level 1 observations) within each county (level 2 observations).
A person’s “main” job within the NLSY79 is the job at which a respondent worked the most hours within the last week or the most recent job held by a person. Those who quit a main job during the year in order to take a new main job, or who quit a main job but found a new main job, will thus not be counted as having quit their main job in this analysis (for these respondents, the main job will be their new job). The “quit job” variable, then, measures whether someone quit a main job during the year and, at the time of the interview, does not have a new main job. This makes sense for the purposes of our analysis, in that we want to focus on costly quits, or quits people make without the promise of easily finding other work. However, our results are robust to when we replace this outcome with a measure of whether a respondent quit any job in a survey year, a less precise but more inclusive measure of job separations. A more difficult analytic problem is that a large number of respondents report quitting main jobs in years that they are interviewed while incarcerated. Having conducted several separate analyses of the jobs, and quits, reported during periods of incarceration (i.e. examining pay for these jobs, when in a prison sentence these jobs were reported, and the particular kinds of quits reported, analyses available upon request), we conclude that these are quits that occurred in the year prior to incarceration (and are not quits of prison jobs, or “quits” that occurred as a result of incarceration)—consistent with the well-established relationship between joblessness and crime (Sampson and Laub 1992). As a robustness check, however, we reran models dropping respondents during waves they are interviewed while incarcerated, and found similar results.
For consistency, we count only those periods of incarceration that take place when a respondent is at least 18.
While we include this variable in this model, it is somewhat difficult to interpret, as it might be understood either as the opportunity for quits (in which case we would expect a positive association), or as a consequence of quitting (in which case we would expect a negative association), within the year observed. Excluding it does not appreciably change the results.
References
- Aronowitz Stanley. 2014. Toward a New Worker’s Movement. New York: Verso Books. [Google Scholar]
- Barker Vanessa. 2009. The Politics of Imprisonment: How the Democratic Process Shapes the Way America Punishes Offenders. New York: Oxford University Press. [Google Scholar]
- Bates Douglas, Martin Mächler Ben Bolker, and Walker Steve. 2015. “Fitting Linear Mixed-Effects Models Using Lme4.” Journal of Statistical Software 67(1):1–48. [Google Scholar]
- Beckett Katherine. and Western Bruce. 2001. “Governing Social Marginality: Welfare, Incarceration, and the Transformation of State Policy.” Punishment & Society 3(1):43–59. [Google Scholar]
- Bonacich Edna. 1976. “Advanced Capitalism and Black/White Race Relations in the United States: A Split Labor Market Interpretation.” American Sociological Review 41(1):34–51. [Google Scholar]
- Brayne Sarah. 2014. “Surveillance and System Avoidance.” American Sociological Review 79(3):367–91. [Google Scholar]
- Bronfenbrenner Kate. 2009. No Holds Barred: The Intensification of Employer Opposition to Organizing. Washington, DC: Economic Policy Institute. [Google Scholar]
- Burch Traci. 2013. Criminal Convictions and the Decline of Neighborhood Political Participation. Chicago: University of Chicago Press. [Google Scholar]
- Burch Traci R. 2014. “Effects of Imprisonment and Community Supervision on Neighborhood Political Participation in North Carolina.” The ANNALS of the American Academy of Political and Social Science 651(1):184–201. [Google Scholar]
- Bureau of Justice Statistics. 2016a. “Data Collection: Annual Survey of Jails.” Retrieved October 2, 2017 (https://www.bjs.gov/index.cfm?ty=dcdetail&iid=261).
- Bureau of Justice Statistics. 2016b. “Data Collection: Census of Jails.” Retrieved October 2, 2017 (https://www.bjs.gov/index.cfm?ty=dcdetail&iid=254).
- Bureau of Justice Statistics. 2016c. “Data Collection: National Prisoner Statistics (NPS) Program.” Retrieved October 2, 2017 (https://www.bjs.gov/index.cfm?ty=dcdetail&iid=269).
- Campbell Michael C. and Schoenfeld Heather. 2013. “The Transformation of America’s Penal Order: A Historicized Political Sociology of Punishment.” American Journal of Sociology 118(5):1375–1423. [Google Scholar]
- Card David and Olson Craig A.. 1995. “Bargaining Power, Strike Durations, and Wage Outcomes: An Analysis of Strikes in the 1880s.” Journal of Labor Economics 13(1):32–61. [Google Scholar]
- Clear Todd R. 2008. “The Effects of High Imprisonment Rates on Communities.” Crime and Justice 37(1):97–132. [Google Scholar]
- Clear Todd R., Rose Dina R., Waring Elin, and Scully Kristen. 2003. “Coercive Mobility and Crime: A Preliminary Examination of Concentrated Incarceration and Social Disorganization.” Justice Quarterly 20(1):33–64. [Google Scholar]
- Cornfield Daniel B. 1991. “The Attitude of Employee Association Members toward Union Mergers: The Effect of Socioeconomic Status.” Industrial and Labor Relations Review 44(2):316–34. [Google Scholar]
- Cornfield Daniel B. and Kim Hyunhee. 1994. “Socioeconomic Status and Unionization Attitudes in the United States.” Social Forces 73(2):512–21. [Google Scholar]
- Drucker Ernest. 2011. A Plague of Prisons: The Epidemiology of Mass Incarceration in America. New York: The New Press. [Google Scholar]
- Dunn Megan and Walker James. 2016. Union Membership In The United States. U.S. Bureau of Labor Statistics. [Google Scholar]
- Emsellem Maurice and Rodriguez Michelle Natividad. 2015. “Advancing a Federal Fair Chance Hiring Agenda.” New York: National Employment Law Project. [Google Scholar]
- Emerson Richard M. 1962. “Power-Dependence Relations.” American Sociological Review 27(1):31–41. [Google Scholar]
- Fantasia Rick. 1989. Cultures of Solidarity: Consciousness, Action, and Contemporary American Workers. Berkeley: University of California Press. [Google Scholar]
- Fantasia Rick and Voss Kim. 2004. Hard Work: Remaking the American Labor Movement. Berkeley: University of California Press. [Google Scholar]
- Farber Henry S. and Western Bruce. 2001. “Accounting for the Decline of Unions in the Private Sector, 1973–1998.” Journal of Labor Research 22(3):459–85. [Google Scholar]
- Farrell Maureen. 2008. “Putting Prisoners to Work.” Forbes. Retrieved January 18, 2020. (https://www.forbes.com/2008/08/18/prison-small-business-ent-manage-cx_mf_0818prisonlabor.html#6839484821f5).
- Federal Bureau of Investigation. 2016. “Uniform Crime Reporting.” Retrieved January 18, 2020. (https://www.fbi.gov/services/cjis/ucr).
- Ferguson John-Paul. 2016a. “Case Files and Code for NLRB Union Representation Elections.” Retrieved October 2, 2017 (https://github.com/jpfergongithub/nlrb-cats).
- Ferguson John-Paul. 2016b. “JP Ferguson’s NLRB Files.” Retrieved October 2, 2017 (https://web.stanford.edu/~jpferg/nlrb.htm).
- Ferguson John-Paul. 2016c. “Racial Diversity and Union Organizing in the United States, 1999–2008.” Industrial and Labor Relations Review 69(1):53–83. [Google Scholar]
- Fiorito Jack and Greer Charles R.. 1982. “Determinants of U.S. Unionism: Past Research and Future Needs.” Industrial Relations: A Journal of Economy and Society 21(1):1–32. [Google Scholar]
- Firebaugh Glenn, Warner Cody, and Massoglia Michael. 2013. “Fixed Effects, Random Effects, and Hybrid Models for Causal Analysis.” In Handbook of Causal Analysis for Social Research, edited by Morgan Stephen L., pp. 113–132. New York: Springer. [Google Scholar]
- Freeman Richard. B., Hersch Joni, and Mishel Lawrence. 2007. Emerging Labor Market Institutions for the Twenty-First Century. Chicago: University of Chicago Press. [Google Scholar]
- Freeman Richard. B. and Medoff James L.. 1984. What Do Unions Do? New York: Basic Books. [Google Scholar]
- Freeman Richard. B. and Rogers Joel. 1999. What Workers Want. Ithaca, NY: Cornell University Press. [Google Scholar]
- Freeman Richard B. 1988. “Contraction and Expansion: The Divergence of Private Sector and Public Sector Unionism in the United States.” Journal of Economic Perspectives 2(2):63–88. [Google Scholar]
- Frymer Paul. 2003. “Acting When Elected Officials Won’t: Federal Courts and Civil Rights Enforcement in U.S. Labor Unions, 1935–85.” American Political Science Review 97(3):483–99. [Google Scholar]
- Garland David. 2001. The Culture of Control: Crime and Social Order in Contemporary Society. Chicago: University of Chicago Press. [Google Scholar]
- Gilmore Ruth Wilson. 2007. Golden Gulag: Prisons, Surplus, Crisis, and Opposition in Globalizing California. Berkeley: University of California Press. [Google Scholar]
- Hatzenbuehler Mark L., Keyes Katherine, Hamilton Ava, Uddin Monica, and Galea Sandro. 2015. “The Collateral Damage of Mass Incarceration: Risk of Psychiatric Morbidity among Nonincarcerated Residents of High-Incarceration Neighborhoods.” American Journal of Public Health 105(1):138–43. [DOI] [PMC free article] [PubMed] [Google Scholar]
- Himmelfarb Gertrude. 1983. The Idea of Poverty: England in the Early Industrial Age. New York: Knopf. [Google Scholar]
- Hirschman Albert O. 1970. Exit, Voice and Loyalty: Responses to Decline, in Firms, Organizations, and States.
- Jankovic Ivan. 1977. “Labor Market and Imprisonment.” Crime and Social Justice 8:17–31. [Google Scholar]
- Justice Mapping Center. 2010. “Justice Atlas of Sentencing and Corrections.” Retrieved May 5, 2018 (http://www.justiceatlas.org).
- Kochan Thomas A. 1979. “How American Workers View Labor Unions.” Monthly Labor Review 102(4):23–31. [Google Scholar]
- Kristal Tali and Cohen Yinon. 2016. “The Causes of Rising Wage Inequality: The Race between Institutions and Technology.” Socio-Economic Review 15(1):187–212. [Google Scholar]
- Lerman Amy. E. and Weaver Vesla M.. 2014. Arresting Citizenship: The Democratic Consequences of American Crime Control. Chicago: University of Chicago Press. [Google Scholar]
- Lichtenstein Nelson. 2009. How Wal-Mart Created a Brave New World of Business. New York: Picador. [Google Scholar]
- Logan John. 2006. “The Union Avoidance Industry in the United States.” British Journal of Industrial Relations 44(4):651–75. [Google Scholar]
- Lundquist Jennifer Hickes, Pager Devah, and Strader Eiko. 2018. “Does a Criminal Past Predict Worker Performance? Evidence from One of America’s Largest Employers.” Social Forces 96(3):1039–68. [Google Scholar]
- Lynch James P. and Sabol William J.. 2004. “Assessing the Effects of Mass Incarceration on Informal Social Control in Communities.” Criminology & Public Policy 3(2):267–94. [Google Scholar]
- Manza Jeff and Uggen Christopher. 2006. Locked Out: Felon Disenfranchisement and American Democracy. New York: Oxford University Press. [Google Scholar]
- McAlevey Jane. 2016. No Shortcuts: Organizing for Power in the New Gilded Age. New York: Oxford University Press. [Google Scholar]
- McLennan Rebecca. M. 2008. The Crisis of Imprisonment: Protest, Politics, and the Making of the American Penal State, 1776–1941. New York: Cambridge University Press. [Google Scholar]
- Melossi Dario and Pavarini Massimo. 2018[1981]. The Prison and the Factory: Origins of the Penitentiary System. Basingstoke, Hampshire: Palgrave Macmillan UK. [Google Scholar]
- Minor Dylan, Persico Nicola, and Weiss Deborah. 2017. “Criminal Background and Job Performance.” Available at SSRN: https://ssrn.com/abstract=2851951.
- Morenoff Jeffrey D. and Harding David J.. 2014. “Incarceration, Prisoner Reentry, and Communities.” Annual Review of Sociology 40:411–29. [DOI] [PMC free article] [PubMed] [Google Scholar]
- National Center for Health Statistics. 2010. Documentation for Vintage 2010 Bridged-Race Postcensal Population Estimates for Calculating Vital Rates.
- National Research Council. 2014. The Growth of Incarceration in the United States: Exploring Causes and Consequences. Edited by Jeremy Travis, Bruce Western, and Steve Reburn. Washington, DC: Committee on Causes and Consequences of High Rates of Incarceration, Committee on Law and Justice, Division of Behavioral and Social Sciences and Education, The National Academy Press. [Google Scholar]
- Nissen Bruce. 2003. “Alternative Strategic Directions for the U.S. Labor Movement.” Labor Studies Journal 28(1):133–55. [Google Scholar]
- Oliver Pamela, Marwell Gerald, and Teixeira Ruy. 1985. “A Theory of the Critical Mass. I. Interdependence, Group Heterogeneity, and the Production of Collective Action.” American Journal of Sociology 91(3):522–56. [Google Scholar]
- Olson Mancur. 1965. Public Goods and the Theory of Groups. Cambridge: Harvard University Press. [Google Scholar]
- Pager Devah. 2003. “The Mark of a Criminal Record.” The American Journal of Sociology 108(5):937–975. [Google Scholar]
- Patterson Charlotte J. 2004. “What Difference Does a Civil Union Make? Changing Public Policies and the Experiences of Same-Sex Couples: Comment on Solomon, Rothblum, and Balsam.” Journal of Family Psychology 18(2):287–89. [DOI] [PubMed] [Google Scholar]
- Patterson Orlando. 2004. “Culture and Continuity: Causal Structures in Socio-Cultural Persistence.” In Matters of Culture: Cultural Sociology in Practice, edited by Roger Friedland and John Mohr, pp. 71–109. New York: Cambridge University Press. [Google Scholar]
- Pattillo Mary, David Weiman, and Bruce Western, eds. 2004. Imprisoning America: The Social Effects of Mass Incarceration. New York: Russell Sage Foundation. [Google Scholar]
- Pettit Becky and Western Bruce. 2004. “Mass Imprisonment and the Life Course: Race and Class Inequality in U.S. Incarceration.” American Sociological Review 69(2):151–69. [Google Scholar]
- Purser Gretchen. 2012. “‘Still Doin’ Time:’ Clamoring for Work in the Day Labor Industry.” WorkingUSA 15(3):397–415. [Google Scholar]
- Reich Adam, and Bearman Peter. 2018. Working for Respect: Community and Conflict at Walmart. New York: Columbia University Press. [Google Scholar]
- Rose Dina R. and Clear Todd R.. 1998. “Incarceration, Social Capital, and Crime: Implications for Social Disorganization Theory.” Criminology 36(3):441–80. [Google Scholar]
- Rose Geoffrey. 1985. “Sick Individuals and Sick Populations.” International Journal of Epidemiology 14:32–38. [DOI] [PubMed] [Google Scholar]
- Rosenfeld Jake. 2014. What Unions No Longer Do. Cambridge: Harvard University Press. [Google Scholar]
- Rosenfeld Jake and Kleykamp Meredith. 2012. “Organized Labor and Racial Wage Inequality in the United States.” The American Journal of Sociology 117(5):1460–1502. [DOI] [PMC free article] [PubMed] [Google Scholar]
- Ruggles Steven, Flood Sarah, Goeken Ronald, Grover Josiah, Meyer Erin, Pacas Jose and Sobek Matthew. 2020. IPUMS USA: American Community Survey Samples, 2000–2009. Minneapolis, MN. 10.18128/D010.V10.0. [DOI] [Google Scholar]
- Rusche Georg and Kirchheimer Otto. 2003[1939]. Punishment and Social Structure. New York: Columbia University Press. [Google Scholar]
- Sampson Robert J., and Laub John H.. 1992. “Crime and Deviance in the Life Course.” Annual Review of Sociology 18:63–84. [Google Scholar]
- Sampson Robert J. and Loeffler Charles. 2010. “Punishment’s Place: The Local Concentration of Mass Incarceration.” Daedalus 139(3):20–31. [DOI] [PMC free article] [PubMed] [Google Scholar]
- Silva Jennifer. M. 2013. Coming Up Short: Working-Class Adulthood in an Age of Uncertainty. New York: Oxford University Press. [Google Scholar]
- Terry Brandon M. and Lee Jason. 2017. “Rethinking the Problem of Alliance: Organized Labor and Black Political Life.” New Labor Forum 26(3):16–26. [Google Scholar]
- Thompson Heather Ann. 2010. “Why Mass Incarceration Matters: Rethinking Crisis, Decline, and Transformation in Postwar American History.” Journal of American History 97(3):703–34. [Google Scholar]
- Tope Daniel and Jacobs David. 2009. “The Politics of Union Decline: The Contingent Determinants of Union Recognition Elections and Victories.” American Sociological Review 74(5):842–64. [Google Scholar]
- United States Census Bureau. 2015. “Small Area Income and Poverty Estimates.” Retrieved October 2, 2017 (https://www.census.gov/did/www/saipe/data/statecounty/data/index.html).
- US Census Bureau, Survey Office. 2009. “ACS 2006–2008 Production Summary File: Technical Documentation.” Retrieved October 2, 2017 (https://demographics.texas.gov/Resources/ACS/2008/SF/TechDoc/ACS_2006_2008_3-Year_SF_Tech_Doc.pdf)
- Voos Paula B. 1983. “Determinants of U.S. Unionism: Past Research and Future Needs.” Industrial Relations 22(3):445–50. [Google Scholar]
- Wacquant Loïc. 2009. Punishing the Poor: The Neoliberal Government of Social Insecurity. Durham [NC]: Duke University Press. [Google Scholar]
- Wacquant Loïc. 2000. “The New `Peculiar Institution’: On the Prison as Surrogate Ghetto.” Theoretical Criminology 4(3):377–89. [Google Scholar]
- Weaver Vesla M. and Lerman Amy E.. 2010. “Political Consequences of the Carceral State.” American Political Science Review 104(4):817–833. [Google Scholar]
- Western Bruce and Beckett Katherine. 1999. “How Unregulated Is the US Labor Market? The Penal System as a Labor Market Institution.” The American Journal of Sociology 104(4):1030–1060. [Google Scholar]
- Western Bruce. 2002. “The Impact of Incarceration on Wage Mobility and Inequality.” American Sociological Review 67:526–546. [Google Scholar]
- Western Bruce. 2006. Punishment and Inequality in America. New York: Russell Sage Foundation. [Google Scholar]
- Western Bruce and Muller Christopher. 2013. “Mass Incarceration, Macrosociology, and the Poor.” The ANNALS of the American Academy of Political and Social Science 647(1):166–89. [Google Scholar]
- Zatz Noah D. 2008. “Working at the Boundaries of Markets: Prison Labor and the Economic Dimension of Employment Relations.” Vanderbilt Law Review 61:3:857–958. [Google Scholar]