Abstract
Background:
This study aimed to analyze and summarize the research hotspots and trends in neuroimaging biomarkers (NMBM) in Parkinson disease (PD) based on the Web of Science core collection database and provide new references for future studies.
Methods:
Literature regarding NMBM in PD from 1998 to 2022 was analyzed using the Web of Science core collection database. We utilized CiteSpace software (6.1R2) for bibliometric analyses of countries/institutions/authors, keywords, keyword bursts, references, and their clusters.
Results:
A total of 339 studies were identified with a continually increasing annual trend. The most productive country and collaboration was the United States. The top research hotspot is PD cognitive disorder. NMBM and artificial intelligence medical imaging have been applied in the clinical diagnosis, differential diagnosis, treatment, and prognosis of PD. The trends in this field include research on T1 weighted structure magnetic resonance imaging in accordance with voxel-based morphometry, PD cognitive disorder, and neuroimaging features of Lewy body dementia and Alzheimer disease.
Conclusion:
The development of NMBM in PD will be effectively promoted by drawing on international research hotspots and cutting-edge technologies, emphasizing international collaboration and institutional cooperation at the national level, and strengthening interdisciplinary research.
Keywords: bibliometric analysis, CiteSpace, neuroimaging biomarkers, Parkinson disease, Web of Science database
1. Introduction
Parkinson disease (PD) is the second most common neurodegenerative disease, after Alzheimer disease.[1–3] It has been reported that such disorders have a late onset and may affect approximately 1% of the population >65 years old,[4,5] and 4% of people aged >80 years.[4] Its incidence rates range from 8 to 18 per 100,000 persons annually,[4] with a prevalence rate of 19.9/100,000 persons in men and 9.9/100,000 persons in females.[6] Epidemiological studies have reported that most patients with PD (approximately 90%) have sporadic (90%) or late-onset PD.[7] Approximately 5% to 10% of patients with PD have early onset[8] and commonly occur in familial clusters.[9]
In recent years, an increasing number of studies have focused on PD, and neuroimaging biomarkers (NMBM) have attracted extensive attention from researchers. These studies involved NMBM, such as dopamine Positron Emission Tomography/Single-Photon Emission Computed Tomography,[10] nondopamine imaging (serotonin and cholinergic imaging,[11] metabolic and cerebral blood flow network neuroimaging[12]), and magnetic resonance imaging (MRI) (diffusion-weighted imaging,[13,14] neuromelanin-sensitive imaging,[15] iron-sensitive imaging,[16] and T1 weighted imaging[17]). Currently, an increasing number of studies have investigated imaging biomarkers of PD,[18–20] and few studies have analyzed and summarized the research hotspots and trends in NMBM in PD.
CiteSpace is a Java-based computer programming language explored by Professor Meichao Chen at Drexel University in the United States, which conducts bibliometric analyses of the literature in specific research fields.[21–23] It has been utilized to identify core researchers, institutions, countries/regions, keyword bursts, citation reference bursts, and their collaborative relationships, presenting research trends and hotspots through co-citation.[24,25] Based on the relevant PD literature of NMBM in the Web of Science (WOS) core collection database, a knowledge map was drawn using the CiteSpace software. This study aimed to explore the research status, hotspots, and trends of NMBM in PD over the past 2 decades and provide a reference for international research in the present field.
2. Methods
2.1. Ethical statement
This study did not need ethical approval, because no individual patient data was used.
2.2. Data acquisition
This study searched all relevant literature or review articles from the WOS core collection database from 1998 to 2022 based on MeSH words on April 2, 2022. Two authors separately performed the literature search. Any differences were resolved through discussion with the help of a third author. We used the following search string: TS=(“parkinson disease” OR “Idiopathic Parkinson’s Disease” OR “Lewy Body Parkinson’s Disease” OR “Parkinson’s Disease, Idiopathic” OR “Parkinson’s Disease, Lewy Body” OR “Parkinson Disease, Idiopathic” OR “Parkinson’s Disease” OR “Idiopathic Parkinson Disease” OR “Lewy Body Parkinson Disease” OR “Primary Parkinsonism” OR ”Parkinsonism, Primary”) AND TS=(“neuroimaging” OR “Brain Imaging” OR “Imaging, Brain”) AND TS=(“Biomarker” OR “Biomarkers” OR “Biological Marker” OR “Biological Markers” OR “Biologic Markers” OR “Marker, Biological” OR “Biologic Marker” OR “Marker, Biologic” OR “Markers, Biologic” OR “Biomarker” OR “Markers, Biological”).
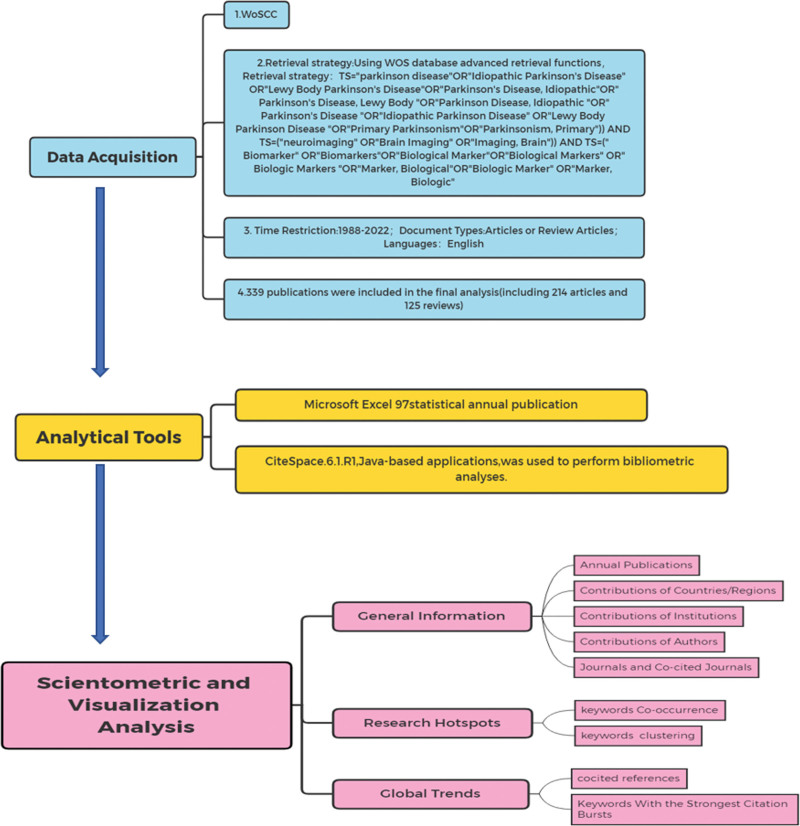
A total of 339 related studies were retrieved, and we chose “full text and cited references.” All retrieved literature was exported in plain-text format using CiteSpace 6.1R2. After removing the duplicates, 339 articles were included in the analysis. A flowchart of the study selection process is presented in Figure 1.
Figure 1.
Flowchart of study selection.
2.3. Analysis tool
Microsoft Excel 97 was used to calculate the number of publications annually. The CiteSpace software (6.1R2) tool was used to construct, analyze, and visualize bibliometric maps.[26,27] Our analysis included countries/regions, institutions, authors, keywords, co-citations of literature and journals, and bibliometric analysis. The nodes in each atlas represent the corresponding countries, institutions, authors, keywords, co-cited literature, co-cited journals, etc. The connections between nodes represent the cooperation of countries/regions, institutions, authors, co-occurrence of keywords, and co-citation of literature and journals. CiteSpace identifies parts of mediation centricity, with high mediation centricity representing turning points in the field. The parameters of CiteSpace were set as follows: time Slicin: 1998 to 2022, years per slice (1); text processing: term source (title, abstract, author keywords, keywords plus), term type, links and selection criteria, node type (country, institution, author, keyword, reference, cited journal), pruning (pathfinder, pruning sliced networks, and pruning the merged network). Detailed information is available at http://cluster.cis.drexel.edu/~cchen/citespace.
3. Results
3.1. Current status of research on NMBM of PD
3.1.1. Analysis of annual publications.
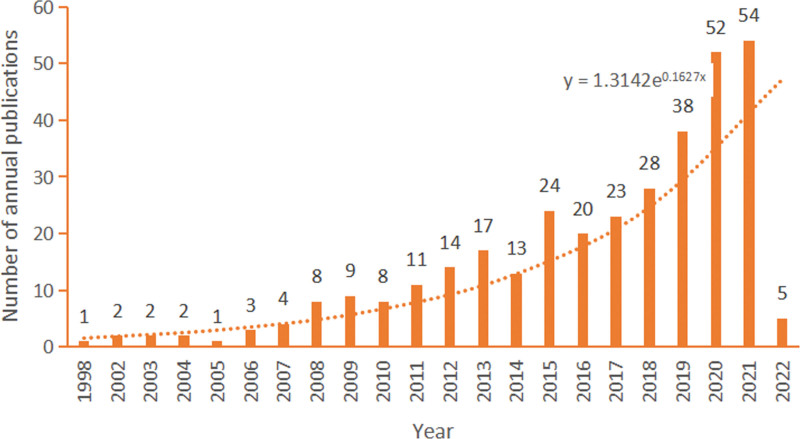
The annual number of publications is shown in Figure 2. As can be seen from this figure, the literature on NMBM of PD in the field shows a continuous growth trend, and the fitting curve index is y = 1.3142e0.1627x. The first paper was published in 1998, with a steady annual average number of approximately 1.14 published papers in 2005. This number has increased annually from 2006 to 2014, with an average of approximately 14.33 papers. This figure increased dramatically between 2015 and 2021, with an annual number of 39.83 articles. Due to the date of retrieval ending on April 2, 2022, the statistics of published literature in 2022 are incomprehensive. However, by fitting the curve, it is assumed that the number of publications by 2022 will increase.
Figure 2.
The annual number of publication.
3.1.2. Analysis of countries/regions.
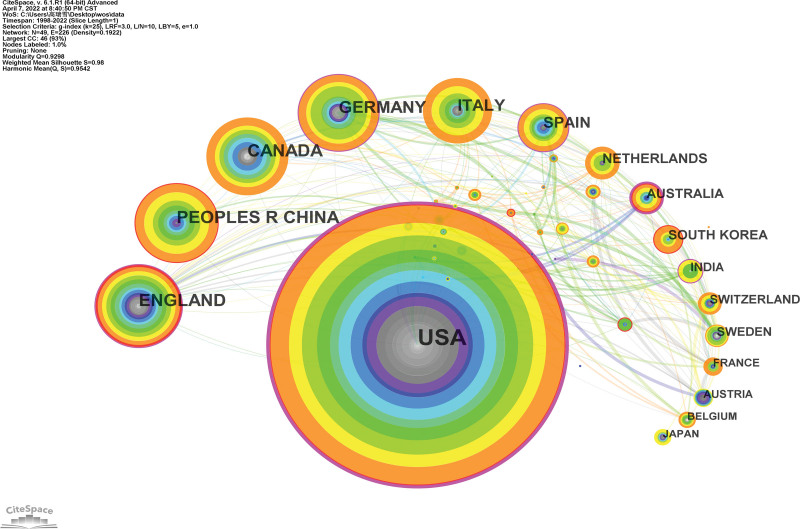
A national collaborative map of the NMBM of PD is shown in Figure 3. A total of 49 countries/regions contributed to this topic in the field. Each node represents a country/region and its size is proportional to the number of publications. Connections between nodes suggest collaborations, with a wider connection implying tighter collaboration.
Figure 3.
National collaborative map for NMBM of PD. NMBM = neuroimaging biomarkers, PD = Parkinson’s disease.
Table 1 lists the top 10 countries/regions. The United Kingdom had the highest number of publications (40), followed by China (39), Canada (38), Germany (37), Italy (32), Spain (23), the Netherlands (16), Australia (14), and South Korea (14). The country with the highest degree of centrality was the United States (0.46), followed by Australia, the United Kingdom, Germany, and the Netherlands.
Table 1.
The NMBM of PD research of top 10 countries/regions.
| Ranking | Country/region | Frequency | Centrality |
|---|---|---|---|
| 1 | USA | 137 | 0.46 |
| 2 | UK | 40 | 0.19 |
| 3 | China | 39 | 0.02 |
| 4 | Canada | 38 | 0.09 |
| 5 | Germany | 37 | 0.17 |
| 6 | Italy | 32 | 0.07 |
| 7 | Spain | 23 | 0.15 |
| 8 | Netherlands | 16 | 0.05 |
| 9 | Australia | 14 | 0.27 |
| 10 | South Korea | 14 | 0.00 |
China = the People’s Republic of China, NMBM = neuroimaging biomarker, PD = Parkinson disease, UK = The United Kingdom of Great Britain and Northern Ireland, USA = United States of America.
3.1.3. Analysis of institutions.
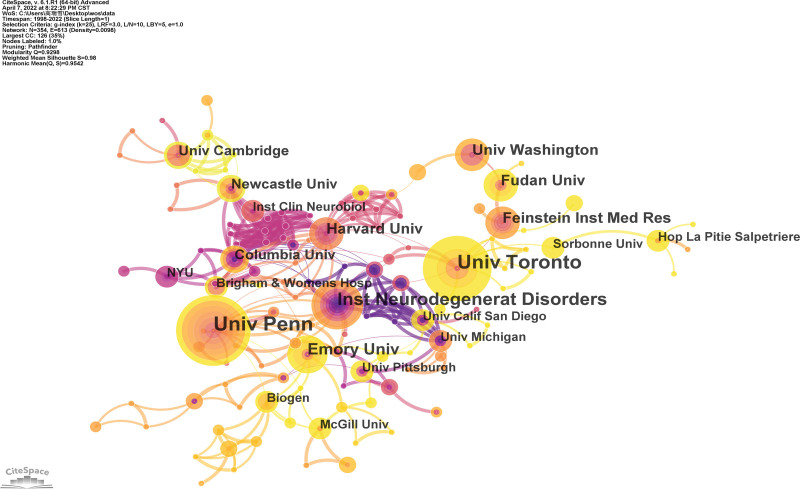
An institutional collaboration map for the NMBM of PD is shown in Figure 4. A total of 354 institutions contributed to this study and 628 connections were identified. Each node denotes an institution and the size of the node corresponds to the number of publications. Connections between nodes indicate collaboration, with a wider collection suggesting tighter collaboration. The top ten institutions are listed in Table 2. The largest number of publications was from the University of Pennsylvania, followed by the University of Toronto. The institution with the highest centrality was the Institute of Neurodegeneration Disorders (0.08), followed by the Harvard University.
Figure 4.
Institution collaboration map for NMBM of PD. NMBM = neuroimaging biomarkers, PD = Parkinson’s disease.
Table 2.
Frequency of the top 10 institutions for NMBM of PD.
| Ranking | Institution | Frequency | Centrality | Country |
|---|---|---|---|---|
| 1 | University of Pennsylvania (UPenn) | 13 | 0.05 | USA |
| 2 | University of Toronto (UT) | 12 | 0.05 | Canada |
| 3 | Institute for Neurodegenerative Disorders | 9 | 0.08 | USA |
| 4 | University of Groningen (UG) | 7 | 0.00 | Netherlands |
| 5 | Emory University (Emory) | 7 | 0.03 | USA |
| 6 | Feinstein Institute for Medical Research | 6 | 0.01 | USA |
| 7 | Fudan University | 6 | 0.01 | China |
| 8 | University of Washington (UW) | 6 | 0.00 | USA |
| 9 | Harvard University (Harvard) | 6 | 0.06 | USA |
| 10 | King’s College London (KCL) | 6 | 0.00 | UK |
China = the People’s Republic of China, NMBM = neuroimaging biomarker, PD = Parkinson disease, UK = The United Kingdom of Great Britain and Northern Ireland, USA = United States of America.
3.1.4. Analysis of authors.
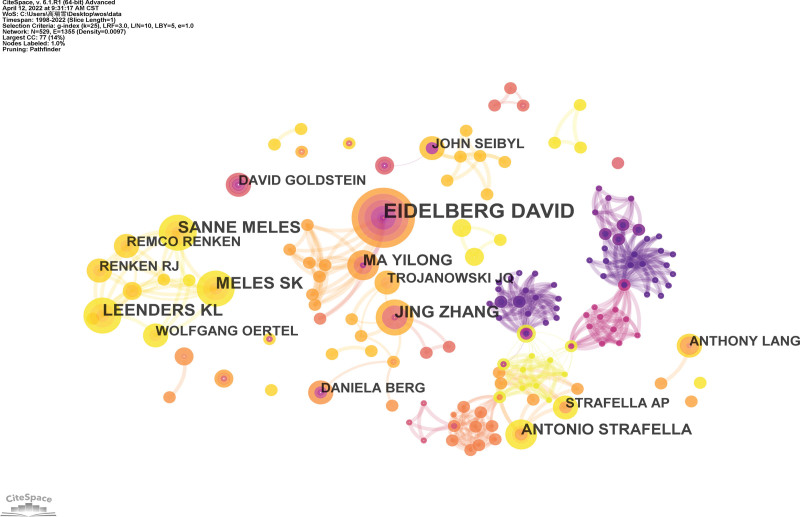
The co-author’s collaborative map of the NMBM for PD is shown in Figure 5. A total of 531 research authors published all the articles in this field. Each node indicates an author and its size is proportional to the number of publications, with a larger node indicating more publications. Connections between nodes imply collaboration, and a total of connections were identified. The wider the connection, the tighter is the collaboration.
Figure 5.
Co-author’s collaborative map of NMBM of PD. NMBM = neuroimaging biomarkers, PD = Parkinson’s disease.
The top 10 authors who published studies related to NMBM of PD are summarized in Table 3. The authors are active professionals in this field. The most productive authors came from the same team, David Eidelberg and Yilong Ma (Feinstein Institute for Medical Research), with 10 published articles. The second- and third-most productive authors were Sanne K. Meles (University of Groningen) and Klaus L. Leenders (University of Groningen), each with 6 publications. This was followed by Remco J. Renken (University of Groningen), Wolfgang H. Oertel (Philipps-Universität Marburg), Jing Zhang (University of Washington), Antonio P. Strafella (University of Toronto), Anthony E. Lang (University of Toronto), and John Q. Trojanowski (University of Pennsylvania).
Table 3.
The top 10 frequency authors of NMBM of PD.
| Ranking | Author | Frequency | Year | Country |
|---|---|---|---|---|
| 1 | David Eidelberg | 10 | 2007 | USA |
| 2 | Sanne K. Meles | 6 | 2019 | Netherlands |
| 3 | Klaus L. Leenders | 6 | 2019 | Netherlands |
| 4 | Jing Zhang | 6 | 2010 | USA |
| 5 | Yilong Ma | 6 | 2007 | USA |
| 6 | Antonio P. Strafella | 5 | 2017 | Canada |
| 7 | Wolfgang H. Oertel | 5 | 2020 | Germany |
| 8 | Remco J. Renken | 4 | 2019 | Netherlands |
| 9 | John Q. Trojanowski | 4 | 2017 | USA |
| 10 | Anthony E. Lang | 4 | 2015 | Canada |
NMBM = neuroimaging biomarker, PD = Parkinson disease, USA = United States of America.
Among the top 10 authors, the first article was published by American researchers in 2007, followed by Canadian (2015), Dutch (2019), German (2020), and other related studies.
3.1.5. Analysis of journals and co-cited journals.
The 339 articles retrieved in this study were published in 170 journals. The top 10 journals in terms of published articles are listed in Table 4. The journals that published the most number of studies on NMBM of PD were Movement Disorders (19), followed by Frontiers in Neurology (14), Parkinsonism Related Disorders (12), Current Opinion in Neurology (11), Frontiers in Aging Neuroscience (10), Journal of Parkinson’s Disease (9), Brain (9), NeuroImage-Clinical (9), Journal of Neural Transmission (8), and Current Neurology and Neuroscience Reports (7). From the perspective of influence, the average impact factor was 6.330, and out of 7/10 journals ranked Q1.
Table 4.
Top 10 frequency journals of NMBM of PD.
| Ranking | Journal | Frequency | IF (2020)* | Q (2020) |
|---|---|---|---|---|
| 1 | Movement Disorders | 19 | 10.338 | Q1 |
| 2 | Frontiers in Neurology | 14 | 4.008 | Q2 |
| 3 | Parkinsonism & Related Disorders | 12 | 4.891 | Q1 |
| 4 | Current Opinion in Neurology | 11 | 5.710 | Q1 |
| 5 | Frontiers in Aging Neuroscience | 10 | 5.750 | Q1 |
| 6 | Journal of Parkinson’s Disease | 9 | 5.568 | Q1 |
| 7 | Brain | 9 | 13.501 | Q1 |
| 8 | NeuroImage-Clinical | 9 | 4.881 | Q2 |
| 9 | Journal of Neural Transmission | 8 | 3.575 | Q2 |
| 10 | Current Neurology and Neuroscience Reports | 7 | 5.081 | Q1 |
IF = impact factor, NMBM = neuroimaging biomarker, PD = Parkinson disease, Q = quartile category.
IF and Q in category according to Journal Citation Reports (2020).
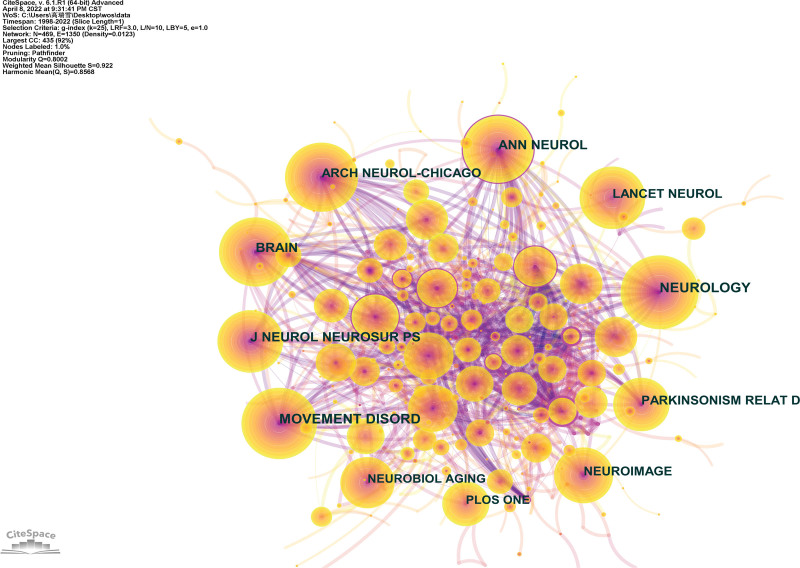
The collaborative map of the co-cited journals of the NMBM of PD is shown in Figure 6, involving 469 nodes and 2819 connections. Each node represents a co-cited journal, and the size of the node increases the co-citation frequency of the journal, with a larger node suggesting higher frequencies of the journal. Connection between nodes signifies the co-citation of the cited journals, with wider connections implying a higher frequency of co-cited journals.
Figure 6.
Co-cited journals’ collaborative map of NMBM of PD. NMBM = neuroimaging biomarkers, PD = Parkinson’s disease.
The top 10 journals in terms of co-citation frequency are listed in Table 5. The most frequently cited journals were Neurology (275 times), followed by Movement Disorders (255 times), Brain (241 times), Annals of Neurology (204 times), and Journal of Neurology, Neurosurgery, and Psychiatry (202 times), with over 200 co-citation frequencies. Annals of Neurology (0.11) had the highest centrality, followed by the Journal of Neurology and Archives of Neurology. Of these 10 journals, 9/10 are the current mainstream journals that belong to Q1. The average impact factor was 12.074.
Table 5.
Top 10 frequency cited journals of NMBM of PD.
| Ranking | Cited Journals | Frequency | Centrality | IIF ((2020)* | Q (2020) |
|---|---|---|---|---|---|
| 1 | Neurology | 275 | 0.04 | 9.910 | Q1 |
| 2 | Movement Disorders | 255 | 0.02 | 10.338 | Q1 |
| 3 | Brain | 241 | 0.01 | 13.501 | Q1 |
| 4 | Annals of Neurology | 204 | 0.11 | 10.422 | Q1 |
| 5 | Journal of Neurology, Neurosurgery and Psychiatry | 202 | 0.01 | 10.283 | Q1 |
| 6 | Lancet Neurology | 189 | 0.00 | 44.182 | Q1 |
| 7 | Archives of Neurology | 180 | 0.03 | 7.419 | Q1 |
| 8 | Parkinsonism & Related Disorders | 179 | 0.01 | 4.891 | Q1 |
| 9 | Neuroimage | 164 | 0.01 | 6.556 | Q1 |
| 10 | PLOS One | 148 | 0.00 | 3.240 | Q2 |
IF = impact factor, NMBM = neuroimaging biomarker, PD = Parkinson disease, Q = quartile category.
IF and Q in category according to Journal Citation Reports (2020).
3.1.6. Research hotspots and trends.
A research hotspot refers to the large number of articles or issues discussed within a certain period of time. Co-cited references, co-occurring keywords, and clustering can be used to identify hotspots and trends.
3.1.7. Analysis of co-cited reference.
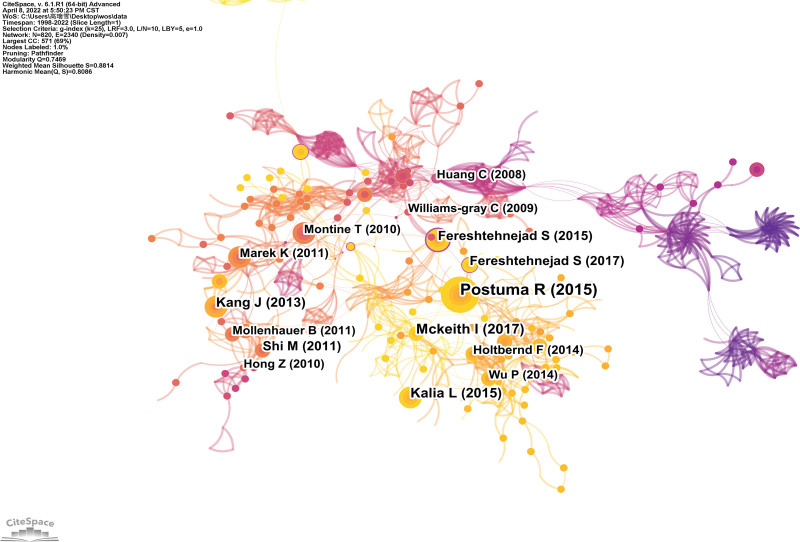
A map of the co-cited references of NMBM for PD is shown in Figure 7. A total of 820 nodes and 2542 connections were identified. Each node represents a cited reference. The node size indicates the frequency of co-cited references. The connection between nodes indicates co-citations, with a wider connection suggesting a higher frequency of co-citations.
Figure 7.
Map of co-cited references of NMBM of PD. NMBM = neuroimaging biomarkers, PD = Parkinson’s disease.
The top 10 co-cited references are listed in Table 6. The most co-cited article by Ronald B. Postuma (2015), entitled “MDS clinical diagnostic criteria for Parkinson’s disease” was published in Movement Disorders.[28,33] Then followed by Ian G. McKeith (2017), entitled “Diagnosis and management of dementia with Lewy bodies: Fourth consensus report of the DLB Consortium” was published in Neurology[29]; Lorraine V. Kalia (2015), entitled “Parkinson’s disease” was published in Lancet[30]; Ju-Hee Kang (2013), entitled “Association of cerebrospinal fluid β-amyloid 1-42, T-tau, P-tau181, and α-synuclein levels with clinical features of drug-naive patients with early Parkinson disease” was published in JAMA Neurology[31] and Seyed-Mohammad Fereshtehnejad (2015), entitled “New clinical subtypes of Parkinson disease and their longitudinal progression: A prospective cohort comparison with other phenotypes” was published in JAMA Neurology.[32]
Table 6.
The top 5 frequency of co-cited reference of NMBM of PD.
| Ranking | Cited reference | Representative author | Frequency | Journal | Publication year |
|---|---|---|---|---|---|
| 1 | MDS clinical diagnostic criteria for Parkinson’s disease[28] | Ronald B. Postuma | 22 | Movement Disorders | 2015 |
| 2 | Diagnosis and management of dementia with Lewy bodies: Fourth consensus report of the DLB Consortium[29] | Ian G. McKeith | 15 | Neurology | 2017 |
| 3 | Parkinson’s disease[30] | Lorraine V. Kalia | 14 | Lancet | 2015 |
| 4 | Association of cerebrospinal fluid β-amyloid 1-42, t-tau,p-tau181, and α-synuclein levels with clinical features of drug-naive patients with early Parkinson disease[31] | Ju-Hee. Kang | 13 | JAMA Neurology | 2013 |
| 5 | New clinical subtypes of Parkinson disease and their longitudinal progression: A prospective cohort comparison with other phenotypes[32] | Seyed-Mohammad. Fereshtehnejad | 12 | JAMA Neurology | 2015 |
NMBM = neuroimaging biomarker, PD = Parkinson disease.
The top 10 co-cited references with centrality are presented in Table 7.[32–36] The first top co-cited reference with the highest centrality (0.37) was Thomas G. Beach, who published a submandibular gland biopsy for the diagnosis of Parkinson disease in the Journal of Neuropathology & Experimental Neurology. In this study, we suggest that submandibular gland biopsy with Lewy α-synuclein may improve the accuracy of clinical diagnosis of PD.[33]
Table 7.
The top 5 centrality of co-cited reference of NMBM of PD.
| Ranking | Cited reference | Representative author | Centrality | Journal | Publication year |
|---|---|---|---|---|---|
| 1 | Submandibular gland biopsy for the diagnosis of Parkinson disease[33] | Thomas G. Beach | 0.37 | J Neuropath Exp Neurol | 2013 |
| 2 | New clinical subtypes of Parkinson disease and their longitudinal progression: A prospective cohort comparison with other phenotypes[32] | Seyed-Mohammad Fereshtehnejad | 0.36 | JAMA Neurol | 2015 |
| 3 | Biomarkers for cognitive impairment in Parkinson disease[34] | Min Shi | 0.34 | Brain Pathol | 2010 |
| 4 | Cognitive impairment in incident, untreated Parkinson disease[35] | D. Aarsland | 0.33 | Neurology | 2009 |
| 5 | Using support vector machine to identify imaging biomarkers of neurological and psychiatric disease: A critical review[36] | Graziella Orrù | 0.33 | Neurosci Biobehav Rev | 2012 |
NMBM = neuroimaging biomarker, PD = Parkinson disease.
3.1.8. Analysis of keywords co-occurrence and clustering.
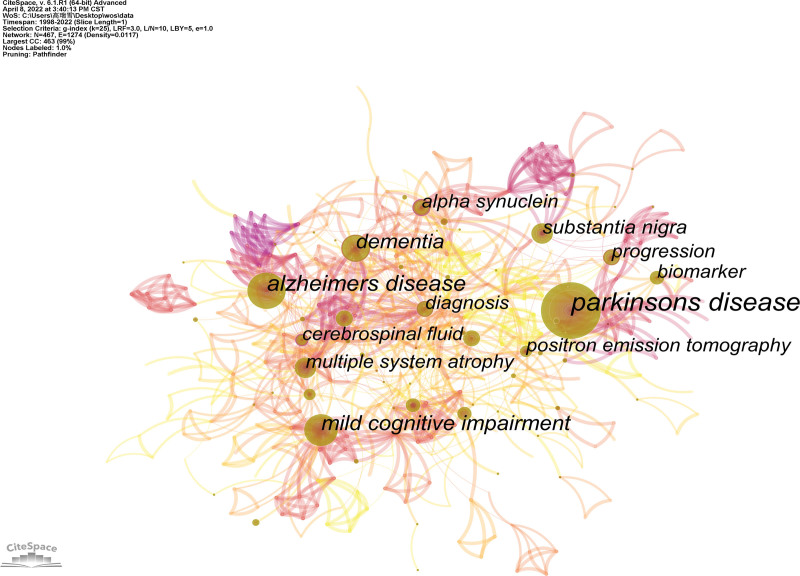
A keyword map of the NMBM for PD is shown in Figure 8. CiteSpace builds a keyword co-occurrence map with 467 nodes and 1943 connections (Figure 8). Each node represents the frequency of the keywords, with a larger node implying more frequencies. The connection between nodes indicates keyword co-occurrence.
Figure 8.
Keywords map of NMBM of PD. NMBM = neuroimaging biomarkers, PD = Parkinson’s disease.
The top 5 frequencies of keyword co-occurrence are listed in Table 8. The most frequent keyword was Parkinson’s disease (176 times), followed by Alzheimer’s disease (86 times), mild cognitive impairment (69 times), dementia (58 times), and substantia nigra (45 times). The high centrality keywords suggest hotspots and turning points in this field, and its value is between 0 and 1, with a value of > 0.1 exerts higher centrality. High-frequency keywords do not necessarily have a high centrality. From the perspective of centrality, the top 5 keywords were cerebrospinal fluid, alpha-synuclein, cerebral blood flow, beta, and diagnosis.
Table 8.
Top 5 frequency and centrality of NMBM of PD.
| Ranking | Frequency | Keywords | Centrality | Ranking | Centrality | Keywords | Frequency |
|---|---|---|---|---|---|---|---|
| 1 | 176 | parkinsons disease | 0.02 | 1 | 0.29 | cerebrospinal fluid | 39 |
| 2 | 86 | alzheimers disease | 0.06 | 2 | 0.22 | alpha synuclein | 40 |
| 3 | 69 | mild cognitive impairment | 0.09 | 3 | 0.20 | cerebral blood flow | 8 |
| 4 | 58 | dementia | 0.17 | 4 | 0.19 | a beta | 6 |
| 5 | 45 | substantia nigra | 0.09 | 5 | 0.18 | diagnosis | 42 |
NMBM = neuroimaging biomarker, PD = Parkinson disease.
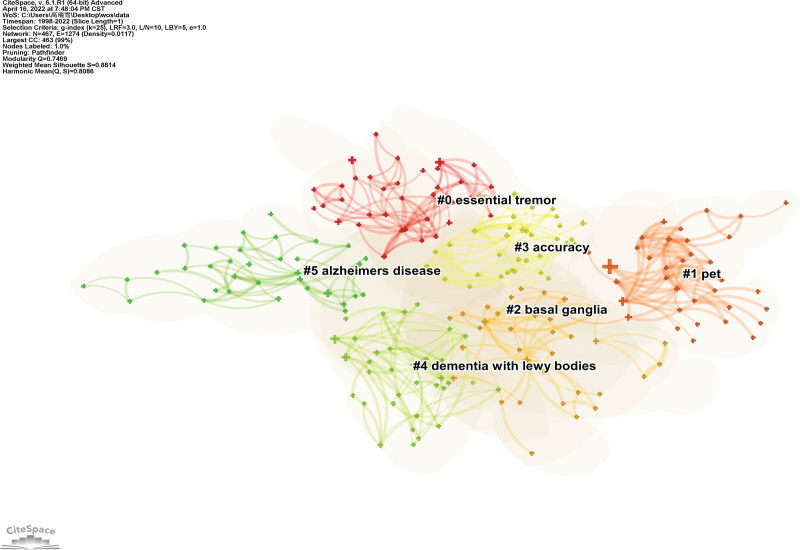
A map of the keyword clusters of the NMBM for PD is presented in Figure 9. Based on the co-occurrence analysis of keywords, a log-likelihood test cluster analysis was used to analyze keywords. A total of 17 clusters were obtained, and the first 6 clusters were selected for analysis. Each node represents 1 cluster. The Q value (cluster module value) was 0.7469 (>0.3), which indicated a significant cluster structure, and the S value (average profile value) was 0.8814, which indicated high consistency of cluster members.
Figure 9.
Map of keywords clusters of NMBM of PD. NMBM = neuroimaging biomarkers, PD = Parkinson’s disease.
The first 6 keyword clusters are listed in Table 9. They were “essential tremor,” “pet,” “basal ganglia,” “accuracy,” “dementia with Lewy body,” and “Alzheimer’s disease.” The value of each cluster profile was >0.5, indicating high clustering consistency and good homogeneity.
Table 9.
Top 6 keywords clusters of NMBM of PD.
| Cluster ID | Scale | Modularity value | Year of publication | Keywords (LLR) |
|---|---|---|---|---|
| #0 | 38 | 0.820 | 2011 | essential tremor (11.22, 0.001); orthostatic hypotension (10.36, 0.005); olfactory dysfunction (6.7, 0.01); lewy body disease (6.7, 0.01) |
| #1 | 37 | 0.926 | 2007 | pet (10.35, 0.005); parkinsons disease (8.17, 0.005); levodopa (7.47, 0.01); cerebrospinal fluid (7.36, 0.01) |
| #2 | 36 | 0.800 | 2013 | basal ganglia (23.51, 1.0E-4); cortical thickness (11.48, 0.001); fdg-pet (7.77, 0.01); brain (7.23, 0.01); gray matter (6.16, 0.05) |
| #3 | 36 | 0.717 | 2015 | accuracy (13.02, 0.001); machine learning (7.29, 0.01); dat-spect (6.5, 0.05); multimodal imaging (6.5, 0.05); neural networks (6.5, 0.05) |
| #4 | 35 | 0.878 | 2014 | dementia with lewy bodies (9.27, 0.005); support vector machine (SVM) (6.61, 0.05); cognitive function (6.61, 0.05); positron emission tomography (6.07, 0.05); rem sleep behavior disorder (5.63, 0.05) |
LLR = log-likelihood test, NMBM = neuroimaging biomarker, PD = Parkinson disease.
3.1.9. Analysis of keywords with the strongest citation bursts.
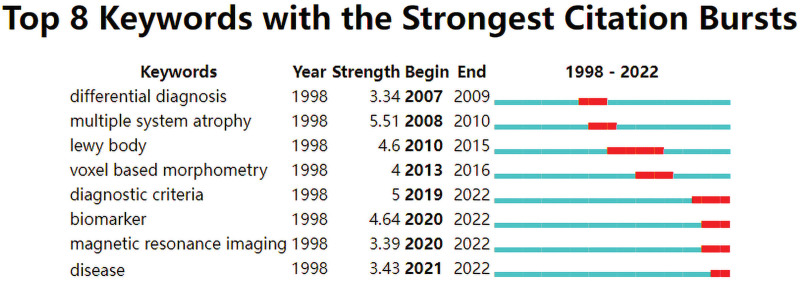
“Burst words” refers to keywords that reflected the research hotspots and trends and cited frequently at different periods. The connection indicates the period from 1998 to 2022, with the red connection denoting the period from the occurrence of the keyword to its end. The top 8 burst keywords of NMBM for PD are shown in Figure 10. The 8 burst words were differential diagnosis, multiple system atrophy, Lewy body, voxel-based morphometry, diagnostic criteria, biomarkers, magnetic resonance imaging, and disease. Keywords with citation bursts first appeared in 2007. The 4 highest strength burst keywords were “differential diagnosis,” “multiple system atrophy,” “Lewy body,” and “voxel-based morphometry.”
Figure 10.
Top 8 burst keywords of NMBM of PD. NMBM = neuroimaging biomarkers, PD = Parkinson’s disease.
4. Discussion
This study collected data from relevant studies using the WOS core collection database. A bibliometric analysis of NMBM in PD research from 1998 to 2022 was conducted. It summarizes the general information, research hotspots, and trends of NMBM in PD.
4.1. General information for NMBM of PD research
As can be seen from the annual publications about NMBM in PD, its development is categorized into 3 stages in this field:
only 0 to 2 studies were published from 1998 to 2005, which indicated a preliminary investigation of NMBM for evaluating PD;
the number of publications increased steadily from 2006 to 2014. The total number of studies showed an increasing trend, with an annual average number of 14.33;
there were a number of explosive publications (annual publications of 39.83) from 2015 to 2021, which indicated that the research on NMBM in PD entered into a period of rapid development in this domain.
Analyzing the collaborative network among countries, institutions, and authors, it was concluded that the United States had the highest centrality, earliest research, and most publications in the field of NMBM in PD. This shows that the United States has the greatest influence in this field. The major institutions are the University of Pennsylvania, Institute of Neurodegenerative Disorders, Emory University, Feinstein Institute for Medical Research, University of Washington, and Harvard University.
The authors are David Eidelberg and Yilong Ma from the Feinstein Institute for Medical Research, Jing Zhang from the University of Washington, and John Q. Trojanowski from the University of Pennsylvania. David Eidelberg, whose research focused on the association between brain metabolism and blood flow in PD,[37–42] primarily investigated the expression of metabolic brain networks in PD using the 18F-FDG-PET image reconstruction algorithm.[43,44] The second-highest publication country is the United Kingdom, with the representative institution of King’s College London. The third-largest country is China, with the representative institution of Fudan University. Countries, institutions, and authors all have certain collaborations with each other. However, there is less cooperation among countries but closer collaboration among authors within national institutions. Thus, it is important to establish long-term and stable collaborations among authors and institutions across international countries, which is beneficial for further development of NMBM in PD in this field.
The top published journal is Movement Disorders and the top-cited journal is Neurology. The research fields of both journals are clinical neurology, and both are Q1 journals, which have a high academic status and international influence, indicating that the research quality of NMBM in PD is high. In addition, publishing in high-quality journals contributes to the cooperation and exchange of scholars across different regions.
4.2. Research hotspots and trends of NMBM in PD
This study discusses the hotspots and trends of NMBM in PD from the aspects of co-citation references, co-occurrence, cluster, and bursts of keywords. Keyword co-occurrence and clusters indicate hot topics in this field, and keyword bursts may suggest frontier topics or emerging trends in this field.[24] We can obtain research results with high attention in this field through an analysis of publications with high citation frequency and centrality, which reveals the focus areas of scholars.
This study analyzed the co-occurrence and cluster of keywords to understand the research focus of NMBM in PD. The high-frequency keywords were Alzheimer’s disease, mild cognitive impairment, dementia, and substantia nigra, but not all of them had high centrality, which often reflects the turning point of the map of keyword frequency. The keywords with high centrality were cerebrospinal fluid, alpha-synuclein, cerebral blood flow, beta, and diagnosis, which play an effective role in supporting the research network in this field. Of those, dementia was the high-frequency keyword with centrality of 0.17 (>0.1). Along with cerebrospinal fluid, alpha synuclein, cerebral blood flow, beta, and diagnosis are hot topics in this research field.
This study explored the research trends in NMBM in PD, in accordance with the literature on co-cited references and keyword bursts in this field. The top 8 strongest citation bursts of keywords were differential diagnosis, diagnostic criteria, biomarkers, Lewy body, voxel-based morphometry, biomarkers, MRI, and disease. Among these, diagnostic criteria, biomarkers, magnetic resonance imaging, and disease have been hotspots and trends of research since 2019.
This analysis consisted of the following aspects. First, it focuses on NMBM in PD, which provides a better understanding of PD through biomarkers, diagnosis, treatment, and monitoring of PD progression, and further improves its diagnostic criteria and differential diagnosis. Current research methods for NMBM include T1-weighted MRI, dopaminergic Positron Emission Tomography/Single-Photon Emission Computed Tomography, nondopaminergic PET, metabolic and network imaging, iron-sensitive MRI, free-water imaging, and neuromelanin-sensitive MRI. According to Kraemmer et al’s[45] study, PET or SPECT presents abnormally only when a large number of dopaminergic neurons are lost in substantia nigra pars compacta, which is incredible in the differential diagnosis of atypical Parkinson syndrome.[45] T1-weighted MRI with voxel-based morphometry has some advantages in differentiating PD from atypical Parkinson syndrome.[46] However, there are limitations to using different NMBM. Bougea[18] suggested that a combination of multiple biomarkers can improve the early diagnosis and more accurate prognosis of PD. Thus, exploring more valuable NMBM remains a focus in this field.
Second, it focuses on disease research. With further study of NMBM in pathology, studies have reported the key pathological features of PD as the loss of dopaminergic neurons in substantia nigra pars compacta,[47] α-synuclein insolubilization, and aggregation of Lewy bodies and intracellular inclusions in Louie neurites,[48] SNCA,[49] LRRK2,[50] VPS35,[51,52] EIF4G1,[53] DNAJC13,[54] and CHCHD2[55] gene mutation. It is still difficult to differentiate cognitive impairment in patients with PD from that in those with dementia or Alzheimer disease. Manuel Delgado-Alvarado summarized the potential biomarkers of dementia and mild cognitive impairment in patients with PD over the past 25 years, and concluded decreased cholinergic innervation and metabolism in the posterior midbrain region by PET and hippocampal atrophy on MRI. The results indicate that there may be dementia or dementia risk, suggesting a longitudinal study combining existing techniques and new methods to identify dementia risk in PD.[56] In February 2018, Hanna-Pladdy conducted a 5-year prospective longitudinal cohort study of biomarkers to predict cognitive progress in patients with PD. This study established a combination of cognitive and fMRI methods for the early recognition of cognitive progression risks and for the use of graph theory analysis to establish phenotypes of PD connectives.[57] It is also used to establish predictive models, fMRI biomarkers, and to explore PD cognitive impairment and common clinical dementia as the research frontiers in this field.
Third, previous studies have focused on neuroimaging technology. With the development of artificial intelligence, the recognition of neural and mental NMBM by the support vector machine (SVM) has become a current research hotspot and trend. Some scholars have applied the computer-aided classification technology of the SVM learning model to distinguish patients with PD, and have obtained better classification efficiency and coincidence rate of clinical diagnosis. SVM has become a new assessment tool for PD instead of clinical manual evaluation, and has become a classification technique for subtypes of PD.[58] Artificial intelligence combines big data, classifiers, SVM, and machine learning to build models for the early assessment of PD cognition. In addition to the differential diagnosis of Lewy body dementia, Alzheimer disease and frontotemporal dementia have become frontier topics of current research.
5. Limitation
A bibliometric analysis of publications on NMBM in PD using CiteSpace was conducted in this study. We only analyzed publications from the WOS core collection because of the limitation of the CiteSpace software, and only English publications were analyzed, which may have resulted in incomprehensive literature sources. In addition, CiteSpace is simply a network of visualization and analysis, and the diseases covered by the study need to be considered in future analyses.
6. Conclusion
This study summarizes the general information, research hotspots, and trends in NMBM in PD. The current research status shows that the study of NMBM in PD develops rapidly, which indicates that collaborations among scholars, institutions, and countries need to be enhanced. The research hotspots and trends are to explore new NMBM and artificial intelligence medical imaging for the early prediction, clinical diagnosis, differential diagnosis, and treatment evaluation of PD. The most frequently studied disorder is cognitive impairment in PD.
Author contributions
Conceptualization: Ang Li, Jinhuan Yue, Li-na Cai, Qinhong Zhang, Rui-xue Gao, Sheng-lan Gao, Wei-wei Zhao, Xiao-ling Li, Yang Wang.
Data curation: Ang Li, Jinhuan Yue, Li-na Cai, Qinhong Zhang, Rui-xue Gao, Sheng-lan Gao, Wei-wei Zhao, Xiao-ling Li, Yang Wang.
Formal analysis: Rui-xue Gao.
Funding acquisition: Qinhong Zhang, Xiao-ling Li.
Investigation: Jinhuan Yue, Qinhong Zhang.
Methodology: Qinhong Zhang, Rui-xue Gao, Wei-wei Zhao.
Project administration: Jinhuan Yue, Qinhong Zhang.
Resources: Li-na Cai, Rui-xue Gao, Sheng-lan Gao, Xiao-ling Li, Yang Wang.
Software: Rui-xue Gao, Yang Wang.
Supervision: Jinhuan Yue, Qinhong Zhang.
Validation: Ang Li, Jinhuan Yue, Li-na Cai, Qinhong Zhang, Rui-xue Gao, Sheng-lan Gao, Wei-wei Zhao, Xiao-ling Li, Yang Wang.
Visualization: Ang Li, Jinhuan Yue, Li-na Cai, Qinhong Zhang, Rui-xue Gao, Sheng-lan Gao, Wei-wei Zhao, Xiao-ling Li, Yang Wang.
Writing – original draft: Ang Li, Jinhuan Yue, Qinhong Zhang, Rui-xue Gao, Xiao-ling Li, Yang Wang.
Writing – review & editing: Ang Li, Jinhuan Yue, Li-na Cai, Qinhong Zhang, Rui-xue Gao, Sheng-lan Gao, Wei-wei Zhao, Xiao-ling Li, Yang Wang.
Abbreviations:
- MRI =
- magnetic resonance imaging
- NMBM =
- neuroimaging biomarkers
- PD =
- Parkinson’s disease
- SVM =
- support vector machine
- WOS =
- Web of Science
X-LL, R-XG, Q-HZ and AL contributed equally to this work.
This study was supported by the National Foundation of Natural Science of China (82074537), the Natural Science of Heilongjiang Province (LH2020H103), and District-level Research Projects of Longhua District Health Care Institutions in 2022 (2022010). The funding agencies did not participate in any part of the study.
The authors have no conflicts of interest to disclose.
The datasets generated during and/or analyzed during the current study are available from the corresponding author on reasonable request.
Declaration of competing interest statement: The authors have declared that none of them have any conflict of interest in connection with this study.
How to cite this article: Li X-L, Gao R-X, Zhang Q, Li A, Cai L-N, Zhao W-W, Gao S-L, Wang Y, Yue J. A bibliometric analysis of neuroimaging biomarkers in Parkinson disease based on Web of Science. Medicine 2022;101:33(e30079).
Contributor Information
Xiao-Ling Li, Email: ang.li.phd@outlook.com.
Rui-Xue Gao, Email: gaoshenglan8525@163.com.
Qinhong Zhang, Email: zhangqh0451@163.com.
Ang Li, Email: ang.li.phd@outlook.com.
Li-Na Cai, Email: cailina1323@163.com.
Wei-Wei Zhao, Email: zhaoww0601@126.com.
Sheng-Lan Gao, Email: gaoshenglan8525@163.com.
Yang Wang, Email: 15246650505@163.com.
References
- [1].Yu H, Sun T, An J, et al. Potential roles of exosomes in Parkinson’s disease: from pathogenesis, diagnosis, and treatment to prognosis. Front Cell Dev Biol. 2020; 8:86. [DOI] [PMC free article] [PubMed] [Google Scholar]
- [2].Sudmeyer M, Wojtecki L, Schnitzler A. Current treatment strategies for Parkinson’s disease. Fortschr Neurol Psychiatr. 2011;79:733–43. [DOI] [PubMed] [Google Scholar]
- [3].Aarsland D, Kurz MW. The epidemiology of dementia associated with Parkinson’s disease. Brain Pathol. 2010;20:633–9. [DOI] [PMC free article] [PubMed] [Google Scholar]
- [4].De Lau LM, Breteler MM. Epidemiology of Parkinson’s disease. Lancet Neurol. 2006;5:525–35. [DOI] [PubMed] [Google Scholar]
- [5].Ascherio A, Schwarzschild MA. The epidemiology of Parkinson’s disease: risk factors and prevention. Lancet Neurol. 2016;15:1257–72. [DOI] [PubMed] [Google Scholar]
- [6].Van Den Eeden SK, Tanner CM, Bernstein AL, et al. Incidence of Parkinson’s disease: variation by age, gender, and race/ethnicity. Am J Epidemiol. 2003;157:1015–22. [DOI] [PubMed] [Google Scholar]
- [7].Tanner CM. Is the cause of Parkinson’s disease environmental or hereditary? Evidence from twin studies. Adv Neurol. 2003;91:133–42. [PubMed] [Google Scholar]
- [8].Samii A, Nutt JG, Ransom BR. Parkinson’s disease. Lancet. 2004;363:1783–93. [DOI] [PubMed] [Google Scholar]
- [9].Mizuno Y, Hattori N, Kitada T, et al. Familial Parkinson’s disease. α-Synuclein and parkin. Adv Neurol. 2001;86:13–21. [PubMed] [Google Scholar]
- [10].Iranzo A, Valldeoriola F, Lomeña F, et al. Serial dopamine transporter imaging of nigrostriatal function in patients with idiopathic rapid-eye-movement sleep behaviour disorder: a prospective study. Lancet Neurol. 2011;10:797–805. [DOI] [PubMed] [Google Scholar]
- [11].Bedard MA, Aghourian M, Legault-Denis C, et al. Brain cholinergic alterations in idiopathic REM sleep behaviour disorder: a PET imaging study with (18)F-FEOBV. Sleep Med. 2019;58:35–41. [DOI] [PubMed] [Google Scholar]
- [12].Kogan RV, de Jong BA, Renken RJ, et al. Factors affecting the harmonization of disease-related metabolic brain pattern expression quantification in [18F]FDG-PET (PETMETPAT). Alzheimers Dement (Amst). 2019;11:472–82. [DOI] [PMC free article] [PubMed] [Google Scholar]
- [13].Zhang Y, Wu IW, Tosun D, et al. Progression of regional microstructural degeneration in Parkinson’s disease: a multicenter diffusion tensor imaging study. PLoS One. 2016;11:e0165540e0165540. [DOI] [PMC free article] [PubMed] [Google Scholar]
- [14].Loane C, Politis M, Kefalopoulou Z, et al. Aberrant nigral diffusion in Parkinson’s disease: a longitudinal diffusion tensor imaging study. Mov Disord. 2016;31:1020–6. [DOI] [PubMed] [Google Scholar]
- [15].Matsuura K, Maeda M, Tabei KI, et al. A longitudinal study of neuromelanin-sensitive magnetic resonance imaging in Parkinson’s disease. Neurosci Lett. 2016;633:112–7. [DOI] [PubMed] [Google Scholar]
- [16].Guan X, Xu X, Zhang M. Region-specific iron measured by MRI as a biomarker for Parkinson’s disease. Neurosci Bull. 2017;33:561–7. [DOI] [PMC free article] [PubMed] [Google Scholar]
- [17].Jia X, Liang P, Li Y, et al. Longitudinal study of gray matter changes in Parkinson disease. AJNR Am J Neuroradiol. 2015;36:2219–26. [DOI] [PMC free article] [PubMed] [Google Scholar]
- [18].Bougea A. New markers in Parkinson’s disease. Adv Clin Chem. 2020;96:137–78. [DOI] [PubMed] [Google Scholar]
- [19].Sharma S, Moon CS, Khogali A, et al. Biomarkers in Parkinson’s disease (recent update). Neurochem Int. 2013;63:201–29. [DOI] [PubMed] [Google Scholar]
- [20].He RC, Yan XX, Guo JF, et al. Recent advances in biomarkers for Parkinson’s disease. Front Aging Neurosci. 2018;10:305. [DOI] [PMC free article] [PubMed] [Google Scholar]
- [21].Chen C. CiteSpace II: detecting and visualizing emerging trends and transient patterns in scientific literature. J Am Soc Inf Sci Tec. 2006;57:359–77. [Google Scholar]
- [22].Zhang J, Zhang Y, Hu L, et al. Global trends and performances of magnetic resonance imaging studies on acupuncture: a bibliometric analysis. Front Neurosci. 2020;14:620555. [DOI] [PMC free article] [PubMed] [Google Scholar]
- [23].Wu H, Zhou Y, Wang Y, et al. Current state and future directions of intranasal delivery route for central nervous system disorders: a scientometric and visualization analysis. Front Pharmacol. 2021;12:717192. [DOI] [PMC free article] [PubMed] [Google Scholar]
- [24].Chen C, Song M. Visualizing a field of research: a methodology of systematic scientometric reviews. PLoS One. 2019;14:e0223994e0223994. [DOI] [PMC free article] [PubMed] [Google Scholar]
- [25].Chen C, Ibekwe-Sanjuan F, Hou JH. The structure and dynamics of co citation clusters: a multiple perspective co-citation analysis. J Am Soc Inf Sci Tec. 2019;61:1386–409. [Google Scholar]
- [26].van Eck NJ, Waltman L. Software survey: VOSviewer, a computer program for bibliometric mapping. Scientometrics. 2010;84:523–38. [DOI] [PMC free article] [PubMed] [Google Scholar]
- [27].van Eck NJ, Waltman L, Noyons ECM, et al. Automatic term identification for bibliometric mapping. Scientometrics. 2010;82:581–96. [DOI] [PMC free article] [PubMed] [Google Scholar]
- [28].Postuma RB, Berg D, Stern M, et al. MDS clinical diagnostic criteria for Parkinson’s disease. Mov Disord. 2015;30:1591–601. [DOI] [PubMed] [Google Scholar]
- [29].McKeith IG, Boeve BF, Dickson DW, et al. Diagnosis and management of dementia with Lewy bodies: fourth consensus report of the DLB Consortium. Neurology. 2017;89:88–100. [DOI] [PMC free article] [PubMed] [Google Scholar]
- [30].Kalia LV, Lang AE. Parkinson’s disease. Lancet. 2015;386:896–912. [DOI] [PubMed] [Google Scholar]
- [31].Kang JH, Irwin DJ, Chen-Plotkin AS, et al. Association of cerebrospinal fluid β-amyloid 1-42, T-tau, P-tau181, and α-synuclein levels with clinical features of drug-naive patients with early Parkinson disease. JAMA Neurol. 2013;70:1277–87. [DOI] [PMC free article] [PubMed] [Google Scholar]
- [32].Fereshtehnejad SM, Romenets SR, Anang JB, et al. New clinical subtypes of Parkinson disease and their longitudinal progression: a prospective cohort comparison with other phenotypes. JAMA Neurol. 2015;72:863–73. [DOI] [PubMed] [Google Scholar]
- [33].Beach TG, Adler CH, Dugger BN, et al. Submandibular gland biopsy for the diagnosis of Parkinson disease. J Neuropathol Exp Neurol. 2013;72:130–6. [DOI] [PMC free article] [PubMed] [Google Scholar]
- [34].Shi M, Huber BR, Zhang J. Biomarkers for cognitive impairment in Parkinson disease. Brain Pathol. 2010;20:660–71. [DOI] [PMC free article] [PubMed] [Google Scholar]
- [35].Aarsland D, Brønnick K, Larsen JP, et al. Cognitive impairment in incident, untreated Parkinson disease: the Norwegian ParkWest study. Neurology. 2009;72:1121–6. [DOI] [PubMed] [Google Scholar]
- [36].Orrù G, Pettersson-Yeo W, Marquand AF, et al. Using support vector machine to identify imaging biomarkers of neurological and psychiatric disease: a critical review. Neurosci Biobehav Rev. 2012;36:1140–52. [DOI] [PubMed] [Google Scholar]
- [37].Peng SC, Eidelberg D, Ma YL. Brain network markers of abnormal cerebral glucose metabolism and blood flow in Parkinson’s disease. Neurosci Bull. 2014;30: 823–37. [DOI] [PMC free article] [PubMed] [Google Scholar]
- [38].Eckert T, Tang CK, Ma YL, et al. Abnormal metabolic networks in atypical parkinsonism. Mov Disord. 2008;23:727–33. [DOI] [PubMed] [Google Scholar]
- [39].Ma YL, Peng SC, Spetsieris PG, et al. Abnormal metabolic brain networks in a nonhuman primate model of parkinsonism. J Cereb Blood Flow Metab. 2012;32:633–42. [DOI] [PMC free article] [PubMed] [Google Scholar]
- [40].Eidelberg D. Metabolic brain networks in neurodegenerative disorders: a functional imaging approach. Trends Neurosci. 2009;32:548–57. [DOI] [PMC free article] [PubMed] [Google Scholar]
- [41].Hirano S, Eckert T, Flanagan T, et al. Metabolic networks for assessment of therapy and diagnosis in Parkinson’s disease. Mov Disord. 2009;24:S725–31. [DOI] [PMC free article] [PubMed] [Google Scholar]
- [42].Tomse P, Jensterle L, Grmek M, et al. Abnormal metabolic brain network associated with Parkinson’s disease: replication on a new European sample. Neuroradiology. 2017;59:507–15. [DOI] [PubMed] [Google Scholar]
- [43].Tomse P, Jensterle L, Rep S, et al. The effect of 18F-FDG-PET image reconstruction algorithms on the expression of characteristic metabolic brain network in Parkinson’s disease. Phys Med. 2017;41:129–35. [DOI] [PMC free article] [PubMed] [Google Scholar]
- [44].Ma YL, Johnston TH, Peng SC, et al. Reproducibility of a parkinsonism-related metabolic brain network in non-human primates: a descriptive pilot study with FDG PET. Mov Disord. 2015;30:1283–8. [DOI] [PMC free article] [PubMed] [Google Scholar]
- [45].Kraemmer J, Kovacs GG, Perju-Dumbrava L, et al. Correlation of striatal dopamine transporter imaging with post mortem substantia nigra cell counts. Mov Disord. 2014;29:1767–73. [DOI] [PubMed] [Google Scholar]
- [46].Chougar L, Faouzi J, Pyatigorskaya N, et al. Automated categorization of parkinsonian syndromes using magnetic resonance imaging in a clinical setting. Mov Disord. 2021;36:460–70. [DOI] [PubMed] [Google Scholar]
- [47].Dickson DW. Neuropathology of Parkinson disease. Parkinsonism Relat Disord. 2018;46(Suppl 1):S30–3. [DOI] [PMC free article] [PubMed] [Google Scholar]
- [48].Goedert M, Spillantini MG, Tredici KD, et al. 100 years of Lewy pathology. Nat Rev Neurol. 2013;9:13–24. [DOI] [PubMed] [Google Scholar]
- [49].Polymeropoulos MH, Lavedan C, Leroy E, et al. Mutation in the alpha-synuclein gene identified in families with Parkinson’s disease. Science. 1997;276:2045–7. [DOI] [PubMed] [Google Scholar]
- [50].Healy DG, Falchi M, O’Sullivan SS, et al. Phenotype, genotype, and worldwide genetic penetrance of LRRK2-associated Parkinson’s disease: a case-control study. Lancet Neurol. 2008;7:583–90. [DOI] [PMC free article] [PubMed] [Google Scholar]
- [51].Vilariño-Güell C, Wider C, Ross OA, et al. VPS35 mutations in Parkinson disease. Am J Hum Genet. 2011;89:162–7. [DOI] [PMC free article] [PubMed] [Google Scholar]
- [52].Zimprich A, Benet-Pagès A, Struhal W, et al. A mutation in VPS35, encoding a subunit of the retromer complex, causes late-onset Parkinson disease. Am J Hum Genet. 2011;89:168–75. [DOI] [PMC free article] [PubMed] [Google Scholar]
- [53].Chartier-Harlin MC, Dachsel JC, Vilariño-Güell C, et al. Translation initiator EIF4G1 mutations in familial Parkinson disease. Am J Hum Genet. 2011;89:398–406. [DOI] [PMC free article] [PubMed] [Google Scholar]
- [54].Vilariño-Güell C, Rajput A, Milnerwood AJ, et al. DNAJC13 mutations in Parkinson disease. Hum Mol Genet. 2014;23:1794–801. [DOI] [PMC free article] [PubMed] [Google Scholar]
- [55].Funayama M, Ohe K, Amo T, et al. CHCHD2 mutations in autosomal dominant late-onset Parkinson’s disease: a genome-wide linkage and sequencing study. Lancet Neurol. 2015;14:274–82. [DOI] [PubMed] [Google Scholar]
- [56].Delgado-Alvarado M, Gago B, Navalpotro-Gomez I, et al. Biomarkers for dementia and mild cognitive impairment in Parkinson’s disease. Mov Disord. 2016;31:861–81. [DOI] [PubMed] [Google Scholar]
- [57].Hanna-Pladdy B, Gullapalli R, Chen H. Functional magnetic resonance imaging biomarkers predicting cognitive progression in Parkinson disease: protocol for a prospective longitudinal cohort study. JMIR Res Protoc. 2019;8:e12870. [DOI] [PMC free article] [PubMed] [Google Scholar]
- [58].Wu Y, Jiang JH, Chen L, et al. Use of radiomic features and support vector machine to distinguish Parkinson’s disease cases from normal controls. Ann Transl Med. 2019;7:773. [DOI] [PMC free article] [PubMed] [Google Scholar]


