

Abstract
Microglia are brain myeloid cells that play a critical role in neuroimmunity and the etiology of Alzheimer’s disease (AD). Yet our understanding of how the genetic regulatory landscape controls microglial function and contributes to AD is limited. Here, we performed transcriptome and chromatin accessibility profiling in primary human microglia from 150 donors to identify genetically-driven variation and cell-specific enhancer-promoter interactions. Integrative fine-mapping analysis identified putative regulatory mechanisms for 21 AD risk loci, of which 18 were refined to a single gene, including 3 novel candidate risk genes (KCNN4, FIBP and LRRC25). Transcription factor regulatory networks captured AD risk variation and identified SPI1 as a key putative regulator of microglia expression and AD risk. This comprehensive resource capturing variation in the human microglia regulome provides insights into the etiology of neurodegenerative disease.
Editor summary:
Transcriptomic and epigenomic profiling of human microglia identifies putative gene regulatory mechanisms for 21 Alzheimer’s disease (AD) risk loci. SPI1/PU.1 is nominated as a key regulator of microglia gene expression and AD risk.
Introduction
Microglia are resident macrophage-like cells constituting ~5–10% of all brain cells. Microglia display a diverse range of functions, mediated through interactions with neighboring glial and neuronal cells 1. There is an increasing focus on understanding the molecular and genetic mechanisms involved in microglia function as they are central to multiple neurodegenerative disorders, including Alzheimer’s disease (AD), Parkinson’s disease (PD), multiple sclerosis (MS), and amyotrophic lateral sclerosis (ALS) 2,3. However, studying the regulatory and transcriptional mechanisms of human primary microglia is challenging as fresh brain material is not readily available.
Previous efforts have established the importance of microglia regulatory elements in the etiology of AD due to the enrichment of AD risk variants within regions of microglia specific accessible chromatin 4–6. Expression quantitative trait loci (eQTL) datasets from primary microglia 7,8 can help to map functional AD risk variants and nominate target genes. Incorporating chromatin accessibility will significantly enhance these efforts by identifying AD risk variants that directly affect transcription to reveal microglia-specific cis-regulatory mechanisms disrupted in disease.
In the current study, we performed population-based analysis of the human microglia regulome and transcriptome to understand the role of transcription factor (TF) regulatory networks and the genetic regulatory landscape implicated in neurodegenerative diseases. We generated multi-omic data in microglia isolated from fresh human brain tissue of 150 unique donors and used these to develop an atlas of chromatin accessibility and to examine microglia-specific enhancer-promoter interactions. We then examined the population-level variation of gene expression and chromatin accessibility, and jointly utilized these resources to investigate the genetically driven regulation of transcription in microglia. This approach enabled us to fine-map AD loci, identify novel putative risk genes and provide mechanisms for how disease-associated variants contribute to the dysregulation of expression of microglia genes relevant to AD.
Results
Chromatin accessibility and gene expression in microglia
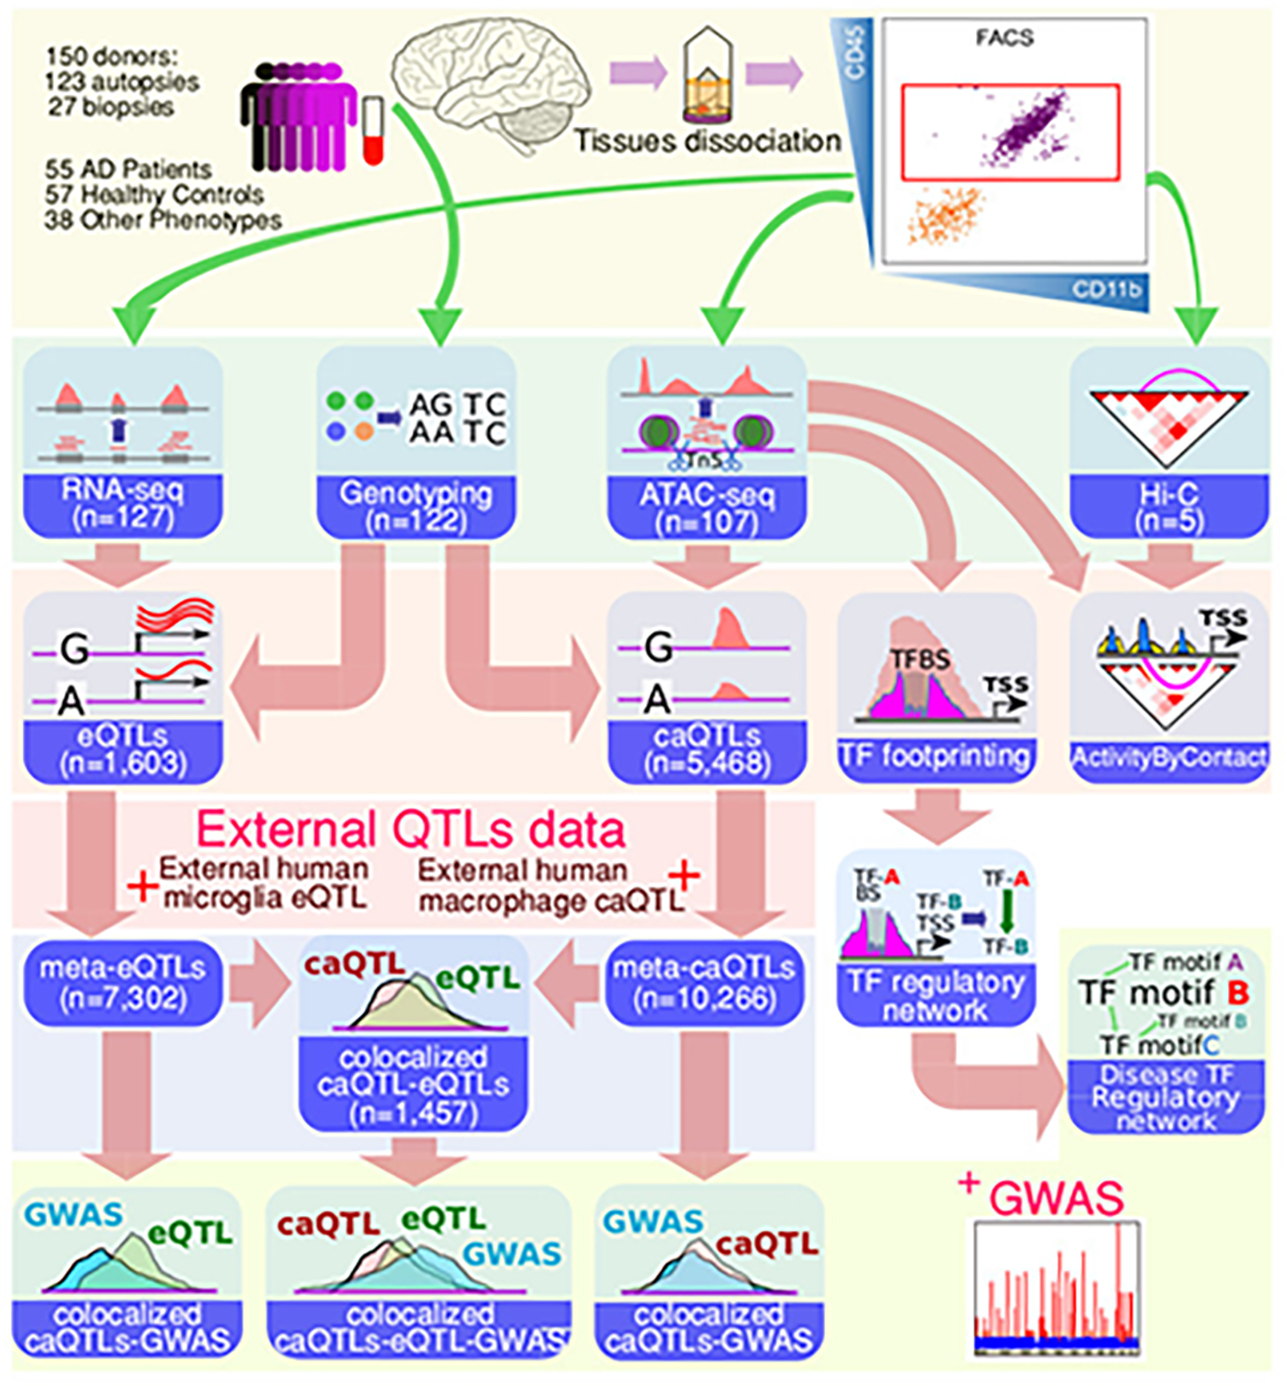
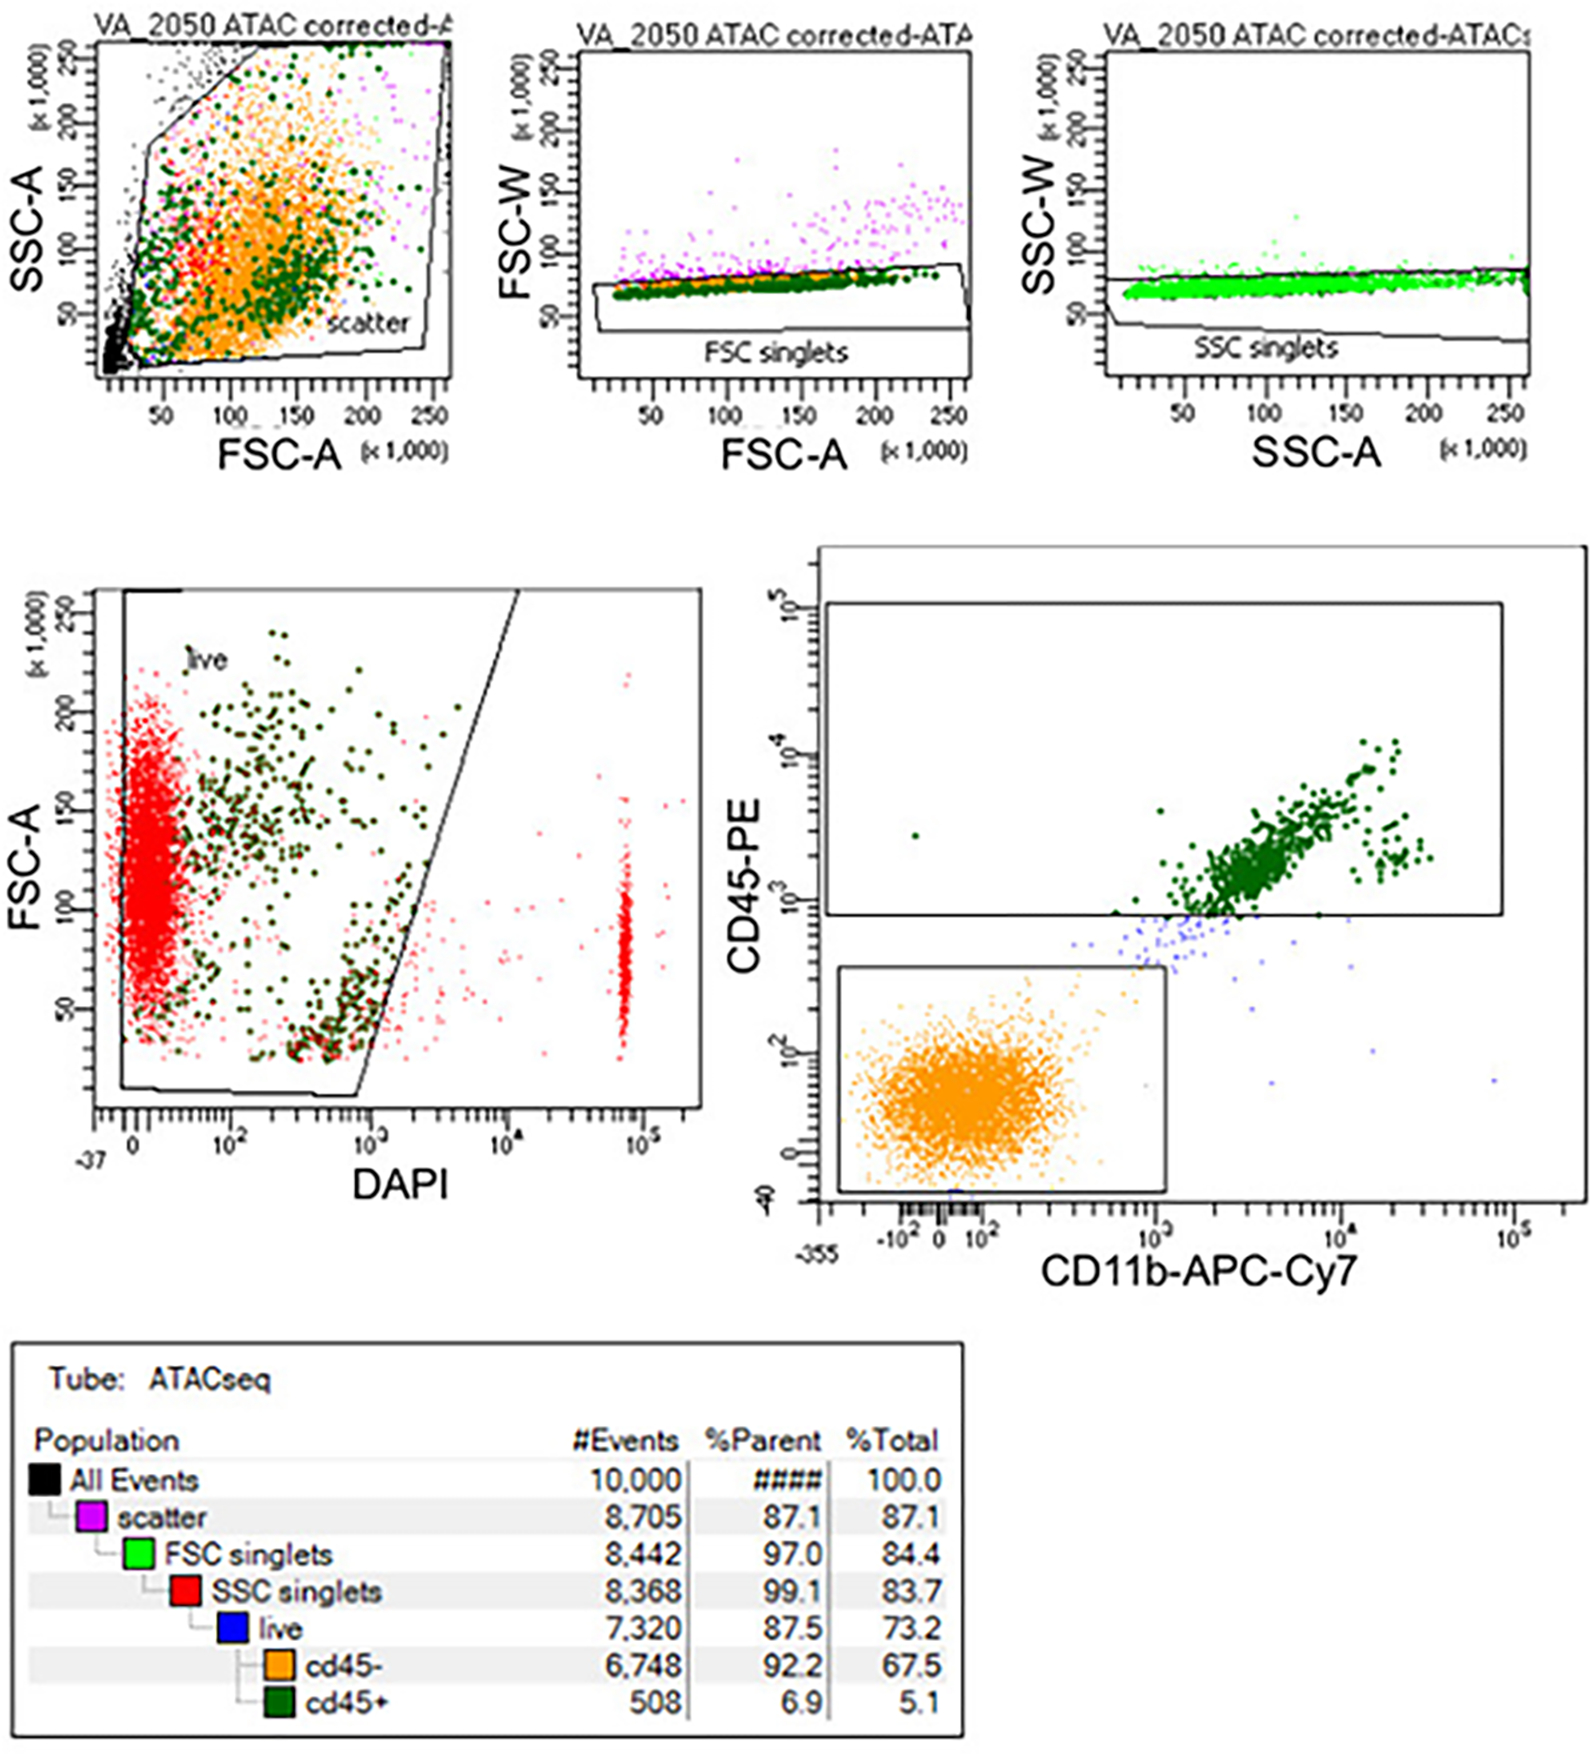
We performed genotyping and generated ATAC-seq (n = 107), RNA-seq (n = 127) and Hi-C (n = 5) data in primary human microglia isolated from fresh prefrontal cortex tissue from a total of 150 unique donors derived from biopsies (n = 27) and autopsies (n = 123) (Fig. 1a, Extended Data Fig. 1 and Supplementary Tables 1–4). Microglia were isolated by fluorescence-activated cell sorting (FACS) of viable CD45+and CD11b+ positive cells from dissociated brain specimens (Extended Data Fig. 2, see Methods). After data preprocessing, we retained 210,832 open chromatin regions (OCRs) (Supplementary Fig. 1a) and 18,856 genes for further analyses, with 88 samples having high quality data for both ATAC-seq and RNA-seq (Supplementary Fig. 2). The microglia Hi-C data were generated by aggregating 19 technical replicates from 5 unique donors to identify 4,677,481,870 high resolution Hi-C contacts (Supplementary Fig. 3–4).
Fig. 1. Chromatin accessibility landscape in human microglia and AD predisposition.
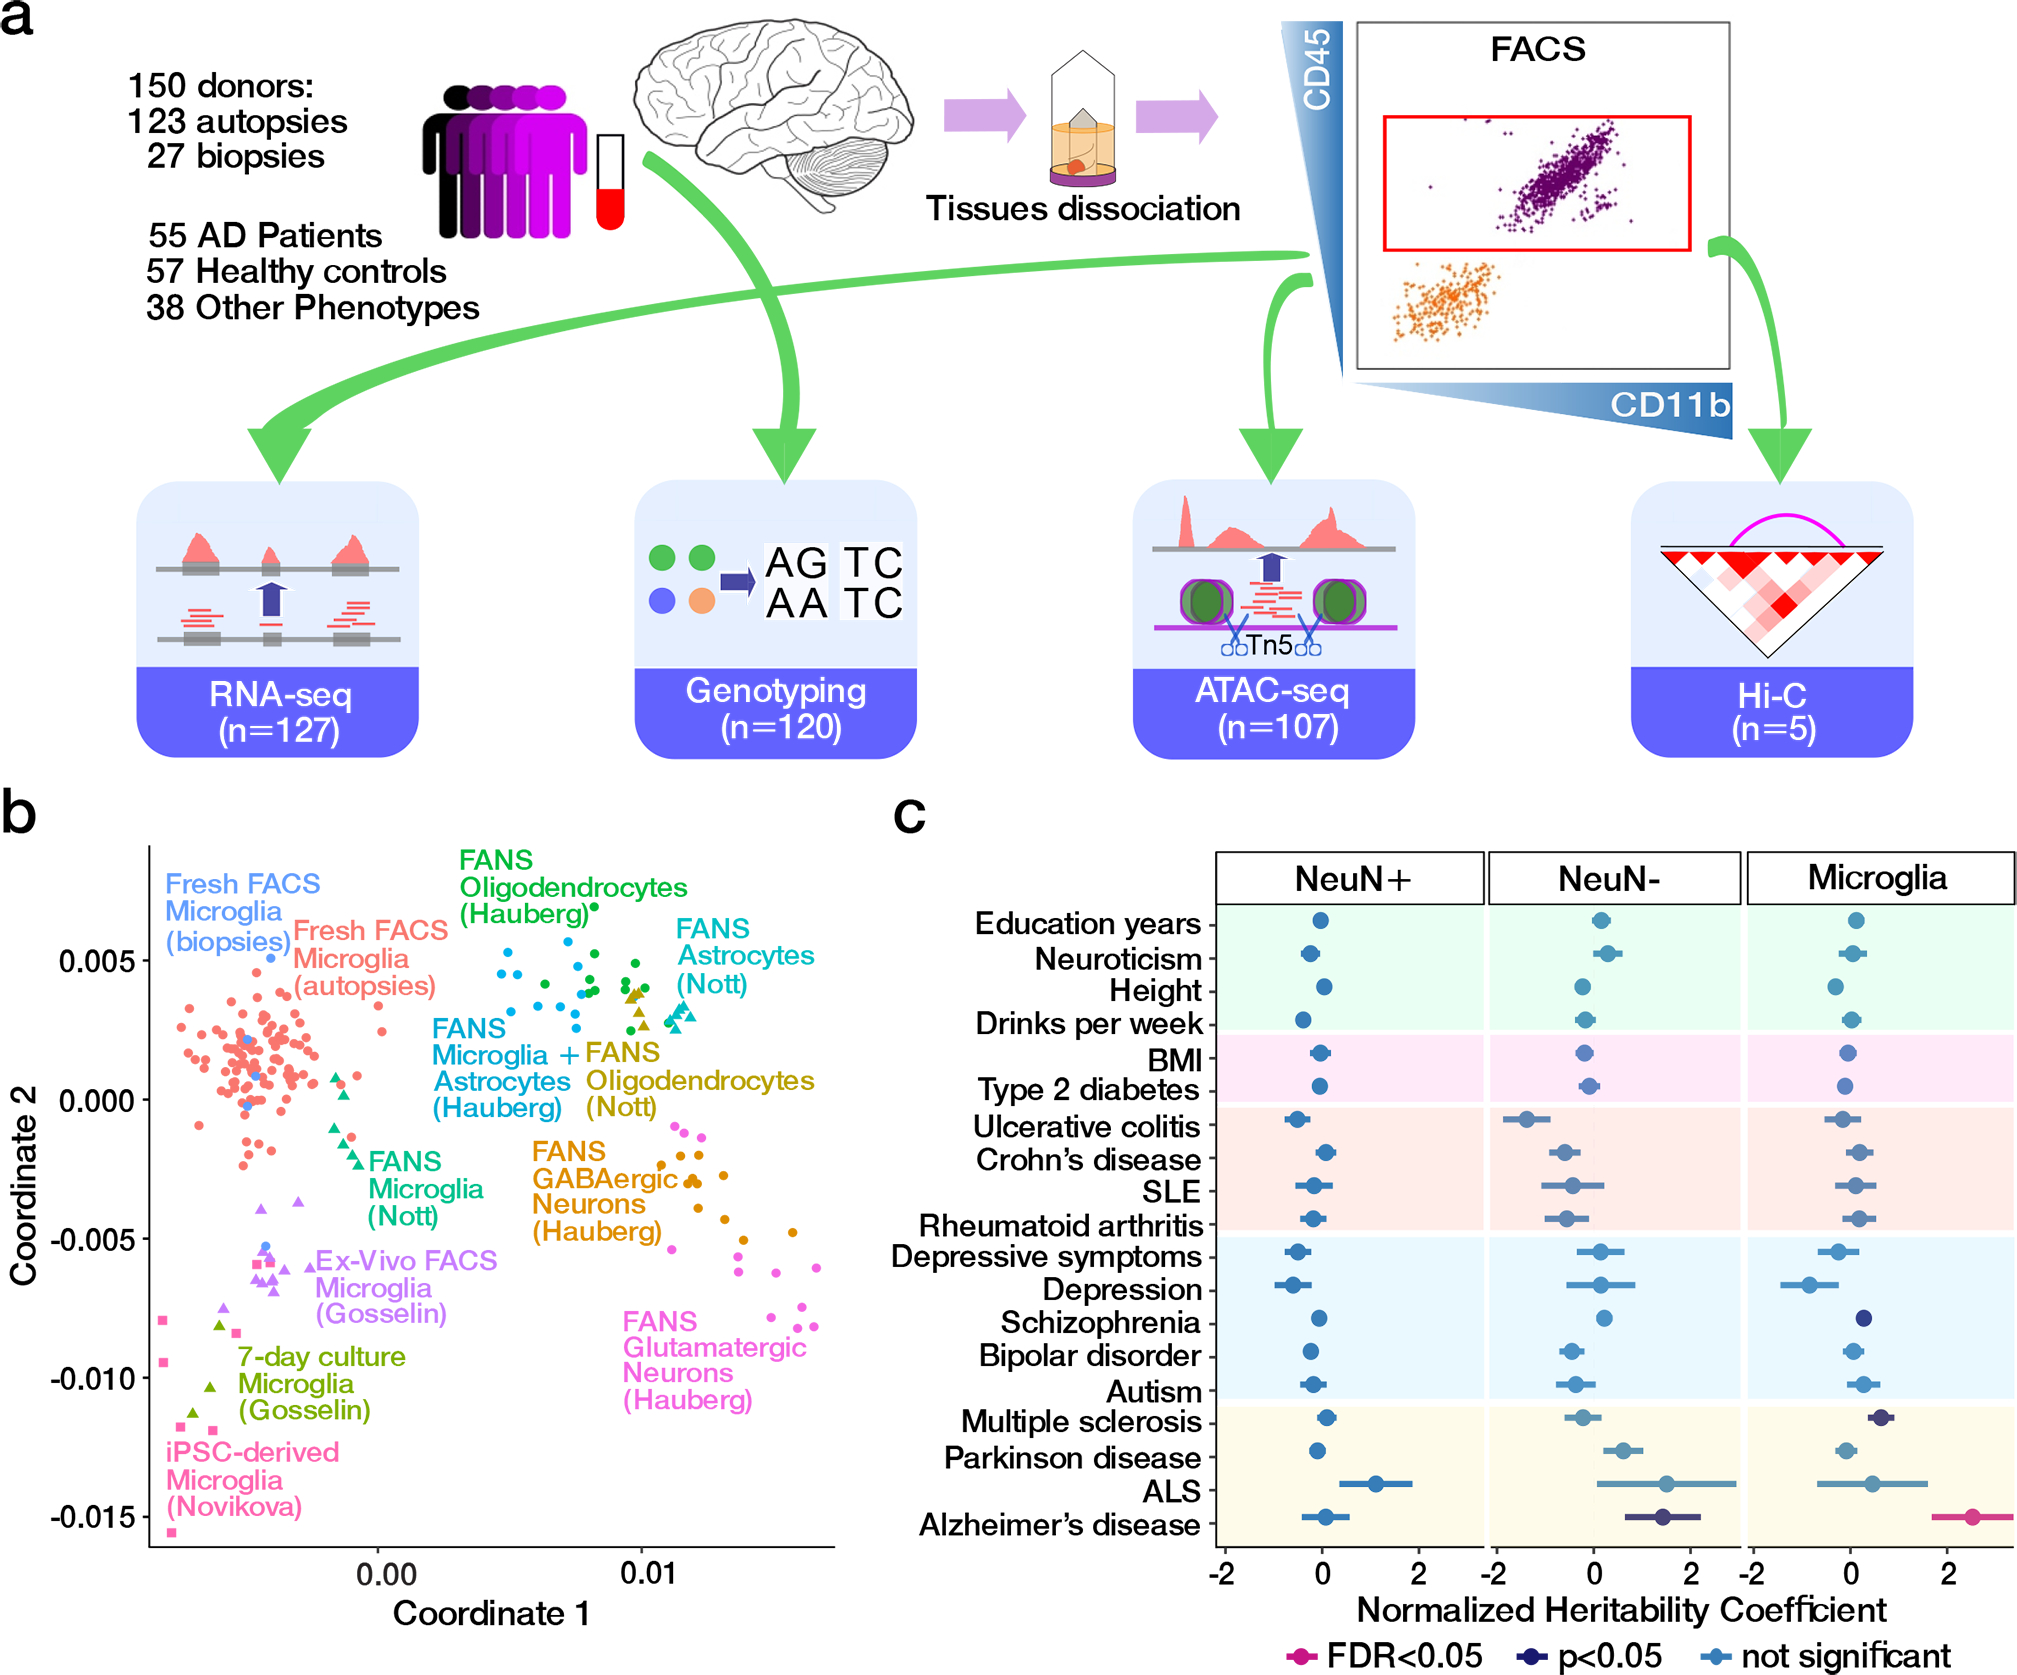
a) Schematic outline of data generation. b) Comparison of human microglia ATAC-seq dataset to other brain open chromatin datasets (Supplementary Table 5) utilizing jointly called OCRs in multidimensional scaling space. c) Enrichment of trait-associated genetic variants in neuronal (NeuN+, n = 315,630), non-neuronal (NeuN−, n = 205,120), and microglia (n = 210,832) OCRs. The utilized GWAS studies are described in Supplementary Table 6, including the number of SNPs from each study. Estimated coefficients from LD score regression are normalized by the per-SNP heritability (h2/total SNPs per GWAS), with horizontal bars indicating standard error (AD FDR = 0.99, 0.60, and 0.027 for NeuN+, NeuN−, and microglia, respectively).
Our dataset is unique in terms of scale, the inclusion of both AD and healthy aged donors, both biopsy and autopsy samples, as well as the computational processing approaches used. We performed genome-wide comparisons with external datasets to show that our ATAC-seq (Fig. 1b) and RNA-seq (Extended Data Fig. 3) data clustered closely with microglia from previous studies 4,9,10 (Supplementary Table 5).
We examined the overlap of our population-scale chromatin accessibility map with existing OCR datasets and genetic risk variants. Chromatin accessible regions from our data had higher overlap with microglia-specific OCRs (Jaccard J = 0.366) relative to those from other brain cell populations (Jaccard J between 0.138–0.178) 6 (Supplementary Fig. 1b). Similarly, our microglia ATAC-seq OCRs were most similar to the OCRs identified in the microglia snATAC-seq cluster from brain cell subsets described in Morabito et al. 11, generated in both AD patients and control donors (Supplementary Figs. 1c).
While observed enrichment was highest for promoters, distal OCRs showed the highest specificity for microglia and is consistent with higher cell type-specificity associated with distal regulation 12. The relevance of microglia OCRs to human diseases was evaluated by examining enrichment for common genetic risk variants. Consistent with previous studies 4,6,9,13, we observed an enrichment of AD risk variants 13 specifically in microglia OCRs (Fig. 1c and Supplementary Table 6). Furthermore, microglial OCRs explained higher AD heritability (fold change = 4.0, P = 0.013, one-sided two-sample z-test) compared to OCRs discovered in broadly defined populations of non-neuronal cells 5.
Transcriptional regulation by open chromatin regions
We next evaluated the coordination between the genome-wide OCR landscape and transcriptional activity in microglia using our unique resource of chromatin accessibility and gene expression data from the shared set of 88 donors. We fit a variance decomposition model for one gene at a time to estimate the fraction of expression variation attributable to genome-wide variation in the chromatin accessibility landscape. Analysis of 185,664 OCRs, located within a 100-kb window upstream of transcription start sites (TSS), revealed that variation in chromatin accessibility explained a median of 80.7% of expression variation across 18,640 genes, compared to a median of 3.7% explained in permuted data (P < 10−323, one-sided Wilcoxon test) (Fig. 2a). Variation in chromatin accessibility explained ≥75% of transcriptional variance for 58.2% of the investigated genes (10,841), and ≥50% for 75.5% (14,081), indicating strong coupling between a given gene expression trait and the genome-wide chromatin landscape (Supplementary Fig. 5). Importantly, this approach does not model the relationship of each gene to its own promoter/enhancer OCRs, but to the overall status of all enhancers/promoter OCRs across all chromosomes.
Fig. 2. Transcriptional regulation by open chromatin regions.
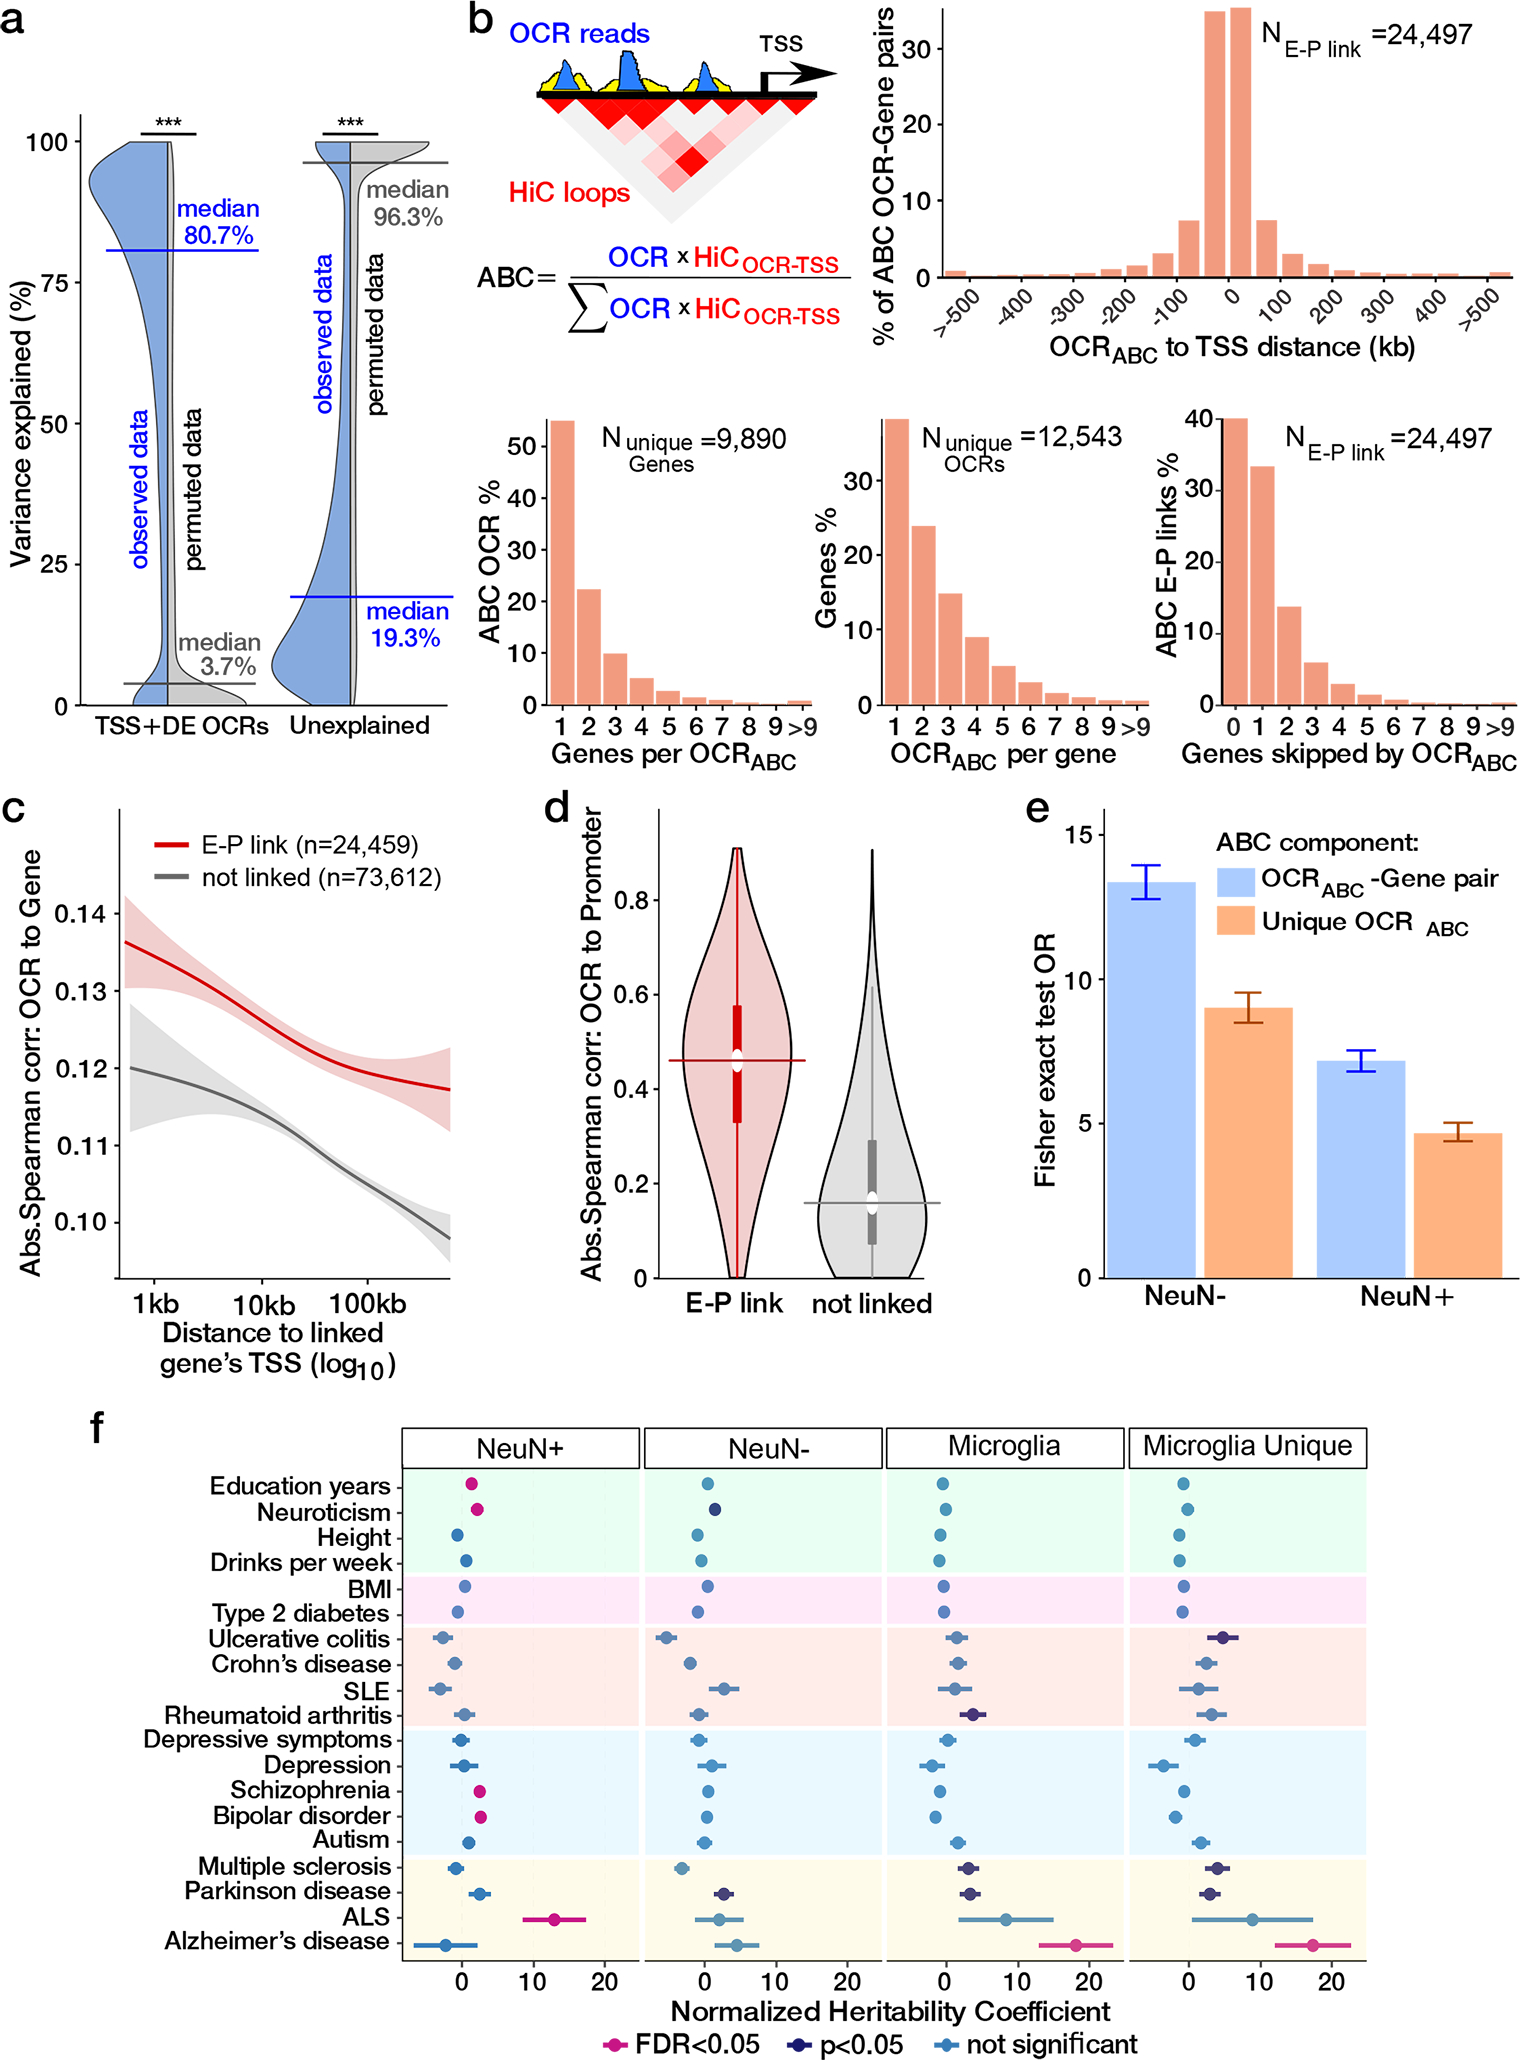
a) Fraction of transcriptional variation for each gene explained by accessible chromatin for observed data (blue) and permuted data (grey) (*** indicates P <10−323, one-sided Wilcoxon test) b) Distribution of distance from TSS for E-P interactions (top right); histograms of the number of OCRABC per gene (bottom left), the number of genes per OCRABC (bottom middle) and the number of skipped genes between the OCRABC and the linked gene (bottom right). c) OCRABC involved in E-P interactions have stronger correlation with the expression of the corresponding gene compared to a subset of non E-P pairs, matched by the distance. The lines represent the predicted relationship (generalized additive model), and shaded areas reflecting 95% confidence interval. d) OCRABC involved in E-P interactions (n = 18,018) have stronger correlation with the OCR at the linked promoter compared to OCRs not in an E-P link (n = 2,560,916). Horizontal center lines indicate the median, and thick vertical lines indicate interquartile range, thin vertical line indicate upper and lower adjacent values (first quartile - 1.5IQR, third quartile + 1.5IQR), and the top and bottom of the violin plot boundary define maxima and minima. e) Enrichment of microglia E-P interactions with non-neuronal (NeuN−, Nshared linked E-Pairs = 4,729, NMicroglia Only linked E-Pairs = 18,406) and neuronal (NeuN+, Nshared linked E-Pairs = 2,869, NMicroglia Only linked E-Pairs = 20,266) E-P interactions amongst all considered E-P pairs (NAll tested E-P pairs=289,993 with E-P distance < 229.9 Kb, containing 95% of all linked E-P pairs). Colored bars indicate the odds ratio and error bars represent 95% confidence intervals. f) Enrichment of trait-associated genetic variants in neuronal (NeuN+, n = 38,233), non-neuronal (NeuN−, n = 37,056), microglia (n = 24,497) and microglia-specific (n = 18,678) E-P interactions. The utilized GWAS studies are described in Supplementary Table 6, including the number of SNPs from each study. Coefficients from LD score regression (two-sided linear regression) are normalized by the per-SNP heritability (h2/total SNPs per GWAS), with horizontal bars indicating standard error (AD FDR = 0.97, 0.48 and 0.0049 for NeuN+, NeuN−, and microglia, respectively).
Next, with the aim of linking a regulatory element to the gene(s) it regulates, we used the “activity-by-contact” (ABC) framework 14 to combine our Hi-C-derived contact frequencies with “enhancer activities” in OCRs to examine long-range enhancer-promoter (E-P) interactions (Fig. 2b). We identified 24,497 E-P interactions, involving 9,890 unique genes, thus identifying at least one non-promoter regulatory element for over 52% of microglia expressed genes.
About half of the E-P linked OCRs (OCRABC), were linked to multiple genes, and over 60% of the linked genes were linked to multiple OCRABC (Fig. 2b). Of OCRs with ABC links, 71% are linked to a flanking gene while 60% of total E-P links are to a distal gene (Fig. 2b). This finding is consistent with previous analyses 15, further highlighting the importance of experimentally derived regulatory annotations.
OCRABC have a significantly higher correlation with the expression of linked genes compared to unlinked genes (P < 10−95, one-sided Wilcoxon test) (Fig. 2c), as well as to chromatin accessibility at the linked promoter compared to OCRs that do not participate in E-P interactions (P < 10−323, one-sided Wilcoxon test) (Fig. 2d). As expected 14, the majority of observed E-P interactions corresponded to a positive correlation between gene expression and chromatin accessibility (Supplementary Fig. 6a–b). To evaluate the cell type specificity of the observed E-P interactions, we compared them to E-P pairs identified in broad neuronal (38,233 pairs) and non-neuronal (37,056 pairs) cell populations 15. In total, 23.6% (5,781 out of 24,459) microglia E-P interactions were shared with either neurons or non-neurons (Supplementary Fig. 7a–b). As expected, we observed a stronger overlap between microglial and non-neuronal (OR=13.7) E-P interactions than with those of neurons (OR = 7.5) (Fig. 2e and Supplementary Fig. 7c). Conversely, over 76% of the E-P interactions were observed in microglia alone, reflecting both the cell-type specificity of regulatory mechanisms and the fact that the catalog of E-P interactions is incomplete for each cell type. Compared to a larger set of E-P links generated in 131 diverse cell types 16, the E-P links from microglia overlapped strongest with links from other myeloid cells (Supplementary Fig. 8). We saw high concordance between E-P links observed in AD cases and controls (Supplementary Fig. 9).
To further explore the importance of cell-type-specific regulatory mechanisms and their role in disease, we quantified the overlap of disease risk variants with OCRABC from neurons, glia, and microglia. Similar to analysis of all OCRs above, enrichment of AD risk variants was only observed in microglia OCRABC (Fig. 2f). Strikingly, limiting analysis to microglial E-P interactions increases the explained heritability coefficient for AD (fold change = 7.2, P = 0.0016, one-sided two-sample z-test). This highlights the central role for transcriptional regulatory mechanisms of human microglia in AD.
Genetic regulation of chromatin accessibility in microglia
ATAC-seq and high-density genotyping data from 95 donors allowed us to study population variation by generating a human microglia chromatin accessibility QTL (caQTL) map. Utilizing the multivariate multiple QTL (mmQTL) method 17, and correcting for multiple technical confounders (Supplementary Fig. 10) and population structure, we used a 100 kb window centered on each of 210,832 OCRs and identified 5,468 OCRs with significant caQTLs at FDR 5%. Our microglia caQTL dataset had high concordance with caQTLs identified in human iPSC-derived macrophages under various stimulation conditions (range of π1 values: 0.662 to 0.753), reflecting the shared myeloid origin of microglia and macrophages 18 (Extended Data Fig. 4a). The replication of microglia caQTLs was lower in caQTLs derived from homogenate brain specimens (π1 = 0.602) 19. Given the current sample size, there is limited evidence for disease-specific QTL effects here (Supplementary Fig. 11).
Given the high concordance of caQTLs among microglia and myeloid cells, we maximized statistical power for caQTL detection by jointly analyzing our human microglia and four macrophage datasets 18. The resulting human microglia meta-caQTL dataset contained 10,266 OCRs with significant caQTLs. Bayesian analysis of results from these two cell types indicate that the majority of caQTLs were either discovered in microglia alone or had comparable level of support from the macrophage subsets 20 (Fig. 3a). Applying a fine-mapping approach 21 to the meta-caQTL results we identified a 95% credible set of 269,536 SNPs (caSNPs), including 144,592 with posterior probability (PP) >0.01 for 10,152 OCRs (Supplementary Fig. 12a). Of these, 6,476 caSNPs were located within 4,324 OCR peaks (Supplementary Fig. 13a–b).
Fig. 3. Genetic regulation of chromatin accessibility in human microglia.
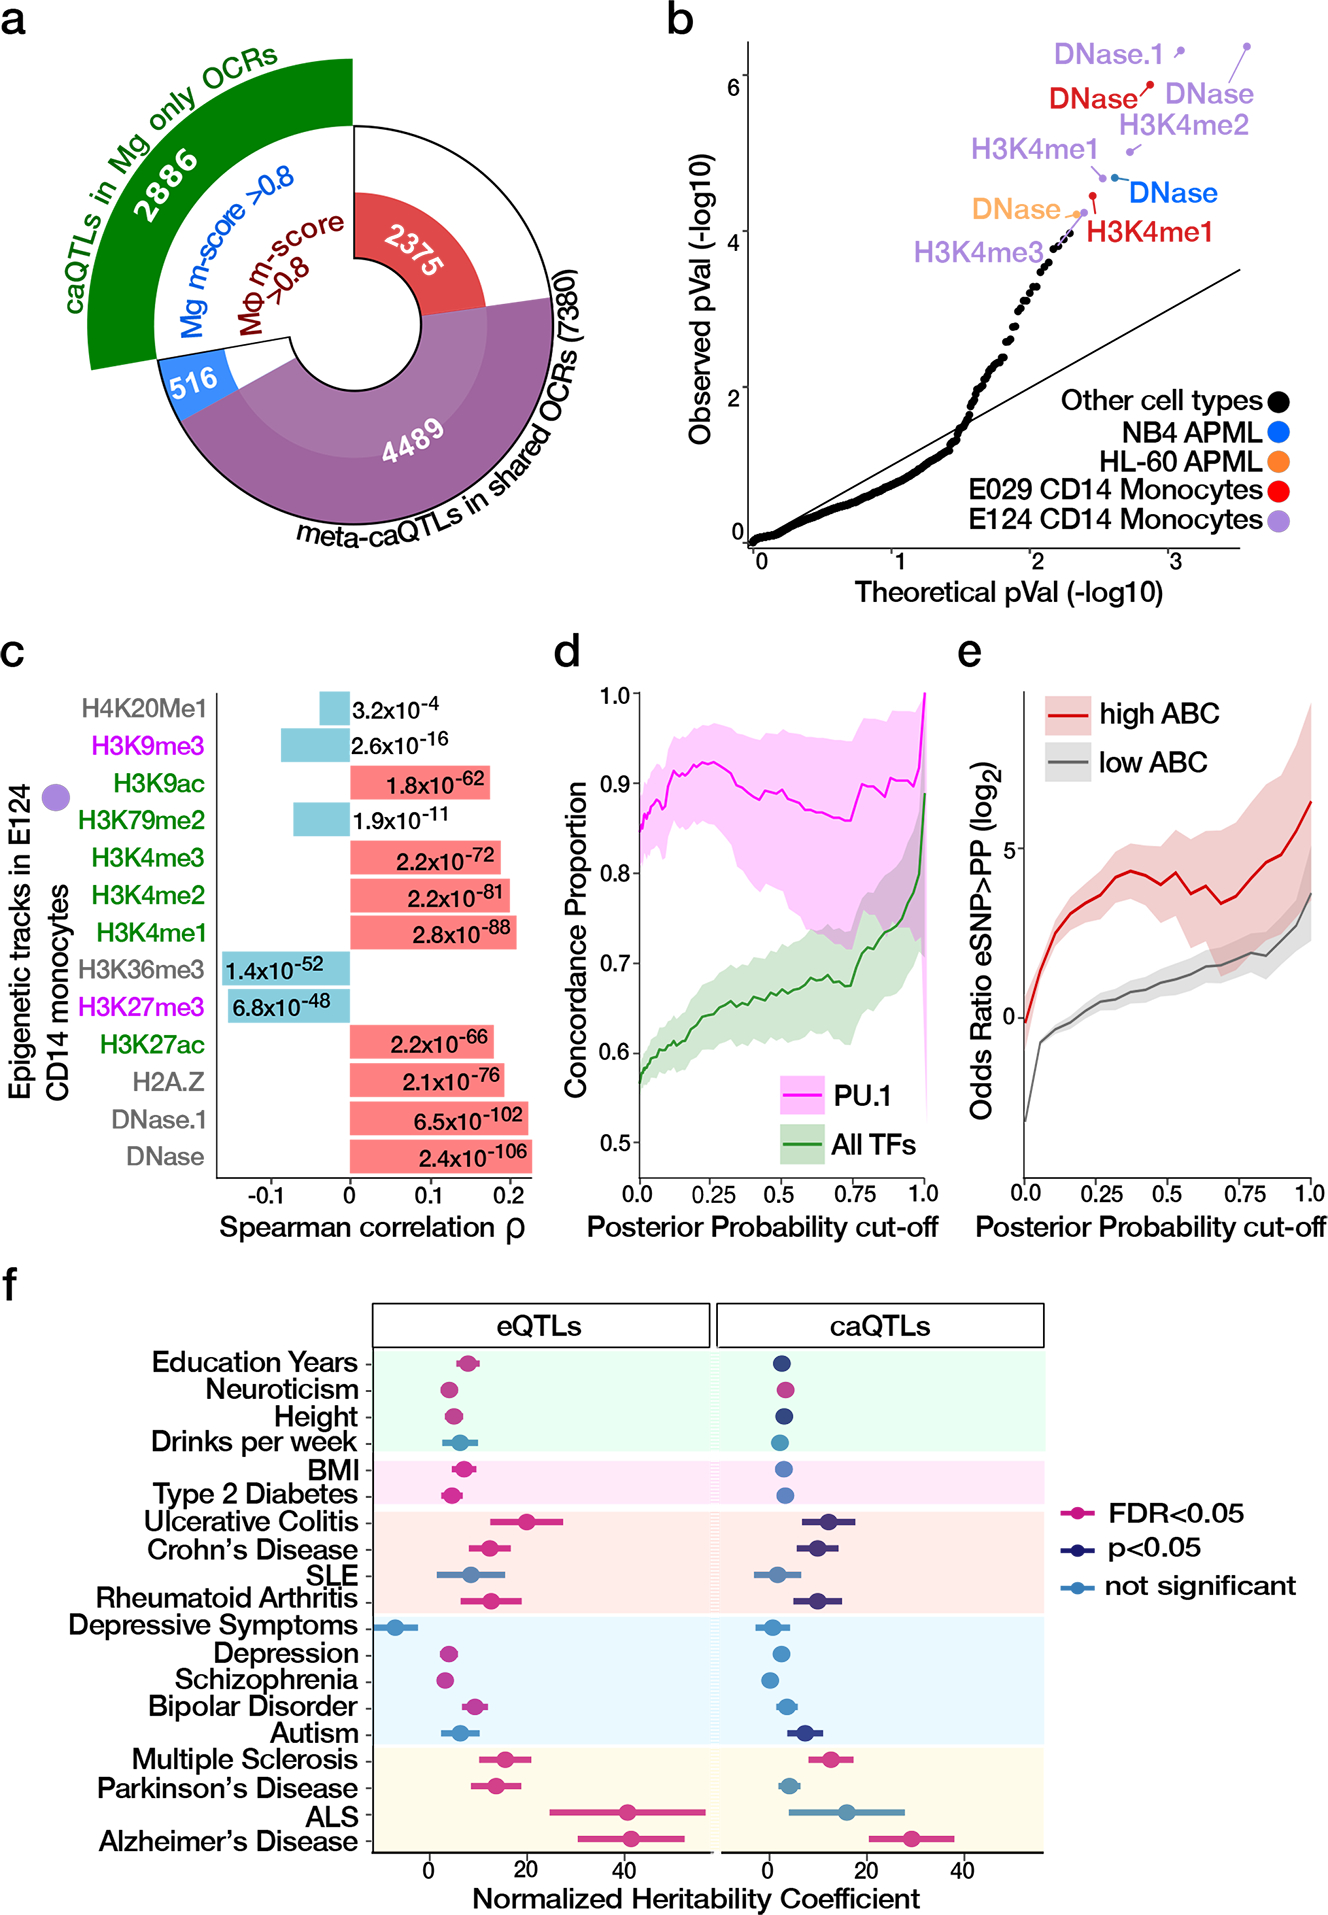
a) Count of OCRs with caQTL signals in microglia (Mg) and macrophages (Mφ) shown by cell type specificity based on Bayesian meta-analysis. Analysis of microglia-only OCRs gives caQTLs specific to microglia (green), and analysis of shared OCRs gives both shared and cell type specific caQTLs. b) QQ plot of nominal P values reflecting the concordance between DeepSEA predictions and caQTL regression coefficient. Significant assays from myeloid lineages are indicated by colors; c) Spearman correlation between caSNPs’ effect size estimated by caQTL analysis and by DeepSEA predicted effect on epigenetic assays for promoters/enhancers (green) and repressors (purple). P values for each test are indicated. Red horizontal bars correspond to positive relationships, and blue correspond to negative relationships. d) Concordance between caSNPs’ allelic effects on chromatin accessibility and the predicted change in motif binding ability for PU.1 compared to all 53 TFs (including PU.1), whose binding sites were significantly disrupted by caSNPs. Concordance proportion is shown for SNPs exceeding the specified fine-mapping posterior probability, with shaded regions indicating 95% confidence intervals. e) Enrichment for fine-mapped caSNPs within OCRABC also being fine-mapped eSNPs for the target genes compared to those in OCRs not involved in E-P interactions. Enrichments are shown over a range of posterior probability cutoffs applied to both caSNPs and eSNPs. Lines indicate the odds ratios, and shaded areas represent 95% confidence intervals. f) Enrichment of trait-associated genetic variants in 95% credible set of microglia meta-eSNPs (n = 468,604) and meta-caSNPs (n = 269,536). The utilized GWAS studies are described in Supplementary Table 6, including the number of SNPs from each study. Estimated coefficients from LD score regression are normalized by the per-SNP heritability (h2/total SNPs per GWAS), with horizontal bars indicating standard error (AD FDR = 0.0025 and 0.017 for eSNPs and caSNPs, respectively).
Since genetic regulatory architecture varies across tissues and cell types 22, we evaluated the cell type specificity of the fine-mapped caSNPs with PP >0.01 and, within OCRs, by querying the predicted effect of each variant on 2,002 epigenetic assays across tissues and cell lines from ENCODE and the Roadmap Epigenomics Project estimated by DeepSEA 23,24. Even without considering any prior knowledge about the cell type of origin, the epigenetic tracks predicted to be most disrupted by this set of caSNPs were DNase hypersensitivity sites (DHS) from primary CD14+ monocytes (Fig. 3b). Assayed epigenetic tracks in other myeloid lineage cell types were also disrupted. Moreover, the direction of the predicted effect was consistent with the known biology of these assays. For example, caQTL and DeepSEA effect directions were positively correlated with changes in DHS and ChIP-seq marks indicative of promoter and enhancer activity from myeloid lineages, and negatively correlated with changes in repressive epigenetic marks (Fig. 3c).
We evaluated the degree to which genetic variants affecting chromatin accessibility acted by disrupting transcription factor binding sites (TFBS). We employed a TF footprinting approach 25 to identify all bound TFs within the microglia accessible chromatin landscape. CaSNPs were preferentially located within occupied TFBSs determined by footprinting analysis (OR = 1.10, P = 6.95 × 10⁻⁵, Fisher’s exact test). We identified 53 TFs whose predicted binding was significantly enriched for dysregulation by caSNPs, as compared to non-caSNP genetic variants present within OCRs (Supplementary Table 7). Among these, predicted SPI1/PU.1 binding sites were the most significantly disrupted by caSNPs (OR = 5.56, FDR = 5.65 × 10−55, Fisher’s exact test) and the effect direction from caQTL analysis was concordant with the predicted TFBS disrupting allele at 92% of caSNPs (P = 6.6 × 10⁻⁴, binomial test) (Supplementary Fig. 14). While increasing the fine-mapping posterior probability cutoff for caSNPs increased the concordance for all TFs, predicted SPI1/PU.1 binding sites remained remarkably concordant across a wide range of cutoffs (Fig. 3d). The SPI1 gene encodes PU.1, which is a master regulator of myeloid cell development and critical for microglia function 26. Our observation reinforces the importance of genetic regulation of SPI1 target genes in human primary microglia.
Co-regulation of chromatin accessibility and gene expression
Using the same approach as for caQTLs, eQTL analysis on samples from 101 donors identified 1,603 eQTLs at 5% FDR (Supplementary Fig. 10b). These microglia eQTLs were replicated in two other human microglia eQTL datasets (range of π1: 0.62 to 0.70) 7,8,18 (Extended Data Fig. 4b). Given the high concordance, we performed meta-analysis and statistical fine-mapping of these 3 datasets, and identified 7,302 meta-eQTLs (Supplementary Figs. 12b and 13c). Fine-mapped eSNPs (PP >0.01) were overrepresented within OCRABC corresponding to their target genes (OR = 1.48, permutation test P = 6.7 × 10⁻⁵) (Supplementary Fig. 15).
Having shown that eSNPs are more likely to colocalize with E-P interaction, we next sought to examine the genetically driven regulation of transcription in microglia. Fine-mapped caSNPs within OCRABC regions were more likely to be fine-mapped eSNPs for the target gene compared to caSNPs for OCRs not involved in E-P interactions (Fig. 3e). Genetic colocalization analysis 27 identified 1,457 pairs of gene expression and chromatin accessibility traits sharing genetic regulatory architecture with high posterior probability (i.e. PP4 >0.5), including 865 unique genes and 1,033 unique OCRs (Extended Data Fig. 5a–b). Of these, 167 OCR-gene pairs were also ABC identified E-P links (Extended Data Fig. 5c). OCRs predicted to be involved in E-P interactions were enriched for being colocalized with an eQTL for the target gene (OR = 2.5, permutation test P = 6.7 × 10⁻⁵) (Extended Data Fig. 5d).
Taken together, we have captured variation of the regulatory mechanisms involved in microglia E-P interactions, which we further integrated with risk loci across multiple traits. We evaluated the overlap of microglia regulatory variants in the 95% credible sets for gene expression and chromatin accessibility with risk variants for common diseases. While eSNPs showed significant enrichment for a range of neurodegenerative, inflammatory and neuropsychiatric traits (15 of 20 tested), caSNPs showed a more specific signal with three traits, including the largest heritability coefficient for AD (Fig. 3f). Integrating fine-mapping for chromatin accessibility and gene expression (see Methods) produced a refined set of 30,028 variants showing significant enrichment for AD risk loci (P = 0.036) (Extended Data Fig. 5e), pointing to a key role for the gene expression regulation via chromatin accessibility in AD.
Integration of microglia regulome with AD risk variation
Having shown the high specificity of the microglia regulome for AD risk, we performed fine-mapping to better identify credible causal variants, genes and regulatory regions. We first examined the colocalization of fine-mapped AD risk variants 13 within microglia E-P interactions (Supplementary Table 8). Remarkably, 6,428 distal OCRABC (>20kb from the nearest TSS) contained 20 fine-mapped SNPs (PP >0.01) from eight different AD loci, while the 97,513 of the equidistant OCRs with low ABC scores contained none of the fine-mapped SNPs (OR = 318, P = 8.9 × 10⁻²⁵, Fisher’s exact text) (Fig. 4a and Supplementary Tables 9–11).
Fig. 4. Integration of AD etiologic landscape with genetic regulation of transcriptional and chromatin accessibility in microglia.
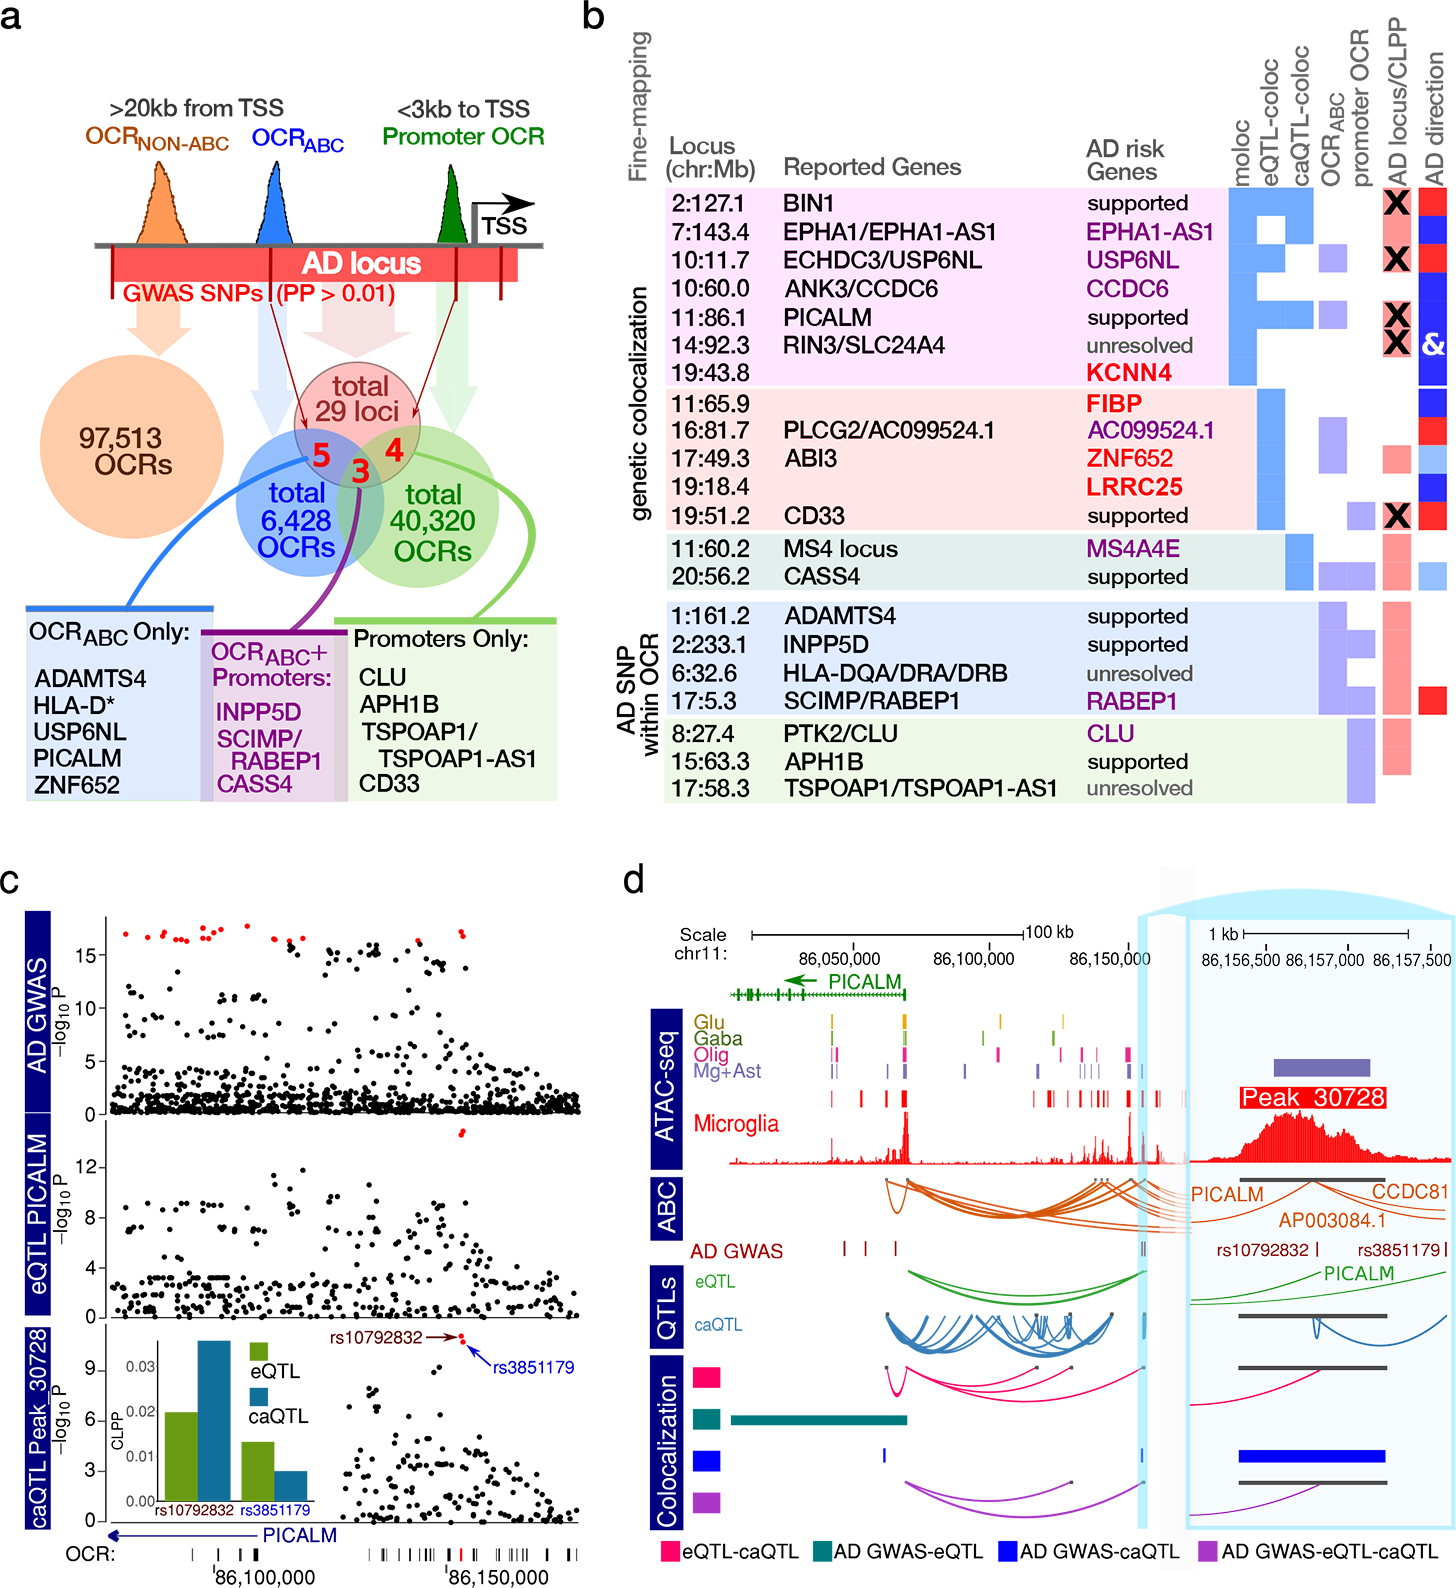
a) Overlap of 316 fine-mapped SNPs from 29 AD GWAS loci 13 (red) with OCRABC (blue) and promoters (green), with 3 loci supported with both OCRABC and promoters (purple). b) Fine-mapping to define candidate AD genes based on: (i) joint colocalization for eQTL, caQTL and GWAS signal (‘moloc’) (lilac); colocalization for (ii) eQTL and GWAS (‘eQTL-coloc’) (pink); and (iii) caQTL and GWAS (‘caQTL-coloc’) (teal) signal; fine-mapped AD variants (PP>0.01) within (iv) OCRABC (blue) and (v) promoter (green) OCRs. ‘AD GWAS’ indicates regions identified by Jansen et al. 13, and ‘x’ indicates significant joint fine-mapping with gene expression or chromatin accessibility. ‘AD direction’ is the linked gene’s expression in relation to the AD risk alleles (red = higher; blue = lower, ‘&’ indicates consistency for multiple genes in the region. Shade indicates the confidence in the direction assignment). Color schema for ‘Linked Genes’: genes are unambiguously fine-mapped and previously implicated in AD (purple); not previously fine-mapped as AD risk genes (red). The novel putative AD risk genes outside previously reported AD loci are shown in bold. c) Local plot showing results from AD GWAS 13, eQTL analysis of PICALM, and caQTL analysis of peak_30728. Red points indicate genetic variants in the 95% credible set from statistical fine-mapping of each trait. Inset shows colocalization posterior probabilities (CLPP) for the top variants in the credible set for gene expression and chromatin accessibility. d) Visualization of the PICALM locus showing: open chromatin regions from 4 cell populations 5 and microglia from this study; E-P interactions (ABC); fine-mapped (PP>0.05) SNPs from AD GWAS 13,41,45; genetic regulation from eQTLs and caQTL form thus study; and colocalization analysis between pairs of traits (i.e. AD GWAS, gene expression chromatin accessibility) using ‘coloc’ and all three traits using ‘moloc’ methods. Inset focuses on the 1.5 kb region immediately flanking peak_30728.
We then combined AD genetic risk variation 13 with the microglia meta-eQTL and meta-caQTL datasets using multiple-trait-coloc (moloc) 28 to link loci to genes and regulatory regions (Supplementary Tables 12–14). We observed GWAS-eQTL-caQTL colocalization within six previously reported AD loci (Fig. 4b and Supplementary Fig. 16), providing coherent units of transcriptional regulation relevant to the etiology of AD. Colocalization analyses between the AD GWAS and meta-eQTL and meta-caQTLs, separately, provided functional annotation for five additional published AD loci (Supplementary Tables 12–13 and 15–18). Importantly, the integration of allele-specific information from eQTL and AD GWAS allowed us to unambiguously define the direction of the transcriptional changes in relation to increased AD risk for the fine-mapped genes (Fig. 4b, rightmost column). PICALM is a previously well-supported disease gene 29, where the AD risk variant (rs10792832) was within an OCRABC. The risk allele was associated with both lower OCR signal and gene expression, consistent with predicted (DeepSEA) reduced DNase accessibility and H3K4me1 ChIP-seq signal in monocytes (Fig. 4c–d).
For three AD loci, moloc analyses provided support for involvement of only one among the multiple previously suggested risk associated genes at each locus: EPHA1-AS1, USP6NL, and CCDC6. The EPHA1-AS1 locus is of particular interest as our analysis prioritized it over the EPHA1 protein-coding gene, and its 95% credible set contains a single SNP (Extended Data Fig. 6 and 7a–b). EPHA1-AS1 is a lncRNA gene with a previously undefined function, predicted to participate in immune-related pathways based on functional annotations of co-regulated genes 30 (Extended Data Fig. 7c).
Intriguingly, we identified three instances of colocalization between AD GWAS and microglia meta-eQTL at genetic regions not previously highlighted as AD loci, for genes FIBP, LRRC25 and KCNN4, with the moloc colocalization with meta-caQTLs also observed for the latter (Fig. 4b, Supplementary Table 6 and Extended Data Figs. 8–10). The known biology of all three genes is highly compatible with AD pathophysiology, with KCNN4 having been previously considered as an AD therapeutic target 31,32. Importantly, using the microglia-specific regulome resources we generated allowed us to identify AD relevant coherent regulatory units for 18 out of 21 AD loci, highlighting the importance of obtaining data from the relevant cell type.
AD etiology through transcription factor regulatory networks
TFs are involved in the precise tuning of microglial homeostasis and are implicated in AD pathogenesis 33,34. In parallel to pursuing the colocalization approaches and E-P annotation to link AD risk loci to genes, we also utilized chromatin accessibility to establish the TF activity in microglia and to query the identified TF targets for AD risk variant enrichment. We performed TF footprinting analysis 25 in microglia, as well as oligodendrocytes and GABAergic and glutamatergic neurons 5 for comparative analysis. PU.1 (encoded by SPI1), IRF6, STAT2, and NFKB2 were identified as microglia-specific TFs (Fig. 5a and Supplementary Table 19), reflecting known microglial immune-related processes 26,35–37, with PU.1 identified as the strongest microglia-specific TF 11 (Fig. 5b). Among the 26,003 OCRs with predicted PU.1 binding, 86% (OR = 16.2, P < 10−16, Fisher’s exact test) matched sites identified by PU.1 ChIP-seq 9, further validating the in silico footprinting approach to detect microglial TFs.
Fig. 5. Transcription factor binding landscape in microglia integrating AD genetics.
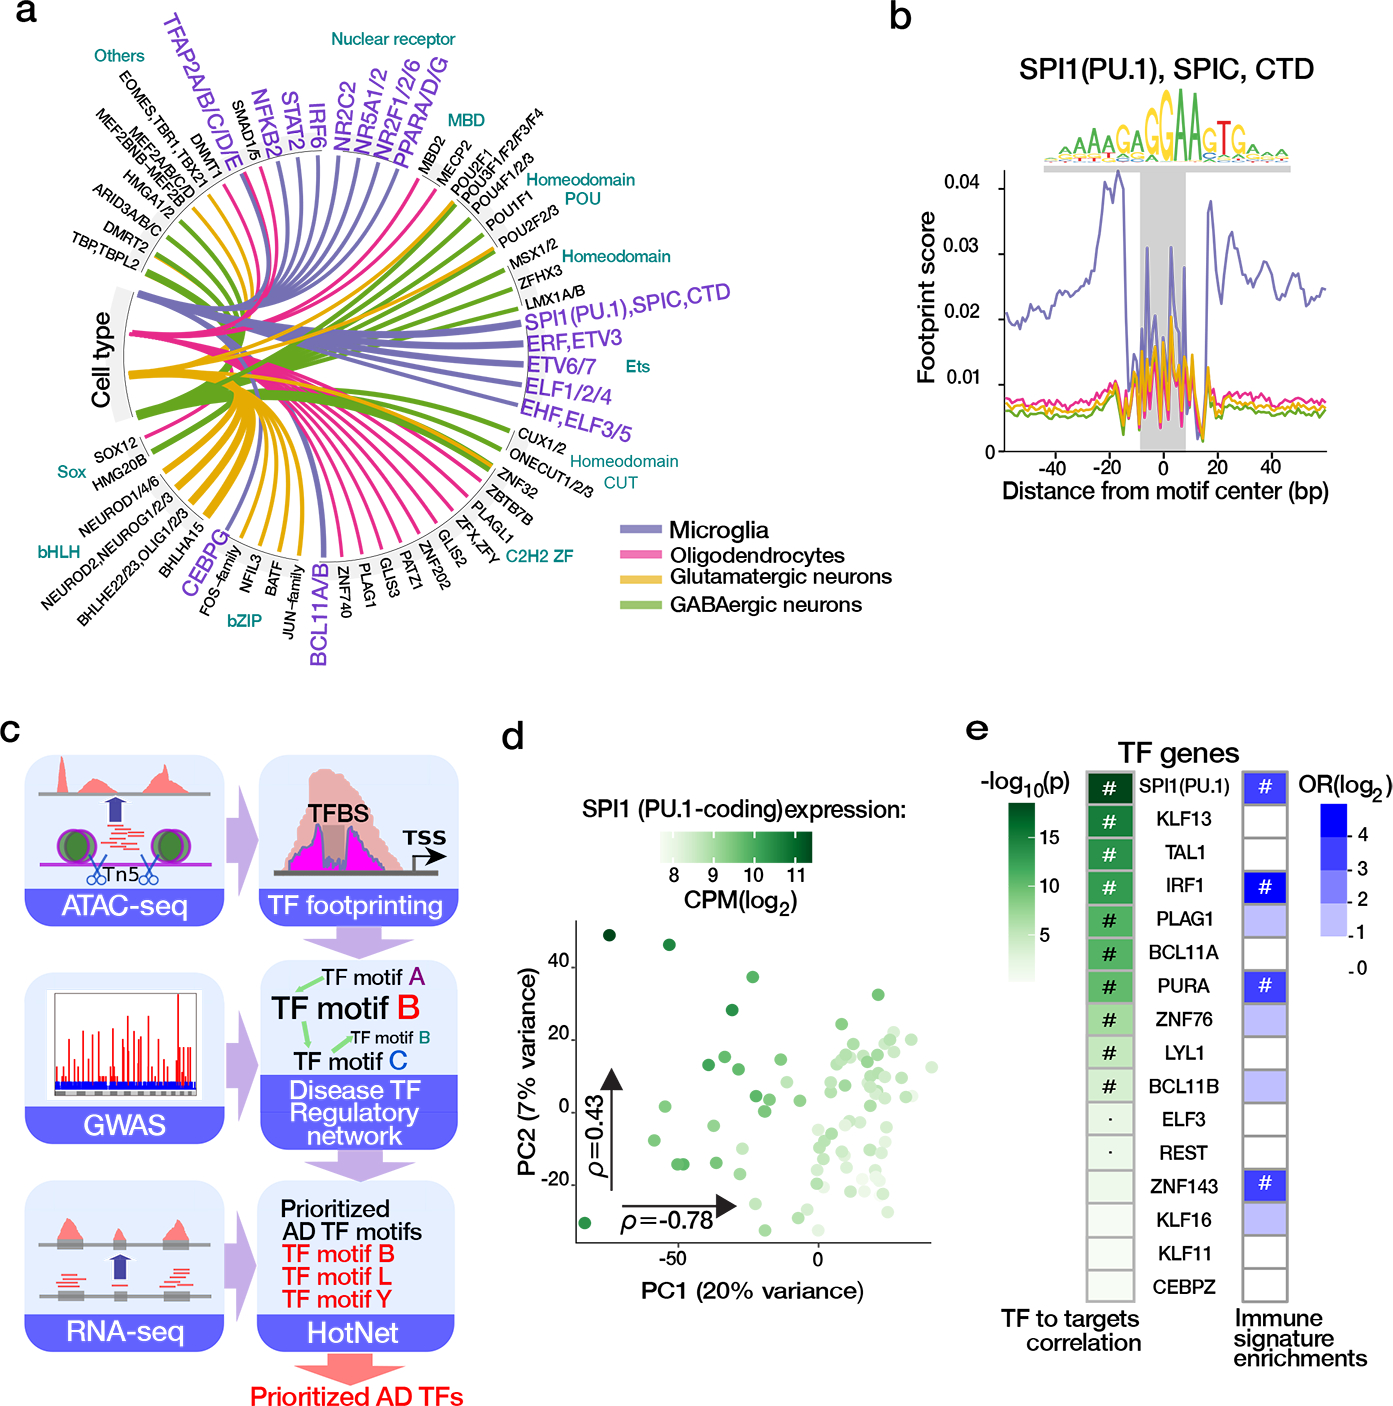
a) Top cell-specific TF binding events detected by TF footprinting in the microglia and three other major brain cell lineages 5. Line thickness indicates the fold enrichment in the highlighted cell types compared to the mean number of bound TFs in other cell types (all BH<0.05, one-sided binomial test). b) Aggregated footprint profile of PU1 motif within the jointly called OCRs in the four cell populations (total number of detected PU.1 motifs = 192,514). Plot outline colors the same as in panel (a). c) Schema for AD TF prioritization analysis. d) Principal component analysis of expression for predicted PU1 targets genes for n=127 samples colored by expression of PU1-encoding SPI1 gene. Spearman correlation (ρ) with each principal component. e) Prioritization of TFs from AD TF regulatory networks based on correlation with PC1 of the respective downstream target genes (shaded in green by P value, ‘#’ = FDR < 0.05, ‘·’ = P value < 0.05, two-sided linear regression). Right column: Enrichment analyses of the TF downstream target genes for immune-related gene signatures. The values represent odds ratio enrichment for immune-related signatures among enrichments for all functional signatures. Significant enrichment (FDR < 0.05, two-sided Fisher’s Exact Test) is indicated by “#”.
Cross-regulation among groups of TFs in a given cell type defines regulatory subnetworks that underlie cellular identity and facilitate the integration of complex cellular signals. Using predicted TF binding within OCRs from footprinting analysis, we constructed a directed TF-to-TF regulatory network (TFRN) capturing the hierarchical TF regulome in microglia (Fig. 5b and Supplementary Fig. 17). We then used AD genetic risk variants 13 to assign weights to the nodes in the generated TFRN 38, and identified subnetworks composed of 11 TF motifs jointly representing perturbed regulatory hubs in AD. Of the 23 TF genes corresponding to these motifs, 16 were expressed in microglia, with largely independent expression patterns (Supplementary Figs. 18a and 19a).
We prioritized TFs within this set based on the correlation of TF gene expression with the expression of their respective predicted target genes. Expression of PU.1-encoding SPI1 had the strongest correlation with the transcriptional landscape of its 4,226 predicted target genes (Fig. 5d and Supplementary Fig. 18b). Altogether, we observed significant downstream signatures for 10 of the 16 TF genes (Fig. 5e, left column, and Supplementary Fig. 30c), with SPI1(PU.1) and TAL1 maintaining the relationships independently of other implicated TFs (Supplementary Fig. 19b). Reflecting known microglial biology, the downstream target genes for three of these TFs (SPI1/PU.1, IRF1 and ZNF143) have a predominantly immune function as illustrated by the over-representation of immune related signatures among the enriched biological pathways (Fig. 5e, right column). The targets of SPI1/PU.1 particularly strongly highlighted the contribution of myeloid/leukocyte related processes (Supplementary Fig. 19c).
Discussion
We examined how genetic regulation of chromatin accessibility affects transcription in primary human microglia. With microglia comprising a small fraction of all brain cells, any resources generated using brain homogenate do not comprehensively capture the microglia-specific regulome. To address this gap in our knowledge, we generated multiomic data comprising ATAC-seq, RNA-seq, and Hi-C using microglia cells isolated from 150 unique donors. We present a large microglia-specific meta-eQTL analysis and a publicly available human microglia caQTL dataset. Incorporating Hi-C derived loop data allowed us to link accessible chromatin to target genes, leading to the identification of ~25,000 discrete regulatory E-P units, regulating 9,890 genes. The majority of these interactions were not observed in previous datasets.
In 14 previously implicated AD risk loci, we identified disease regulatory units associated with expression of an individual gene. Our findings support the involvement of previously implicated genes, BIN1, PICALM, CD33, CASS4, ADAMTS4, INPP5D and APH1B, in 7 independent loci 39,40. Furthermore, our approach allowed us to fine-map AD risk loci and identified 8 genes, EPHA1-AS1, USP6NL, CCDC6, AC099524.1, ZNF652, MS4A4E, RABEP1 and CLU, as the putative AD genes in previously unresolved loci containing multiple candidate genes.
EPHA1-AS1 is an example where our multiomic approach enabled fine-mapping of a particular AD risk gene paired with the genetic regulatory mechanisms affecting its expression. Here, a genetic variant, rs11771145, was identified as a candidate causal variant with PP = 0.99 for EPHA1-AS1 and two OCRs located 6 kb and 51 kb from the gene’s TSS. This variant is located 130 bp from the peak 188003, with the OCR ATAC-seq signal strongly (r = 0.69) correlated with EPHA1-AS1 expression. This SNP has the strongest association with AD at the locus in the International Genomics of Alzheimer’s Project 41 and European Alzheimer’s Disease BioBank studies 40. Interestingly, though rs11771145 was not included within the 95% credible interval in the AD GWAS 13 utilized in our colocalization analyses, we still observed significant evidence linking EPHA1-AS1 regulation with AD through at least one regulatory element.
Importantly, while the majority of the observed colocalization was seen within previously reported AD loci, our analyses also identified three novel putative AD risk genes not in genome-wide significant regions by GWAS alone: LRRC25, FIBP and KCNN4. LRRC25 regulates virally induced autophagy in myeloid cells 42. FIBP binds to acidic fibroblast growth factor (aFGF) released by astrocytes, and enhances the activation of human microglia following LPS/IFN-γ stimulation 43. Therefore, FIBP may be an intriguing link in the astrocyte-microglia axis of AD. KCNN4, on the other hand, has been examined as a therapeutic AD target due to its role in the removal of neurotoxic debris by phagocytosis 31,32. Our analysis indicates that alleles associated with decreased expression of all three of these genes are associated with increased AD risk.
TF footprinting enabled inference of microglia TF regulatory networks. TFs whose regulatory neighborhood is enriched in AD risk genes were prioritized and, of those, the TF with the strongest downstream effect was PU.1 (encoded by SPI1). PU.1 has previously been associated with increased AD risk 26,44. caSNPs were disproportionately overrepresented within PU.1 binding sites and, in 92% of these, alleles associated with lower OCR strength disrupt PU.1 binding motifs. A similar, albeit weaker, effect was observed for eSNPs. Thus, genetic variants that decrease binding of PU.1 were sufficient to interfere with the stability of chromatin accessibility. This observation, combined with the transcriptional changes associated with SPI1 expression, highlight a potential regulatory role for SPI1/PU.1 in microglia, with particular relevance to AD. We replicate previous evidence supporting PU.1 as a transcriptional factor critical to microglial contribution to AD 11,26,44, and further identify additional TFs implicated in AD. We also observe population-level expression variation in PU.1 as well as variation in downstream expression targets. This highlights the role of PU.1 in regulatory network variation in microglia across donors.
Altogether, our multiomic dataset provides insight into the regulation of microglia transcription, enabling annotation of a large number of distal regulatory elements and downstream genes. The strong enrichment of AD risk variants in microglia OCRs further establish a role for microglia in AD. We were able to fine-map multiple AD loci, identifying not only the relevant genes but, in some cases, proposing the regulatory mechanisms contributing to disease, thus allowing further exploration of the genetic basis of particular neurodegenerative phenotypes. This resource provides an atlas of the human microglia regulome that can be leveraged to guide focused experiments in AD and other neurodegenerative diseases and to understand the impact on transcription of a particular risk locus.
Material & Methods:
Sample providence and processing
All brain specimens were obtained through informed consent and/or brain donation programs at the Mount Sinai School of Medicine and Rush University Medical Center. All procedures and research protocols were approved by the corresponding ethical committees of our collaborators’ institutions.
Autopsies
The autopsy brain specimens originated from brain donation programs at Rush University Medical Center/Rush Alzheimer’s Disease Center (RADC) in Chicago, IL and The Mount Sinai/JJ Peters VA Medical Center NIH Brain and Tissue Repository (NBTR) in the Bronx, NY. NBTR samples were collected following similar parameters to MSBB–Mount Sinai NIH Neurobiobank cohort 46, representing a full spectrum of cognitive and neuropathological disease phenotypes. All neuropsychological, diagnostic and autopsy protocols were approved by the Mount Sinai and JJ Peters VA Medical Center Institutional Review Boards. Postmortem brain tissue was transported on ice to the Neurobiobank laboratory, where a section of Brodmann area 10 was dissected, rinsed in ice-cold sterile saline, placed in ice-cold MACS tissue storage solution, and immediately refrigerated (4 °C). RADC samples were collected as part of two prospective studies of aging: the Religious Orders Study (ROS) 47 and the Memory and Aging Project (MAP) 48. After autopsy, the collected tissue was weighted, placed in ice-cold MACS tissue storage solution and shipped overnight at 4 °C.
Biopsies
DLPFC samples in living individuals were collected as part of the Living Brain Project, approved by the Human Research Protection Program at the Icahn School of Medicine at Mount Sinai (STUDY-13-00415) from patients undergoing deep brain stimulation (DBS) procedure as part of standard-of-care treatment for Parkinson’s disease. Additional samples were collected from patients undergoing procedures for intracerebral hemorrhage evacuation (STUDY-18-01012A). Following tissue dissection/isolation, all samples were placed in ice-cold MACS tissue storage solution and refrigerated.
Isolation of microglia from fresh human brain specimens
Fresh autopsy and biopsy tissue specimens were processed using the Adult Brain Dissociation Kit (Miltenyi Biotech cat.# 130107677), according to manufacturer’s instructions. Following de-myelination (Miltenyi de-myelination kit, Miltenyi Biotech, cat.# 130096733) cells were incubated in antibody (CD45: BD Pharmingen, Clone HI30 and CD11b: BD Pharmingen, Clone ICRF44) at 1:500 for 1 hour in the dark at 4 °C with end-over-end rotation. RNase inhibitors (Takara Bio) were used throughout cell preparation. Prior to fluorescence-activated cell sorting (FACS), DAPI (Thermoscientific) was added at 1:1,000 to facilitate the separation of live from dead cells. Viable (DAPI−) CD45+ cells were isolated via FACSAria flow cytometer (BD Biosciences). Following FACS, cell concentrations and viability were confirmed using a Countess automated cell counter (Life technologies).
Genotyping and Imputation
Genomic DNA for genotyping was extracted from frozen brain or buffy coat using the QIAamp DNA Mini Kit (Qiagen), according to manufacturer’s instructions. Samples were genotyped using Infinium Psych Chip Array (Illumina) at the Mt Sinai Sequencing Core, with 571,496 SNPs retained after QC. Imputation was performed using the University of Michigan Imputation server (https://imputationserver.sph.umich.edu) utilizing the HRC reference panel, and 7,723,699 SNPs with MAF > 0.05 in the were retained for caQTL and eQTL analyses.
Chromatin Accessibility analyses
Generation of ATAC-seq libraries, sequencing and QC
ATAC-seq reactions were performed on 120 samples (113 autopsies and 7 biopsies) using an established protocol 49 with minor modifications. In brief, 75,000 sorted cells were centrifuged at 300 g for 10 min at 4 °C. Following resuspension of the pellets in lysis buffer, samples were centrifuged at 500 g for 10 min at 4 °C. Pellets were resuspended in transposase reaction mix (25 μl 2× TD Buffer (Illumina) 2.5 μl Tn5 Transposase and 22.5 μl Nuclease-free H2O) on ice. Reactions were incubated at 37 °C for 30 min and then purified using the MinElute Reaction Cleanup kit (Qiagen), eluting in 10 μl of buffer EB. Following purification, library fragments were amplified using the Nextera index kit as described previously 49. Library quality was determined by analysis on Tapestation D5000 ScreenTapes. Following amplification, libraries were resolved on 2% agarose gels and fragments ranging in size from 100–1000 bp were excised and purified (Qiagen Minelute Gel Extraction Kit). Before sequencing, libraries were quantified with the Qubit dsDNA HS assay kit and using quantitative PCR Fragment sizes were estimated using Tapestation D5000 ScreenTapes and libraries were sequenced on Hi-Seq2500 (Illumina) obtaining 2 × 50 paired-end reads or the NovaSeq6000 platform (Illumina) obtaining 2 × 100 paired-end reads.
Sequenced reads were delivered by the sequencing facility already demultiplexed and with adaptors trimmed. FASTQ files were matched to the respective samples based on pooling IDs and barcodes. Reads were subsequently aligned to the hg38 reference genome with the pseudoautosomal region masked on chromosome Y with the STAR aligner (v2.7.0e), implementing WASP module to correct for allelic bias in mapping with available SNP genotyping data. The alignment yielded a BAM file for each sample consisting of mapped paired-end reads sorted by genomic coordinates. The following reads were removed: mapped to multiple loci, duplicated reads and reads mapping to the mitochondrial genome. Quality was assessed using Qualimap, fastqc, and phantompeakqualtools. Genotypes were called using GATK (v3.5.0), keeping variants with a phred-scaled confidence threshold ≥ 10, removing clustered variants, those within ENCODE blacklisted regions of the genome (doi:10.17989/ENCSR636HFF), and variants not in dbSNP v151. Three different metrics were used to assess the sex of the samples.
Peak Calling and Quality Control.
Peak calling was performed using MACS v2.1 50 as previously described 5. In short, we merged samples with the same disease phenotype (AD, Controls, and Other) into one BAM-file. The three resultant bam files were then subsampled to a uniform depth and used as input for peak calling. For each sample, a number of quality control metrics were used as described in Supplementary Table 2. We excluded libraries that had a low FRiP (<20%), had a low final read count (<5 million reads), visually were outliers in clustering, or looked to have outright failed when inspecting the bigWig track. After QC steps 107 samples remained for downstream analyses.
The samples with the same neurodegenerative disease related phenotype were subsequently subsampled and merged, creating 3 BAM-files (AD, Controls, and Other) with a uniform depth of 240 million paired-end reads. Using these BAM-files, bigWig files were created using bedtools, bedGraphToBigWig, wigToBigWig, and wiggleTools. Peaks were called with the same parameters as for QC. A consensus set of peaks was subsequently created with peaks called in at least one merged BAM-files. After removing peaks overlapping blacklisted genomic regions, 210,832 peaks remained, and read counts of the individual 107 non-merged samples within these peaks were quantified. The generated peaks were compared with other brain based ATAC-seq datasets (Supplementary Table 5) using Pairwise Spearman correlation between samples in the residualized expression matrix was visualized using MDS.
Transcriptome analysis
Generation of RNA-seq libraries and sequencing
Where available, 100,000 cells were sorted into 1.5 ml low-binding Eppendorf tubes containing Extraction buffer, a component of the PicoPure RNA Extraction kit (Arcturus), incubated at 42°C for 30 min while shaking at 1.2 g, followed by RNase-free DNase treatment step (Qiagen). Samples were eluted in RNase-free water and stored at −80 °C until preparation of RNA-sequencing libraries using the SMARTer Stranded Total RNA-seq Pico Kit (Takara Clontech Laboratories) v1 or v2. RNA-seq libraries were quantified by quantitative PCR and library fragment sizes estimated using High Sensitivity Tapestation D1000 ScreenTapes. RNA-seq libraries were subsequently sequenced on NovaSeq 6000 (Illumina) machines yielding 2 × 50, 2 × 100, or 2 × 150 bp paired-end reads.
RNA-seq processing
The generated RNA-seq libraries were processed by RAPiD, a locally implemented standard pipeline (https://github.com/CommonMindConsortium/RAPiD-nf/blob/master/tutorial.md). TRIMMOMATIC (v0.36) 51 trimmed pair end reads were aligned to the human reference genome GRCh38/hg38 via STAR (v2.7.0e) 52, implementing WASP module for samples with the available SNP array information 53. The generated BAM files contained splice junction, and transcript/isoform level quantification was performed with RSEM (v1.3.1) 54, summarized for gene level analyses. Quality control metrics were generated via Picard (v2.2.4; http://broadinstitute.github.io/picard). Sex identity was validated via expression of XIST versus RPS4Y1 genes. Starting with 165 samples, for QC we considered a number of metrics, including a low ratio of uniquely mapped reads (>50%), and removing samples whose mean correlation to all pairs of samples within the dataset was more than three times higher than the standard deviation calculated upon all pair’s correlation. RNA-seq QC metrics for the 127 samples utilized for further downstream analyses are summarized in Supplementary Table 3. The generated transcription data was compared to neuronal, astrocytes, and oligodendrocytes data, processed utilizing the standard in-house RAPiD pipeline, were downloaded from ARCHS4 resource (https://maayanlab.cloud/archs4/data.html) 55.
Hi-C analysis
Generation of Hi-C libraries and sequencing
Hi-C data were generated from five fresh postmortem human brain tissue using the in situ Hi-C protocol 56 with the following modifications. FACS sorted cells were fixed with 0.5% formaldehyde for 10 min and then quenched with 0.125 M glycine for 5 min at RT. Cross-linked tissue was then placed on ice for a further 15 min to quench crosslinking completely. Samples were centrifuged at 800 g for 10 min at 4 °C and pellets resuspended in a lysis buffer to isolate cross-linked nuclei. Approximately 1 M crosslinked nuclei were thawed on ice, washed with ice-cold 1× CutSmart buffer and split into 4 aliquots to generate technical replicate libraries per sample, with 250,000 nuclei per library. Proximity ligated DNA (MboI or DpnII/HinfI) was purified, and then sheared using a Covaris S220 sonicator to generate a peak size of 400 bp. Biotin-labeled ligation junctions were purified with Dynabeads MyOne Streptavidin C1 beads by incubating for 1 h at RT. Illumina compatible libraries were prepared from the sonicated and streptavidin bead immobilized DNA using the NEBNext Ultra II Library prep kit, following manufacturer’s instructions, by amplifying libraries for 6–10 PCR cycles. Libraries were purified by 2-sided size selection (300–800 bp) using Ampure XP beads. All libraries were analyzed on a TapeStation using Agilent D5000 ScreenTapes, and quantified using the KAPA Library Quantification Kit prior to sequencing. Uniquely barcoded Hi-C libraries were pooled and deep sequenced on the Illumina NovaSeq S4 platform (Illumina) obtaining 100 bp paired-end reads.
Hi-C data analysis
Hi-C data were aligned using the HiC-Pro strategy 57. The chimeric reads that failed to align were trimmed after ligation sites, and mapped to the genome. All the aligned reads from both ends were then merged based on read names and mapped to MboI or DpnII/HinfI restriction fragments using hiclib package (https://github.com/mirnylab/hiclib-legacy) 58, discarding self-circles, dangling ends, PCR duplicates, and genome assembly errors. Samples of the same cell type were merged. We binned the interaction matrix at different resolutions and corrected it with iterative correction (ICE) for downstream analysis 58. All Hi-C QC metrics are summarized in Supplementary Table 4. The resulting Hi-C data comprised 7,108,360,527 reads (4,677,481,870 Hi-C contacts) obtained from a total of 19 technical replicates from a total of 5 individual donors.
Transcription factor analysis
To estimate chromatin occupancy by transcription factors, we performed footprinting analysis using TOBIAS (v.0.10.1) 25 as detailed in the following.
Estimation of chromatin occupancy by transcription factors
Starting from the human TF binding motifs downloaded from the CIS-BP 1.02 meta-database 59, containing 3,059 motifs, we retained 431 motifs, representing 798 transcription factors. The footprinting analysis was performed separately for (1) comparison of microglia samples with other brain regions and (2) microglia samples only. In the former case, we started the analysis with the merged set of all OCRs detected in microglia, glutamatergic neurons, GABAergic neurons, and oligodendrocytes 5. In the latter case we split microglia samples to AD, Controls, and Other groups. Each of the groups was represented by one BAM file, consisting of randomly selected from the corresponding samples 240 million reads. For both analyses, we ran the TOBIAS module ATACorrect to correct for Tn5 insertion bias in input BAM files, followed by TOBIAS ScoreBigwig to calculate footprinting scores across OCRs. Then, TOBIAS BINDetect combined footprinting scores with the information of transcription factor binding motifs to evaluate the individual binding positions of each transcription factor within each subset. Finally, TOBIAS PlotAggregate was used to visually compare the aggregated footprints for select motifs.
Calculation of TFRN networks and prioritization of TF motifs
We assembled a TF regulatory network (TFRN) in microglia (using microglia samples only) capturing TF-to-TF interactions among the 431 TF motifs (nodes). Directed connections (edges) were defined by the presence of actively bound transcription factor binding sites in the proximal regulatory regions (< 3 kb from TSS) of 798 TF genes. This network was an input of the HotNet algorithm 38 to find altered subnetworks containing TF motifs highly dysregulated based on GWAS and are topologically close on an interaction network. Gene-level AD GWAS weights were calculated by MAGMA 1.07b 60. For multiple TF genes per one TF motif, we set the weight to be the highest -log10(P value) and applied the Sidak method for multiple testing corrections 61, retaining TF motifs with at least 50 TF-to-TF interactions.
Prioritization of TF genes represented by the same TF motif
To identify the contribution of individual TFs sharing the same TF motif, we detected all genes that have a given motif actively bound in the promoter region (within 3 kb from TSS). We subsetted the expression matrix for those genes and calculated its principal components. Lastly, we quantified the Pearson correlation coefficient of the first principal component and the expression of all TF genes representing a given TF motif, keeping only significantly correlated TF genes (BH P < 0.05). TF prioritization accounting for correlation with the remaining TFs was performed as follows: for a given TF, expression of downstream target genes was assembled and linear regression was performed on each gene using the 15 other TFs as covariates. The residuals from this regression were evaluated, and the correlation between the first principal component and the TF of interest was computed.
Variance component modeling of gene expression
A variance component analysis was used to examine how much gene expression variability could be correlated to patterns of chromatin covariance following an implementation suggested by a previous report 62. Negative binomial distribution of RNA-seq count data was modeled via variance stabilizing transformation (vst; varistran R package) 63. Then, for each gene represented by vst-normalized vector g, we considered the following variance component model: Yg’ = N(0,P, OCREPsocr2 + Usu2), where OCREP is the sample-sample covariance matrix of 185,644 chromatin accessibility regions (OCRs within 100kb upstream from the transcription start site), and Usu2 is the noise term. The values of socr2 and su2, were estimated by the average information restricted likelihood estimation (AIREML; gaston R package) 64. We used residualized count matrices of OCRs where the effect of technical covariates was regressed out. Importantly this approach models the relationship between a single gene expression trait and the genome-wide chromatin landscape, rather than just its own promoter/enhancer OCRs. Permuted analyses were done by shuffling the sample labels for the vst-transformed expression matrix for the 88 samples with both ATAC-seq and RNA-seq data available.
Prediction of enhancer-gene interactions (E-P links)
We used activity-by-contact model (ABC, v.0.2) 14 to construct a comprehensive regulatory map of enhancer-promoter (E-P). This model requires: (1) contact frequency between putative enhancers and promoters of regulated genes; and (2) enhancer activity data. Contact frequency matrix was represented by microglia Hi-C from 19 technical replicates generated as part of this study. Enhancer activity data were represented by the cell type and brain region specific ATAC-seq signal (current study) and previously published H3K27ac ChIP-seq data 4. In accordance with the authors’ directions, we filtered out predictions for genes on chromosome Y and genes not included in our RNA-seq dataset. We used the default threshold of ABC score (a minimum score of 0.02) and the default screening window (5 Mb around the TSS of each gene).
QTL analyses
eQTL and caQTL detection
To identify caQTL and eQTL in the fresh microglia, we utilized mmQTL, a flexible statistical package to control for population structure using genetic relatedness matrix 17. For each of genes or annotated OCR, variants in cis-region, defined as 500 kb and 50 kb around explored feature were tested for the association with the normalized gene expression or ATAC-seq signal. We applied two rounds of Benjamini-Hochberg (BH) correction to control for multiple tests following Young et al. 7: first used to correct multiple tests on locus-level for each feature, extracting the variant with the smallest BH-corrected P value; and in a second round the BH correction was applied genome-wide. FDR was controlled at 5%. The expression and ATAC-seq data as utilized for QTL analyses was corrected for selected technical and demographic variables (manual and BIC selected), 10 MDS, and empirically defined Peer factors.
Meta-QTL analysis
To improve the statistical power in QTL detection, we applied mmQTL 17 which provides a flexible meta-analysis pipeline to integrate QTL among datasets, either individual-level or summary results. Briefly, it firstly performed QTL detection in each of the datasets, and assembled the QTL signal, of which non-significant variants were used to estimate covariance due to phenotypic correlation. A mixed linear model was then used to estimate parameters, and RE2 65 was applied to test statistical significance. The conducted meta-eQTL analyses utilized summary results of eQTL from primary microglia samples collected from Lopes et al. 8 and Young et al. 7 together with the eQTL signal generated in this study. The meta-caQTL included our caQTL summary results with caQTL summary results from four macrophage datasets in Alasso et al. 18. MmQTL was applied to 64,740 OCR peaks uniquely overlapped between the four Alasoo et al. datasets and our ATAC-seq peaks. The identified 7,380 meta-caQTLs were combined with the 2,889 microglia-only caQTLs for the 140,285 OCRs present in the microglia dataset only. Multiple test corrections were applied as in the previous section.
To investigate the caQTL sharing and cell-type specificity we applied M-value, which is a Bayesian method to calculate the posterior probability measuring QTL existence in each study of a meta-analysis 20. For each ATAC-seq peak with significant meta-caQTL, we estimated the M-value in five datasets for variants with the most significant QTL evidence, using a looser cutoff 0.8 to determine support for a caQTL. For macrophage caQTLs we required an M-value of at least 0.8, observed in at least two of the macrophage datasets, to have considered the caQTL present in macrophages.
Estimation of effective sample size for meta eQTLs and caQTLs
Since the samples in Lopes et al. 8 and Alasoo et al. 18 were generated from a total of 100 and 42 unique donors, the effective sample size was smaller than the sum of nominal sample size. Additionally, considering that in the meta QTL detection, we included the dataset with samples from diverse populations, an effective sample size was estimated based on the reported variance of QTL signals. eQTL signals were detected only in n = 93 European individuals in Young et al. 7, which was used as baseline to compare with the reported variance in meta-eQTL results, and effective sample size was calculated as n*median(sYoung2/smeta2). The same pipeline was used to estimate effective sample size for meta-caQTL analysis, with the only difference that each of four macrophage caQTL results was used as reference, and the final estimator was calculated as the average of four effective sample sizes. The effective size for caQTL meta-analyses was 216 samples, and 400 for eQTL meta-analyses.
Evaluation of disease-specific QTL effects
To address the potential contribution of AD diagnosis on the identified QTL interactions, we conducted eQTL analysis using 42 AD cases and 34 control donors and caQTL analysis using 43 AD cases and 32 control donors. We directly perform a statistical test for differential effect size in AD vs controls for both caQTL and eQTL analyses. A two-sample z-test was used according to to test for a difference in effect size.
COLOC and MOLOC colocalization
To evaluate the relationship between molecular QTL, we used COLOC 27,28, an R package to conduct colocalization analysis, starting with the Z statistics output from meta-analysis. We normalized the summary results by setting variance to 1 before meta-analysis. The overlap between QTL and GWAS was done using only the base pair positions of each. SNPs were included if it was included in QTL analysis on a gene expression trait or OCR and had an available GWAS P value, with no other filtering or window around the lead GWAS variant done. We applied an extension of COLOC, MOLOC (https://github.com/clagiamba/moloc) 27,28, evaluating the colocalization of multi-omics data, summary results from meta-eQTL, meta-caQTL and GWAS summary results were used as input. Default parameters in implementation of COLOC and MOLOC were used, and significant colocalization were considered if pp4>0.5 for COLOC7 analyses and pp15>0.5 for MOLOC 28.
QTL/GWAS joint Fine-mapping
The joint fine-mapping analysis was performed following Hormozdiari 66, where posterior inclusion probabilities (PIP) from the same genetic variant are multiplied together for two traits to compute the colocalization posterior probability (CLPP). To evaluate the shared regulation in meta-eQTL and meta-caQTL, we conducted the joint fine-mapping analysis implementing eCAVIAR (https://github.com/fhormoz/caviar) strategy following Hormozdiari 77 assuming a single causal variant, and LD structure learned from 1000G European populations. Posterior inclusion probabilities (PIP) from the same genetic variant are multiplied together for two traits to compute the colocalization posterior probability (CLPP). A CLPP>0.01 was considered significant consistent with a widely used cutoff motivated by empirical analysis and simulations 17.
Evaluation of disruptive effect of caQTL on TF binding
To annotate the disruptive effect of caQTL on TF binding 67 we applied motifBreakR to the fine-mapped caQTL variants (95% credible sets) and located in ATAC-seq peak were mapped to 630 known TF motifs (JASPAR2016, http://jaspar.genereg.net). MotifBreakR calculated the relative entropy for the reference allele and alternative allele. We only kept the strongly affected TFBSs, calculated the allele’s binding ability difference, and compared it with the reported beta value in caQTL results. To determine what TFs are more likely to be affected by caQTL, we first sampled the same number of ATAC-seq peaks, from which we randomly chose the same number of variants as that in real fine-mapped caQTL variants, and the number of variants affecting TF binding ability were compared with that in real data. Fisher’s Exact test was used to calculate significance using the mean number of 100 random samples among genetic variants within the peaks, and FDR was controlled at 5% by BH method.
Integrating caSNPs with DeepSEA epigenome predictions
DeepSEA trained a deep neural network to predict the presence/absence of an epigenetic annotation given only the local genome sequence 23,24 (https://humanbase.readthedocs.io/en/latest/deepsea.html). The effect of a genetic variant was estimated by evaluating the probability of an epigenetic annotation given the reference sequence and comparing it to the probability given the alternative allele. For each variant DeepSea returns the log of the probability difference. For each of 8,786 caQTL SNPs located within the regulated OCR and which had posterior inclusion probability > 1%, the DeepSEA scores were obtained for 2,002 included assays. The direction of the DeepSEA score for each SNP was re-coded based on direction of the caQTL regression coefficient so that a positive value indicates that DeepSEA and the caQTL coefficient have the same predicted direction. For each assay, the mean of the re-coded DeepSEA effect size was evaluated. A positive mean indicates concordance between the DeepSEA predictions for the assay and the caQTL analysis from the current work. The set of 2,002 mean values was then converted to z-scores by subtracting the mean and dividing by the standard deviation, with a P value was then computed for each z-score.
Partitioned heritability analysis
We partitioned heritability for OCRs, caSNPs, and eSNPs to examine the enrichment of common variants in neuropsychiatric traits with stratified LD score regression (v.1.0.0) 68 from a selection of GWAS studies (Supplementary Table 6). Briefly, for the OCRs a binary annotation was created by marking all HapMap3 SNPs 69 that fell within the peak, while for eSNPs and caSNPs, PP scores were used for the continuous annotation. LD scores were calculated for the overlapped SNPs using an LD window of 1cM using 1000 Genomes European Phase LD reference panel 70. The enrichment was determined against the baseline model. To enable comparisons of the regression coefficients across traits with a wide range of heritabilities, we chose to normalize by the per-SNP heritability and named this adjusted metric the “normalized heritability coefficient”. To estimate the contribution of colocalized eQTL-caQTL to traits, we first calculated a colocalization posterior probability, which measures the probability that the eQTL-caQTL share the same causal variants, based on MaxCPP annotation in eQTL and caQTL. The constructed joint posterior probability was then used as continuous annotation to run partition heritability analysis.
Data and materials availability:
The genotypes, omics data and metadata are available via the AD Knowledge Portal (https://adknowledgeportal.org). The AD Knowledge Portal is a platform for accessing data, analyses, and tools generated by the Accelerating Medicines Partnership (AMP-AD) Target Discovery Program and other National Institute on Aging (NIA)-supported programs to enable open-science practices and accelerate translational learning. The data, analyses and tools are shared early in the research cycle without a publication embargo on secondary use. Data are available for general research use according to the following requirements for data access and data attribution (https://adknowledgeportal.org/DataAccess/Instructions). For access to content described in this manuscript see: http://doi.org/10.7303/syn26207321, including the derived data available for open distribution: processed ATAC-seq and RNA-seq data, OCR information and annotation, QTL summary and finemapping results, and colocalization results.
TF motifs utilized in MotifBreakR analyses utilize JASPAR2016 (http://jaspar.genereg.net). ATACseq data were filtered with DAC Blacklisted/Exclusion List Regions (doi:10.17989/ENCSR636HFF). Lopes et al. microglia eQTL data are available from National Institute on Aging Genetics of Alzheimer’s Disease Data Storage Site (NIAGADS) at https://dss.niagads.org/datasets/ng00105/ under accession no. NG00105.v1). For Alasoo et al. caQTL and eQTL data raw RNA-seq and ATAC-seq data are available from ENA (ERP020977) and EGA (EGAS00001002236) and processed read counts are available from Zenodo (doi: 10.5281/zenodo.259661). Young et al. Microglia eQTL data are available under managed access from the EGA, upon approval by the Wellcome Sanger Institute Data Access Committee (https://ega-archive.org/datasets/EGAD00001005736).
Code availability:
Code used throughout this study for analyses and visualization is available at http://doi.org/10.7303/syn26207321. Additional code may be available upon reasonable request from the corresponding authors.
“Extended Materials and methods are available as supplementary materials at the Nature Genetics website.”
Extended Data
Extended Data Fig. 1. Schematic outline of data generation and integrative analyses.
The general schema of the data generation, processing and utilization in the analyses described.
Extended Data Fig. 2. FACS gating of fresh microglia.
The gating strategy for a representative sample targeting live (DAPI−) CD45+ microglia.
Extended Data Fig. 3. Comparison of human microglia RNA-seq dataset to other available microglia datasets.
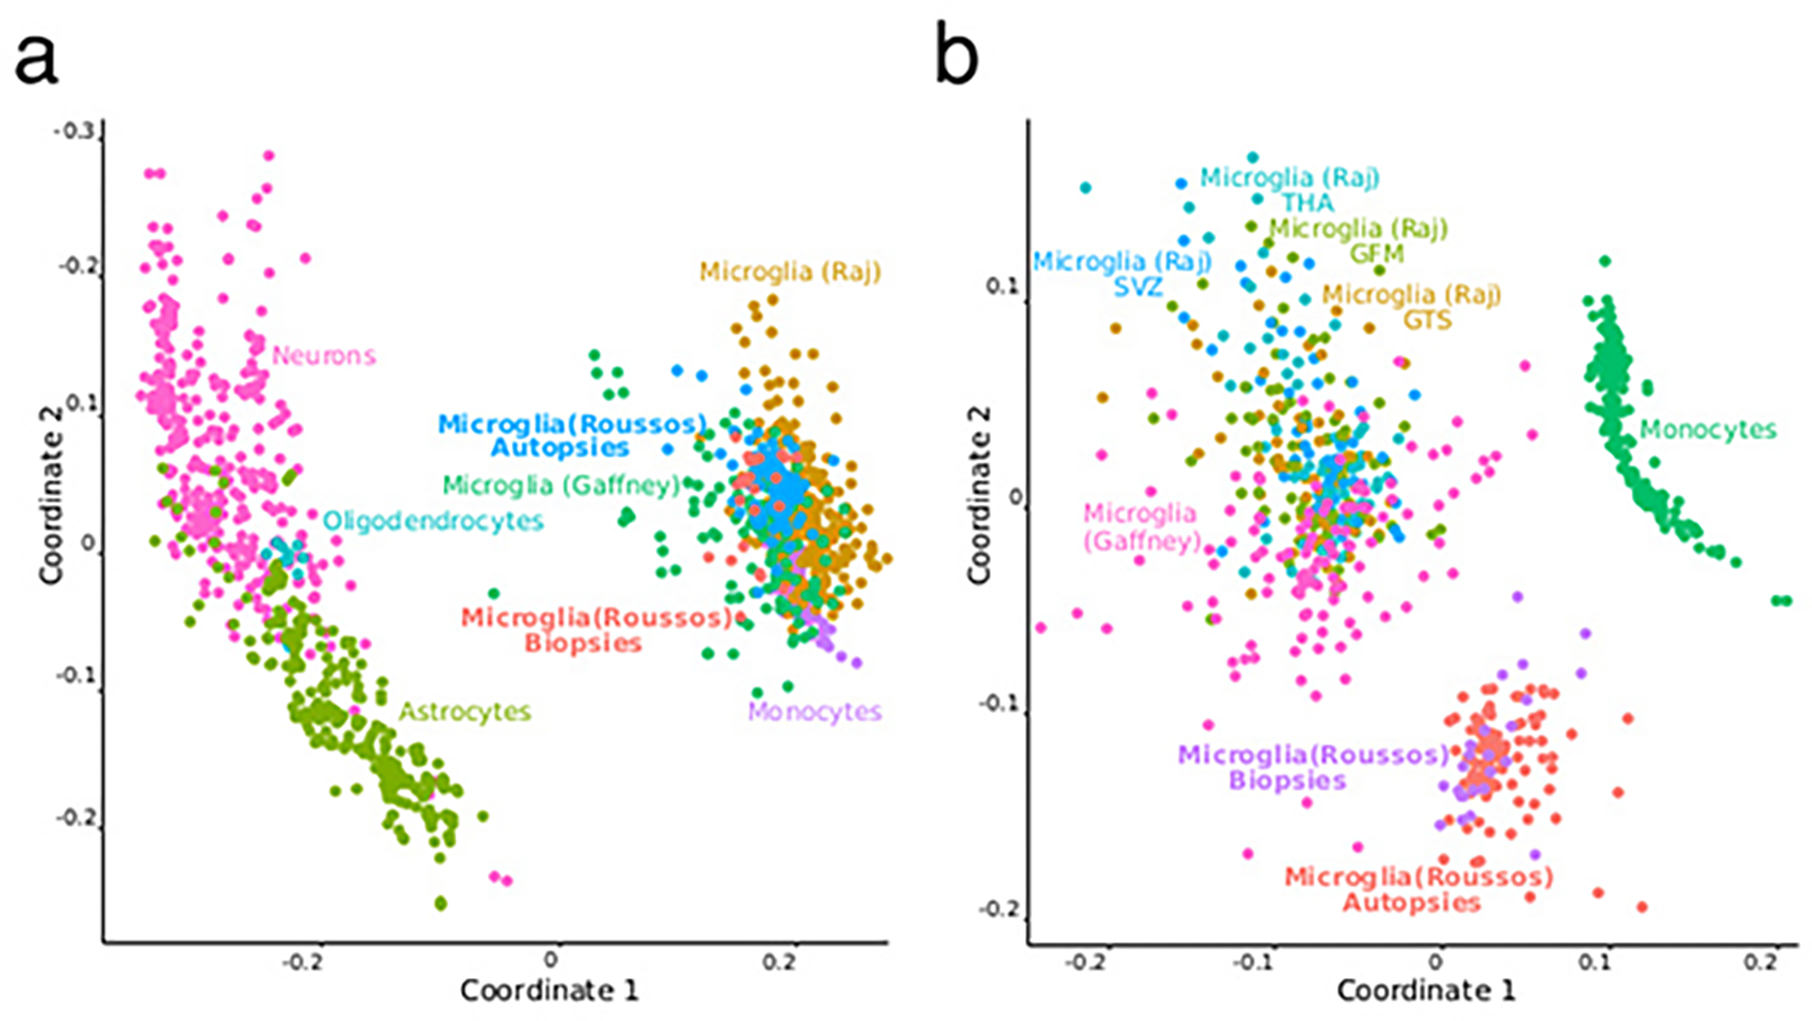
Comparison of human microglia RNA-seq dataset to other available microglia datasets. We applied multidimensional scaling (MDS) to expression data processed by the standard RAPiD pipeline (https://github.com/CommonMindConsortium/RAPiD-nf/blob/master/tutorial.md) for the two microglia transcriptomics datasets whose eQTLs were utilized in meta-eQTL analyses, as well as other relevant cell types. a) Comparisons include other brain-derived populations and b) only the three microglia and one monocyte datasets.
Extended Data Fig. 4. Comparison of caQTLs and eQTLs identified in our human microglia to relevant publicly available datasets.
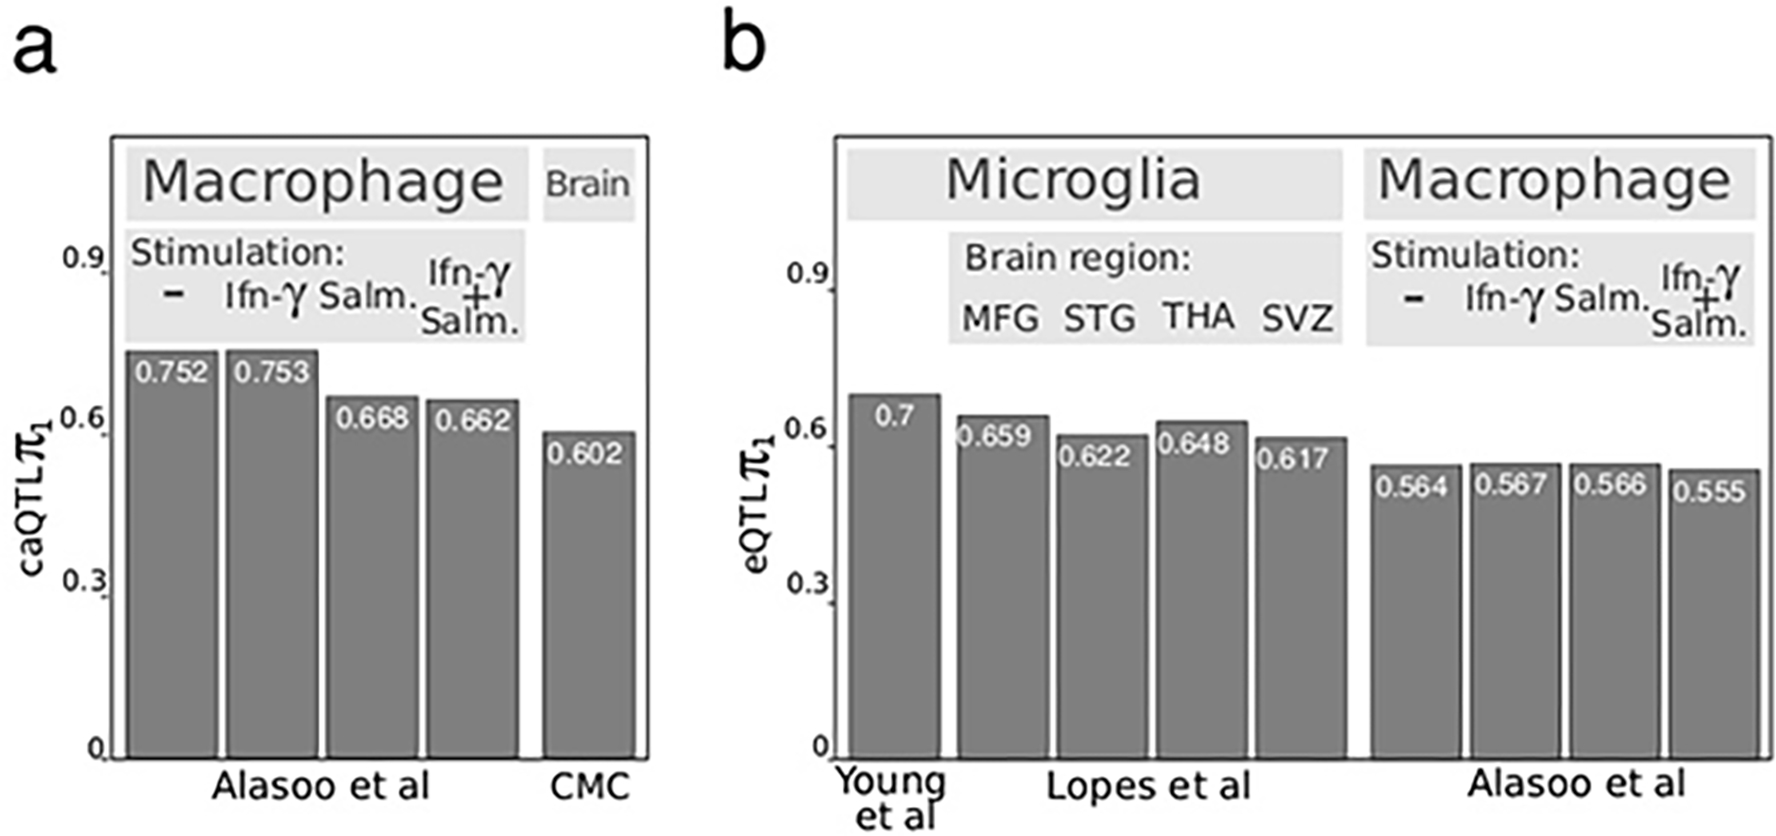
a) π1 replication of caQTLs identified in our microglia data to macrophage caQTLs from Alasoo et al. 18 and brain homogenate from CommonMind 19 ; b) π1 replication of eQTLs identified in our microglia data to microglia eQTLs from Young et al. 7 and Lopes et al. 8, and to macrophage eQTLs from Alasoo et.al 18.
Extended Data Fig. 5. The distribution and LDsc analyses of colocalized eQTLs and caQTLs.
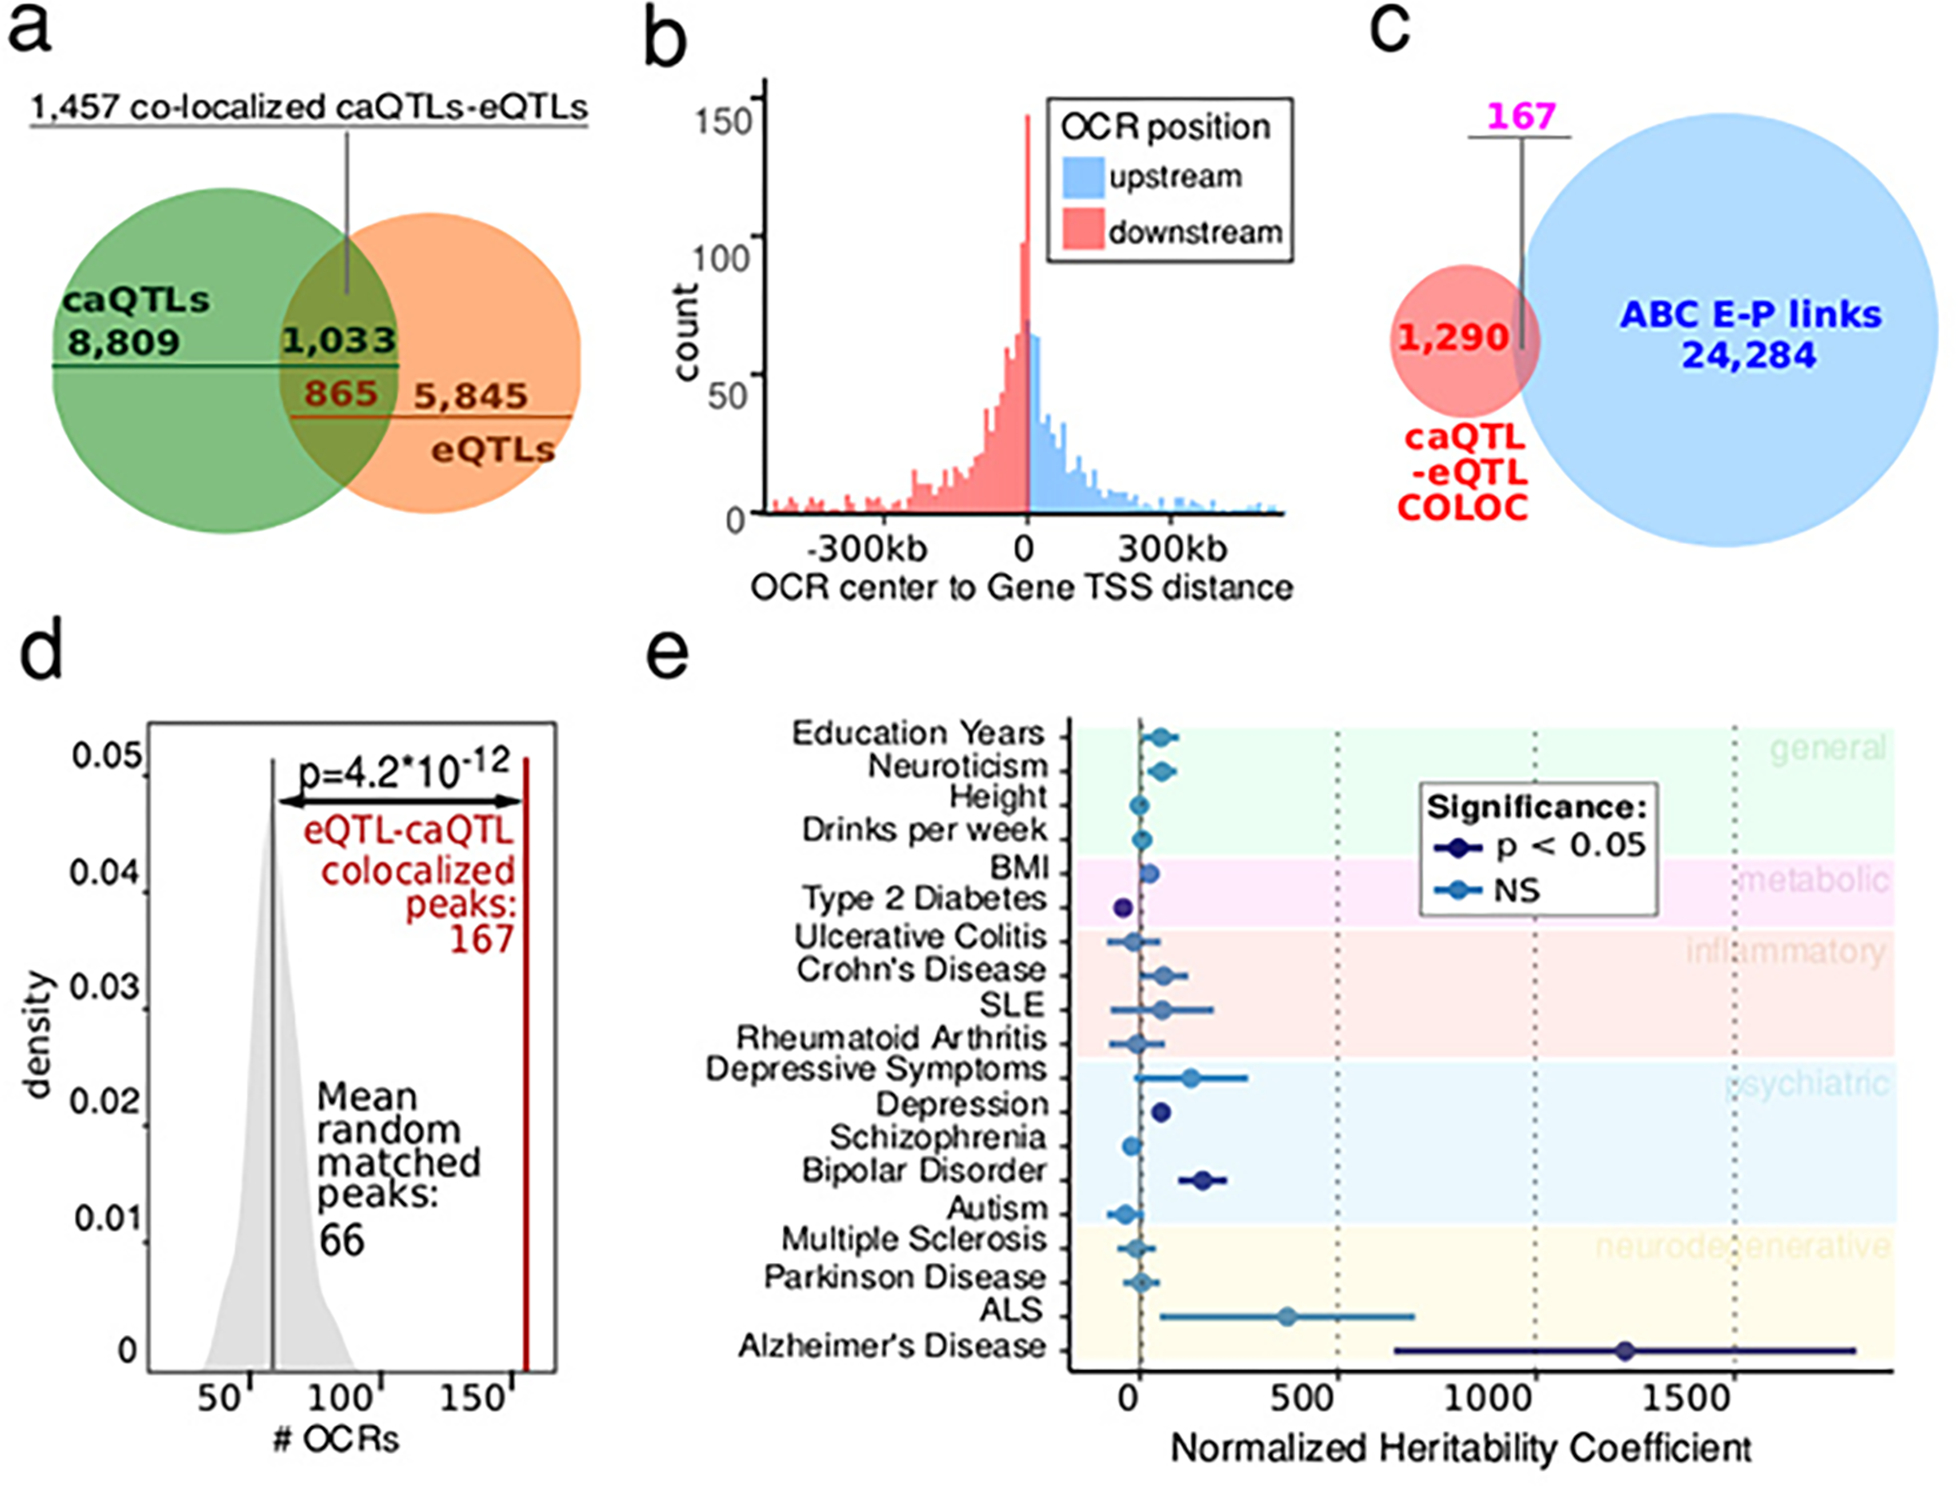
a) Venn diagrams represent the colocalized 1,457 OCR-Gene pairs among meta-caQTLs (green) and meta-eQTLs (red). Colocalized OCR-Gene pairs include 16 OCRs and 14 genes not significant in standalone meta-caQTLs and meta-eQTLs; b) The distribution of the distance between the OCRs and genes for the colocalized caQTLs and eQTL pairs. Mean distance is 101 kb, and median distance is 53 kb. c) Overlap between OCR-gene links identified via caQTL-eQTL colocalization method versus E-P links identified via the ABC approach; d) CaSNPs for the caQTLs colocalized with eQTLs are more likely to be located within OCRABC than in random OCRs. Red line represents the number of OCRABC regulated by colocalized caQTL, versus the distribution of OCRABC from 100 random sets of 1,457 distance-matched eQTL/caQTL pairs (P = 4.2 × 10⁻¹², two-sided t-test). e) Enrichment of SNPs representing 95% confidence intervals for the meta-caQTL and meta-eQTL sets identified in fresh microglia via LDscore analyses using summary statistics from a set of selected GWAS studies. For each genetic variant the value utilized was the highest product between posterior probabilities from eQTL and caQTL analyses (n = 30,028). Values in dark blue represent nominally significant enrichment. The utilized GWAS studies are described in Supplementary Table 6, including the number of snps from each study. Coefficients from LD score regression (two-sided linear regression) are normalized by the per-SNP heritability (h2 /total SNPs per GWAS), with horizontal bars indicating SE (AD P = 0.036, FDR P = 0.17).
Extended Data Fig. 6. Integration of the landscape of AD etiology with genetic regulation of transcriptional and chromatin accessibility in microglia within the EPHA1-AS1 locus.
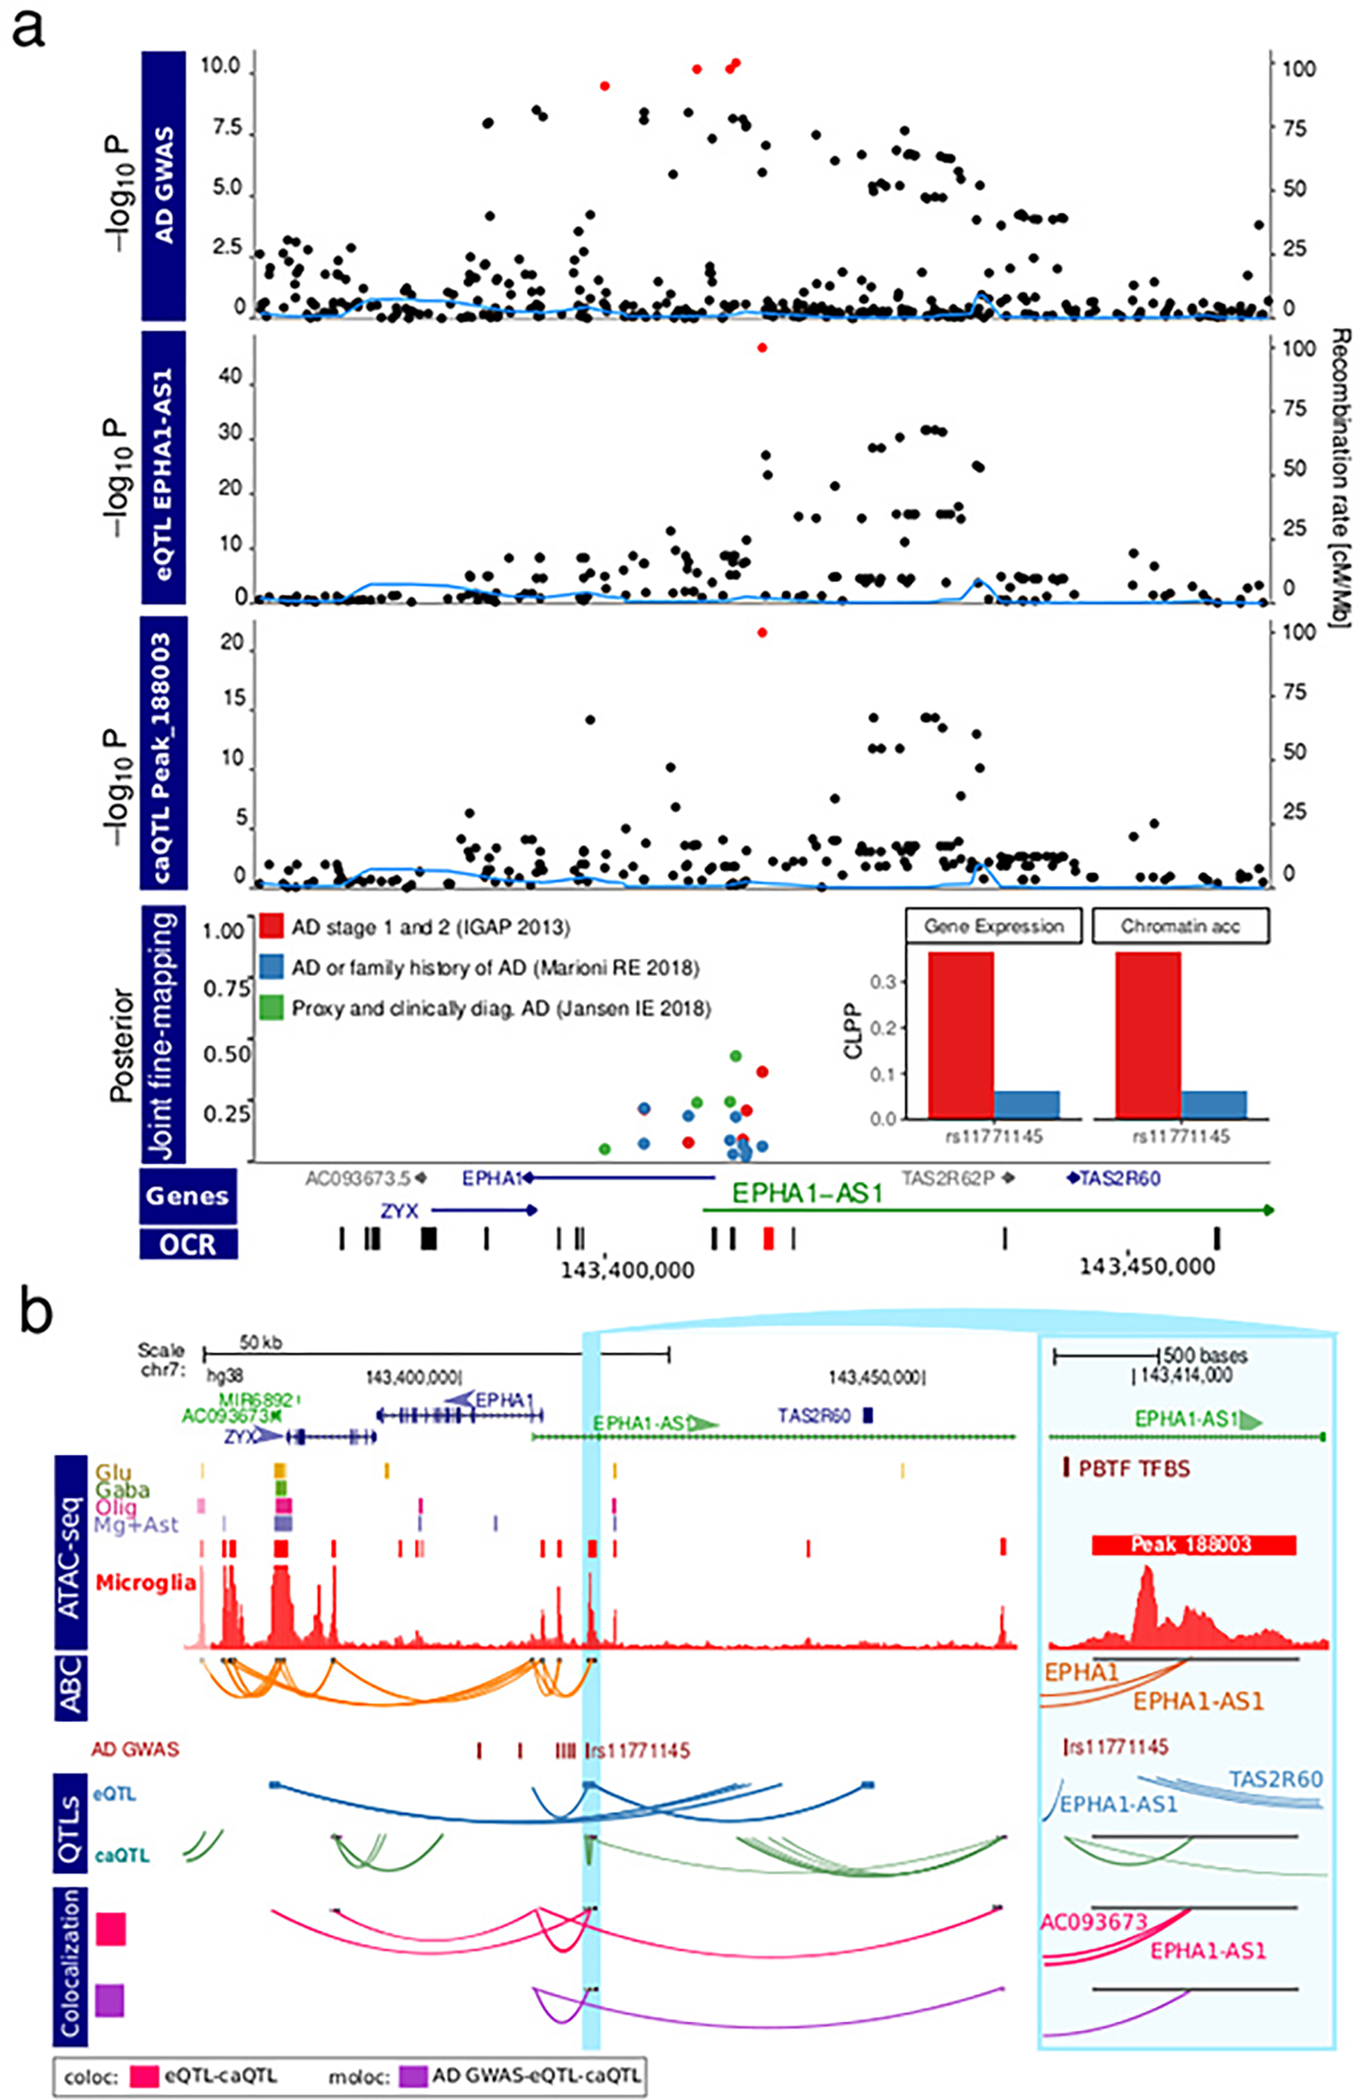
a) Local plot showing results from AD GWAS 13, eQTL analysis of EPHA1/EPHA1-AS1, and caQTL analysis of peak_188003 (P values are nominal significance estimates from two-sided logistic regression for GWAS, and mixed linear regression for QTL analyses). CLPP is the joint posterior probabilities 47 between the eSNP/caSNP PP and Jansen AD GWAS PP. Red points indicate genetic variants in the 95% credible set from statistical fine-mapping of each trait. Inset shows colocalization posterior probabilities (CLPP) for the top variant in the credible set for gene expression and chromatin accessibility. b) Visualization of EPHA1/EPHA1-AS1 locus showing: open chromatin regions from 4 cell populations 5 and microglia from this study; E-P interactions (ABC); fine-mapped variants from AD (Jansen) 13 ; genetic regulation from eQTLs and caQTL form thus study; and colocalization analysis between pairs of traits (i.e. AD GWAS, gene expression chromatin accessibility) using ‘coloc’ and all three traits using ‘moloc’ methods with Jansen et al. AD GWAS (PP15 >0.5) 29.
Extended Data Fig. 7. Relationship between colocalized components and predicted functional annotation at EPHA1-AS1 locus.
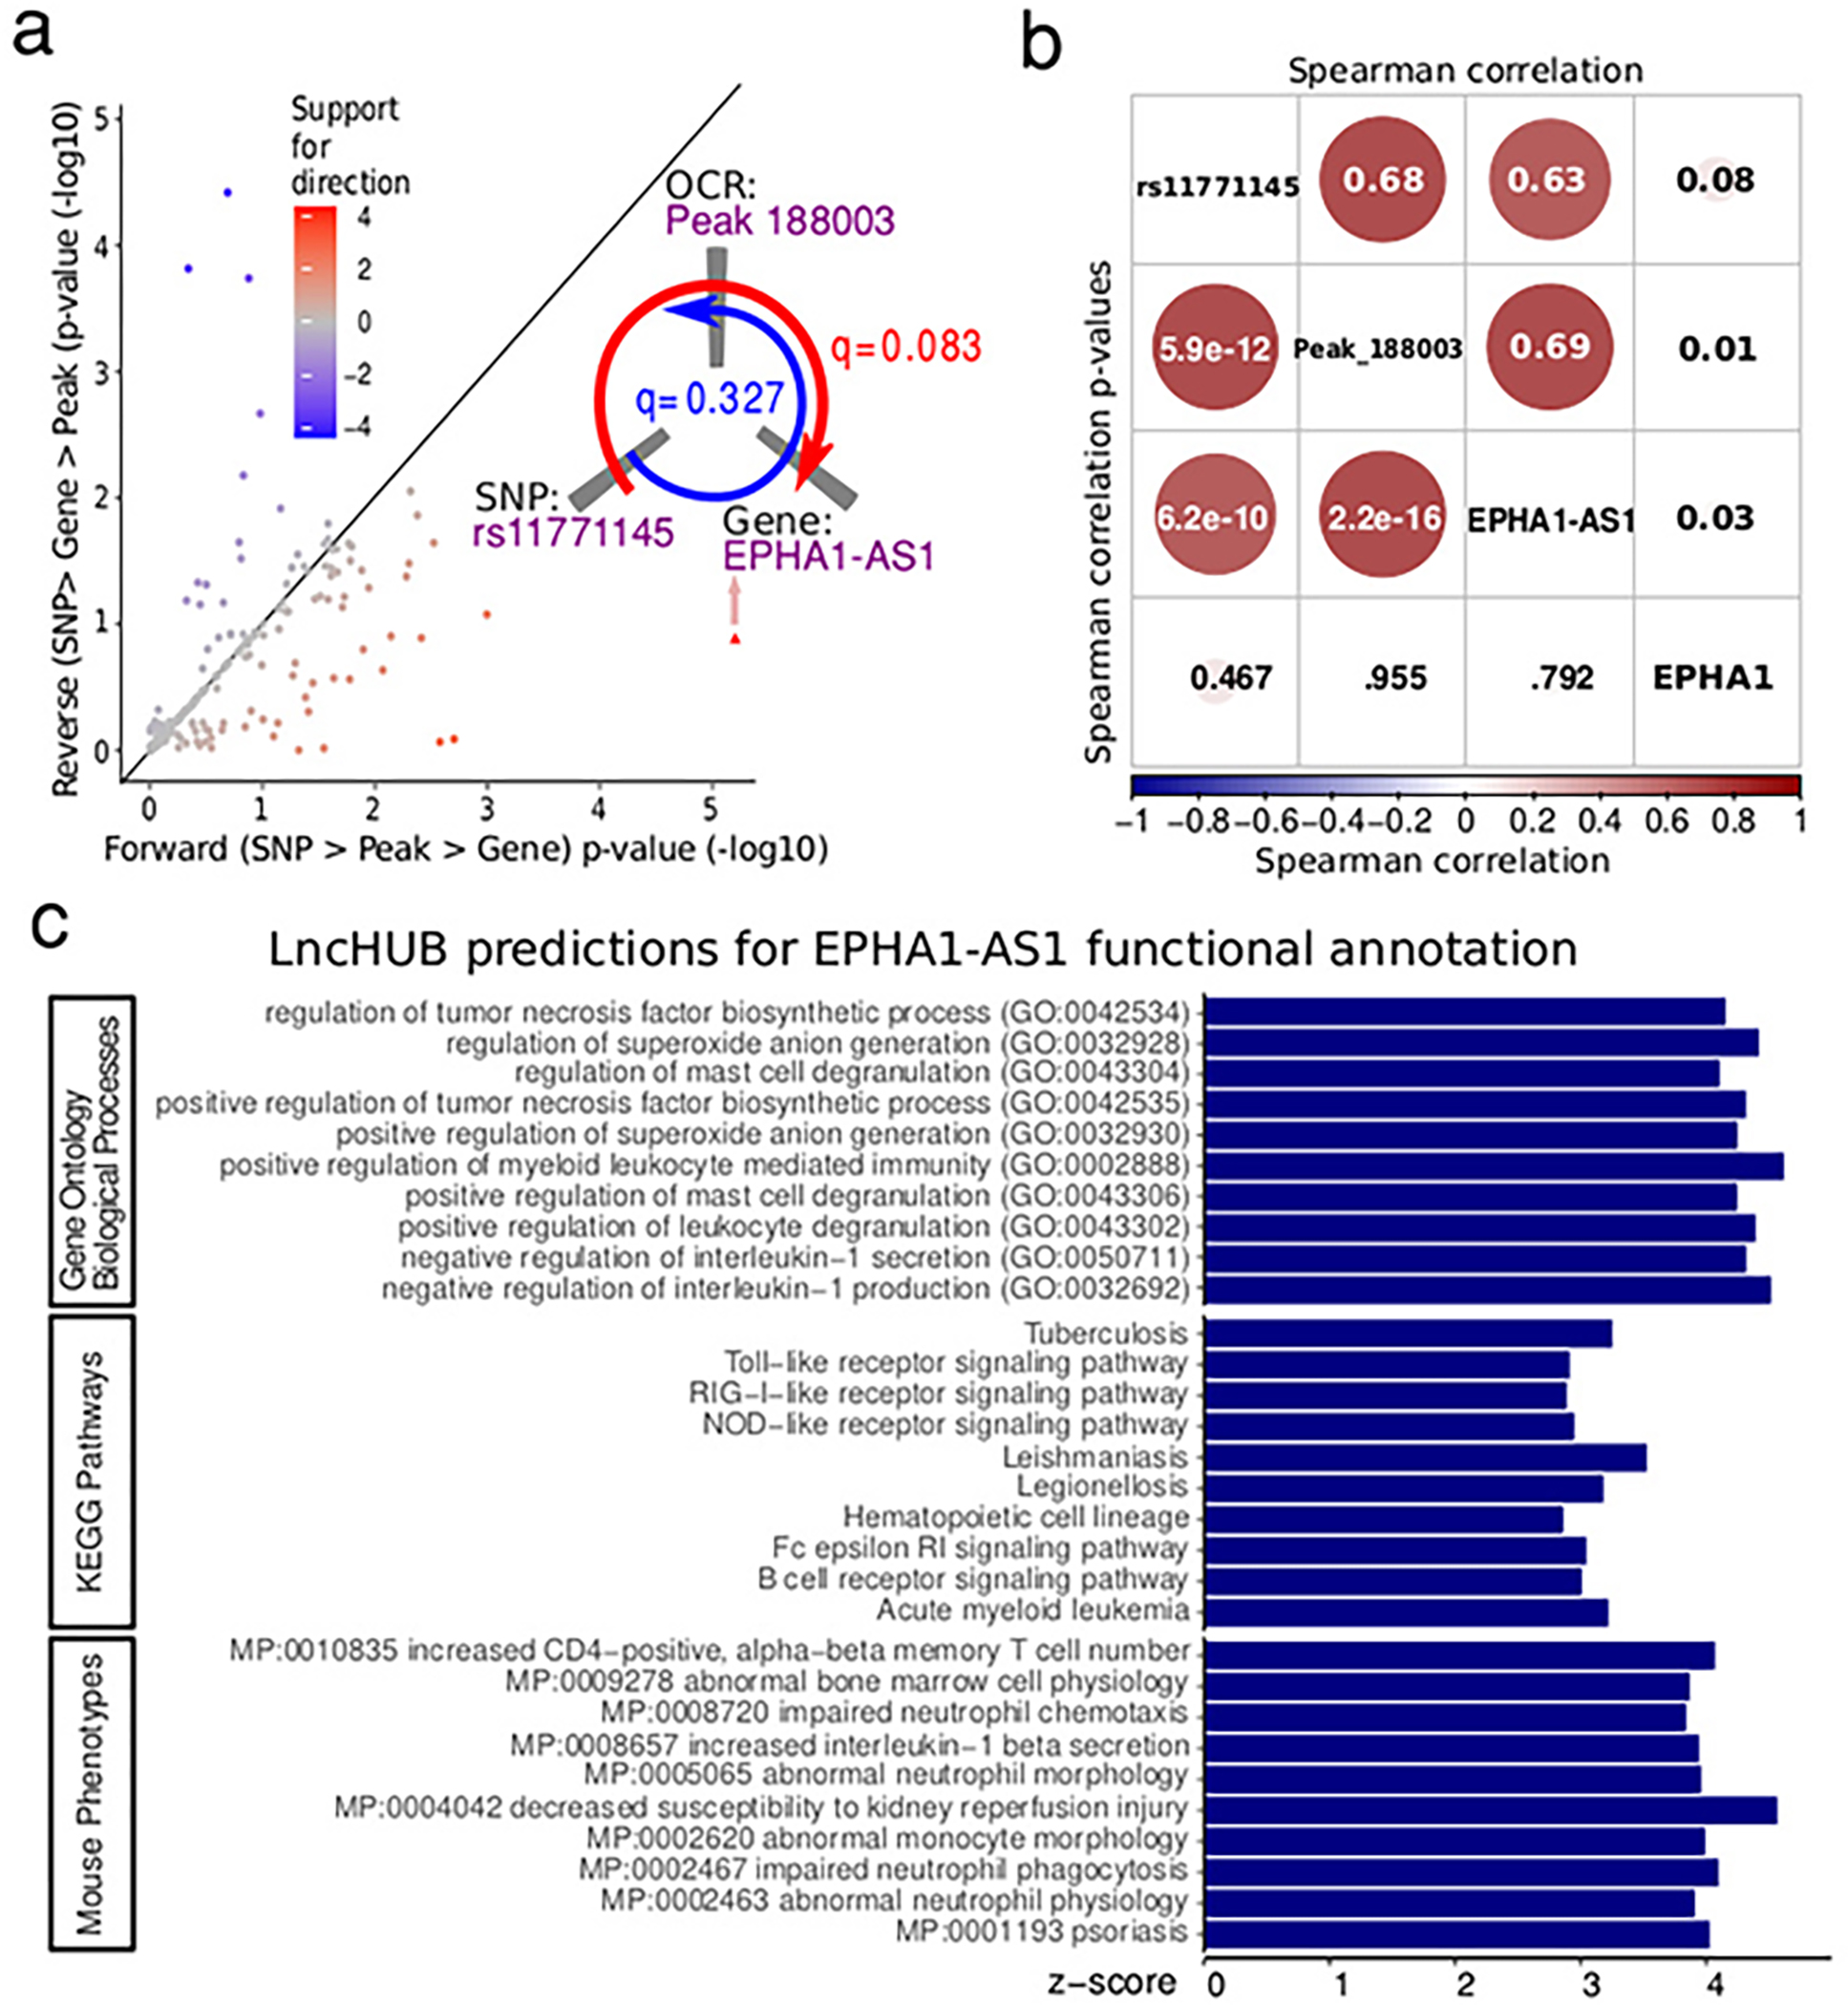
Relationship between EPHA1-AS1 expression, OCR peak_188003 and rs11771145. a) Application of Causal Inference Test 48 identifies a genetic variant’s regulation on transcriptional activity of AD-implicated genes mediated by its effect on chromatin accessibility (one-sided Omnibus F-statistics) b) Correlation between the expression of EPHA1 and EPHA1-AS1, ATAC-seq signal at OCR peak_188003 and the genotype of rs11771145 (two-sided Spearman test). c) Predicted function of EPHA1-AS1 based on coexpression structure. lncHUB 31 predicts gene set annotations of every gene based on genome-wide co-expression structure and known annotations. Results are from query https://maayanlab.cloud/lnchub/?lnc=EPHA1-AS1.
Extended Data Fig. 8. Local manhattan plot of AD GWAS 13, and eQTL analysis for FIBP.
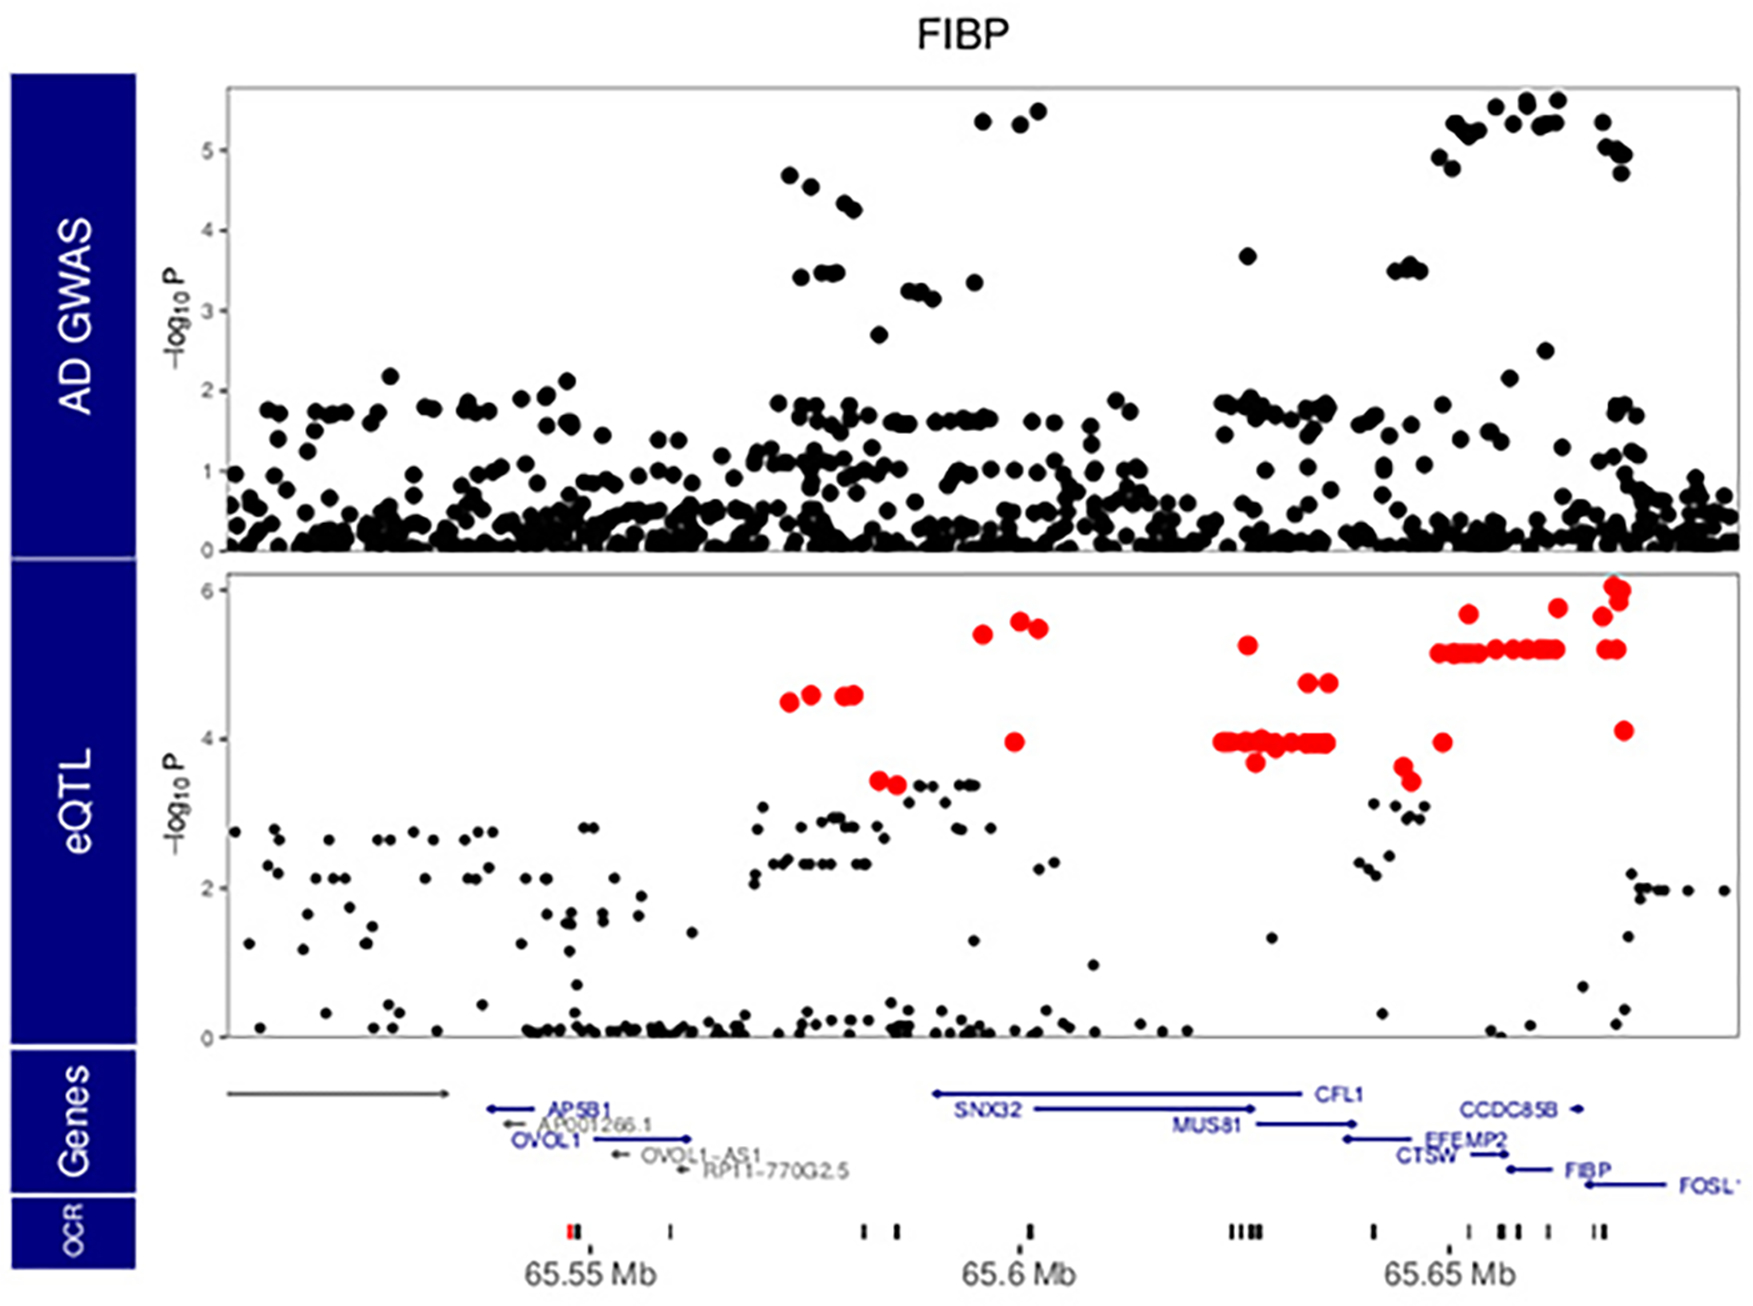
Red points indicate variants within the 95% confidence interval from statistical fine-mapping. P values are nominal significance estimates from two-sided logistic regression for GWAS, and mixed linear regression for QTL analyses
Extended Data Fig. 9. Local manhattan plot of AD GWAS 13, and eQTL analysis for LRRC25.
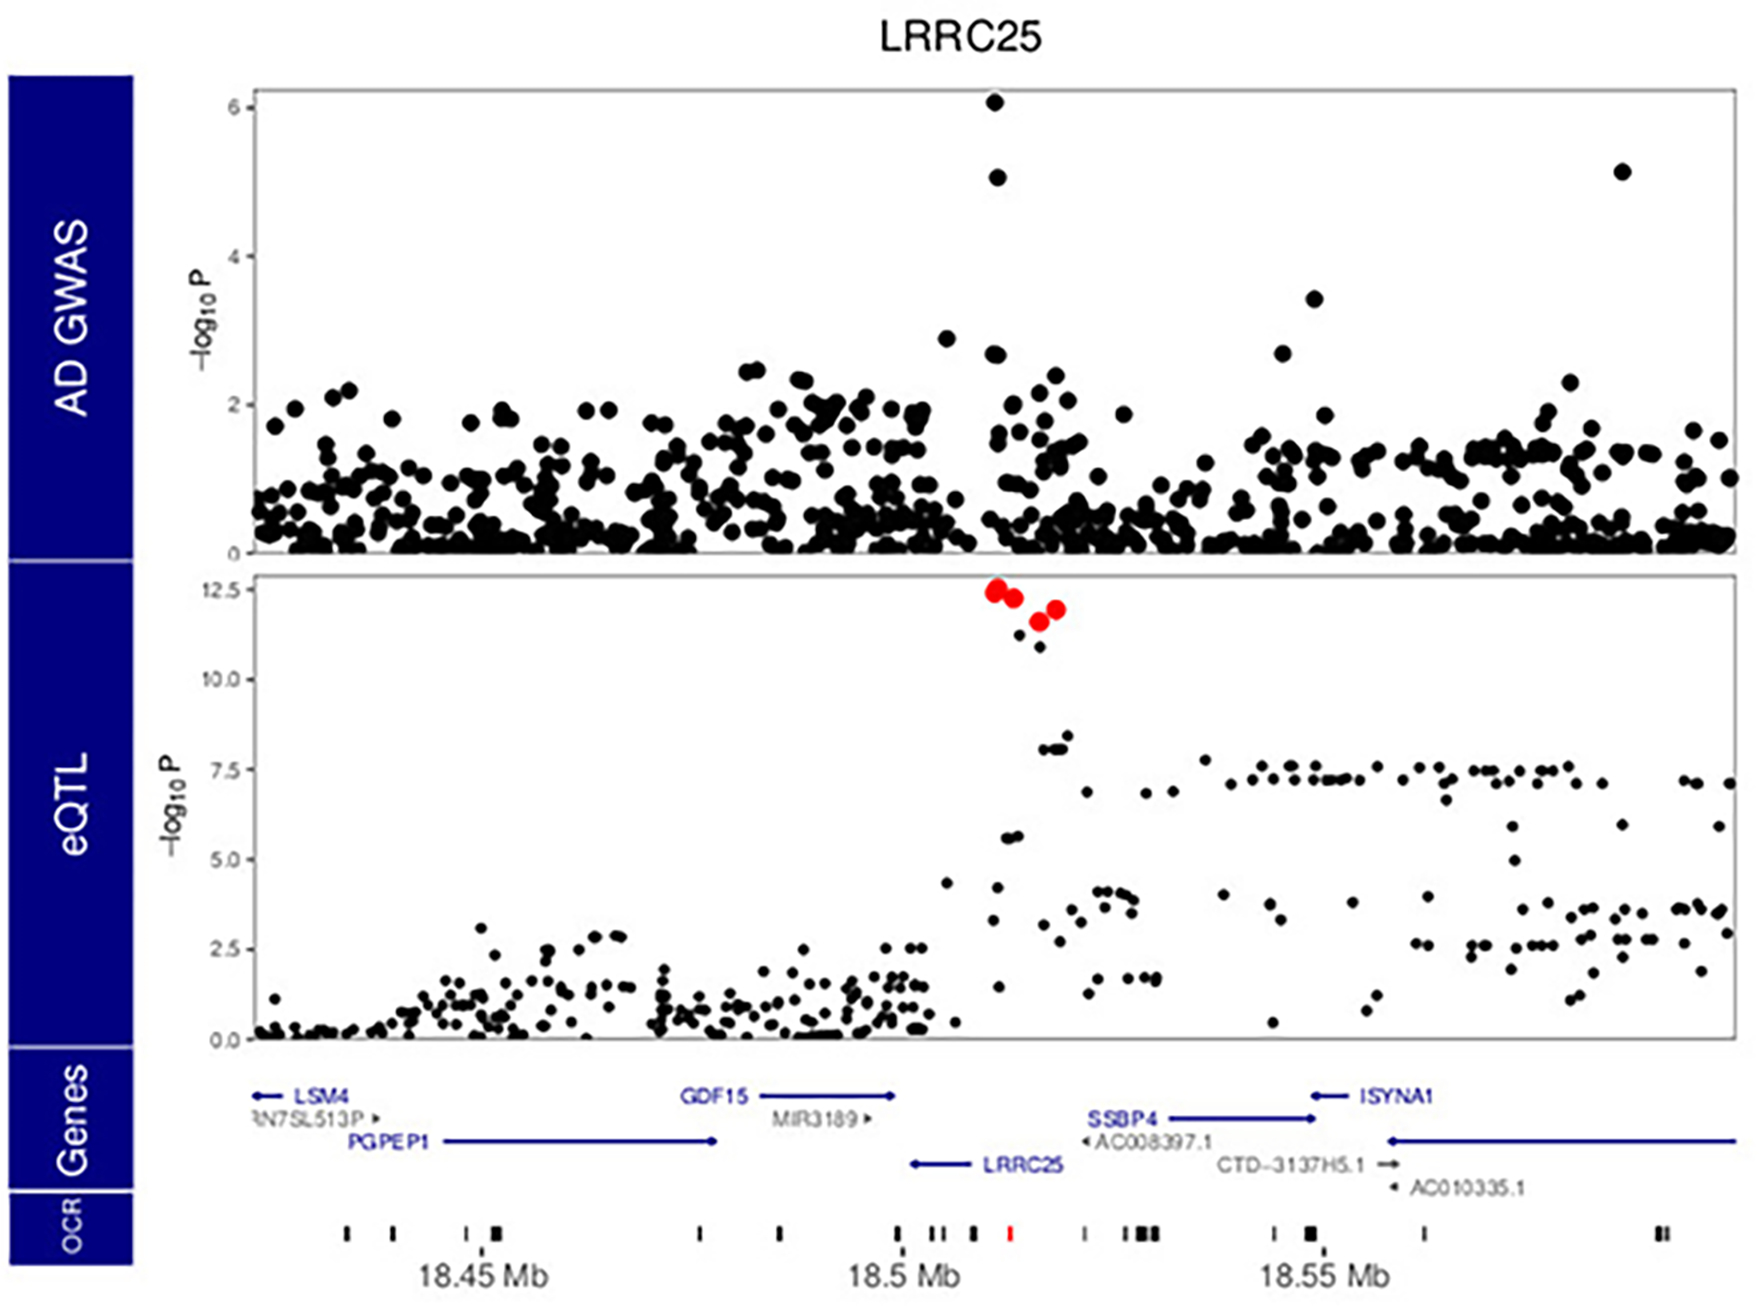
Red points indicate variants within the 95% confidence interval from statistical fine-mapping. P values are nominal significance estimates from two-sided logistic regression for GWAS, and mixed linear regression for QTL analyses.
Extended Data Fig. 10. Local manhattan plot of AD GWAS 13, eQTL analysis for KCNN4 and caQTL for Peak_82668.
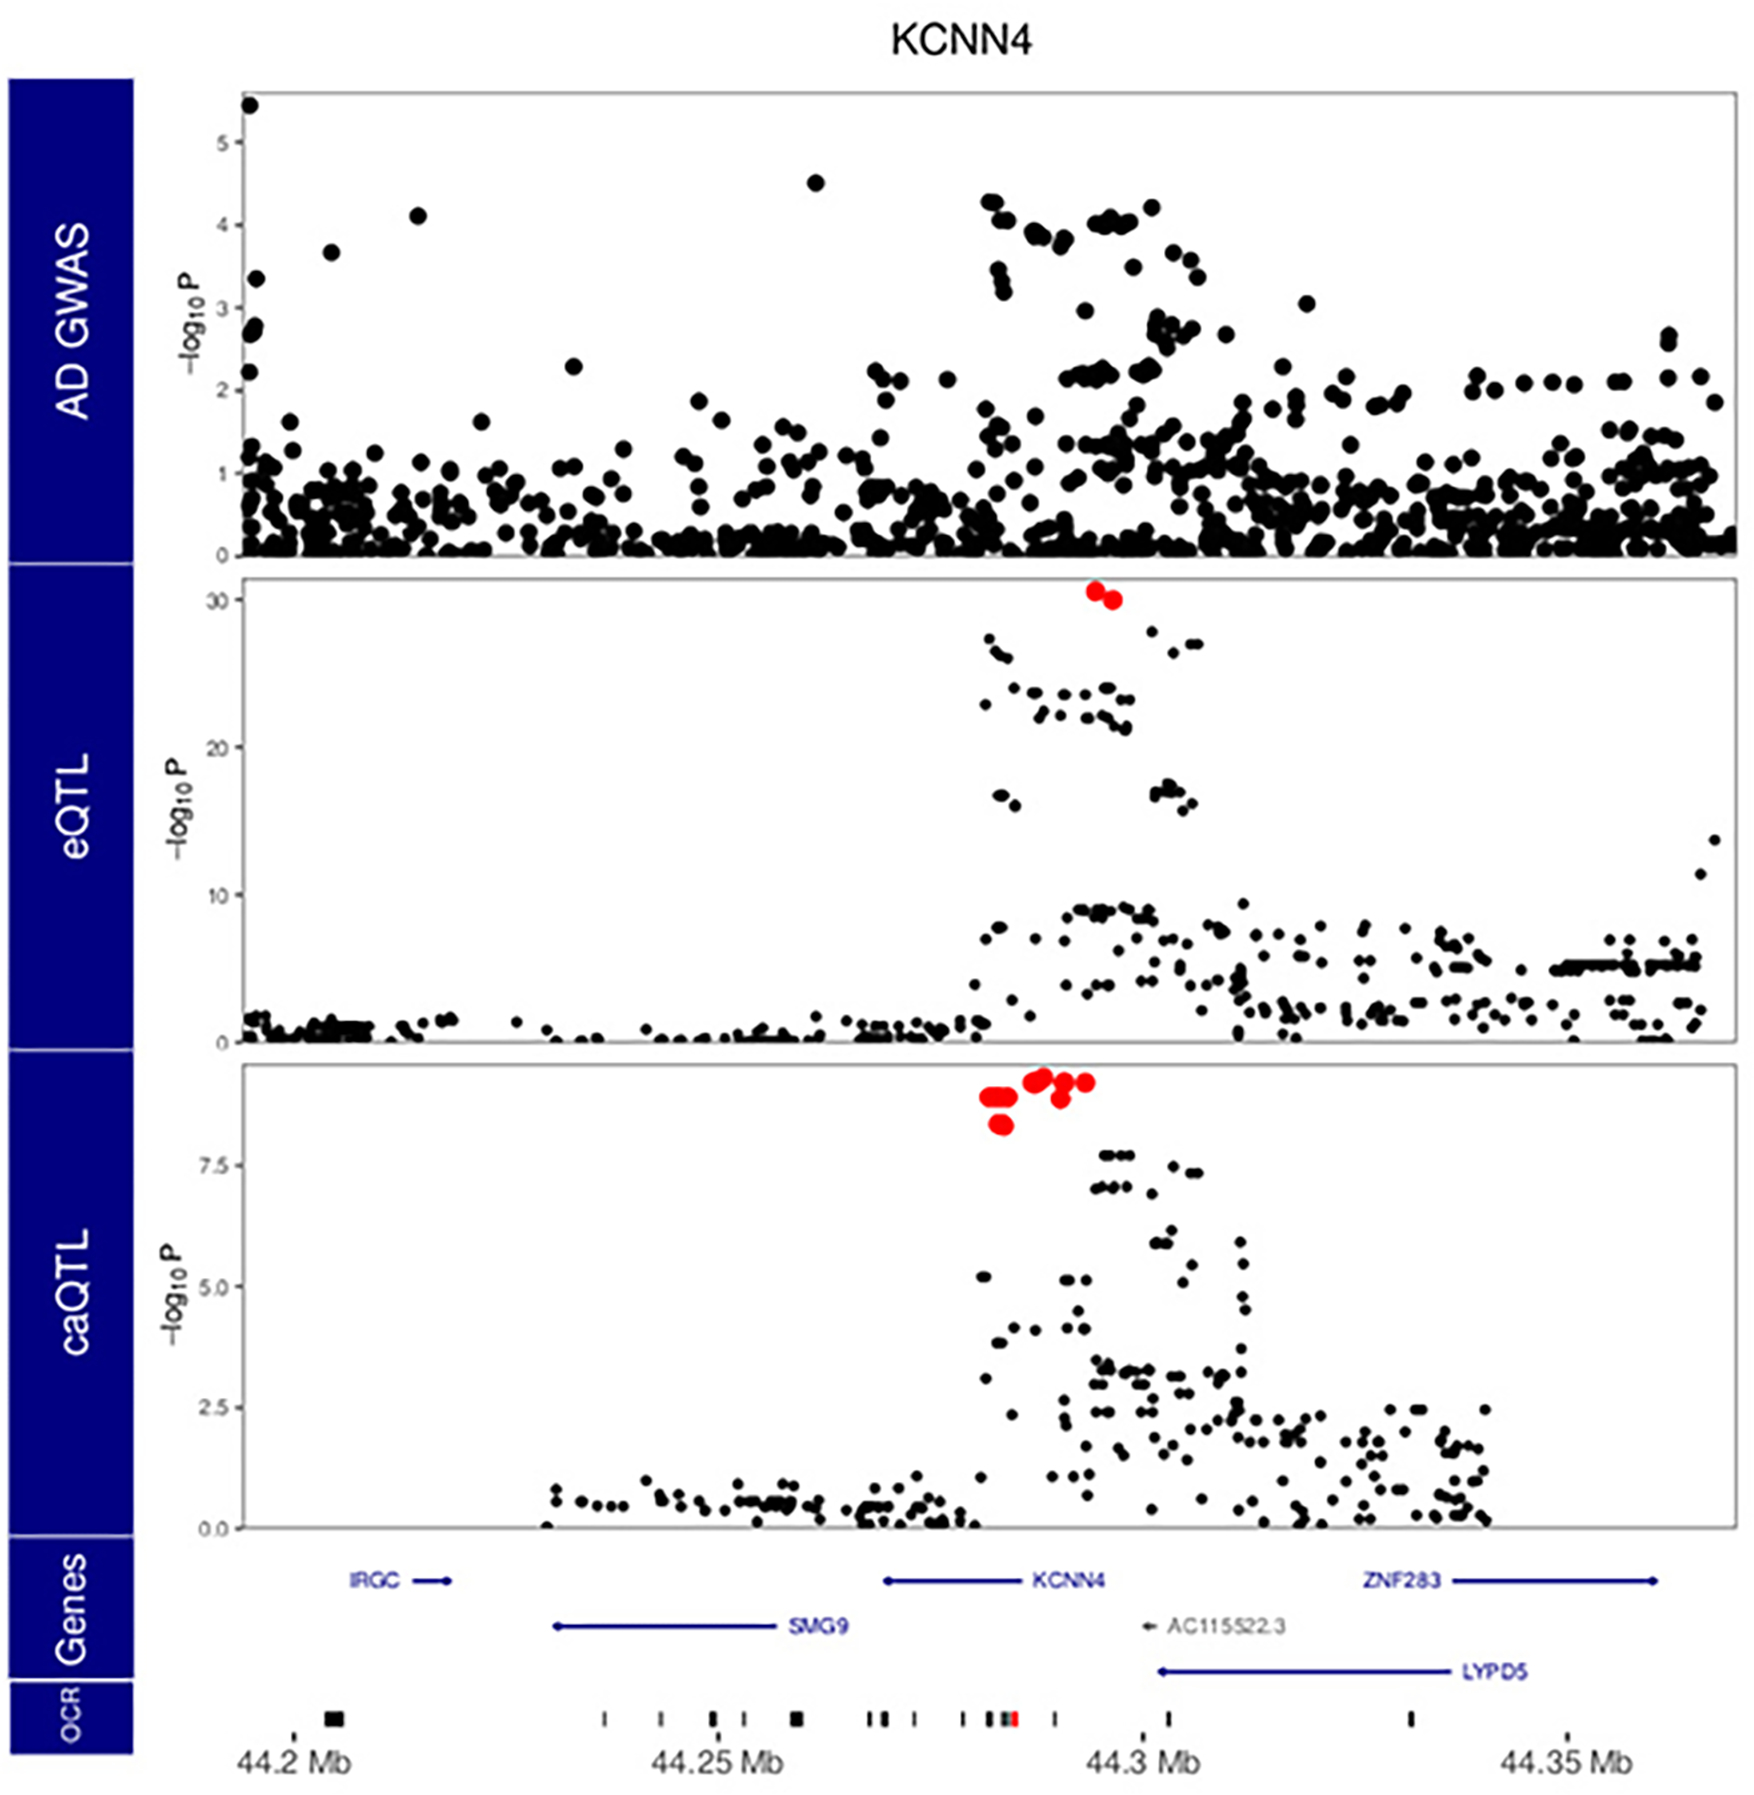
Bottom row indicates open chromatin regions in the window, and the red region indicates the target peak for caQTL analysis shown. Red points indicate variants within the 95% confidence interval from statistical fine-mapping. P values are nominal significance estimates from two-sided logistic regression for GWAS, and mixed linear regression for QTL analyses
Supplementary Material
Acknowledgments:
We thank the patients and families who donated material for these studies. We thank the computational resources and staff expertise provided by the Scientific Computing group at the Icahn School of Medicine at Mount Sinai.
Funding:
Supported by the National Institute on Aging, NIH grants R01-AG050986 (to P.R.), R01-AG067025 (to P.R. and V.H.) and R01-AG065582 (to P.R. and V.H.). J.B. was supported in part by Alzheimer’s Association Research Fellowship AARF-21-722200. P.D. is partially supported by a NARSAD Young Investigator Grant from the Brain and Behavior Research Foundation (BBRF).
Footnotes
Competing interests: The authors declare no competing interests.
Peer review Information:
Nature Genetics thanks Inge Holtman, Jeremy Schwartzentruber, and the other, anonymous, reviewer(s) for their contribution to the peer review of this work.
Bibliography
- 1.Salter MW & Stevens B Microglia emerge as central players in brain disease. Nat. Med. 23, 1018–1027 (2017). [DOI] [PubMed] [Google Scholar]
- 2.Bartels T, De Schepper S & Hong S Microglia modulate neurodegeneration in Alzheimer’s and Parkinson’s diseases. Science 370, 66–69 (2020). [DOI] [PubMed] [Google Scholar]
- 3.Song WM & Colonna M The identity and function of microglia in neurodegeneration. Nat. Immunol. 19, 1048–1058 (2018). [DOI] [PubMed] [Google Scholar]
- 4.Nott A et al. Brain cell type-specific enhancer-promoter interactome maps and disease-risk association. Science 366, 1134–1139 (2019). [DOI] [PMC free article] [PubMed] [Google Scholar]
- 5.Hauberg ME et al. Common schizophrenia risk variants are enriched in open chromatin regions of human glutamatergic neurons. Nat. Commun. 11, 5581 (2020). [DOI] [PMC free article] [PubMed] [Google Scholar]
- 6.Corces MR et al. Single-cell epigenomic analyses implicate candidate causal variants at inherited risk loci for Alzheimer’s and Parkinson’s diseases. Nat. Genet. 52, 1158–1168 (2020). [DOI] [PMC free article] [PubMed] [Google Scholar]
- 7.Young AMH et al. A map of transcriptional heterogeneity and regulatory variation in human microglia. Nat. Genet. 53, 861–868 (2021). [DOI] [PMC free article] [PubMed] [Google Scholar]
- 8.Lopes K de P. et al. Genetic analysis of the human microglial transcriptome across brain regions, aging and disease pathologies. Nat. Genet. 54, 4–17 (2022). [DOI] [PMC free article] [PubMed] [Google Scholar]
- 9.Gosselin D et al. An environment-dependent transcriptional network specifies human microglia identity. Science 356, (2017). [DOI] [PMC free article] [PubMed] [Google Scholar]
- 10.Novikova G et al. Integration of Alzheimer’s disease genetics and myeloid genomics identifies disease risk regulatory elements and genes. Nat. Commun. 12, 1610 (2021). [DOI] [PMC free article] [PubMed] [Google Scholar]
- 11.Morabito S et al. Single-nucleus chromatin accessibility and transcriptomic characterization of Alzheimer’s disease. Nat. Genet. 53, 1143–1155 (2021). [DOI] [PMC free article] [PubMed] [Google Scholar]
- 12.Liu X et al. Functional architectures of local and distal regulation of gene expression in multiple human tissues. Am. J. Hum. Genet. 100, 605–616 (2017). [DOI] [PMC free article] [PubMed] [Google Scholar]
- 13.Jansen IE et al. Genome-wide meta-analysis identifies new loci and functional pathways influencing Alzheimer’s disease risk. Nat. Genet. 51, 404–413 (2019). [DOI] [PMC free article] [PubMed] [Google Scholar]
- 14.Fulco CP et al. Activity-by-contact model of enhancer-promoter regulation from thousands of CRISPR perturbations. Nat. Genet. 51, 1664–1669 (2019). [DOI] [PMC free article] [PubMed] [Google Scholar]
- 15.Bendl J et al. The three-dimensional landscape of chromatin accessibility in Alzheimer’s disease. BioRxiv (2021) doi: 10.1101/2021.01.11.426303. [DOI] [PMC free article] [PubMed] [Google Scholar]
- 16.Nasser J et al. Genome-wide enhancer maps link risk variants to disease genes. Nature 593, 238–243 (2021). [DOI] [PMC free article] [PubMed] [Google Scholar]
- 17.Zeng B et al. Multi-ancestry eQTL meta-analysis of human brain identifies candidate causal variants for brain-related traits. Nat. Genet. 54, 161–169 (2022). [DOI] [PMC free article] [PubMed] [Google Scholar]
- 18.Alasoo K et al. Shared genetic effects on chromatin and gene expression indicate a role for enhancer priming in immune response. Nat. Genet. 50, 424–431 (2018). [DOI] [PMC free article] [PubMed] [Google Scholar]
- 19.Bryois J et al. Evaluation of chromatin accessibility in prefrontal cortex of individuals with schizophrenia. Nat. Commun. 9, 3121 (2018). [DOI] [PMC free article] [PubMed] [Google Scholar]
- 20.Han B & Eskin E Interpreting meta-analyses of genome-wide association studies. PLoS Genet. 8, e1002555 (2012). [DOI] [PMC free article] [PubMed] [Google Scholar]
- 21.Hormozdiari F, Kostem E, Kang EY, Pasaniuc B & Eskin E Identifying causal variants at loci with multiple signals of association. Genetics 198, 497–508 (2014). [DOI] [PMC free article] [PubMed] [Google Scholar]
- 22.Kim-Hellmuth S et al. Cell type-specific genetic regulation of gene expression across human tissues. Science 369, (2020). [DOI] [PMC free article] [PubMed] [Google Scholar]
- 23.Zhou J & Troyanskaya OG Predicting effects of noncoding variants with deep learning-based sequence model. Nat. Methods 12, 931–934 (2015). [DOI] [PMC free article] [PubMed] [Google Scholar]
- 24.Zhou J et al. Deep learning sequence-based ab initio prediction of variant effects on expression and disease risk. Nat. Genet. 50, 1171–1179 (2018). [DOI] [PMC free article] [PubMed] [Google Scholar]
- 25.Bentsen M et al. ATAC-seq footprinting unravels kinetics of transcription factor binding during zygotic genome activation. Nat. Commun. 11, 4267 (2020). [DOI] [PMC free article] [PubMed] [Google Scholar]
- 26.Huang K-L et al. A common haplotype lowers PU.1 expression in myeloid cells and delays onset of Alzheimer’s disease. Nat. Neurosci. 20, 1052–1061 (2017). [DOI] [PMC free article] [PubMed] [Google Scholar]
- 27.Giambartolomei C et al. Bayesian test for colocalisation between pairs of genetic association studies using summary statistics. PLoS Genet. 10, e1004383 (2014). [DOI] [PMC free article] [PubMed] [Google Scholar]
- 28.Giambartolomei C et al. A Bayesian framework for multiple trait colocalization from summary association statistics. Bioinformatics 34, 2538–2545 (2018). [DOI] [PMC free article] [PubMed] [Google Scholar]
- 29.Xiao Q et al. Role of phosphatidylinositol clathrin assembly lymphoid-myeloid leukemia (PICALM) in intracellular amyloid precursor protein (APP) processing and amyloid plaque pathogenesis. J. Biol. Chem. 287, 21279–21289 (2012). [DOI] [PMC free article] [PubMed] [Google Scholar]
- 30.Lachmann A et al. Geneshot: search engine for ranking genes from arbitrary text queries. Nucleic Acids Res. 47, W571–W577 (2019). [DOI] [PMC free article] [PubMed] [Google Scholar]
- 31.Yi M et al. KCa3.1 constitutes a pharmacological target for astrogliosis associated with Alzheimer’s disease. Mol. Cell. Neurosci. 76, 21–32 (2016). [DOI] [PMC free article] [PubMed] [Google Scholar]
- 32.Jin L-W et al. Repurposing the KCa3.1 inhibitor senicapoc for Alzheimer’s disease. Ann. Clin. Transl. Neurol. 6, 723–738 (2019). [DOI] [PMC free article] [PubMed] [Google Scholar]
- 33.Rahman MR et al. Network-based approach to identify molecular signatures and therapeutic agents in Alzheimer’s disease. Comput. Biol. Chem. 78, 431–439 (2019). [DOI] [PubMed] [Google Scholar]
- 34.Acquaah-Mensah GK & Taylor RC Brain in situ hybridization maps as a source for reverse-engineering transcriptional regulatory networks: Alzheimer’s disease insights. Gene 586, 77–86 (2016). [DOI] [PubMed] [Google Scholar]
- 35.Xu J et al. IL-4/STAT6 signaling facilitates innate hematoma resolution and neurological recovery after hemorrhagic stroke in mice. Proc Natl Acad Sci USA 117, 32679–32690 (2020). [DOI] [PMC free article] [PubMed] [Google Scholar]
- 36.Frakes AE et al. Microglia induce motor neuron death via the classical NF-κB pathway in amyotrophic lateral sclerosis. Neuron 81, 1009–1023 (2014). [DOI] [PMC free article] [PubMed] [Google Scholar]
- 37.Lavin Y et al. Tissue-resident macrophage enhancer landscapes are shaped by the local microenvironment. Cell 159, 1312–1326 (2014). [DOI] [PMC free article] [PubMed] [Google Scholar]
- 38.Reyna MA, Leiserson MDM & Raphael BJ Hierarchical HotNet: identifying hierarchies of altered subnetworks. Bioinformatics 34, i972–i980 (2018). [DOI] [PMC free article] [PubMed] [Google Scholar]
- 39.Schwartzentruber J et al. Genome-wide meta-analysis, fine-mapping and integrative prioritization implicate new Alzheimer’s disease risk genes. Nat. Genet. 53, 392–402 (2021). [DOI] [PMC free article] [PubMed] [Google Scholar]
- 40.Bellenguez C et al. New insights into the genetic etiology of Alzheimer’s disease and related dementias. Nat. Genet. 54, 412–436 (2022). [DOI] [PMC free article] [PubMed] [Google Scholar]
- 41.Lambert JC et al. Meta-analysis of 74,046 individuals identifies 11 new susceptibility loci for Alzheimer’s disease. Nat. Genet. 45, 1452–1458 (2013). [DOI] [PMC free article] [PubMed] [Google Scholar]
- 42.Du Y et al. LRRC25 inhibits type I IFN signaling by targeting ISG15-associated RIG-I for autophagic degradation. EMBO J. 37, 351–366 (2018). [DOI] [PMC free article] [PubMed] [Google Scholar]
- 43.Lee M et al. Acidic fibroblast growth factor (FGF) potentiates glial-mediated neurotoxicity by activating FGFR2 IIIb protein. J. Biol. Chem. 286, 41230–41245 (2011). [DOI] [PMC free article] [PubMed] [Google Scholar]
- 44.Pimenova AA et al. Alzheimer’s-associated PU.1 expression levels regulate microglial inflammatory response. Neurobiol. Dis. 148, 105217 (2021). [DOI] [PMC free article] [PubMed] [Google Scholar]
- 45.Marioni RE et al. GWAS on family history of Alzheimer’s disease. Transl. Psychiatry 8, 99 (2018). [DOI] [PMC free article] [PubMed] [Google Scholar]
- 46.Wang M et al. The Mount Sinai cohort of large-scale genomic, transcriptomic and proteomic data in Alzheimer’s disease. Sci. Data 5, 180185 (2018). [DOI] [PMC free article] [PubMed] [Google Scholar]
- 47.Bennett DA, Schneider JA, Arvanitakis Z & Wilson RS Overview and findings from the religious orders study. Curr. Alzheimer Res. 9, 628–645 (2012). [DOI] [PMC free article] [PubMed] [Google Scholar]
- 48.Bennett DA et al. Overview and findings from the rush Memory and Aging Project. Curr. Alzheimer Res. 9, 646–663 (2012). [DOI] [PMC free article] [PubMed] [Google Scholar]
- 49.Buenrostro JD, Wu B, Chang HY & Greenleaf WJ ATAC-seq: a method for assaying chromatin accessibility genome-wide. Curr. Protoc. Mol. Biol. 109, 21.29.1–21.29.9 (2015). [DOI] [PMC free article] [PubMed] [Google Scholar]
- 50.Zhang Y et al. Model-based analysis of ChIP-Seq (MACS). Genome Biol. 9, R137 (2008). [DOI] [PMC free article] [PubMed] [Google Scholar]
- 51.Bolger AM, Lohse M & Usadel B Trimmomatic: a flexible trimmer for Illumina sequence data. Bioinformatics 30, 2114–2120 (2014). [DOI] [PMC free article] [PubMed] [Google Scholar]
- 52.Dobin A et al. STAR: ultrafast universal RNA-seq aligner. Bioinformatics 29, 15–21 (2013). [DOI] [PMC free article] [PubMed] [Google Scholar]
- 53.van de Geijn B, McVicker G, Gilad Y & Pritchard JK WASP: allele-specific software for robust molecular quantitative trait locus discovery. Nat. Methods 12, 1061–1063 (2015). [DOI] [PMC free article] [PubMed] [Google Scholar]
- 54.Li B & Dewey CN RSEM: accurate transcript quantification from RNA-Seq data with or without a reference genome. BMC Bioinformatics 12, 323 (2011). [DOI] [PMC free article] [PubMed] [Google Scholar]
- 55.Lachmann A et al. Massive mining of publicly available RNA-seq data from human and mouse. Nat. Commun. 9, 1366 (2018). [DOI] [PMC free article] [PubMed] [Google Scholar]
- 56.Rao SSP et al. A 3D map of the human genome at kilobase resolution reveals principles of chromatin looping. Cell 159, 1665–1680 (2014). [DOI] [PMC free article] [PubMed] [Google Scholar]
- 57.Servant N et al. HiC-Pro: an optimized and flexible pipeline for Hi-C data processing. Genome Biol. 16, 259 (2015). [DOI] [PMC free article] [PubMed] [Google Scholar]
- 58.Imakaev M et al. Iterative correction of Hi-C data reveals hallmarks of chromosome organization. Nat. Methods 9, 999–1003 (2012). [DOI] [PMC free article] [PubMed] [Google Scholar]
- 59.Weirauch MT et al. Determination and inference of eukaryotic transcription factor sequence specificity. Cell 158, 1431–1443 (2014). [DOI] [PMC free article] [PubMed] [Google Scholar]
- 60.de Leeuw CA, Mooij JM, Heskes T & Posthuma D MAGMA: generalized gene-set analysis of GWAS data. PLoS Comput. Biol. 11, e1004219 (2015). [DOI] [PMC free article] [PubMed] [Google Scholar]
- 61.Sidak Z Rectangular Confidence Regions for the Means of Multivariate Normal Distributions. J. Am. Stat. Assoc. 62, 626 (1967). [Google Scholar]
- 62.Yoshida H et al. The cis-Regulatory Atlas of the Mouse Immune System. Cell 176, 897–912.e20 (2019). [DOI] [PMC free article] [PubMed] [Google Scholar]
- 63.Anscombe FJ The Transformation of Poisson, Binomial and Negative-Binomial Data. Biometrika 35, 246–254 (1948). [Google Scholar]
- 64.Gilmour AR, Thompson R & Cullis BR Average information REML: an efficient algorithm for variance parameter estimation in linear mixed models. Biometrics 51, 1440 (1995). [Google Scholar]
- 65.Han B & Eskin E Random-effects model aimed at discovering associations in meta-analysis of genome-wide association studies. Am. J. Hum. Genet. 88, 586–598 (2011). [DOI] [PMC free article] [PubMed] [Google Scholar]
- 66.Hormozdiari F et al. Colocalization of GWAS and eQTL Signals Detects Target Genes. Am. J. Hum. Genet. 99, 1245–1260 (2016). [DOI] [PMC free article] [PubMed] [Google Scholar]
- 67.Coetzee SG, Coetzee GA & Hazelett DJ motifbreakR: an R/Bioconductor package for predicting variant effects at transcription factor binding sites. Bioinformatics 31, 3847–3849 (2015). [DOI] [PMC free article] [PubMed] [Google Scholar]
- 68.Finucane HK et al. Partitioning heritability by functional annotation using genome-wide association summary statistics. Nat. Genet. 47, 1228–1235 (2015). [DOI] [PMC free article] [PubMed] [Google Scholar]
- 69.International HapMap Consortium. The international hapmap project. Nature 426, 789–796 (2003). [DOI] [PubMed] [Google Scholar]
- 70.1000 Genomes Project Consortium et al. A global reference for human genetic variation. Nature 526, 68–74 (2015). [DOI] [PMC free article] [PubMed] [Google Scholar]
Associated Data
This section collects any data citations, data availability statements, or supplementary materials included in this article.