

Abstract
Purpose:
Dose escalation to dominant intraprostatic lesions (DILs) is a novel treatment strategy to improve the treatment outcome of prostate radiation therapy. Treatment planning requires accurate and fast delineation of the prostate and DILs. In this study, a 3D cascaded scoring convolutional neural network is proposed to automatically segment the prostate and DILs from MRI.
Methods and Materials:
The proposed cascaded scoring convolutional neural network performs end-to-end segmentation by locating a region-of-interest (ROI), identifying the object within the ROI, and defining the target. A scoring strategy, which is learned to judge the segmentation quality of DIL, is integrated into cascaded convolutional neural network to solve the challenge of segmenting the irregular shapes of the DIL. To evaluate the proposed method, 77 patients who underwent MRI and PET/CT were retrospectively investigated. The prostate and DIL ground truth contours were delineated by experienced radiologists. The proposed method was evaluated with five-fold cross validation and holdout testing.
Results:
The average centroid distance, volume difference, and Dice similarity coefficient (DSC) value for prostate/DIL are 4.3±7.5mm/3.73±3.78mm, 4.5±7.9cc/0.41±0.59cc and 89.6±8.9%/84.3±11.9%, respectively. Comparable results were obtained in the holdout test. Similar or superior segmentation outcomes were seen when compared the results of the proposed method to those of competing segmentation approaches
Conclusions:
The proposed automatic segmentation method can accurately and simultaneously segment both the prostate and DILs. The intended future use for this algorithm is focal boost prostate radiation therapy.
Keywords: MRI, Prostate and dominant lesion segmentation, Deep learning
INTRODUCTION
In current radiation therapy, prostate cancer is commonly treated with external beam radiotherapy or brachytherapy with a single prescribed dose level on the entire prostate gland. However, studies have shown that prostate cancer typically includes one or more dominant intraprostatic lesions (DILs).1 These are the largest and/or highest-grade cancer lesions and are responsible for the majority of the tumor burden. The DIL is also the most likely site of cancer recurrence after treatment with 89% of recurrences.2 To combat this, an elevated dose of radiation is proposed to be administered to the DIL in combination with a whole-prostate dose. This technique is referred to as a DIL “dose boost”.3,4
Due to the escalated dose level, accurate segmentation of the DIL becomes of great consequence for treatment outcomes. Currently, contouring DILs in radiotherapy planning is performed on CT images.5 Due to their poor soft tissue contrast, CT data is often inadequate for DIL delineation. To remedy this, PET scans are often employed in tandem with CT scans, increasing the visibility of targeted functional tumor compartments. However, PET images suffer from poor spatial resolution needed for the accurate contouring of DILs. Recently, MRI has shown promising ability in identifying DILs.6 Since MRI provides better soft-tissue contrast than CT and higher spatial resolution than PET,7 it has become the preferred imaging modality for DIL localization and delineation. Although the segmentation of the DIL and the prostate has been facilitated by the recently introduced MRI, it is still a physician manual task and therefore, still time-consuming, labor intensive, and prone to inter- and intra-observer uncertainty.
Computer aid in completion of these clinical tasks would promote efficiency through automatization and safety through standardization of contouring protocols. In the case of prostate MRI, the structures adjacent to the prostate such as blood vessels, organs, and calcifications have similar image contrast to DILs. Therefore, simple intensity-based image segmentation methods would be inefficient in distinguishing the specific DILs in MRI. To remedy this, convolutional neural networks (CNNs) have been employed to automate the segmentation task.8–11
In this study, we propose a novel deep learning-based method to automatically segment the prostate and DILs on MRI for DIL dose boost radiation therapy. This paper is a continuation of our previous conference paper.12 In the conference paper, a Mask R-CNN architecture with a feature pyramid network (FPN) backbone and weighted box clustering (WBC) was proposed to segment the prostate and DIL simultaneously. A score head was integrated into Mask R-CNN to better build a relationship between the classification of the DIL and its segmentation. All are still incorporated into the model and explained in detail in the method section. A total of 25 patients were evaluated in the previous conference paper as a preliminary result. Herein, we propose a different method to more effectively handle the challenges of this segmentation task. There were two major differences introduced in the updated algorithm. First, a cascaded network was introduced such that the detected region-of-interests (ROIs) of DILs can be located within the ROI of prostate. A major challenge of DIL segmentation arises from the DIL’s irregular shape. To solve this issue, a second major upgrade to the algorithm consisted in integrating a scoring strategy into the cascaded network that builds a relationship between DIL class and shape. The effect on the scoring strategy is explored with an ablation study whereby the performance of the model is determined without the scoring strategy in place. Furthermore, this work includes a more extensive patient database (44 for five-fold cross validation with an additional 33 for hold-out testing) and a direct comparison between the proposed method and other state-of-art methods (U-Net, nnU-Net and Mask R-CNN) with more comprehensive quantitative metrics. We also provide a more thorough introduction and discussion with more literature reviews.
METHODS
For a given MR image of the pelvis, the physician provided prostate and tumor contours were used as training targets. Figure 1 shows a schematic of the feed forward path employed in the proposed method to train and predict any given patient’s DILs and prostate contours. An exhaustive description of the proposed method’s architecture is provided in the supplementary document. The MR images were input into the scored network to segment both the prostate and DILs within predicted regions of interest (ROIs), called candidate ROIs. Afterwards, the segmentation maps were relocated and fused into an end-to-end segmentation process, namely equal sized semantic segmentation with the input MR image volume. The scored cascaded network consists of four subnetworks: a backbone, a regional proposal network (RPN),13 a regional convolutional neural network (RCNN),14 and mask and score heads.15 A residual feature pyramid networks (FPN) was adopted as the backbone to extract coarse feature maps from MR images. These features were used by the RPN to localize rough candidate prostate and DIL ROIs. Coarse feature maps were cropped based on ROI position and rescaled with aligned ROIs to form intermediary feature maps. Using the intermediary feature maps as input parameters, the RCNN predicted the class of the target (tumor, prostate, or background) and adjusted the indexing accordingly. The mask head was also applied to the intermediate feature maps to segment the candidate ROIs. The reliability scores of these segmentations were measured by the score head.
Figure 1.
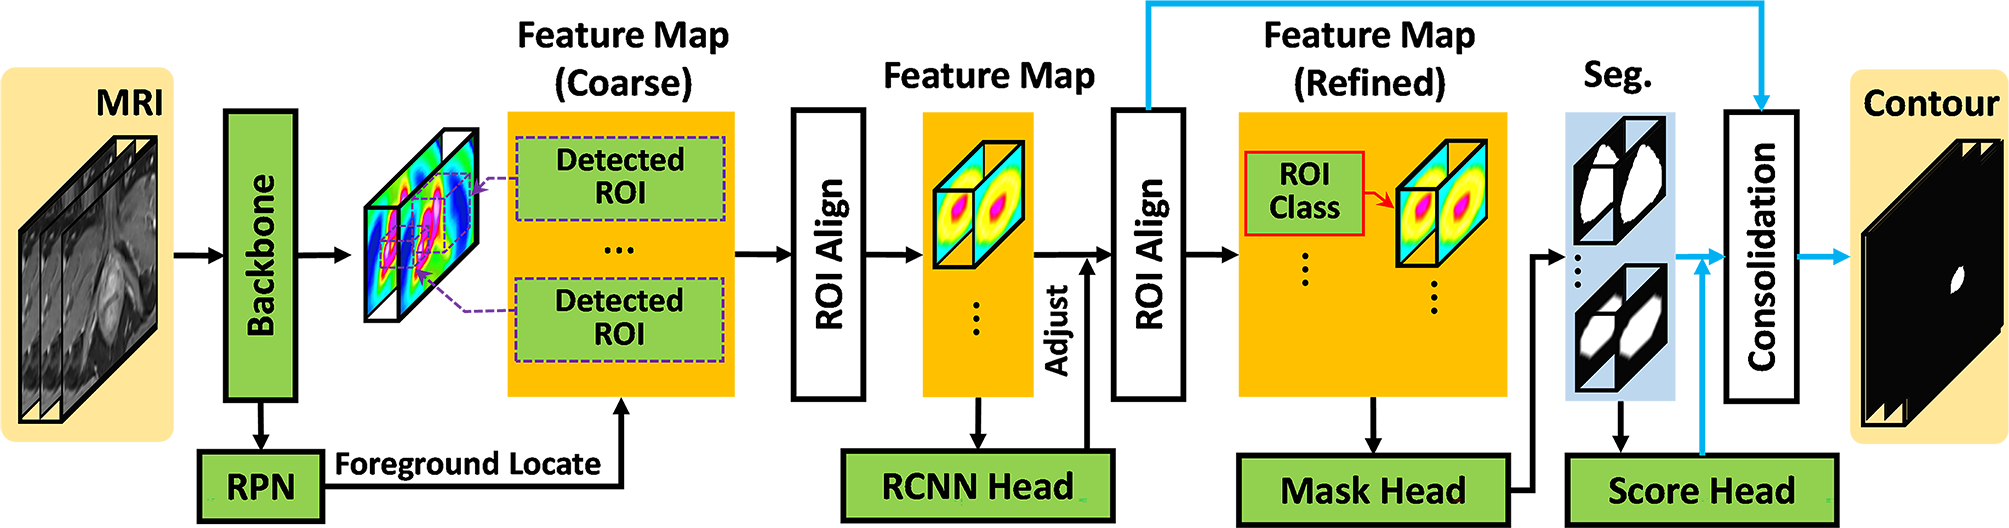
Schematic flow chart of the proposed algorithm. The black arrows denote the feed forward paths during both training and inference stages. The blue arrows denote the feed forward paths during inference stage.
Once the model was trained, a series of binary masks within the detected ROIs were obtained by feeding a new patient’s MR image into the trained cascaded scoring convolutional neural network model. The final segmentation (the consolidation step) was obtained by tracing these binary masks back to the original image coordinate system with the ROIs’ respective labels, positions and coordinate reliability scores.
2.A. Backbone
The Residual Feature Pyramid Network16 was used as the backbone. A fundamental difficulty in computer vision tasks is being able to identify both large and small objects with high fidelity. This is especially true in prostate and DIL segmentation where the prostate can be over 100 cubic centimeters (cc) and the DIL smaller than 1 cc. To solve this issue, the FPN efficiently creates gradually coarser feature maps that correspond to larger structures in the image. These increasing length scales create a “pyramid” of feature maps. In this study the FPN consists of two primary pathways: the encoding path and the decoding path. The encoding pathway is constructed with a series of convolutional operations that compute high resolution but semantically weak hierarchical feature maps at increasing length scales. The decoding pathway takes the most course feature map from the encoding pathway and hallucinates higher resolution feature maps through a series of deconvolutions. These feature maps are lower resolution but semantically stronger than those from the encoding pathway. The feature maps in the decoding pathway were then enhanced by lateral connections to feature maps of the same spatial resolution in the encoding pathway. Therefore, the final results contain high resolution, semantically strong extracted features.
2.B. RPN and RCNN
RCNN was originally proposed as an effective object localization tool in computer vision in which convolutional networks were applied independently on each ROI.17 The RPN was first introduced in Faster RCNN, a fully convolutional network capable of predicting object bounds and objectness scores at each position simultaneously. As a key part of the proposed method, this allows for significant processing time gains.18 In our network, the RPN was designed to predict candidate ROIs which gave details about object class and location from existing feature maps. RCNN was implemented to further adjust the locations and classes of the candidate ROIs. This is achieved by receiving anchors (rectangles with varying dimensions) as input and predicting the probability of the anchors containing an object. Those above a probability threshold become ROIs. If multiple detected ROIs have a considerable overlap, they are culled to minimize ROI redundancy. This culling technique is called non-maximum suppression (NMS), and it is effective for conserving computational power, especially in images with large amounts of data such as MR datasets. As a result of ROI pooling in the CNNs, the feature maps can be substantially smaller than the original image (without padding). In order to be usable, the resulting ROIs from the RPN must be scaled up to match the image voxel grid. This is done using bicubic interpolation in the “ROI align” module. This technique is information conserving even in the cases where feature maps cannot be scaled up with an integer value (e.g., 11×11 grid onto a 100×100 grid). ROI align improves accuracy by 10 to 50% compared to techniques that do not preserve the exact spatial location of the ROI.19 Sigmoid cross entropy20 was applied for the loss functions of both the RPN and RCNN subnetworks.
2.C. Mask head and score head
The mask head consisted of convolutional layers with a stride size of 1×1×1 and a softmax layer. Binary masks were obtained from refined feature maps by the RCNN. In order to build a direct correlation (reliability score) of the mask quality and the classification label, the score head21 was constructed with convolutional layers of stride size 2×2×2. Next, the binary masks and the refined feature maps were input into the fully connected and sigmoid layers to predict the mask score (Smask). The ideal Smask equals the intersection over union (IoU) between the segmented binary mask and its corresponding ground truth mask. In multiple structure segmentation, a one-to-one relationship between each object of interest and its mask must be built. Therefore, the ideal Smask should have positive values only for the ground truth category and should be zero for other classes. The mask score needs to work well on two tasks: classifying the mask to a proper category and regressing the proposal’s Smask for the foreground object category. However, it is generally difficult to address both tasks using only a single objective function. For simplicity, the mask score learning task could be decomposed into mask classification and IoU regression. Smask = Scls∙SIoU. Scls denotes the classifying mask, while SIoU focuses on regression. Here, Scls was obtained by directly taking the classification score from RCNN. SIoU was predicted by the score head. The feature maps from RCNN and the segmented binary masks from the mask head were concatenated as the input of the score head. The output of the score head was a vector whose length equals the number of classes. In the training, segmentation loss, which is a combination of Dice loss and binary cross entropy loss,22 was used to supervise the head. The L1-norm difference between the estimated score (Fig.2) and IoU score between the classification Ci and ground truth class was used to supervise the mask scoring head.
Figure 2.

Manual (red) vs segmented (green dashed) prostate and DIL of axial MRI. From left to right are the prostate manual and segmented contours overlaid on MRI, and two DIL manual and segmented contours overlaid on MRI. The upper and bottom rows are from two representative patients.
2.D. Consolidation
The results from Mask-R CNN can further be improved with consolidation. While the RPN eliminates many duplicate ROIs, many still persist due to tiling and data augmentation methods. Since MR images are extremely large, the entire image datasets cannot be processed at one time due to GPU constraints. To process these large MR images, they must be broken up into patches. These patches overlap to prevent artifacts at the patch boundaries. Unfortunately, this overlap also leads the NMS algorithm to make multiple predictions for the same object of interest. Therefore these predictions are consolidated based on weighted box clustering method (WBC) introduced by Jaeger et al.23. WBC obtains the final output by averaging every voxel over all predictions, according to their IoU score ranking and threshold value. Instead of selecting the ROI with the highest Smask value in the cluster, the weighted average oc per coordinate and the weighted confidence score os per resulting ROI were calculated. os was down-weighted for candidate ROIs which were not included in the cluster (nmissing) based on factors such as test time augmentation, patch overlapping, and the number of candidate ROIs. This resulted in a final formulation of predicted confidence scores:
| (1) |
| (2) |
where s and c are the confidence score and coordinates, i is the index of the cluster member, and w is the weighting factor. w can be written as w = f∙a∙p. f is defined by as the ratio of overlap between a given candidate ROI and the highest scoring ROI in the cluster. The area a assigns higher weights to larger ROIs. Since most of the image context is in the patch center, p down-weights ROIs that are farther from the center. Scores were assigned according to the Gaussian density centered at the patch center.
2.E. Datasets
We retrospectively investigated 77 prostate cancer patients selected from Emory Clinic who underwent MRI for prostate cancer. Institutional review board approval was obtained and informed consent was not required for this Health Insurance Portability and Accountability Act (HIPPA)-compliant retrospective analysis. Each patient was scanned by Siemens Aera MRI scanner (Siemens Healthineers, Germany). The T1-weighted MR images were acquired with spoiled gradient recalled echo, and the image volume was resampled to 0.976 × 0.976 × 3.75 mm. The prostate and DIL of all 77 patients were manually contoured on MRI by a radiologist (4-year experience) and confirmed with a side-by-side view of PET/CT of each patient and were reviewed and modified by a second radiologist (more than 10-year experience). These consensus contours were used as the ground truth contours in this study.
2.F. Validation and evaluation
The data set was subjected to test time augmentation (TTA) to increase to data set size and improve the performance of the model. The program was performed on a NVIDIA Tesla V100 GPU with 32 GB of memory. Center cropping and padding were used to maintain a 512×512×256 voxel input. An Adam gradient optimizer with a learning rate of 2e-4 was set to optimize the learnable parameters over 200 epochs. For each iteration of one epoch, 20 patches were used for each batch.
Accuracy of the model was evaluated with 5-fold cross validation for randomly selected patients in the data set. Firstly, 44 patients were randomly chosen and divided into 5 groups such that each group would be the training set once. In addition, a hold-out test with an additional 33 patients was preformed across the entire data set for both prostate and DIL segmentation. The same 44 patients in the cross-validation dataset were used as training data. The additional hold out test was performed so it could be compared with 5-fold cross validation to validate the reproducibility of the results. Results were quantified using the Dice similarity coefficient (DSC), 95th percentile Hausdorff distance (HD95), mean surface distance (MSD), and center-of-mass distance (COMD), Jaccard index (J), Root-mean-square deviation (RMSD), physician ground truth volume (VOL_GT), algorithmic volume (VOL_PT), the volume difference (VD), and sensitivity for each 3D volume. All metrics are defined in Lei et al 24 except for sensitivity. Sensitivity is defined uniquely to this study as the percentage of prostates or DILs which have a DSC ≥40%. The DSC value is a measure of the extent of the overlap between the ground truth and algorithmic volumes with a value of 0 corresponding to no overlap and 1 corresponding to complete overlap. DSC is defined mathematically as follows:
| (3) |
The HD measures the farthest distance between two points on the ground truth and algorithmic volumes. The 95th percentile is chosen to remove extreme outliers from consideration. The MSD is the mean distance between the surfaces of VOL_GT and VOL_PT. COMD finds the centers-of-mass of VOL_GT and VOL_PT separately then calculates the distance between them. The Jaccard Index is similar to the DSC and measures the overlap between VOL_PT and VOL_GT relative to their combined volumes:
| (4) |
RMSD calculates the square root of the mean squared error. A value of 0 is ideal. The volume difference is the difference of VOL_PT relative to VOL_GT in unit of cc.
To assess the performance of the proposed method, it is also compared to current algorithms, such as U-Net25, nnU-Net26, and conventional Mask R-CNN.27
RESULTS
The segmentation results of the proposed method were first compared against manual physician contouring. Axial views of two typical patients’ MRI along with physician and proposed method contours are shown in Figure 2. The proposed method closely mimics the physician contours of the prostates and DILs in general. Tables S-1 and S-2 in the supplemental materials list the quantitative evaluation metrics for prostate and DIL segmentation by the proposed method as well as competing methods. The proposed method achieved approximately 90% DSC for prostate and 85% for DIL segmentation. All prostates were successfully detected (Sensitivity = 100).
Including all patients, the proposed method managed to achieve an average DSC of 87.1 ± 5.1% for prostate hold-out testing. The proposed method has better performance with prostate than DIL since DILs are more challenging for the learning model due to their much smaller size and larger variations of shapes and locations when compared with prostate.
In Table S-1, the proposed method out-performs U-Net, nnU-Net, Mask-RCNN, and the proposed method without the scoring strategy for most metrics in prostate segmentation. While the improvement of the proposed method over Mask R-CNN and U-Net appears to be marginal, it is a statistically significant improvement (p-values <0.05). In addition, the p-values for metrics where the proposed method is out-performed (such the HD95) suggest no statistical significance. The majority of metrics showed statistically significant improvement by utilizing the scoring strategy in the ablation study. In Figure 3, the effects of varying the sensitivity threshold are measured. Shown in the left-panel, the proposed method preforms the best, across most selected thresholds.
Figure 3.
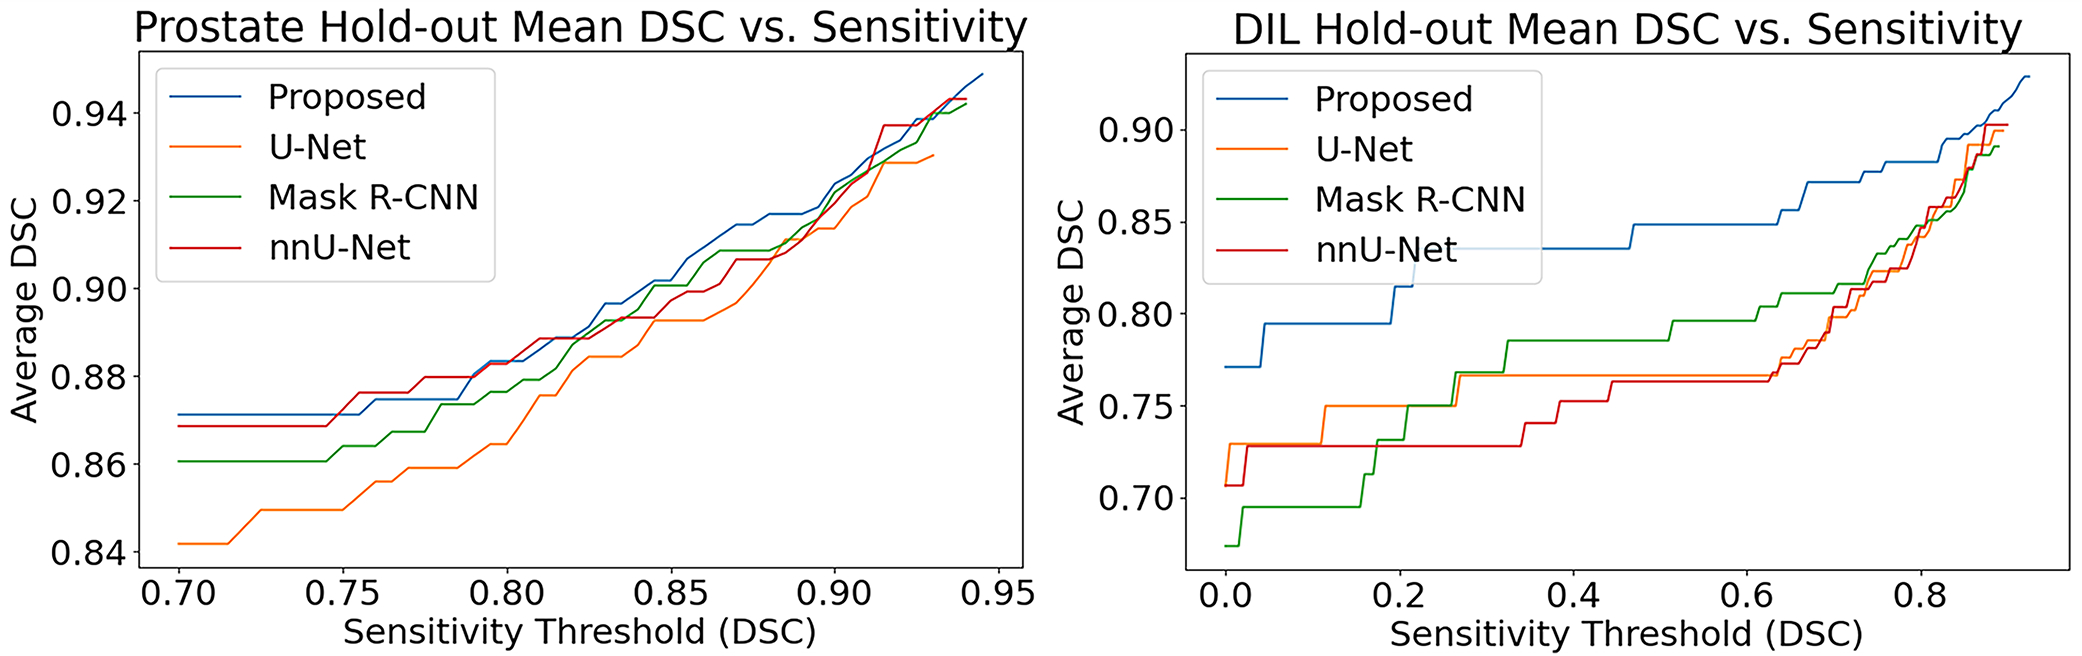
Sensitivity threshold vs reported metric values for prostate and DIL hold-out tests
On the other hand, the threshold and scoring strategy are more important for DIL segmentation. For example, by employing the scoring strategy, the DSC value greatly increased from 73.4 ± 11.3% to 83.5 ± 10.7%. When all cases are included, U-Net and nnU-Net appear to have better results in DIL segmentation than Mask R-CNN. However, both fail to detect most DILs below 2.5 cc’s while the proposed method and Mask R-CNN finds the DILs but with low accuracy. The decreased sensitivity of U-Net and nnU-Net for small DILs bias the comparison for all metrics except for sensitivity. To mitigate this biasing, the sensitivity threshold was set to a DSC value of 40% by removing these small tumors from comparison. Shown in the right panel of Figure 3, Mask R-CNN surpasses U-Net at a DSC value of approximately 35% indicating that most of the hard-to-detect DILs are removed past this value.
If all patients for which U-Net and nnU-Net did not detect DILs were removed from the comparison, Mask R-CNN and the proposed method continue to out-perform them. This is highlighted for Dice score values labeled as DSC* which are the similarity scores are calculated only for the truncated patient dataset. Not included in the report are the processing times of the algorithms, but the proposed method was faster than the other two methods taking approximately 30 seconds to complete the segmentation for each dataset.
The shape of the cross-validation dataset is depicted in Figure 4. It is noticed that the prominent tail of the HD95 plot extends to distances over 30 mm. The HD95 value measures the largest difference between the physician and algorithm produced contours. If the algorithm contours the prostate or DIL on a slice not contoured by the physician, this may lead to large HD95 values and the resultant tail. The volume accuracy of the prostate and DILs in the hold-out study are illustrated with regression and Bland-Altman plots in Figure 5. No notable under- or over-estimation in volume is found for either the prostate or DIL with the exception of one outlier point shown in the DIL Bland-Altman plot.
Figure 4.

Combination violin and box and whisker plots for prostate and DIL cross validation
Figure 5.
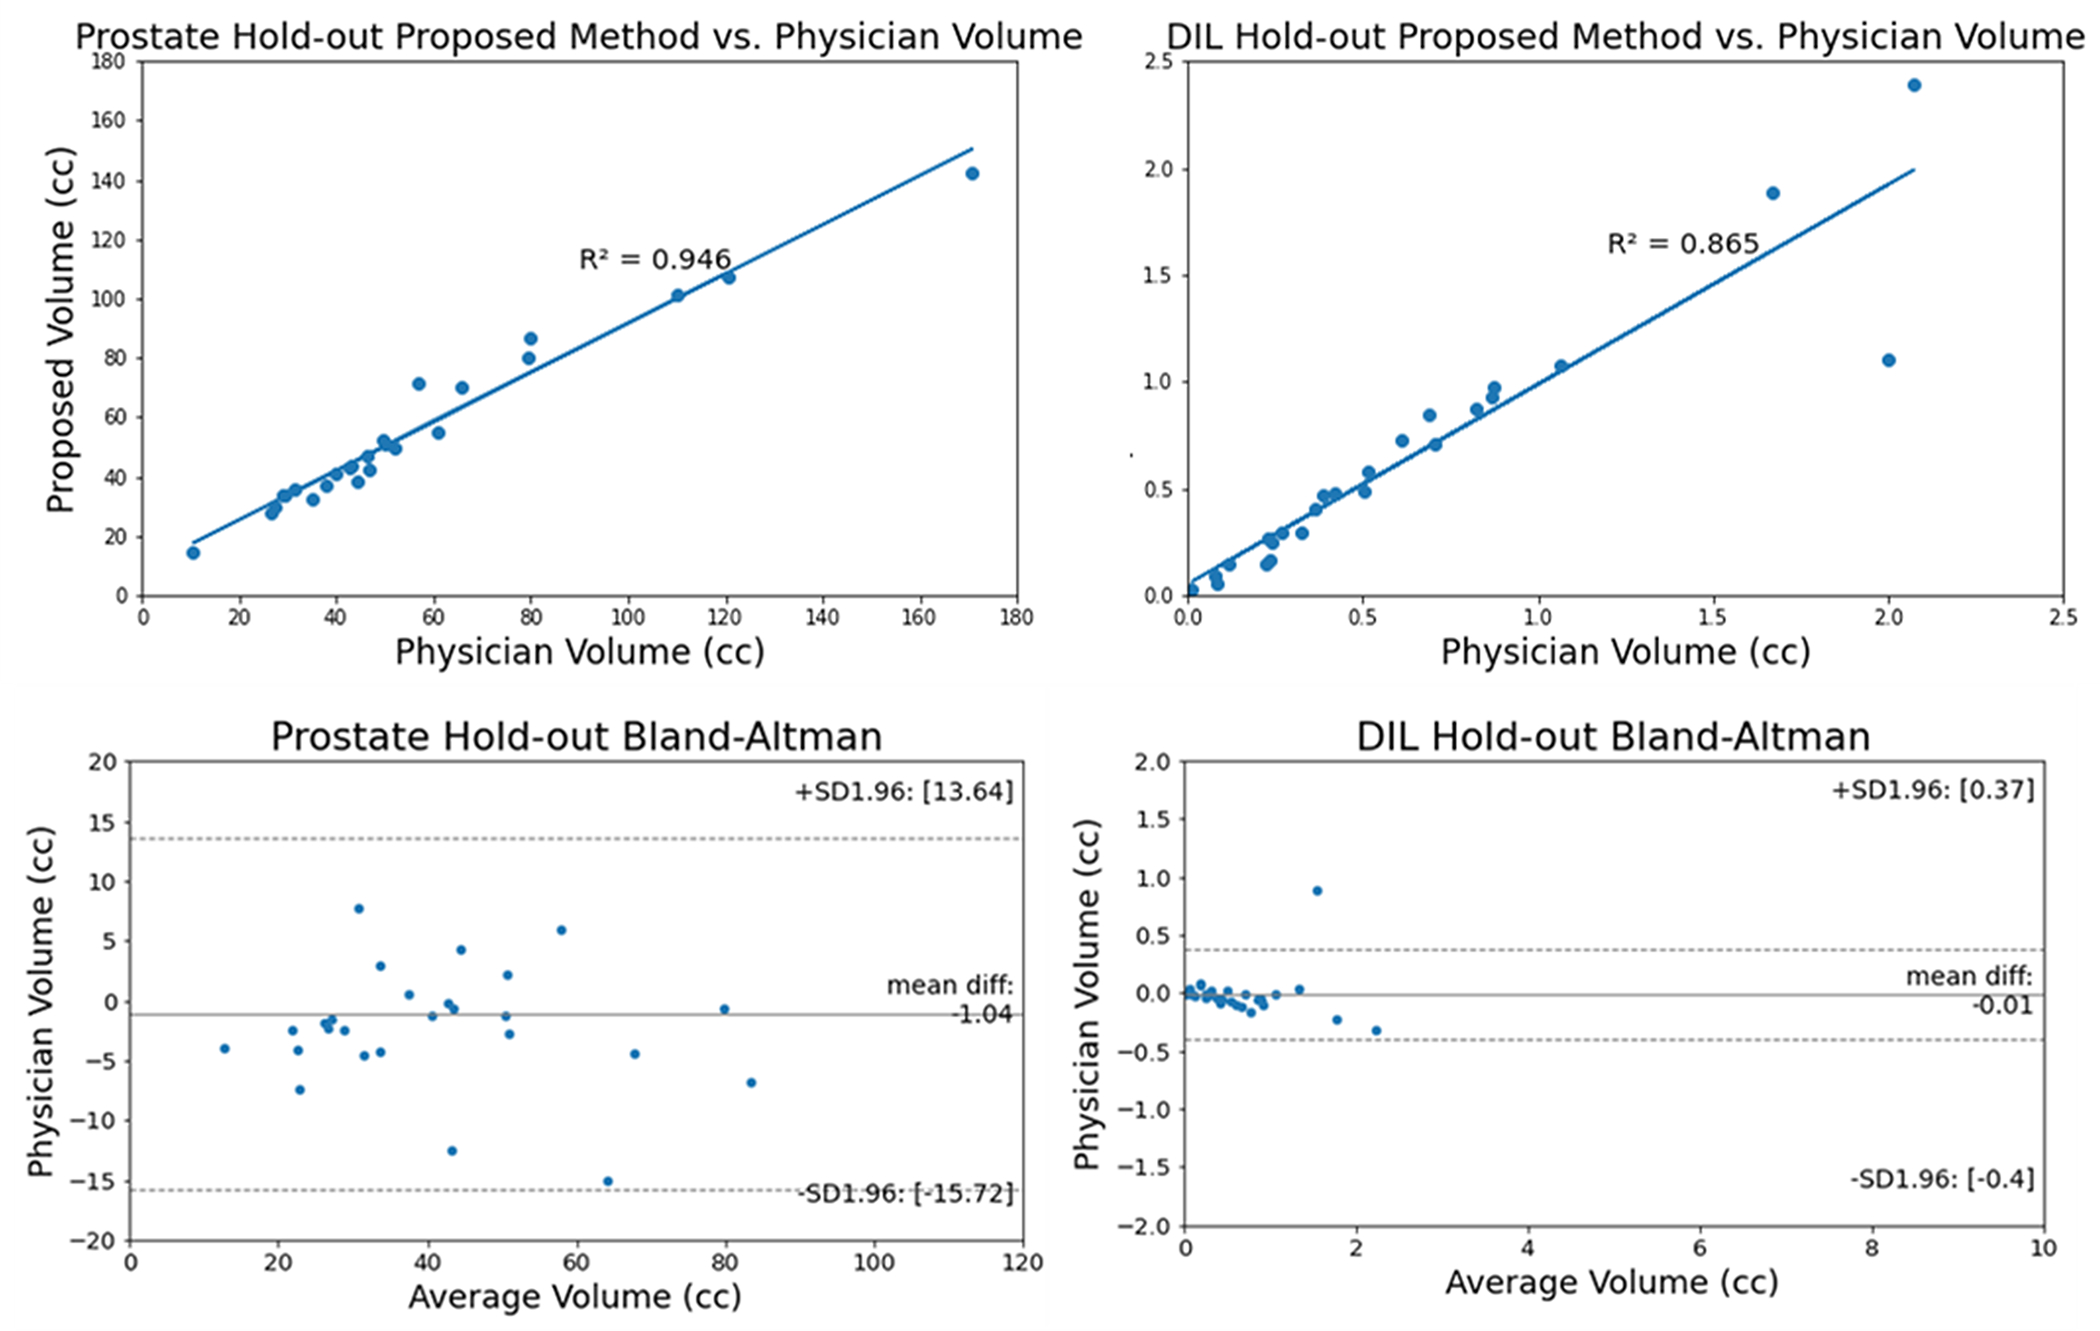
Linear regression and Bland-Altman plots of the prostate and DIL for hold-out test
DISCUSSION
In this study, we proposed a cascaded scoring convolutional neural network to automatically segment prostate and dominant intraprostatic lesions from MRI. Novel to the proposed method is that the ROIs do not overemphasize regions of normal tissue which would have a negative effect on DIL segmentation accuracy. In addition, the scoring head subnetwork estimates the reliability of the segmentation and detection of the DIL thereby significantly reducing DIL misclassification. This was confirmed in the ablation study where removing the scoring head drastically reduced performance.
Dai et al. used a 2D Mask R-CNN model with registered T2W MRI and apparent diffusion coefficient (ADC) maps achieving DSC Dice Similarity Coefficient values of 88 ± 4% and 59±14% for the prostate and DIL respectively. 28 Their advantages include the use of ADC maps. Liu et al. developed a two-stage deep learning-based framework.29 In the first stage, a 2D Mask R-CNN model was trained to automatically segment prostate structures from T2W MRI weighted images. In the second stage, a weakly supervised deep encoder-decoder neural network segments prostate lesions with T2W MRI, ADC maps, and high b-value diffusion weighted images individually. Their predictions were then reconciled with ensemble learning. Their model achieved an achieving an Intersection over Union (IoU) of 84.3% for the prostate and 40.5% for DILs. The addition of the ADC maps increases their AUC (Area under the ROC curve) value from 0.792 to 0.912 and enables the segmentation the central gland and periphery zone of the prostate. Hambarde et al. used a 2D U-Net based architecture and achieved a DSC value of 89.58% and 91.76% for the prostate and DIL respectively on T2W MRI30. U-Net is a simpler model and does not need ROI bounding boxes. However, the limitations of these methods included the use of a 2D architecture which was chosen over a 3D architecture due to limited computational resources.
The aforementioned groups investigated segmentation strategies for the prostate and DIL for the purposes of diagnosing and grading the severity of prostate cancer.28–30 We summarized their results here for reference (Table 1). The IoU score presented in Liu et al.29 was converted to DSC with equation . In addition to the variability in method design discussed in the introduction, in the studies proposed by Lui et. al and Dai et al.28, additional variability was introduced by using a combination of the PROSTATEx-2 31 and institutional datasets, while Hambarde et al. only used an institutional dataset. The T2 weighted images were obtained on both 1.5-T General Electric and 3.0 T Siemens scanners for Lui et. al, 3.0 T Siemens Trio and MAGNETOM Skyra scanners, and 1.5T Philips Ingenia MRI scanners for Hambarde et al. Moreover, the input images of the study from Hambarde et al. contains the cropped prostate region, while for the other three groups the entire pelvis region is served as input, which may be more challenging for the network to segment. The variations in dataset and scanning protocols makes a direct comparison among these results less meaningful. Another source of variability is the interpretation of the data. For example, selecting an appropriate sensitivity threshold had a profound impact on the reported results in this paper and could also have an impact on the conclusions reached in similar papers shown in Table 1.
Table 1.
Dice scores of similar papers.
| Liu et al. | Prostate | 91.48 |
| DIL | 57.65 | |
| Dai et al. | Prostate | 88 ± 4 |
| DIL | 59 ± 14 | |
| Harbdarde et al. | Prostate | 89.58 |
| DIL | 91.76 | |
| Our proposed method | Prostate | 89.6 ± 8.9 |
| DIL | 84.3 ± 11.9 |
It was demonstrated that the proposed method produced accurate results in terms of prostate and DIL segmentation on MRI, with similar or better results when compared to U-Net and Mask R-CNN based architectures. However, the standard deviations associated with DSC were still large. An increase in the training datasets would reduce the variance and make the results more compelling. Another limitation is that physician contouring is used as the ground truth. While experienced physicians segment DILs with high accuracy, contouring is still subject to human error and variability between physicians. While hard to achieve, a ground truth validated with prostatectomy specimens would be ideal. A potential further improvement for the algorithm is to weight candidate ROIs based on a spatial probability distribution of DILs in the prostate since the region of the prostate has profound effects on the likelihood that a DIL would occur.29 The orientation of the DILs relative to the prostate is currently not taken into account because the proposed method only looks within the ROI to segment the tumor. A useful addition in future renditions of the method would be the ability to predict the Gleason score.
CONCLUSION
This study presented a cascaded scoring convolutional neural network to automatically segment prostate and dominant intraprostatic lesions on MRI datasets. It demonstrated a marked improvement in accuracy for DIL segmentation compared to current models. The proposed method has shown great promise in facilitating DIL focal boost radiation therapy for prostate cancer treatment.
Supplementary Material
ACKNOWLEDGMENTS
This research is supported in part by the National Cancer Institute of the National Institutes of Health under Award Numbers R01CA215718, P50CA128301, U01CA113913, and Dunwoody Golf Club Prostate Cancer Research Award, a philanthropic award provided by the Winship Cancer Institute of Emory University.
Footnotes
Disclosures
The author declares no conflicts of interest.
Reference:
- 1.Chapman CH, Braunstein SE, Pouliot J, et al. Phase I study of dose escalation to dominant intraprostatic lesions using high-dose-rate brachytherapy. J Contemp Brachytherapy. 2018;10(3):193–201. [DOI] [PMC free article] [PubMed] [Google Scholar]
- 2.Arrayeh E, Westphalen AC, Kurhanewicz J, et al. Does local recurrence of prostate cancer after radiation therapy occur at the site of primary tumor? Results of a longitudinal MRI and MRSI study [published online ahead of print 2012/02/15]. Int J Radiat Oncol Biol Phys. 2012;82(5):e787–793. [DOI] [PMC free article] [PubMed] [Google Scholar]
- 3.Wang T, Zhou J, Tian S, et al. A planning study of focal dose escalations to multiparametric MRI-defined dominant intraprostatic lesions in prostate proton radiation therapy [published online ahead of print 20200106]. Br J Radiol. 2020;93(1107):20190845. [DOI] [PMC free article] [PubMed] [Google Scholar]
- 4.Wang T, Press RH, Giles M, et al. Multiparametric MRI-guided dose boost to dominant intraprostatic lesions in CT-based High-dose-rate prostate brachytherapy. The British Journal of Radiology. 2019;92(1097):20190089. [DOI] [PMC free article] [PubMed] [Google Scholar]
- 5.Yang X, Rossi P, Ogunleye T, et al. Prostate CT segmentation method based on nonrigid registration in ultrasound-guided CT-based HDR prostate brachytherapy. Medical Physics. 2014;41(11):111915. [DOI] [PMC free article] [PubMed] [Google Scholar]
- 6.Rischke HC, Nestle U, Fechter T, et al. 3 Tesla multiparametric MRI for GTV-definition of Dominant Intraprostatic Lesions in patients with Prostate Cancer – an interobserver variability study. Radiation Oncology. 2013;8(1). [DOI] [PMC free article] [PubMed] [Google Scholar]
- 7.Yang X, Jani AB, Rossi PJ, Mao H, Curran WJ, Liu T. Patch-based label fusion for automatic multi-atlas-based prostate segmentation in MR images. Medical Imaging 2016: Image-Guided Procedures, Robotic Interventions, and Modeling; 2016/03/18, 2016. [DOI] [PMC free article] [PubMed] [Google Scholar]
- 8.Lei Y, Fu Y, Wang T, et al. Deep Learning Architecture Design for Multi-Organ Segmentation. Vol Chapter 7, Part 2. 1st Edition ed. Boca Raton: CRC Press.; 2021. [Google Scholar]
- 9.Wang B, Lei Y, Tian S, et al. Deeply supervised 3D fully convolutional networks with group dilated convolution for automatic MRI prostate segmentation. Medical Physics. 2019;46(4):1707–1718. [DOI] [PMC free article] [PubMed] [Google Scholar]
- 10.Fu Y, Lei Y, Wang T, Curran WJ, Liu T, Yang X. A review of deep learning based methods for medical image multi-organ segmentation [published online ahead of print 20210513]. Phys Med. 2021;85:107–122. [DOI] [PMC free article] [PubMed] [Google Scholar]
- 11.Lin M, Wynne JF, Zhou B, et al. Artificial intelligence in tumor subregion analysis based on medical imaging: A review [published online ahead of print 20210624]. J Appl Clin Med Phys. 2021;22(7):10–26. [DOI] [PMC free article] [PubMed] [Google Scholar]
- 12.Wang T, Lei Y, Abiodun Ojo O, et al. MRI-based prostate and dominant lesion segmentation using deep neural network. Medical Imaging 2021: Computer-Aided Diagnosis; 2021/02/15, 2021. [Google Scholar]
- 13.Jeong J, Lei Y, Kahn S, et al. Brain tumor segmentation using 3D Mask R-CNN for dynamic susceptibility contrast enhanced perfusion imaging [published online ahead of print 20200918]. Phys Med Biol. 2020;65(18):185009. [DOI] [PMC free article] [PubMed] [Google Scholar]
- 14.Zhang Y, Tian Z, Lei Y, et al. Automatic multi-needle localization in ultrasound images using large margin mask RCNN for ultrasound-guided prostate brachytherapy [published online ahead of print 20201009]. Phys Med Biol. 2020;65(20):205003. [DOI] [PMC free article] [PubMed] [Google Scholar]
- 15.Lei Y, He X, Yao J, et al. Breast tumor segmentation in 3D automatic breast ultrasound using Mask scoring R-CNN [published online ahead of print 20201118]. Med Phys. 2021;48(1):204–214. [DOI] [PubMed] [Google Scholar]
- 16.Lin T-Y, Dollar P, Girshick R, He K, Hariharan B, Belongie S. Feature Pyramid Networks for Object Detection. 2017 IEEE Conference on Computer Vision and Pattern Recognition (CVPR); 2017/07, 2017. [Google Scholar]
- 17.Girshick R, Donahue J, Darrell T, Malik J. Rich Feature Hierarchies for Accurate Object Detection and Semantic Segmentation. 2014 IEEE Conference on Computer Vision and Pattern Recognition; 2014/06, 2014. [Google Scholar]
- 18.Ren S, He K, Girshick R, Sun J. Faster R-CNN: Towards Real-Time Object Detection with Region Proposal Networks. IEEE Transactions on Pattern Analysis and Machine Intelligence. 2017;39(6):1137–1149. [DOI] [PubMed] [Google Scholar]
- 19.He K, Gkioxari G, Dollar P, Girshick R. Mask R-CNN. 2017 IEEE International Conference on Computer Vision (ICCV); 2017/10, 2017. [Google Scholar]
- 20.Cui Y, Jia M, Lin T-Y, Song Y, Belongie S. Class-Balanced Loss Based on Effective Number of Samples. 2019 IEEE/CVF Conference on Computer Vision and Pattern Recognition (CVPR); 2019/06, 2019. [Google Scholar]
- 21.Huang Z, Huang L, Gong Y, Huang C, Wang X. Mask Scoring R-CNN. 2019 IEEE/CVF Conference on Computer Vision and Pattern Recognition (CVPR); 2019/06, 2019. [Google Scholar]
- 22.Dai X, Lei Y, Zhang Y, et al. Automatic multi-catheter detection using deeply supervised convolutional neural network in MRI-guided HDR prostate brachytherapy. Medical Physics. 2020;47(9):4115–4124. [DOI] [PMC free article] [PubMed] [Google Scholar]
- 23.Jaeger PF, Kohl SAA, Bickelhaupt S, et al. Retina U-Net: Embarrassingly Simple Exploitation of Segmentation Supervision for Medical Object Detection. arXiv [csCV]. 2018. [Google Scholar]
- 24.Lei Y, He X, Yao J, et al. Breast tumor segmentation in 3D automatic breast ultrasound using Mask scoring R-CNN. Medical Physics. 2020;48(1):204–214. [DOI] [PubMed] [Google Scholar]
- 25.Ronneberger O, Fischer P, Brox T. U-Net: Convolutional Networks for Biomedical Image Segmentation. In. Lecture Notes in Computer Science. doi: 10.1007/978-3-319-24574-4_28: Springer International Publishing; 2015:234–241. [DOI] [Google Scholar]
- 26.Isensee F, Petersen J, Klein A, et al. nnU-Net: Self-adapting Framework for U-Net-Based Medical Image Segmentation. CoRR. 2018;abs/1809.10486. [Google Scholar]
- 27.Chauhan NS. Brain Tumor Detection using Mask R-CNN. https://www.kdnuggets.com/2020/03/brain-tumor-detection-mask-r-cnn.html. Accessed October 4, 2021.
- 28.Dai Z, Carver E, Liu C, et al. Segmentation of the Prostatic Gland and the Intraprostatic Lesions on Multiparametic Magnetic Resonance Imaging Using Mask Region-Based Convolutional Neural Networks. Advances in Radiation Oncology. 2020;5(3):473–481. [DOI] [PMC free article] [PubMed] [Google Scholar]
- 29.Liu Z, Jiang W, Lee K-H, et al. A Two-Stage Approach for Automated Prostate Lesion Detection and Classification with Mask R-CNN and Weakly Supervised Deep Neural Network. In. Artificial Intelligence in Radiation Therapy. doi: 10.1007/978-3-030-32486-5_6: Springer International Publishing; 2019:43–51. [DOI] [Google Scholar]
- 30.Hambarde P, Talbar S, Mahajan A, Chavan S, Thakur M, Sable N. Prostate lesion segmentation in MR images using radiomics based deeply supervised U-Net. Biocybernetics and Biomedical Engineering. 2020;40(4):1421–1435. [Google Scholar]
- 31.Geert Litjens OD, Jelle Barentsz, Nico Karssemeijer, and Henkjan Huisman. ProstateX Challenge Data. In. doi: 10.7937/K9TCIA.2017.MURS5CL: The Cancer Imaging Archive; 2017. [DOI] [Google Scholar]
Associated Data
This section collects any data citations, data availability statements, or supplementary materials included in this article.