

Abstract
Aims:
Prognostic enrichment strategies can make trials more efficient, although potentially at the cost of diminishing external validity. Whether using a risk score to identify a population at increased mortality risk could improve trial efficiency is uncertain. We aimed to assess whether Machine learning Assessment of RisK and EaRly mortality in Heart Failure (MARKER-HF), a previously validated risk score, could improve clinical trial efficiency.
Methods and Results:
Mortality rates and association of MARKER-HF with all-cause death by one year was evaluated in four community-based heart failure (HF) and five HF clinical trial cohorts. Sample size required to assess effects of an investigational therapy on mortality was calculated assuming varying underlying MARKER-HF risk and proposed treatment effect profiles. Patients from community-based HF cohorts (n=11,297) had higher observed mortality and MARKER-HF scores than did clinical trial patients (n=13,165) with HF with either reduced ejection fraction (HFrEF) or preserved ejection fraction (HFpEF). MARKER-HF score was strongly associated with risk of one-year mortality both in the community (HR 1.48 [95% CI: 1.44–1.52]) and clinical trial cohorts with HFrEF (HR 1.41 [95% CI: 1.30–1.54]), and HFpEF (HR 1.74 [95% CI: 1.53–1.98]), per 0.1 increase in MARKER-HF. Using MARKER-HF to identify patients for a hypothetical clinical trial assessing mortality reduction with an intervention, enabled a reduction in sample size required to show benefit.
Conclusion:
Using a reliable predictor of mortality such as MARKER-HF to enrich clinical trial populations provides a potential strategy to improve efficiency by requiring a smaller sample size to demonstrate a clinical benefit.
Keywords: clinical trial efficiency, prognostic enrichment, trial enrollment strategies, machine learning, heart failure, risk scores
Graphical Abstract.
Estimated Sample Size Based on the Anticipated Treatment Effect and Underlying Risk Profile of the Study Population.
Shown is the estimated sample size required to provide a hypothetical clinical trial with 80% power to detect a significant reduction in all-cause mortality with study treatment, according to the anticipated treatment effect (A-F) and the underlying MARKER-HF risk profile of the study population (1–4). The underlying risk profile of the study population mirrors the distribution of MARKER-HF scores in CHARM in (1) and of the UCSD HF cohort in (2). Row (3) represents a study population with a uniform distribution of MARKER-HF scores ranging from −0.3 to 0.3. Row (4) shows a “high-risk” patient population with MARKER-HF scores >0 within the UCSD cohort.
Columns A-C illustrate a constant treatment effect of the investigational treatment across the entire risk spectrum with a 20% (A), 24% (B) and 16% (C) relative reduction in death, respectively. Columns D and E show heterogeneity in the treatment effect such that patients at lower risk (D) and those at higher risk (E), respectively, are expected to derive greater benefit from study treatment. Column F illustrates the scenario of diminished treatment efficacy at the extrema of risk.

Introduction
Mortality is arguably the most relevant endpoint for heart failure (HF) clinical trials and the most important outcome for patients. Virtually all large-scale phase 3 clinical trials in HF include mortality as an efficacy endpoint and many event-driven trials compute sample size based on the anticipated reduction in death with the investigational therapy. Yet, partly by design which excludes individuals at highest risk, patients enrolled in clinical trials experience substantially lower rates of mortality when compared to community-based HF cohorts1–6. Despite efforts to enrich clinical trial populations with high-risk features, mortality remains relatively low and may thus limit the ability of a trial to detect a meaningful treatment effect on this important endpoint. Moreover, inclusion of lower-risk patients imposes a substantial burden on trial efficiency as increasing sample size or duration of follow-up are the only means to overcome the low event rate and reach the number of events required in the statistical analysis plan to adequately assess the efficacy of the therapy being tested.
Although inclusion of patients across a broader spectrum of mortality risk may make clinical trials more efficient by increasing event rates as well as more representative of and thereby generalizable to the broad population of patients with HF encountered in clinical practice, current approaches used to identify populations at higher mortality risk for enrollment into trials have remained problematic as neither individual patient characteristics, biomarkers nor their combination have proven fully sufficient for this task.
We have previously shown that MARKER-HF, a risk score based on eight routinely available clinical parameters, predicts mortality risk in patients with HF followed in multiple health systems and registries7. It maintained its ability to predict mortality in various cohorts of patients, e.g. in- and outpatients, patients with pulmonary edema as well as in subtypes of HF classified according to left ventricular ejection fraction (LVEF) per guideline recommendations8.
We hypothesize that enriching a study population of a trial by using the MARKER-HF score, as an example of a multi-dimensional risk score, to identify patients at increased mortality risk, could be a means of improving trial efficiency. To test this hypothesis, we determined whether the risk profile of patients as assessed by MARKER-HF differs between community-based cohorts of patients with HF and patients enrolled in HF trials, and whether MARKER-HF successfully predicts mortality in both populations. We then tested the impact of selecting patients at increased mortality risk based on MARKER-HF score on the ability of a clinical trial to detect a significant mortality reduction in a variety of hypothetical settings.
Methods
Study Design and Population
A brief description of the community-based HF cohorts (University of California San Diego [UCSD], University of California San Francisco [UCSF], Northwestern Medicine, A systems BIOlogy Study to TAilored Treatment in Chronic Heart Failure [BIOSTAT-CHF] and of the HF trials (CHARM, TOPCAT, PARADIGM-HF)7,9–12 is provided in the Supplemental Appendix. Patients with more than one missing variable required to compute the MARKER-HF score were excluded from this analysis (BIOSTAT-CHF: n=1628, CHARM-Alternative: n=1374; CHARM-Added: n=1626; CHARM-Preserved: n=1963; TOPCAT: n=886; PARADIGM-HF: n=429).
The ethics committee at each participating site approved the protocol for each study, and participants in clinical trials provided written, informed consent.
MARKER-HF
Details of the derivation and validation of the MARKER-HF score are published7. The MARKER-HF score relies on eight readily accessible variables (diastolic blood pressure, serum creatinine, blood urea nitrogen, hemoglobin, white blood cell count, platelets, albumin, and red blood cell distribution width [RDW]) and is available online at https://marker-hf.ucsd.edu. When one variable was systematically missing in the community-based and clinical trial cohorts (albumin for CHARM, RDW for UCSF, BIOSTAT-CHF, TOPCAT and PARADIGM-HF) this variable was imputed using the mean from the UCSD cohort in which MARKER-HF had been originally derived.
Study Outcomes
The primary outcome of this analysis was all-cause death, censored at one year to ensure equal follow-up across cohorts. The secondary outcome of interest was cardiovascular death in the clinical trial populations in which cause of death was adjudicated. In patients with HF followed in health systems (UCSD, UCSF, Northwestern) death was ascertained by review of the electronic health record, and in patients enrolled in the BIOSTAT-CHF registry death was centrally adjudicated, as previously described13. In patients with HF enrolled in clinical trials (CHARM, TOPCAT, PARADIGM-HF), death and cause of death were adjudicated by the same independent clinical events committee (Brigham and Women’s Hospital, Boston, Massachusetts).
Statistical Analysis
Data are presented as mean (standard deviation) or median (interquartile range) for continuous variables, and proportions for categorical variables. Rates of all-cause death in individual HF cohorts are graphically displayed using Kaplan-Meier curves.
The relationship between MARKER-HF and all-cause death by one-year was evaluated with Cox proportional hazards regression models, using linear terms and allowing for non-linearity via the use of restricted cubic splines with the number of knots selected to minimize the model Akaike information criteria. In sensitivity analyses, the relationship between MARKER-HF and cardiovascular death by one year was also examined in clinical trial cohorts in which cause of death was adjudicated. In pooled analyses of CHARM-Alternative, CHARM-Added, CHARM-Preserved, TOPCAT and PARADIGM-HF, effect modification of investigational therapy (candesartan, spironolactone and sacubitril/valsartan, respectively) as a function of MARKER-HF scores was examined with the use of Poisson regression and modeled using restricted cubic splines.
The estimates of sample sizes required to provide 80% power14 to detect a significant reduction in mortality at a two-sided alpha of 0.05 with one year follow-up per patient for cohorts with different baseline risk profiles and with varying assumptions about the relationship between the treatment effect and MARKER-HF score as shown in the Graphical Abstract were performed using the published7 association between MARKER-HF and one-year mortality in HF patients, which is illustrated in Supplemental Figure S1.
Statistical significance was assessed using a two-sided alpha level of 0.05 without adjustment for multiplicity. Analyses were performed using STATA (version 14.2, Stata Corp., College Station, Texas) and custom python (version 3.9) based code.
Results
Baseline Characteristics
Baseline characteristics of patients are summarized in Table 1. There were notable differences with respect to age, proportion of women enrolled, LVEF and in the variables comprising the MARKER-HF score between cohorts. Whereas the individual components of the MARKER-HF score were fairly similar among the HF trial populations of patients with HFpEF or HFrEF, greater heterogeneity was observed among the community-based HF cohorts. In addition, patients in community-based HF cohorts generally had lower hemoglobin and albumin levels and more advanced kidney disease when compared to patients with HF enrolled in clinical trials.
Table 1.
Baseline Characteristics of Patients with HF
| (n=4064) | (n=1294) | (n=5055) | (n=884) | (n=654) | (n=922) | (n=7970) | (n=1060) | (n=2559) | |
|---|---|---|---|---|---|---|---|---|---|
| Age (years) | 59.3 ± 13.3 | 57.4 ± 15.4 | 68.9 ± 15.3 | 65.2 ± 11.2 | 65.9 ± 11.5 | 63.8 ± 11.7 | 63.8 ± 11.4 | 66.1 ± 11.4 | 68.9 ± 9.7 |
| Female (%) | 57.7 | 58.8 | 53.6 | 72.3 | 32.3 | 22.9 | 22.0 | 43.2 | 50.7 |
| LVEF (%) | 55 ± 17 | n/a | 49 ± 17 | 29 ± 14 | 29 ± 8 | 27 ± 8 | 30 ± 6 | 55 ± 9 | 57 ± 11 |
| Diastolic BP (mmHg) | 70 ± 14 | 68 ± 13 | 70 ± 12 | 77 ± 15 | 75 ± 11 | 72 ± 10 | 74 ± 10 | 74 ± 11 | 75 ± 11 |
| Creatinine (mg/dl) | 1.0 [0.8–1.5] | 1.2 [0.8–1.8] | 1.1 [0.9–1.6] | 1.1 [0.9–1.4] | 1.1 [0.9–1.4] | 1.1 [0.9–1.3] | 1.1 [0.9–1.3] | 1.0 [0.8–1.3] | 1.1 [0.9–1.3] |
| Blood urea nitrogen (mg/dl) | 19.2 [13.2–29.0] | 21.6 [14.5–35.8] | 21.6 [15.2–31.6] | 22.0 [14.6–34.2] | 21.0 [16.0–29.4] | 21.0 [16.0–27.0] | 19.0 [15.0–24.0] | 20.0 [15.7–26.6] | 19.0 [14.8–25.2] |
| Albumin (g/dl) | 3.6 ± 0.7 | 3.2 ± 0.7 | 3.7 ± 0.6 | 3.2 ± 0.9 | - | - | 4.3 ± 0.3 | - | 4.1 ± 0.5 |
| White blood cell count (x103/l) | 8.4 [6.2–11.5] | 8.0 [6.1–11.0] | 7.2 [5.6–9.1] | 7.9 [6.4–9.6] | 7.0 [5.9–8.4] | 7.1 [5.8–8.6] | 6.7 [5.6–8.1] | 7.0 [5.8–8.4] | 6.7 [5.6–8.0] |
| Hemoglobin (g/dl) | 11.3 ± 2.6 | 11.6 ± 2.4 | 11.7 ± 2.1 | 13.3 ± 2.0 | 13.5 ± 1.7 | 13.8 ± 1.6 | 13.9 ± 1.6 | 13.4 ± 1.6 | 13.1 ± 1.7 |
| RDW (%) | 14.8 [13.7–16.5] | - | 15.2 [14.0–16.8] | - | 14.5 [13.6–15.7] | 14.3 [13.5–15.3] | - | 14.3 [13.4–15.4] | - |
| Platelets (x103/l) | 204 [143–272] | 194 [135–258] | 223 [173–285] | 221 [181–265] | 223 [184–266] | 217 [180–259] | 193 [161–230] | 227 [189–274] | 222 [190–260] |
| MARKER-HF | −0.14 ± 0.20 | −0.06 ± 0.19 | −0.19 ± 0.16 | −0.17 ± 0.17 | −0.25 ± 0.08 | −0.24 ± 0.08 | −0.33 ± 0.07 | −0.26 ± 0.08 | −0.29 ± 0.11 |
Values reported as: Mean ± SD for normally distributed variables or as median and [IQR] for the others.
All-Cause Mortality in Community-Based HF Cohorts and HF Trials
Rates of all-cause mortality, censored at one year, are illustrated in Figure 1. One-year mortality was higher in community-based HF cohorts (UCSD, UCSF, Northwestern, BIOSTAT-CHF) than in patients with HFrEF or HFpEF enrolled in clinical trials (Supplemental Table S2). One-year mortality and MARKER-HF scores in the clinical trial cohorts according to treatment assignment are summarized in Supplemental Table S3.
Figure 1.

Rates of All-Cause Mortality According to HF Cohort.
The cumulative incidence of all-cause death by one year is shown in community-based cohorts of patients with HF (UCSD, UCSF, Northwestern, BIOSTAT-CHF) (A), and clinical trials of patients with HFrEF (CHARM-Alternative, CHARM-Added, PARADIGM-HF) (B), and HFpEF (CHARM-Added, TOPCAT) (C). Mortality was censored at one year to ensure equal follow-up across HF cohorts.
Distribution of MARKER-HF Across Cohorts
MARKER-HF scores and their distribution in each HF cohort are shown in Figure 2. The MARKER-HF score distribution in the community-based HF cohorts (Figure 2a) tended to be substantially broader than that seen in the clinical trial populations (Figure 2b). In particular, the relatively narrow spectra of MARKER-HF scores in the clinical trial populations demonstrated sparse representation of patients with higher scores that are indicative of greater mortality risk than was seen in the community-based HF populations.
Figure 2.


Distribution of the MARKER-HF Score Across HF Cohorts.
Histograms display the distribution of the MARKER-HF score across community-based cohorts of patients with HF (A-D) and clinical trials of patients with HFrEF (E-G) and HFpEF (H-I). A reference line is drawn at a value of 0 to help visualize differences in the distribution of the score across cohorts.
Association of MARKER-HF and Death
MARKER-HF score was significantly associated with risk of all-cause death by one year in patients with HF in all cohorts tested (Figure 3). Moreover, as shown in Supplemental Table S4, the association between MARKER-HF and cardiovascular death was similar to that seen for all-cause death in the clinical trial populations in which cause of death was adjudicated. Overall, pooled data from the community-based HF cohorts (hazard ratio [HR] 1.48 [95% confidence interval [CI]: 1.44–1.52, per 0.1 increase in MARKER-HF), HFrEF (HR 1.41 [95% CI: 1.30–1.54], per 0.1 increase in MARKER-HF) and HFpEF (HR 1.74 [95% CI: 1.53–1.98], per 0.1 increase in MARKER-HF) clinical trial populations demonstrated similar strong associations between MARKER-HF score and all-cause death (Figure 4).
Figure 3.

Summary of associations of MARKER-HF with One-Year Mortality Across Individual HF Cohorts.
Shown is the association of MARKER-HF with all-cause death by one year using hazard ratios (95% CI) associated with a 0.1 increase in the MARKER-HF score in each respective HF cohort.
Figure 4.
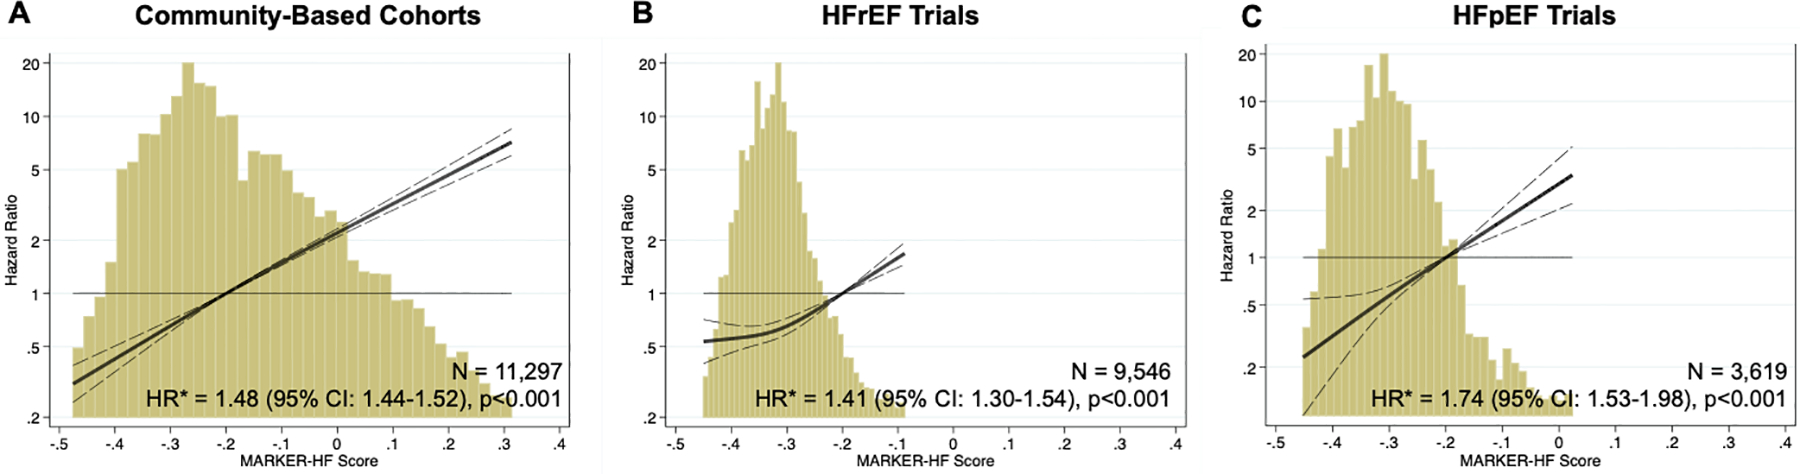
Association of MARKER-HF with One-Year All-Cause Death Across HF Cohorts.
Relationship between MARKER-HF score and all-cause death by one year in community-based cohorts of patients with HF (UCSD, UCSF, Northwestern, BIOSTAT-CHF) (A) and clinical trials of patients with HFrEF (CHARM-Alternative, CHARM-Added, PARADIGM-HF) (B) and HFpEF (CHARM-Preserved, TOPCAT) (C).
The solid line represents the hazard ratio (HR) associated with all-cause death by one year, and dashed lines the 95% confidence interval. Histograms show the distribution of the MARKER-HF score for each cohort.
*associated with a 0.1 increase in MARKER-HF score
Treatment Effect of Investigational Therapy Across the Spectrum of MARKER-HF Scores
In pooled analyses of CHARM-Alternative, CHARM-Added, CHARM-Preserved, TOPCAT and PARADIGM-HF, the treatment effect of investigational therapy (candesartan, spironolactone, and sacubitril/valsartan, respectively) relative to the comparator was consistent across the spectrum of MARKER-HF scores represented in the clinical trial cohorts with regards to cardiovascular death (p-interaction =0.79) and all-cause death (p-interaction=0.78) (Figure 5). Similarly for the individual trials, treatment effect of the investigational therapy relative to the comparator was not modified by MARKER-HF (p-interaction ≥0.07 for all).
Figure 5.

Treatment Effect of Investigational Therapy Versus Placebo Across the Spectrum of MARKER-HF Scores in Pooled Analyses of Clinical Trials.
The treatment effect of investigational therapy (candesartan, spironolactone, and sacubitril/valsartan, respectively) relative to placebo on cardiovascular and all-cause death was consistent across the spectrum of MARKER-HF scores represented in these trial populations in pooled analyses of CHARM-Alternative, CHARM-Added, CHARM-Preserved, TOPCAT and PARADIGM-HF. Estimated hazard ratios and 95% confidence intervals were obtained from Cox regression models with MARKER-HF scores expressed via restricted cubic splines.
Estimated Sample Size Based on the Anticipated Treatment Effect and Underlying Patient Risk Profile
Estimated sample sizes required to provide a clinical trial with 80% power to detect a significant reduction in all-cause death are shown in the Graphical Abstract. Columns display various anticipated treatment effects, i.e., the hazard ratio as a function of MARKER-HF risk, and rows explore different underlying risk profiles of study populations, as estimated by MARKER-HF scores. Traversing a column downwards increases the risk profile of the tested cohort, whilst traversing a row explores various treatment effects for a given cohort risk spectrum.
Specifically, for investigational therapy scenarios A, B, C, E and F we observe a large reduction in required cohort size (between 3–10 time smaller) to achieve 80% power. In case D, where the expected treatment is less effective in high-risk patients, we see a modest (10%) increase in the required cohort size to achieve 80% power.
Discussion
In this study, we found that the clinical characteristics and risk profiles of patients in community-based HF cohorts differed from those in patients enrolled in clinical trials. Specifically, community-based populations experienced substantially higher one-year mortality than was seen in patients enrolled in either HFpEF or HFrEF trials. Mirroring these differences in risk profiles, MARKER-HF scores were higher, indicating higher risk of mortality, in community-based HF cohorts than in clinical trial populations and they had a wider distribution reflecting a broader range of estimated mortality risk. MARKER-HF successfully predicted mortality with similar risk associations in the community-based and clinical trial populations of patients with HFrEF and HFpEF. In the trials studied, the treatment effect of investigational therapy did not differ as a function of MARKER-HF scores. When assessing the impact of enriching a study population based on MARKER-HF scores, we found that by selecting patients at higher risk, the sample size required for detecting a mortality benefit could be substantially reduced as long as the treatment effect of the investigational therapy was not attenuated in patients at higher risk.
Randomized clinical trials form the cornerstone of evidence-based medicine. Advances in the care of patients with HF, based on large randomized controlled trials, have the potential to lead to substantial reductions in morbidity and mortality15. Yet real-world changes in mortality over time have not paralleled the benefits of HF therapies observed in clinical trials1,16–18. Although this dichotomy is likely due to a variety of factors including suboptimal implementation of beneficial therapies19, concerns about the external validity of clinical trials have also been raised as findings from a highly selected clinical trial population may not necessarily be generalizable to a “real-world” population20. Patients enrolled in clinical trials are often younger, less racially and ethnically diverse, have a lower burden of comorbid conditions and are prescribed fewer medications than patients in community-based HF cohorts21–25. To maximize internal validity and minimize drug-related safety concerns in patients with impaired renal function or other significant comorbid conditions, patients at highest risk are often excluded from clinical trials. In part owing to strict inclusion and exclusion criteria, patients enrolled in clinical trials are less representative and are at lower risk than patients in community-based HF cohorts and they experience lower mortality. In the current study, we observed that patient characteristics differed substantially between community-based and clinical trial cohorts and one-year all-cause mortality was substantially lower in clinical trial populations than in community-based ones, consistent with findings from prior studies5,6,26. These differences in risk profiles were reflected in the distribution of MARKER-HF scores between the populations that were studied. Mean MARKER-HF scores were lower (indicative of lower risk) and their distribution had narrower width in clinical trial populations in comparison with the distribution of MARKER-HF scores in community-based HF cohorts. This observation indicates a broader range of risk and a more diverse patient population in the community-based cohorts. Most importantly, the risk spectra in clinical trials were depleted on the high-risk end of the spectrum in comparison to those in community-based HF cohorts.
Such differences in clinical profiles of patients can not only influence the estimated effect of therapy but the resultant lower mortality rates in clinical trials may also make it more difficult to detect a significant treatment effect on this important outcome. Faced with low event rates in an event-driven trial, increasing the size of the study population or extending follow-up time are the only measures that can be taken to reach the prespecified number of events. Such steps, however, impose substantial logistical and financial burdens that tend to stifle innovation. To optimize clinical trial efficiency the U.S. Food and Drug Administration encourages the use of prognostic enrichment, i.e. the selection of patients with greater likelihood of experiencing a disease-related endpoint27. Contemporary HF trials have used natriuretic peptide-based inclusion criteria or recent HF hospitalization, both for prognostic enrichment and to enhance confidence in the diagnosis of HF among enrolled patients. While these enrichment strategies using unidimensional markers of risk increase clinical trial event rates, they also select for a less diverse patient population than is encountered in clinical practice28. More recently multi-dimensional risk prediction algorithms derived from diverse pulmonary arterial hypertension registries have been retrospectively applied to seminal trials in patients with pulmonary arterial hypertension29. Enriching for intermediate and high-risk patients based on these multi-dimensional risk scores not only reduced estimated sample size and duration of follow-up but was also associated with potential cost savings despite higher screen failure rates29. Selecting a study population based on multi-dimensional risk scores that capture the diversity of patients with HF in the community with regards to their characteristics and risk profiles may therefore enhance external validity and increase event rates if sufficient high-risk patients were enrolled, and may be associated with cost savings despite higher screen failure rates.
In the present study, we assessed the potential impact of using the MARKER-HF score, as an example of an easily computable multi-dimensional risk score, to select a population at higher risk of mortality. Our results depicted in the Graphical Abstract demonstrate the power of this approach. For therapeutic interventions that reduce mortality between 15–25% (columns A-C), the sample size that would be required to show a beneficial effect could be reduced by nearly 70%. Enrollment of an enriched population would have a greater impact on sample size required to show benefit if the intervention were more effective in patients at higher risk as was seen in a recent trial of the myotrope, omecamtiv mecarbil30. Conversely, for interventions with diminished efficacy at higher levels of risk, enrolling a high-risk population based on MARKER-HF score would be counter-productive as a greater number of patients would be required to show a beneficial effect. In this case, trial efficiency could be improved by selectively excluding patients with higher risk MARKER-HF scores.
Using a multi-dimensional risk score that is easily computable as an additional entry criterion for clinical trials, and possibly abolishing other stringent exclusion criteria, might therefore make clinical trials more efficient, reduce time-to-market of novel beneficial therapies and furthermore enable the study of novel therapeutic agents in populations that are more diverse and more representative of the general population. This should not by any means prevent the use of specific exclusion criteria (e.g. dementia, ESKD, severe COPD or advanced frailty, etc) that would potentially obfuscate a beneficial effect of the experimental therapy. Similarly patients with end-stage cardiac disease that is no longer amenable to therapy should also be excluded. In the current study we evaluated the predictive ability of MARKER-HF, as an example of such a risk score, with regards to all-cause mortality in community-based HF cohorts and clinical trial populations. MARKER-HF successfully predicted all-cause mortality in both community-based HF cohorts and clinical trial populations across the spectrum of left ventricular ejection fraction7,8. In addition, in clinical trial populations in which mode of death was adjudicated, MARKER-HF also successfully predicted cardiovascular death, an endpoint that may be more easily modified by HF therapies and that in these trials accounted for most deaths (85% of deaths among patients with HFrEF and 69% of deaths among patients with HFpEF). In the trials studied the treatment effect of investigational therapy was consistent across the relatively narrow spectrum of MARKER-HF scores represented in these trials. Whether the treatment effect of investigational therapy would differ at the extrema of risk could not be evaluated due to the absence of high-risk patients in the clinical trial populations.
Using MARKER-HF, as an example of a multidimensional risk score, to identify higher risk or broader representation across the risk spectrum in a hypothetical study population, we found that the number of patients required to demonstrate a significant treatment effect on mortality in an event-driven trial could be reduced. Thus, incorporating MARKER-HF score, or any risk score that is easily computable and accurately predicts mortality in a diverse population, into the entry criteria of a trial could potentially make a clinical trial more efficient.
Limitations
The current study should be interpreted within the context of its limitations. Cause of death was not adjudicated in community-based HF cohorts and the association of MARKER-HF with cardiovascular death could therefore not be studied in these cohorts. However, in clinical trial populations, in which mode of death was adjudicated, MARKER-HF successfully predicted all-cause as well as cardiovascular death, which in fact accounted for most deaths. Due to lack of laboratory data, a sizeable proportion of patients enrolled in clinical trials was excluded from this analysis since MARKER-HF could not be calculated, possibly introducing selection bias. Mortality in clinical trial populations, however, was similar in patients included in and excluded from this analysis (Supplemental Table S2). Albumin and RDW were not consistently available in all cohorts, and when one of these variables was consistently missing its value was imputed. We have previously shown that the performance of MARKER-HF was similar when using all eight clinical variables to compute the MARKER-HF score or when one variable was imputed7. Moreover, the 8 variables used to calculate the MARKER-HF score are readily available in most clinical settings and could be obtained with relative ease as part of the screening process for patients being considered for entry into a trial.
Our finding that mortality in community based and registry cohorts was higher than in the clinical trial populations can be explained, to some degree, by the fact that community based and registry populations were identified in a variety of settings, including during hospitalization. Inclusion of hospitalized patients would increase the mortality rate in this group. Conversely, identification of patients in the community based cohorts using an EHR data base also likely have resulted in capture of outpatients with very mild disease, a factor that would have the opposite effect on the mortality rate. Although the clinical trials included in this analysis did not enroll hospitalized patients, they likely did include recently discharged patients who increased the mortality rate in these populations. As the cumulative impact of these diverse factors cannot be precisely quantified, the differences in relative mortality risk between community and registry based cohorts and clinical trial based populations should be considered with these limitations in mind. There are, however, numerous reports in the medical literature that support our finding of a substantial difference in mortality rate between community based and registry populations and patients included in clinical trials1–6,21–25,26. Although mortality rates differed between patients with HFrEF and HFpEF in the clinical trials included in the present analysis, similar differences are not seen in community based populations31,32, including the UCSD cohort8. Consequently, we did not separate the community based cohorts into groups based on their LVEF.
It should be noted that mortality rates in clinical trials where the investigational agent reduced mortality (i.e.,PARADIGM-HF and CHARM-Alternative but not CHARM-Added, CHARM-Preserved or TOPCAT) were influenced by the investigational treatment, a factor that would tend to widen the mortality difference between clinical trial and community based cohorts. However, calculating mortality risk in only the comparator group from a trial population such as CHARM-Alternative would augment the mortality rate since these patients would not be on either an angiotensin converting enzyme inhibitor or angiotensin receptor blocker and unfairly diminish the mortality risk gap with community based and registry populations which included many patients who were being treated with one of these agents which are known to reduce mortality.
Sample size calculations assumed that treatment-related adverse effects and treatment discontinuation are uniform across the risk spectrum. Use of MARKER-HF or any other method of increasing the likelihood of clinical outcomes in patients enrolled in a clinical trial would likely result in an increase in serious adverse events and this could disproportionally increase the workload at study sites. The impact of such an effect if it occurred, however, on overall study operation and cost may be offset by the requirement for a reduced sample size with a smaller number of patients required to be enrolled and followed at each site. The possibility that use of a risk score to help identify patients for entry into a clinical trial would improve efficiency is hypothetical and needs to be tested by incorporation of this strategy into the study design of future clinical trials. Finally, it is important to note that we used a single approach to identifying risk in patients with HF. Although, use of MARKER-HF seems promising in this regard for its simplicity and ease of computation, other approaches for discriminating risk are also available and could be considered.
In conclusion, mortality is substantially lower in clinical trial populations of patients with HFrEF and HFpEF as compared with community-based HF cohorts. MARKER-HF successfully predicted mortality in community-based HF cohorts and clinical trial populations. Future studies should prospectively evaluate whether incorporation of a multi-dimensional, reproducible risk score as an entry criterion into clinical HF trials might allow for enrollment of patients across a broad spectrum of risk, thereby enhancing clinical trial efficiency and generalizability.
Supplementary Material
Disclosures:
KJ is supported by the National Institutes of Health (Training Grant 5- T32 HL007604); BC has received consulting fees from Amgen, Boehringer-Ingelheim, Cardurion, Corvia, Myokardia, Novartis; EA has received consulting fees from Abiomed, Novartis, Abbott, AstaZenica, Ionis, Sana Biotechnology, Medtronic, Rocket, Papillon Therapeutics, Res! Pharmaceuticals, Lexio Pharmaceuticals, Cytokinetics; AAV has received consulting fees from Amgen, AstraZeneca, Bayer AG, Boehringer Ingelheim, Cytokinetics, MyoKardia, Novo Nordisk, Novartis, Roche Diagnostics, Servier, and Vifor Pharma; SS has received research grants from Actelion, Alnylam, Amgen, AstraZeneca, Bellerophon, Bayer, BMS, Celladon, Cytokinetics, Eidos, Gilead, GSK, Ionis, Lilly, Mesoblast, MyoKardia, NIH/NHLBI, Neurotronik, Novartis, NovoNordisk, Respicardia, Sanofi Pasteur, Theracos, and has consulted for Abbott, Action, Akros, Alnylam, Amgen, Arena, AstraZeneca, Bayer, Boeringer-Ingelheim, BMS, Cardior, Cardurion, Corvia, Cytokinetics, Daiichi-Sankyo, GSK, Lilly, Merck, Myokardia, Novartis, Roche, Theracos, Quantum Genomics, Cardurion, Janssen, Cardiac Dimensions, Tenaya, Sanofi-Pasteur, Dinaqor, Tremeau, CellProThera, Moderna, American Regent, Sarepta: BG has received consulting fees from ACI, Actelion, Axon, AstraZeneca, Boerhinger-Ingelheim, Cytokinetics, EBR Systems, Impulse Dynamics, EBR Systems, Ionis, Jaan, Moderna, Merck, Vifor, Viking, Windtree. All other authors have reported that they have no relationships relevant to the contents of this paper to disclose.
Abbreviations:
- HF
Heart failure
- HFpEF
Heart failure with preserved ejection fraction
- HFrEF
Heart failure with reduced ejection fraction
- MARKER-HF
Machine learning Assessment of RisK and EaRly mortality in Heart Failure
References
- 1.Virani SS, Alonso A, Aparicio HJ, et al. Heart Disease and Stroke Statistics—2021 Update: A Report From the American Heart Association. Circulation 2021; 143:e254–743. [DOI] [PubMed] [Google Scholar]
- 2.Dokainish H, Teo K, Zhu J, et al. Global mortality variations in patients with heart failure: results from the International Congestive Heart Failure (INTER-CHF) prospective cohort study. Lancet Glob Heal 2017; 5: e665–72. [DOI] [PubMed] [Google Scholar]
- 3.Taylor CJ, Ordóñez-Mena JM, Roalfe AK, et al. Trends in survival after a diagnosis of heart failure in the United Kingdom 2000–2017: population based cohort study. BMJ 2019; 364. DOI: 10.1136/bmj.l223. [DOI] [PMC free article] [PubMed] [Google Scholar]
- 4.Hansen MR, Hróbjartsson A, Videbæk L, et al. Postponement of Death by Pharmacological Heart Failure Treatment: A Meta-Analysis of Randomized Clinical Trials. Am J Med 2020; 133: e280–9. [DOI] [PubMed] [Google Scholar]
- 5.Chan MMY, Lam CSP. How do patients with heart failure with preserved ejection fraction die? Eur. J. Heart Fail 2013; 15: 604–13. [DOI] [PubMed] [Google Scholar]
- 6.Doughty RN, Cubbon R, Ezekowitz J, et al. The survival of patients with heart failure with preserved or reduced left ventricular ejection fraction: An individual patient data meta-analysis: Meta-analysis Global Group in Chronic Heart Failure (MAGGIC). Eur Heart J 2013; 33: 1750–7. [DOI] [PubMed] [Google Scholar]
- 7.Adler ED, Voors AA, Klein L, et al. Improving risk prediction in heart failure using machine learning. Eur J Heart Fail 2020; 22: 139–47. [DOI] [PubMed] [Google Scholar]
- 8.Greenberg B, Adler E, Campagnari C, Yagil A. A machine learning risk score predicts mortality across the spectrum of left ventricular ejection fraction. Eur J Heart Fail 2021; 23: 995–9. [DOI] [PubMed] [Google Scholar]
- 9.Voors AA, Anker SD, Cleland JG, et al. A systems BIOlogy Study to TAilored Treatment in Chronic Heart Failure: rationale, design, and baseline characteristics of BIOSTAT-CHF. Eur J Heart Fail 2016; 18: 716–26. [DOI] [PubMed] [Google Scholar]
- 10.Pfeffer MA, Swedberg K, Granger CB, et al. Effects of candesartan on mortality and morbidity in patients with chronic heart failure: The CHARM-overall programme. Lancet 2003; 362: 759–66. [DOI] [PubMed] [Google Scholar]
- 11.Pitt B, Pfeffer MA, Assmann SF, et al. Spironolactone for Heart Failure with Preserved Ejection Fraction. N Engl J Med 2014; 370: 1383–92. [DOI] [PubMed] [Google Scholar]
- 12.McMurray JJV, Packer M, Desai AS, et al. Angiotensin–Neprilysin Inhibition versus Enalapril in Heart Failure. N Engl J Med 2014; 371: 993–1004. [DOI] [PubMed] [Google Scholar]
- 13.Ferreira JP, Ouwerkerk W, Tromp J, et al. Cardiovascular and non‐cardiovascular death distinction: the utility of troponin beyond N‐terminal pro‐B‐type natriuretic peptide. Findings from the BIOSTAT‐CHF study. Eur J Heart Fail 2020; 22: 81–9. [DOI] [PubMed] [Google Scholar]
- 14.Hickey GL, Grant SW, Dunning J, Siepe M. Statistical primer: Sample size and power calculations-why, when and how? Eur. J. Cardio-thoracic Surg 2018; 54: 4–9. [DOI] [PMC free article] [PubMed] [Google Scholar]
- 15.Vaduganathan M, Claggett BL, Jhund PS, et al. Estimating lifetime benefits of comprehensive disease-modifying pharmacological therapies in patients with heart failure with reduced ejection fraction: a comparative analysis of three randomised controlled trials. Lancet 2020; 396: 121–8. [DOI] [PubMed] [Google Scholar]
- 16.Ko DT, Khera R, Lau G, et al. Readmission and Mortality After Hospitalization for Myocardial Infarction and Heart Failure. J Am Coll Cardiol 2020; 75: 736–46. [DOI] [PubMed] [Google Scholar]
- 17.Chen J, Normand SLT, Wang Y, Krumholz HM. National and regional trends in heart failure hospitalization and mortality rates for medicare beneficiaries, 1998–2008. JAMA - J Am Med Assoc 2011; 306: 1669–78. [DOI] [PMC free article] [PubMed] [Google Scholar]
- 18.Tsao CW, Lyass A, Enserro D, et al. Temporal Trends in the Incidence of and Mortality Associated With Heart Failure With Preserved and Reduced Ejection Fraction. JACC Hear Fail 2018; 6: 678–85. [DOI] [PMC free article] [PubMed] [Google Scholar]
- 19.Greene SJ, Butler J, Albert NM, et al. Medical Therapy for Heart Failure With Reduced Ejection Fraction: The CHAMP-HF Registry. J Am Coll Cardiol 2018; 72: 351–66. [DOI] [PubMed] [Google Scholar]
- 20.Rothwell PM. External validity of randomised controlled trials: ‘to whom do the results of this trial apply?’ Lancet. 2005; 365: 82–93. [DOI] [PubMed] [Google Scholar]
- 21.Rogers JR, Liu C, Hripcsak G, Cheung YK, Weng C. Comparison of Clinical Characteristics Between Clinical Trial Participants and Nonparticipants Using Electronic Health Record Data. JAMA Netw Open 2021; 4: e214732. [DOI] [PMC free article] [PubMed] [Google Scholar]
- 22.Steg PG, López-Sendón J, Lopez De Sa E, et al. External validity of clinical trials in acute myocardial infarction. Arch Intern Med 2007; 167: 68–73. [DOI] [PubMed] [Google Scholar]
- 23.Sharma A, Ezekowitz JA. Similarities and differences in patient characteristics between heart failure registries versus clinical trials. Curr Heart Fail Rep 2013; 10: 373–9. [DOI] [PubMed] [Google Scholar]
- 24.Greene SJ, DeVore AD, Sheng S, et al. Representativeness of a Heart Failure Trial by Race and Sex: Results From ASCEND-HF and GWTG-HF. JACC Hear Fail 2019; 7: 980–92. [DOI] [PMC free article] [PubMed] [Google Scholar]
- 25.Chen S, Li J. Participation of Black US Residents in Clinical Trials of 24 Cardiovascular Drugs Granted FDA Approval, 2006–2020. JAMA Netw open 2021; 4: e212640. [DOI] [PMC free article] [PubMed] [Google Scholar]
- 26.Lund LH, Benson L, Dahlström U, Edner M. Association between use of renin-angiotensin system antagonists and mortality in patients with heart failure and preserved ejection fraction. JAMA - J Am Med Assoc 2012; 308: 2108–17. [DOI] [PubMed] [Google Scholar]
- 27.U.S. Food and Drug Administration C for DE and R. No Title. Sacubitril/valsartan NDA 207620/S-018 Approv. Lett https://www.accessdata.fda.gov/drugsatfda_docs/appletter/2021/207620Orig1s018ltr.pdf (accessed Feb 25, 2021).
- 28.Cunningham JW, Ferreira JP, Deng H, et al. Natriuretic Peptide-Based Inclusion Criteria in a Heart Failure Clinical Trial: Insights From COMMANDER HF. JACC Hear Fail 2020; 8: 359–68. [DOI] [PubMed] [Google Scholar]
- 29.Scott JV, Garnett CE, Kanwar MK, Stockbridge NL, Benza RL. Enrichment Benefits of Risk Algorithms for Pulmonary Arterial Hypertension Clinical Trials. Am J Respir Crit Care Med 2021; 203: 726–36. [DOI] [PMC free article] [PubMed] [Google Scholar]
- 30.Teerlink JR, Diaz R, Felker GM, et al. Cardiac Myosin Activation with Omecamtiv Mecarbil in Systolic Heart Failure. N Engl J Med 2021; 384: 105–16. [DOI] [PubMed] [Google Scholar]
- 31.Delepaul B, Robin G, Delmas C et al. Who Are Patients Classified Within the New Terminology of Heart Failure from the 2016 ESC Guideline? ESC Heart Failure 2017; 4: 99–104 [DOI] [PMC free article] [PubMed] [Google Scholar]
- 32.Shah KS, Xu H, Matsouaka RA et al. Heart Failure with Preserved, Borderline and Reduced Ejection Fraction: 5-Year Outcomes. J Am Coll Cardiol. 2017;70:2746–2486. [DOI] [PubMed] [Google Scholar]
Associated Data
This section collects any data citations, data availability statements, or supplementary materials included in this article.