Abstract
A three-dimensional tracking microscope was used to quantify the effects of temperature (50 to 80°C) and pH (2 to 4) on the motility of Sulfolobus acidocaldarius, a thermoacidophilic archaeon. Swimming speed and run time increased with temperature but remained relatively unchanged with increasing pH. These results were consistent with reported changes in the rate of respiration of S. acidocaldarius as a function of temperature and pH. Cells exhibited a forward-biased turn angle distribution with a mean of 54°. Cell trajectories during a run were in the shape of right-handed helices. A cellular dynamics simulation was used to test the hypothesis that a population of S. acidocaldarius cells could distribute preferentially in a spatial temperature gradient due to variation in swimming speed. Simulation results showed that a population of cells could migrate from a higher to a lower temperature in the presence of sharp temperature gradients. This simulation result was achieved without incorporating the ability of cells to sense a temporal thermal gradient; thus, the response was not thermotactic. We postulate that this temperature-sensitive motility is one survival mechanism of S. acidocaldarius that allows this organism to move away from lethal hot spots in its hydrothermal environment.
The motility of extremophilic microorganisms, whose natural environments include extremes of temperature, pressure, pH, and salt concentration, has not been studied as thoroughly as has that of mesophilic microorganisms. This fact is partly because the extreme nature of their habitats has made the isolation of extremophiles a challenging task and well-defined experimental conditions difficult to achieve. Recent motility studies include those on Halobacterium salinarum (formerly Halobacterium halobium), which has polar flagella that push the cell when rotating in the clockwise direction, briefly stop, and then pull the cell when rotating in the counterclockwise direction (2, 19, 25). These cells exhibit taxis in response to chemicals (28, 30) and light (17, 30). Gluch and coworkers (13) characterized the motility of the hyperthermophilic bacterium Thermotoga maritima; they measured swimming speeds as high as 60 μm/s and reported a tactic response to temperature gradients. Due to the limited number of such studies, more are needed to further examine how the motility of extremophiles is influenced by their environment. Of particular interest is determining if extremophiles possess unique (from mesophiles) survival mechanisms that are associated with their motility and that enable them to flourish in their environment.
The trajectories of many species of swimming bacteria trace out a three-dimensional random walk characterized by runs and tumbles. Runs are relatively straight paths which occur when bacterial flagella rotate in a coordinated direction. Tumbles are changes in direction caused by a reversal of direction of flagellar rotation. Escherichia coli changes direction by tumbling briefly (0.1 s) when its flagella reverse rotation from a counterclockwise to a clockwise direction, thus reorienting the cell (4). Microorganisms such as Pseudomonas putida (8, 16) and Rhizobium meliloti (14) do not tumble as E. coli does but rather pause for a short time (<0.1 s) when their flagella stop directional rotation. In an isotropic solution, an individual cell random walk resembles the diffusion process of gaseous molecules and can be characterized by a random motility coefficient (18), which is analogous to a diffusion coefficient.
In this work, we have quantified the random motility of the thermoacidophilic archaeon Sulfolobus acidocaldarius as a function of temperature and pH. S. acidocaldarius was motile from 45 to above 80°C. Swimming speed and run time increased markedly with temperature but only slightly with increasing pH, consistent with changes in the rate of respiration of S. acidocaldarius as a function of temperature and pH. Cells exhibited a unimodal forward-biased turn angle distribution similar to that of E. coli. A cellular dynamics simulation was used to demonstrate that a population of S. acidocaldarius cells could migrate from a higher to a lower temperature as a result of individual-cell temperature-dependent swimming behavior.
MATERIALS AND METHODS
Microorganism and growth conditions.
S. acidocaldarius isolated by Brock et al. (6) has optimum growth conditions of approximately 80°C and pH 3 (15). Our stock culture was obtained from the American Type Culture Collection (ATCC 33909) and grown on revised Sulfolobus medium (ATCC culture medium 1723). The medium was adjusted to pH 3 with 10 M H2SO4 and filter sterilized with 0.2-μm-pore-size bottle-top filters (Corning 430626). Cultures were grown to the mid-exponential growth phase (3 × 10⁹ cells/ml) and stored as frozen glycerol stocks at −70°C. For tracking experiments, a frozen aliquot of 150 μl was thawed and delivered to a 250-ml shake flask containing 50 ml of medium. The inoculated medium was grown at 70°C in a model 655G Isotemp oven (Fisher Scientific) while being shaken on a model G2 Gyrotory shaker (New Brunswick Scientific Instruments Co., Inc., Edison, N.J.) set at 100 rpm (0.48 × g). Cells were grown to an approximate cell density of 107 cells/ml.
For use in tracking experiments at pH 3, cells were taken directly from the pH 3 growth medium and placed into the tracking chamber. To test the effect of pH on motility, cells were filtered from the pH 3 growth medium with a 0.45-μm-pore-size filter (Millipore Corporation, Bedford, Mass.), rinsed three times with motility buffer (growth medium containing no carbon and energy sources), and resuspended in growth medium of the appropriate pH. Cells were then incubated at 70°C and shaken for 1 h before being used in tracking experiments.
To determine the effect of the presence of carbon and energy sources (0.1% tryptone and 0.005% yeast extract, as in revised Sulfolobus medium) on motility, S. acidocaldarius was grown to 107 cells/ml, filtered with a 0.45-μm-pore-size filter, and rinsed three times with motility buffer. Cells were then resuspended in pH 3 motility buffer, incubated at 70°C, and qualitatively observed with the tracking microscope.
Three-dimensional tracking.
Tracking of S. acidocaldarius was carried out with a three-dimensional tracking microscope as previously described by Berg (3) and Berg and Brown (4). The tracking microscope is a modified transmitted-light microscope. A feedback control loop is used to continually reposition the microscope stage in order to keep a swimming cell centered within an optical-fiber array and thus track the cell in three dimensions as it swims in bulk solution. The temperature of the tracking microscope stage was maintained to within 1°C by use of a resistance heating element. The position of a swimming cell was sampled every 1/12 s and recorded with a Power Macintosh 8100 computer running the program LabView version 3.1 (National Instruments). Analysis of cell swimming patterns was carried out with the algorithm of Berg and Brown (4), which was empirically developed for E. coli. The parameters of interest were the swimming speed, run time, and turn angle distribution. Visual examinations of swimming patterns were performed for some cells to check the validity of the analysis algorithm for S. acidocaldarius.
Cellular dynamics simulation.
The cellular dynamics simulation is a Monte Carlo algorithm developed to model bulk population migration based on the swimming speed, run time, and turn angle distribution of individual cells. The cellular dynamics simulation has been used to model the random motility and chemotaxis of E. coli under stagnant (12) as well as flowing (21) conditions in a stopped-flow diffusion chamber. The cellular dynamics simulation has also been used to model the motion of P. putida in a model porous system (7, 9). In this study, we used cellular dynamics to examine the random motility of S. acidocaldarius in a fixed temperature gradient.
Individual cells were first assigned a randomly chosen initial position (x, y, z) and direction, r, in a small three-dimensional simulation box. Thus, the initial condition for the population was as follows:
 |
In this equation, l, w, and d are the length (0.8 cm), width (0.1 cm), and depth (0.1 cm) of the simulation box. An initial cell concentration (b0, 2.5 × 10⁷ cells/ml) which corresponded to 200,000 cells and satisfied a dilute-solution approximation was used for all simulations. Periodic boundary conditions were maintained in the x, y, and z directions.
At each time step in the simulation, the decision whether or not to tumble was based on the tumbling probability (inverse of the mean run time) measured for S. acidocaldarius. If the cell tumbled, a new run direction was determined by the method of Frymier et al. (12). If the cell did not tumble, the original direction was maintained. The new position of the bacterium was updated as follows:
 |
In this equation, ri is the vector position of the ith bacterium, t + Δt is the new time, Δt is the time step, v is the three-dimensional bacterial swimming velocity, and ŝi is the unit direction vector. The time step used was 0.1 s, and a cell tumble was assumed to occur instantaneously. This assumption was reasonable because a tumble duration is approximately 1/10 the duration of a run.
At each time step, the unit direction vector of each bacterium was determined as follows:
 |
In this equation, ŝ′i is the new direction vector. λi was defined as follows:
 |
In this equation, ρi is a randomly generated number on the uniform interval (0,1) and β is the tumbling probability. For a Poisson process, the tumbling probability is inversely related to the run time, τ, as follows:
 |
Θ is the Heaviside function and was defined as follows:
 |
Thus, each cell had a probability βΔt of tumbling and a probability 1 − βΔt of continuing its run. ŝi′ was determined from γi, the angle between ŝi and ŝ′i, which was selected randomly from a turn angle distribution for S. acidocaldarius. The azimuthal angle was selected randomly from a uniform distribution. Further discussion on the turn angle distribution can be found elsewhere (12).
Simulation results were plotted in terms of dimensionless cell density as a function of time and position. Dimensionless cell densities were generated by first dividing the x dimension of the simulation box into bins of 0.01-cm length. The density of cells in each bin was determined by averaging the number of cells in that bin over a 5-s time interval.
RESULTS
Qualitative observations of motility.
The majority (>90%) of S. acidocaldarius cells in a given population were motile at temperatures above 60°C. Fewer numbers of cells were motile from 45 to 60°C, and little or no motility was observed at temperatures below 45°C. Cells regained their motility when the temperature was raised above 45°C again. Cells that were filtered, washed, and resuspended in motility buffer were motile for at least 3 h after resuspension, although a smaller fraction of the population appeared to be motile under these conditions than in growth medium.
Effect of temperature.
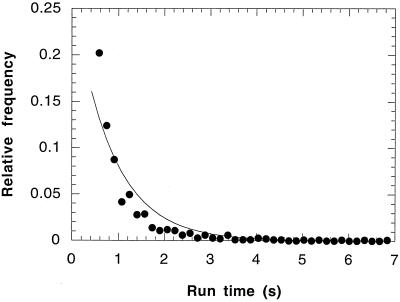
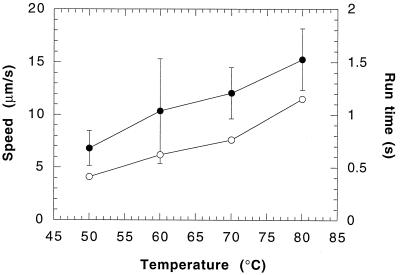
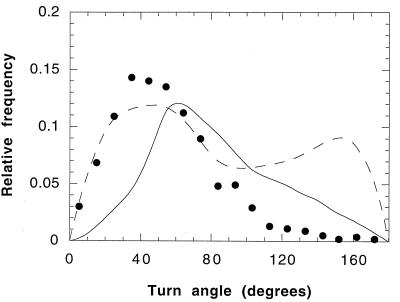
Above 50°C, the distribution of run times followed a Poisson distribution. Figure 1 shows such a distribution for experiments performed at 60°C. Figure 2 shows the effect of temperature (at pH 3) on the mean swimming speed and the mean run time of S. acidocaldarius. The mean swimming speed and the mean run time increased over the temperature range of 50 to 80°C. The mean turn angle (a measure of the directional persistence of the cells) remained constant at approximately 54° over that temperature range (data not shown). A representative turn angle distribution for S. acidocaldarius at 60°C is shown in Fig. 3. The turn angle distributions for E. coli (11) and P. putida (8) are shown for comparison.
FIG. 1.
Distribution of experimentally measured run times at 60°C and pH 3 (●). The mean was 0.62 ± 0.92 s. Also shown is the Poisson interval distribution (—) with a mean equal to that of the experimental mean. The total number of runs in this data set was 1,011.
FIG. 2.
Mean swimming speed (●) and mean run time (○) for S. acidocaldarius as a function of temperature at pH 3. Error bars for swimming speed represent standard deviations of the mean. Error bars are not shown for run time since for a Poisson distribution (Fig. 1), the standard deviation is equal to the mean.
FIG. 3.
Turn angle distribution for S. acidocaldarius at 60°C and pH 3 (●). The mean turn angle was 54 ± 29°. The total number of cells tracked in this data set was 55, with a total of 1,010 turns. The turn angle distribution was not a function of temperature or pH. The unimodal distribution for E. coli (11) (——) and the bimodal distribution for P. putida (8) (- - - -) are shown for comparison.
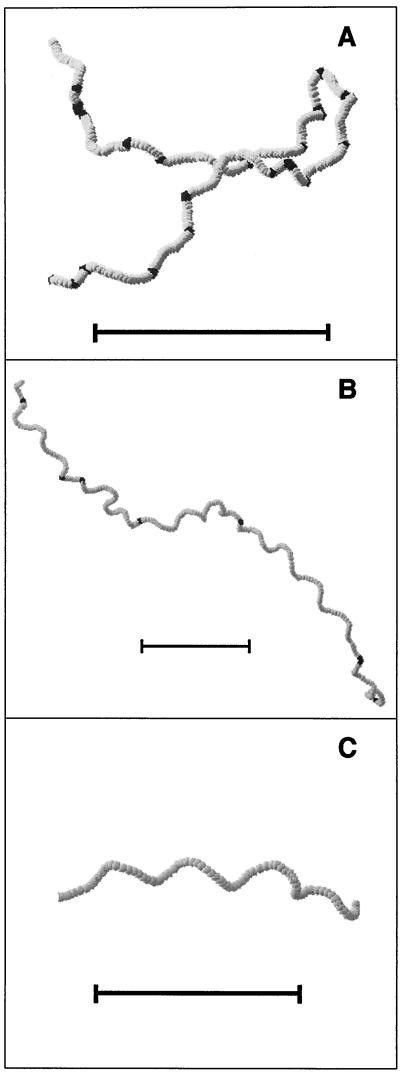
Figure 4A shows a computer visualization of tracking data for an S. acidocaldarius cell at 60°C. The trace shows relatively straight runs interrupted by changes in direction. At higher temperatures, runs appeared less straight and frequently took on a helical shape. Figure 4B shows a long trace at 80°C that is made up entirely of helical runs interrupted by changes in direction. A close-up of a trace of a helical run at 80°C is shown in Fig. 4C. The helical runs were always right-handed and had an approximate diameter of 10 μm and a pitch of 15 μm.
FIG. 4.
Three-dimensional computer visualizations of swimming S. acidocaldarius cells. Each sphere represents the cell position at a 1/12-s interval. Light spheres designate a run, and dark spheres indicate a change in direction. Scale bars, 50 μm. (A) Cell swimming in a random walk-like fashion at 60°C. A gentle right-handed helical swimming motion is seen throughout the trace. (B) Long trace at 80°C consisting of helical runs and changes in direction. The changes in direction are indicated by dark areas. (C) Close-up of a helical run from panel B. The helix diameter and pitch are approximately 10 and 15 μm, respectively.
Effect of pH.
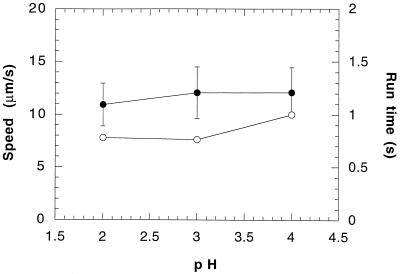
Figure 5 shows the effect of pH (at 70°C) on the mean swimming speed and the mean run time of S. acidocaldarius. The mean swimming speed and the mean run time increased slightly over the examined pH range. The mean turn angle remained relatively constant at approximately 54° for pHs 2 and 3 and decreased slightly to 48° at pH 4 (data not shown).
FIG. 5.
Mean swimming speed (●) and mean run time (○) of S. acidocaldarius as a function of pH at 70°C. Error bars are as in Fig. 2.
Cellular dynamics.
Cellular dynamics simulations were performed in order to test the hypothesis that a population of S. acidocaldarius cells could distribute preferentially in the presence of a spatial temperature gradient. It should be made clear that in these simulations, any nonuniform distribution of cells would be due solely to the effect of absolute temperature on the swimming speed and the run time of S. acidocaldarius (Fig. 2). This situation is distinct from the ability of some microorganisms to alter their run time in response to a temporal thermal gradient, a phenomenon termed thermotaxis. For example, E. coli cells increase their run time in the presence of an increasing temporal thermal gradient (23), a property which can result in migration in the direction of an increasing spatial temperature gradient. Conversely, thermotaxis in T. maritima occurs as cells increase their run time in the presence of a decreasing temporal thermal gradient (13). The swimming behavior of cells exhibiting thermotaxis is analogous to that for chemotaxis, where motile cells can migrate in response to spatial chemical gradients due to sensing of temporal chemical gradients. The simulations that we performed in this study were more akin to chemokinesis, where cell swimming behavior is a function of absolute chemical concentration rather than chemical gradients.
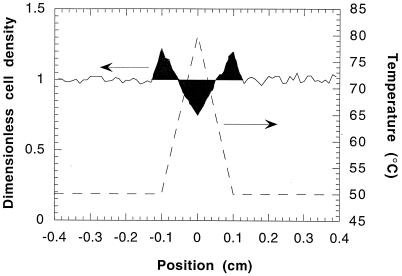
Linear fits for swimming speed and run time as a function of temperature (Fig. 2) were used in the simulations. As described in Materials and Methods, at time zero of the simulations, a uniform distribution (dimensionless density of one) of cells was present in the simulation box. Figure 6 shows that for a temperature gradient of 300°C/cm, after 30 min there were peaks of increased cell density at 50°C and troughs of decreased cell density at 80°C. The simulation noise seen in Fig. 6 was due to the averaging of the number of cells in that bin over a 5-s time interval. The noise was small enough so that migration trends were still easily discernible.
FIG. 6.
Simulated dimensionless cell density (——) and temperature (–––) after 30 min in the presence of a gradient of 300°C/cm. Initially there was a uniform density of cells (corresponding to a dimensionless density of one) in the simulation box. Dark areas highlight significant deviations from the initial condition.
DISCUSSION
Because our discussion focuses on interpreting the individual cell swimming behavior of S. acidocaldarius under different environmental conditions, we begin with a brief description of the proton motive force Δp (20, 24), which is the driving force for the flagellar motors of many microorganisms. According to Mitchell’s chemiosmotic theory (26), Δp at 30°C can be expressed as follows (32):
 |
In this equation, ΔΨ is the membrane potential and ΔpH is the pH difference. By convention, ΔΨ is Ψinside cell − Ψoutside cell, ΔpH is pHinside cell − pHoutside cell, and a Δp of <0 indicates that a membrane is charged for the H+ ion. Δp provides necessary but not sufficient information regarding the actual flux of protons into the cell; it represents the electrochemical driving force which is required for proton flux, but membrane permeability, which represents the resistance to proton flux, also plays a role. The contributions of ΔΨ and ΔpH to Δp are different for neutrophilic and acidophilic microorganisms (32). For neutrophiles, a ΔΨ of <0 and ΔpH of >0 lead to a Δp of <0. Since ΔpH is relatively small, it contributes only 20 to 30% of the total Δp. Thus, the proton potential of a neutrophilic cell is due mainly to ΔΨ. For many acidophiles, ΔpH is >0 but ΔΨ is >0 (or ΔΨ is 0, or just slightly negative). The net effect is still a Δp of <0, but it is due primarily to ΔpH. With these trends in mind, our results are discussed below.
The loss of S. acidocaldarius motility below 45°C is a reversible effect because we observed that cells regained their motility when the temperature was raised again above 45°C. However, below 45°C ΔpH should still be a positive quantity and, accordingly, Δp should be <0. A possible explanation for the lack of motility below this temperature is that the permeability of the S. acidocaldarius cell membrane decreases dramatically, thus decreasing the flagellar motor proton flux. This hypothesis is supported by studies of proton permeability through reconstituted liposomes made of S. acidocaldarius lipids, which show that permeability rapidly approaches zero as temperature is decreased to 40°C (10).
Our observations of S. acidocaldarius motility in the absence of carbon and energy sources suggest that motility can be derived from an endogenous energy source. Similar observations have been made for E. coli (1) and P. putida (9, 16). We suspect that this motility would last only as long as Δp is sufficiently negative which, from our previous discussion, means as long as ΔpH is sufficiently positive. Since proton pumping out of the S. acidocaldarius cell is coupled to cellular respiration (27), there is a finite amount of time until ΔpH approaches zero. Our observations were that this amount of time is longer than 3 h.
By virtue of the run time Poisson distribution statistics (Fig. 1), we concluded that the swimming motion of S. acidocaldarius is an unbiased three-dimensional random walk. This characteristic has been demonstrated for many motile bacteria, including E. coli (4) and P. putida (8).
S. acidocaldarius demonstrated a 124% linear increase in swimming speed between 50 and 80°C. Similar observations have been made for neutrophilic microorganisms and have been explained as an increase in proton pumping (out of the cell) with respiration rate, thus decreasing an already negative ΔΨ. A similar reasoning can be used here, with the difference that a positive ΔΨ decreases to zero or possibly becomes slightly negative. A ΔpH of >0 would still be the dominant contributor to a Δp of <0.
As shown in Table 1, the swimming speeds of S. acidocaldarius are noticeably slower than those of the hyperthermophilic bacterium T. maritima (deep-sea hydrothermal vent microorganism) and those of mesophilic bacteria, such as E. coli (enteric microorganism), P. putida (soil-inhabiting microorganism), and Rhodobacter sphaeroides (surface water microorganism). These speed differences are likely due in part to the variability in the number, shape, and motor efficiency of the flagella of each species. Such specifics for S. acidocaldarius flagella are not available in the published literature. Comparisons between the Δp values of S. acidocaldarius and the neutrophiles in Table 1 are difficult to make because the relative contributions of ΔΨ and ΔpH to Δp are opposite in proportion.
TABLE 1.
Comparison of tracking results
The run time of S. acidocaldarius increased with temperature. However, three-dimensional visualizations of S. acidocaldarius swimming patterns revealed that at 50°C, there were a number of spurious tumbles. This result was due to the relatively slow (∼7 μm/s) swimming speed and pronounced wobble of the cells, which in our analysis procedure resulted in overestimation of the tumbling frequency of S. acidocaldarius. As a result, the run time of 0.4 s at 50°C may be artificially low. Above 50°C, however, the majority of tumbles were consistent with changes in the swimming direction of cells; therefore, the observed increase in run time with temperature is real. Berg and Brown (4) used 0.18% (wt/vol) hydroxypropylmethylcellulose (Biochemika Methocel 90 HG) in their tracking experiments in order to reduce the wobble observed for swimming E. coli. In our study, 0.18% Methocel provided only a modest decrease in cell wobble. This result was probably due to Methocel changing only the macroscopic viscosity of the aqueous solution to which it was added (5).
The turn angle distribution of a cell population is a measure of its directional persistence. Turn angles of less than 90° indicate that cells have a propensity to continue to swim in relatively the same direction in which they were swimming prior to a change in direction. The unimodal turn angle distribution of S. acidocaldarius (Fig. 3) is a likely consequence of its nonreversing flagella (15), which ensure that a cell is not alternately propelled in the forward and reverse directions. Propulsion in both the forward and reverse directions is the swimming mode of P. putida, thus giving rise to its bimodal turn angle distribution. The forward bias of S. acidocaldarius is greater than that of E. coli, presumably because without flagellar reversal, an S. acidocaldarius cell does not tumble like E. coli but rather pauses briefly, thereby limiting its means of a directional change to Brownian motion alone.
The observation that S. acidocaldarius swam in more pronounced helically shaped runs as temperature increased was an unexpected result. Perhaps this behavior is related to structural (shape) changes in flagella with increasing temperature. It is not clear whether this behavior was due directly to increasing temperature or whether it arose indirectly as flagellar bundles compacted and became more efficient as their rotation speed increased.
pH had little effect on the swimming characteristics of S. acidocaldarius. This result is consistent with the observation that cell growth rate is a weak function of pH in a growth medium similar to that used in this study (15). We expected Δp and therefore flagellar motor proton flux to remain relatively unchanged. However, medium composition has been shown to affect the dependence of S. acidocaldarius growth rate on pH (15), suggesting that under some conditions, pH might affect swimming speed.
The population-scale effects of temperature and pH on the motility of S. acidocaldarius are highlighted in the calculation of the random motility coefficient, μ0 (22), a macroscopic transport parameter that quantifies the dispersal capabilities of a population of cells as follows:
 |
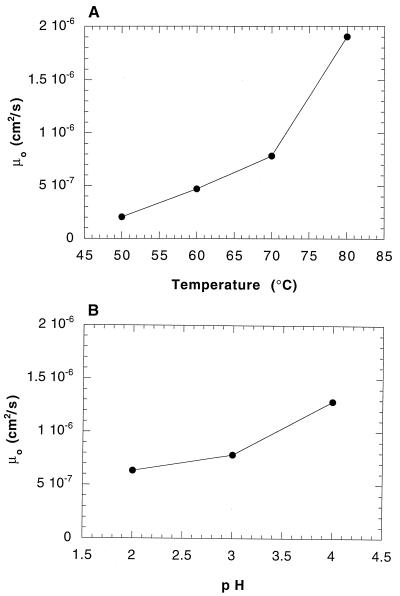
In this equation, v is the swimming speed, β is the tumbling probability (inverse of the run time for a Poisson process), and ψ is the mean cosine of the turn angle. Figure 7 shows that μ0 increased nearly 10-fold between 50 and 80°C but only 3-fold between pHs 2 and 4. These results demonstrate that temperature has a greater influence than pH on macroscopic-scale S. acidocaldarius motility.
FIG. 7.
Random motility (μ0) as a function of temperature at pH 3 (A) and pH at 70°C (B). The run time at 50°C was assumed to be equal to that at 60°C, since an accurate tumbling frequency may not have been obtained with our analysis procedure.
The cellular dynamics simulation was used to better understand the implications of temperature-dependent random motility in the presence of a temperature gradient. The result (Fig. 6) was the migration of S. acidocaldarius cells in the direction of a decreasing temperature gradient. This behavior is a potential survival mechanism of S. acidocaldarius—the ability of a population of cells to move away from potentially lethal hot spots in the natural environment. One drawback of this behavior is that cells could move into equally lethal cold spots. A possible explanation for this is that temperature is only one of the environmental variables to which an S. acidocaldarius cell responds when determining optimal conditions for survival. It should be emphasized that the simulations performed in this study did not assume that cells could sense a temporal thermal gradient. Thus, the response shown in Fig. 6 was not due to thermotaxis but arose solely from the effect of absolute temperature on individual-cell swimming behavior.
Is this temperature-induced migration response unique to extremophiles in general or specific to the thermoacidophile S. acidocaldarius? It is important to realize that the basis for the observed migration from a higher to a lower temperature is the change in the cell swimming speed as a function of temperature (Fig. 2) and therefore the random motility coefficient (Fig. 7). That is, the migration of S. acidocaldarius was predicted to occur from regions of high random motility (80°C) to regions of low random motility (50°C). From the results, we conclude that there are two general requirements for this type of population migration to occur.
The first requirement is that the cell swimming speed (not the run time) varies with temperature (29). E. coli and T. maritima both demonstrate an increase in swimming speed with temperature (Table 1), suggesting that, based on this first requirement alone, both cell types should be able to demonstrate the same temperature response as S. acidocaldarius.
The second requirement is that there are temperature gradients in the natural environment of the microorganism that are steep enough to make the temperature dependence of μ0 significant. For E. coli, it is unlikely that such temperature gradients are encountered in its enteric environments. As a result, preferential migration of E. coli resulting from temperature-dependent swimming behavior in a spatial temperature gradient is not expected to occur. For T. maritima, whose natural habitat is deep-sea hydrothermal vents, large temperature gradients are common and preferential migration could occur.
Taking the two requirements together, we generalize that preferential distribution in a spatial temperature gradient could occur for motile microorganism populations that live in high-temperature-gradient environments. Thus, the type of population migration that we have described in this study is expected to be unique to extremophilic microorganisms, specifically thermophiles.
S. acidocaldarius swimming behavior was found to be analogous to a three-dimensional random walk. Motility was maintained even in the absence of carbon and energy sources, suggesting that motility is an important aspect of survival in an environment that often contains only trace amounts of organic carbon. A consistent trend was observed between swimming speed and cell respiration rate as a function of temperature and pH. Cellular dynamics simulations showed that a population of S. acidocaldarius cells could move from a higher to a lower temperature as a result of temperature-dependent individual-cell swimming behavior. This response did not require cells to have the ability to sense actual gradients in temperature and appears to be unique to motile thermophilic microorganisms.
ACKNOWLEDGMENTS
This research was supported by a grant from the National Science Foundation through the Life in Extreme Environments (LExEn) Interdisciplinary Research Program (BES-9809388).
We thank Howard Berg for the loan of the tracking microscope, Margot Vigeant for help with using it, and Paul Frymier and Kevin Duffy for permission to use their turn-angle distribution data. We also thank the anonymous reviewers for their helpful comments regarding the manuscript.
REFERENCES
- 1.Adler J, Templeton B. The effect of environmental conditions on the motility of Escherichia coli. J Gen Microbiol. 1967;46:175–184. doi: 10.1099/00221287-46-2-175. [DOI] [PubMed] [Google Scholar]
- 2.Alam M, Oesterhelt D. Morphology, function and isolation of halobacterial flagella. J Mol Biol. 1984;176:459–475. doi: 10.1016/0022-2836(84)90172-4. [DOI] [PubMed] [Google Scholar]
- 3.Berg H C. How to track bacteria. Rev Sci Instrum. 1971;42:868–871. doi: 10.1063/1.1685246. [DOI] [PubMed] [Google Scholar]
- 4.Berg H C, Brown D A. Chemotaxis in Escherichia coli analyzed by three-dimensional tracking. Antibiot Chemother (Washington, DC) 1974;19:55–78. doi: 10.1159/000395424. [DOI] [PubMed] [Google Scholar]
- 5.Berg H C, Turner L. Movement of microorganisms in viscous environments. Nature. 1979;278:349–351. doi: 10.1038/278349a0. [DOI] [PubMed] [Google Scholar]
- 6.Brock T D, Brock K M, Belly R T, Weiss R L. Sulfolobus: a new genus of sulfur-oxidizing bacteria living at low pH and high temperature. Arch Microbiol. 1972;84:54–68. doi: 10.1007/BF00408082. [DOI] [PubMed] [Google Scholar]
- 7.Duffy K J, Cummings P T, Ford R M. Random walk calculations for bacterial migration in porous media. Biophys J. 1995;68:800–806. doi: 10.1016/S0006-3495(95)80256-0. [DOI] [PMC free article] [PubMed] [Google Scholar]
- 8.Duffy K J, Ford R M. Turn angle and run time distributions characterize swimming behavior for Pseudomonas putida. J Bacteriol. 1997;179:1428–1430. doi: 10.1128/jb.179.4.1428-1430.1997. [DOI] [PMC free article] [PubMed] [Google Scholar]
- 9.Duffy K J, Ford R M, Cummings P T. Residence time calculation for chemotactic bacteria within porous media. Biophys J. 1997;73:2930–2936. doi: 10.1016/S0006-3495(97)78321-8. [DOI] [PMC free article] [PubMed] [Google Scholar]
- 10.Elferink M G L, de Wit J G, Driessen A J M, Konings W N. Stability and proton-permeability of liposomes composed of archaeal tetraether lipids. Biochim Biophys Acta. 1994;1193:247–254. doi: 10.1016/0005-2736(94)90160-0. [DOI] [PubMed] [Google Scholar]
- 11.Frymier P D. Bacterial migration and motion in a fluid phase and near a solid surface. Ph.D. thesis. Charlottesville: University of Virginia; 1995. [Google Scholar]
- 12.Frymier P D, Ford R M, Cummings P T. Cellular dynamics simulations of bacterial chemotaxis. Chem Eng Sci. 1993;48:687–699. [Google Scholar]
- 13.Gluch M F, Typke D, Baumeister W. Motility and thermotactic response of Thermotoga maritima. J Bacteriol. 1995;177:5473–5479. doi: 10.1128/jb.177.19.5473-5479.1995. [DOI] [PMC free article] [PubMed] [Google Scholar]
- 14.Gotz R, Schmitt R. Rhizobium meliloti swims by unidirectional, intermittent rotation of right-handed flagellar helices. J Bacteriol. 1987;169:3146–3150. doi: 10.1128/jb.169.7.3146-3150.1987. [DOI] [PMC free article] [PubMed] [Google Scholar]
- 15.Grogan D W. Phenotypic characterization of the archaebacterial genus Sulfolobus: comparison of five wild-type strains. J Bacteriol. 1989;171:6710–6719. doi: 10.1128/jb.171.12.6710-6719.1989. [DOI] [PMC free article] [PubMed] [Google Scholar]
- 16.Harwood C S, Fosnaugh K, Dispensa M. Flagellation of Pseudomonas putida and analysis of its motile behavior. J Bacteriol. 1989;171:4063–4066. doi: 10.1128/jb.171.7.4063-4066.1989. [DOI] [PMC free article] [PubMed] [Google Scholar]
- 17.Hildebrand E, Dencher N. Two photosystems controlling behavioural responses of Halobacterium halobium. Nature. 1975;257:46–48. doi: 10.1038/257046a0. [DOI] [PubMed] [Google Scholar]
- 18.Keller E F, Segel L A. Model for chemotaxis. J Theor Biol. 1971;30:225–234. doi: 10.1016/0022-5193(71)90050-6. [DOI] [PubMed] [Google Scholar]
- 19.Kupper J, Marwan W, Typke D, Grunberg H, Uwer U, Gluch M, Oesterhelt D. The flagellar bundle of Halobacterium salinarum is inserted into a distinct polar cap structure. J Bacteriol. 1994;176:5184–5187. doi: 10.1128/jb.176.16.5184-5187.1994. [DOI] [PMC free article] [PubMed] [Google Scholar]
- 20.Larsen S H, Adler J, Gargus J J, Hogg R W. Chemomechanical coupling without ATP: the source of energy for motility and chemotaxis in bacteria. Proc Natl Acad Sci USA. 1974;71:1239–1243. doi: 10.1073/pnas.71.4.1239. [DOI] [PMC free article] [PubMed] [Google Scholar]
- 21.Lewus P. Dynamic model of E. coli motility. M.S. thesis. Charlottesville: University of Virginia; 1997. [Google Scholar]
- 22.Lovely P S, Dahlquist F W. Statistical measures of bacterial motility and chemotaxis. J Theor Biol. 1975;50:477–496. doi: 10.1016/0022-5193(75)90094-6. [DOI] [PubMed] [Google Scholar]
- 23.Maeda K, Imae Y, Shioi J I, Oosawa F. Effect of temperature on motility and chemotaxis of Escherichia coli. J Bacteriol. 1976;127:1039–1046. doi: 10.1128/jb.127.3.1039-1046.1976. [DOI] [PMC free article] [PubMed] [Google Scholar]
- 24.Manson M D, Tedesco P, Berg H C, Harold F M, van der Drift C. A protonmotive force drives bacterial flagella. Proc Natl Acad Sci USA. 1977;74:3060–3064. doi: 10.1073/pnas.74.7.3060. [DOI] [PMC free article] [PubMed] [Google Scholar]
- 25.Marwan W, Alam M, Oesterhelt D. Rotation and switching of the flagellar motor assembly in Halobacterium halobium. J Bacteriol. 1991;173:1971–1977. doi: 10.1128/jb.173.6.1971-1977.1991. [DOI] [PMC free article] [PubMed] [Google Scholar]
- 26.Mitchell P. Chemiosmotic coupling in oxidative and photosynthetic phosphorylation. Biol Rev Cambridge Philos Soc. 1961;41:445–502. doi: 10.1111/j.1469-185x.1966.tb01501.x. [DOI] [PubMed] [Google Scholar]
- 27.Schafer G. Bioenergetics of the archaebacterium Sulfolobus. Biochim Biophys Acta. 1996;1277:163–200. doi: 10.1016/s0005-2728(96)00104-1. [DOI] [PubMed] [Google Scholar]
- 28.Schimz A, Hildebrand E. Chemosensory responses of Halobacterium halobium. J Bacteriol. 1979;140:749–753. doi: 10.1128/jb.140.3.749-753.1979. [DOI] [PMC free article] [PubMed] [Google Scholar]
- 29.Schnitzer M J, Block S M, Berg H C, Purcell E M. Strategies for chemotaxis. Symp Soc Gen Microbiol. 1990;46:15–34. [Google Scholar]
- 30.Spudich J L, Stoeckenius W. Photosensory and chemosensory behavior of Halobacterium halobium. Photobiochem Photobiophys. 1979;1:43–53. [Google Scholar]
- 31.Vigeant, M. 1997. Personal communication.
- 32.White D. The physiology and biochemistry of prokaryotes. New York, N.Y: Oxford University Press; 1995. [Google Scholar]


