

Summary
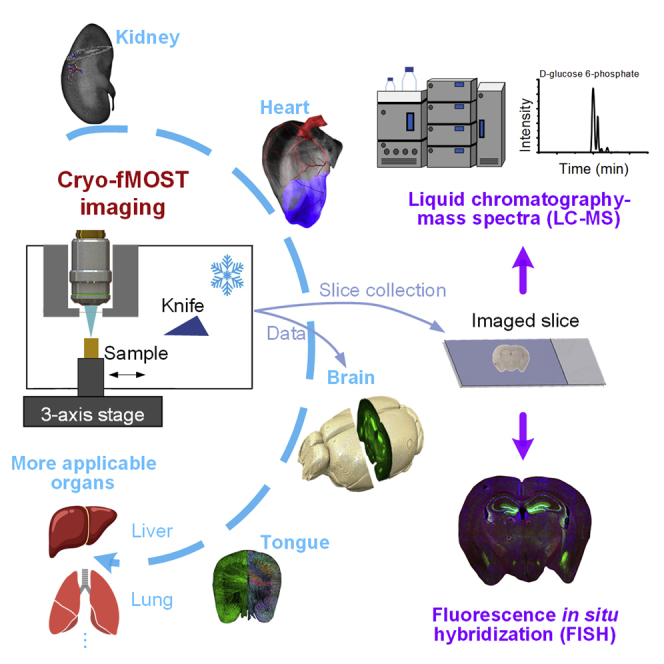
Optical visualization of complex microstructures in the entire organ is essential for biomedical research. However, the existing methods fail to accurately acquire the detailed microstructures of whole organs with good morphological and biochemical preservation. This study proposes a cryo-fluorescence micro-optical sectioning tomography (cryo-fMOST) to image whole organs in three dimensions (3D) with submicron resolution. The system comprises a line-illumination microscope module, cryo-microtome, three-stage refrigeration module, and heat insulation device. To demonstrate the imaging capacity and wide applicability of the system, we imaged and reconstructed various organs of mice in 3D, including the healthy tongue, kidney, and brain, as well as the infarcted heart. More importantly, imaged brain slices were performed sugar phosphates determination and fluorescence in situ hybridization imaging to verify the compatibility of multi-omics measurements. The results demonstrated that cryo-fMOST is capable of acquiring high-resolution morphological details of various whole organs and may be potentially useful for spatial multi-omics.
Subject areas: Biological sciences, Natural sciences, Neuroscience, Techniques in neuroscience
Graphical abstract
Highlights
-
•
Cryo-fluorescence micro-optical sectioning tomography (Cryo-fMOST) was achieved
-
•
3D imaging of whole mouse tongue, kidney, heart, and brain at submicron resolution
-
•
Frozen state well preserves tissues’ original morphology and biochemical information
-
•
Cryo-fMOST is compatible with sugar phosphates determination and FISH measurement
Biological sciences; Natural sciences; Neuroscience; Techniques in neuroscience;
Introduction
Visualizing the three-dimensional (3D) fine morphology within various organs and tissues at submicron resolution with little deformation is highly desired for understanding organ functions and finding treatments for diseases. Optical microscopy is a suitable tool for mesoscopic tissue imaging with subcellular resolution. However, absorption and scattering due to complex tissue components limit the imaging depth to hundreds or even tens of microns; this further hinders the acquisition of whole-organ data. To address this issue, various optical clearing technologies (Dodt et al., 2007; Richardson and Lichtman, 2015) have been introduced to achieve tissue transparency and extend the imaging depth of light-sheet microscopy to intact rodent organs (Pan et al., 2016; Qi et al., 2019) and even the whole body (Cai et al., 2019; Pan et al., 2016; Treweek et al., 2015) at a low resolution. However, tissue shrinkage (Jing et al., 2018; Pan et al., 2016) or expansion (Susaki et al., 2014) caused by clearing reagents introduce inevitable morphological distortion (Ueda et al., 2020a, 2020b). Moreover, residual scattering and absorption due to imperfect clearing result in the potential deterioration of the imaging quality in deep tissues (Weiss et al., 2021). This phenomenon is more prominent in some organs, such as the liver and heart, which limits the use of optical clearing. The variation in thickness of the light sheet along the propagation direction also causes resolution inhomogeneity of the light-sheet microscope while imaging large samples, which further affects the high-resolution accurate reconstruction at the organ level (Truong et al., 2011). Although tiling light-sheet microscopy (Chen et al., 2020) has achieved sub-micron voxel resolution in a small range by using an objective lens with a high numerical aperture (NA) and long working distance, it fails to achieve the same resolution in the whole organ range.
Another strategy is to combine tissue cutting techniques to overcome the limitations of imaging depth. Vibration cutting coupled with elastic agarose (Jiang et al., 2017; Ragan et al., 2012; Seiriki et al., 2017) or gelatin (Economo et al., 2016) embedding has been used in whole-brain imaging. Because agarose only surrounds the sample in the periphery rather than permeating into the sample, it is easy to cut uneven sections in a cavity or tubular structure during imaging, resulting in potential local data loss (Spencer et al., 2012). Gelatin embedding overcomes this problem by penetrating the tissue; however, owing to its extremely soft texture, it is prone to distortion during cutting and requires redundant axial data acquisition for 3D registration (Economo et al., 2016). Alternatively, ultrathin cutting coupled with stiff resin embedding allows high-resolution 3D imaging by maintaining the block-face imaging on the top surface of the sample (Gong et al., 2016; Li et al., 2010; Wang et al., 2021; Zhong et al., 2021b). This approach also causes deformation of the tissue to some extent due to resin polymerization (Yang et al., 2013). Therefore, high-resolution volumetric imaging methods with wide adaptability to the different structural characteristics and components of various organs have not yet been reported.
Freezing embedding provides an alternative, cryopreservation method to harden soft tissue without obvious tissue deformation. Cryo-micro-optical sectioning tomography (cryo-MOST) has been able to detect the endogenous fluorescence of senile plaques in the whole mouse brain immersed in liquid nitrogen (Luo et al., 2017). However, the imaging environment at temperatures below −100°C increases the difficulty in automatic operation and causes the system to image at large intervals. Alternative methods of imaging samples stored at minus tens of degrees Celsius were developed using commercial compressor refrigeration. In addition to the negative effect of low temperature on the objective lens, this cooling method causes potential vibration interference in microscopic imaging. To solve these issues, a simple solution of using a Nikon 200 mm lens was applied to the cryo-imager to capture a single field of view with a lateral resolution of 40 × 40 μm to photograph the intrinsic fluorescence of NADH and FAD in the frozen organ at −40°C (Ranji et al., 2016). The Case cryo-imaging system was equipped with a stereoscope with a long-working-distance (approximately 70 mm) objective lens with adjustable magnification to improve and adjust the resolution of cryo-imaging (Roy et al., 2009). The whole-body imaging was performed with a NA of 0.036 at a pixel resolution of 15 μm and sectioning thickness of 40 μm, or local range-of-interest imaging was performed with NA of 0.11 at an imaging resolution of 3.1 μm. In addition, these cryo-imaging systems have a large depth of imaging and require computational removal of background fluorescence (Krishnamurthi et al., 2010; Steyer et al., 2009). Therefore, optical sectioning cryo-imaging with submicron resolution is still highly desired to acquire the 3D fine structures of various cryo-preserved whole organs.
In this study, we developed a cryo-fluorescence micro-optical sectioning tomography (cryo-fMOST) method to acquire organ-wide fluorescent 3D structural data with submicron voxel resolution. The key problem is achieving high-resolution volumetric imaging of the frozen samples, which involves three challenges. A microscopic imaging system with appropriate imaging resolution and throughput, as well as sufficient working distance, should be designed. The system should maintain the frozen state of the sample to retain the original structure of the sample, enable it to withstand cryo-sectioning, and avoid potential extra-vibration interference with submicron-resolution microscopic imaging. In addition, the application of high resolution requires a short working distance of the objective with high NA; therefore, we need to determine how to keep the objective safe from the cryogenic imaging environment for a long time. To overcome these issues, we developed a 3D cryo-fMOST system. It consists of a strip scanning microscope with multiline detection, ceramic knife-based cryo-microtome, refrigeration module, and heat insulation device. Our method has several technical advantages over previous whole-organ imaging methods. In contrast to the light-sheet microscopy, we keep imaging on the top sample surface to ensure the consistency of resolution throughout the whole organ. Compared with previous tissue processing before imaging, cryopreservation is more suitable for different organs, with good morphological and biochemical preservation. We have significantly improved the imaging clarity, data quality, and system stability as well as reliability of the cryo-imaging technology. We achieved optical sectioning in the cryo-imaging by adopting high-throughput strip scanning imaging, vibration-free freezing in the sample tank by developing a cascade refrigeration module, and continuous high-resolution imaging in a low-temperature imaging environment by solving the thermal insulation of objective lens with millimeter working distance. To characterize the imaging performance and applicability of the system, we imaged fluorescent beads and different types of biological organs, including the mouse tongue, kidney, heart, and brain. Furthermore, we demonstrated the compatibility of our system with potential omics measurements by manually collecting imaged brain slices and subsequently performing fluorescence in situ hybridization (FISH) and sugar phosphates determination.
Results
Principle of 3D cryo-imaging
We propose a cryo-imaging pipeline, as shown in Figure 1A. The excised intact organ is embedded using optimal cutting temperature (OCT) compound (Sakura Finetek USA.Inc, USA) and rapidly frozen to preserve the original microstructure in the organ as much as possible. We developed the cryo-fMOST system for volumetric imaging of the whole frozen organ at submicron voxel resolution. Subsequently, we performed data processing, feature structure segmentation, and visualization of the 3D dataset of the whole organ.
Figure 1.

Cryo-fMOST
(A) Schematic of the cryo-fMOST pipeline.
(B) Resolution measurement.
(C) Temperature measurement of the sample tank with the single- (red solid line), two- (blue dotted line), and three-stage (black dashed line) refrigeration. (n = 3, mean ± SD).
(D) Real-time temperature measurement at the sleeve (red solid line) and base (blue dashed line) in the refrigeration process from 22 to −17°C. In addition, see Figures S1–S4. (n = 3, mean ± SD).
To evaluate the imaging performance of the cryo-fMOST system, we imaged two types of 200-nm-diameter fluorescent beads (F8811, excitation: 505 nm/emission: 515 nm; F8810, excitation: 580 nm/emission: 605 nm, Thermo Fisher Scientific, USA). The lateral and axial scanning steps were 0.32 and 0.40 μm, respectively. The experiments were conducted using the line confocal mode and DSM. We randomly chose five separate beads and calculated the FWHMs of the intensity profiles for each channel, as shown in Figure S4. In the line confocal mode, the FWHMs in the X, Y, and Z directions of the green channel were 0.61 ± 0.02, 0.73 ± 0.02, and 3.61 ± 0.02 μm, respectively (Figures 1B and Figure S4), whereas those of the red channel were 0.64 ± 0.01, 0.82 ± 0.01, and 4.27 ± 0.01 μm, respectively (Figure S4A). The resolution in the X-direction was higher than that in the Y-direction because the linear beam was focused along the X-direction (Dusch et al., 2007). In addition, multi-line detection by the subarray mode of the camera allows the generation of flexible optical sectioning results using different imaging modes according to experimental requirements, such as digital structured modulation (DSM) (Zhong et al., 2021a), line-illumination modulation (LiMo) (Zhong et al., 2021b), hybrid illumination (HiLo) (Qiao et al., 2021), and time delay integration (TDI) (Yang et al., 2015). In the DSM mode, the FWHMs in the X, Y, and Z directions were 0.81 ± 0.01, 0.70 ± 0.03, and 3.35 ± 0.03 μm, respectively, whereas those of the red channel were 0.90 ± 0.01, 0.80 ± 0.02, and 3.68 ± 0.01 μm, respectively (Figure S4B). The nonlinear effect of the DSM reconstruction algorithm results in a slightly lower resolution in the X-direction than in the Y-direction. Both imaging modes have similar Y resolutions owing to the negligible modulation effect of the line illumination in this direction (Thomas et al., 2013). The DSM has better axial resolution than the line confocal mode, which is consistent with previous studies (Langhorst et al., 2009; Neil et al., 1997).
After imaging, the frozen sample was moved toward a ceramic knife to cut the imaged part and expose the underlying surface. The imaging and cutting were repeated alternately until the entire dataset was acquired. To provide a freezing environment for tissue cutting and shape preservation, we developed a three-stage cascade refrigeration module for cooling the sample tank (Figure S2). The refrigerated sample tank was made of aluminum alloy (Al 6061) owing to its high thermal conductivity of 150 W/m3·K; this enables fast heat transfer between the cooling and imaging environments. Thermoelectric cooling (semiconductor refrigeration) is employed to cool the sample tank in the first-stage refrigeration. Six thermoelectric cooler (TEC) chips (TEC2-127-70-09, Thermonamic, China) are symmetrically installed on both sides of the sample tank to form the primary cooling stage. This approach has the advantages of fast and precise cooling control, high reliability, and almost no extra vibration. Two other coolers are cascaded into the cooling cycle. The secondary cooling stage employs water circulation to cool the hot sides of the TECs. In the third cooling stage, a couple of TEC units (TECC-HL-340W-24-1, Thermonamic, China) are installed on both sides of the water circulation to cool the water. This method provides sufficient refrigeration efficiency. The designed working temperature ranged from −10 to −30°C, similar to the working conditions of conventional cryostats, for example, Leica CM1860. To test the performance of the refrigeration module, we cooled down the systems with the single-stage (the TEC array), two-stage (plus the water circulation), and three-stage (plus the TEC unit) cascade refrigeration from 22°C and measured the real-time temperature of the sample tank (Figure 1C). The results showed that the system reached the lowest temperatures of approximately 10°C, −6.5°C, and −38°C, respectively, for the three refrigeration systems. Note that temperature rebounds occur in the single- and two-stage refrigeration when they reach the lowest temperature because the cooling capacity is insufficient to remove the heat generated in time. Three-stage cooling enables us to cover our designed temperature range. The 7-mm working distance of the objective lens allows enough space to further design a heat insulation device to enable the objective lens to function properly (Figure S3). Then, we cooled the sample tank from 22°C to −17°C and measured the temperature of the sleeve and the base (Figure 1D). It took approximately 18 min for the base to reach −17°C, whereas the sleeve was stabilized at 18.3°C, which is consistent with the simulation results.
Furthermore, we designed a heat insulation device for the objective. The device consists of a slide, base, insulating layer, and sleeve (Figure S3A). The slide is attached at the bottom of the base to prevent air convection from the freezing environment and acts as an imaging window. Both the base and sleeve are made of Al 6061 to act as thermostats. The base is in contact with the sample tank to maintain the freezing temperature, and the sleeve is in contact with the ambient environment to maintain the room temperature. Between them is an insulating layer made of polyurethane to form a stable temperature field and prevent temperature change of the base and sleeve. The thickness of the polyurethane layer was determined through thermal simulation based on the assumption that the temperature of the ambient environment and the sample tank were 22°C and −17°C, respectively (Figure S3B). In this case, the side and bottom thicknesses were set to 29 mm and 4 mm, respectively. We modeled the mechanical parts of the heat insulation device using SolidWorks 2017 software (Dassault Systèmes, Vélizy-Villacoublay, France) and performed thermal analysis using the simulation module in the software.
Imaging muscular distribution of the whole tongue
To evaluate the feasibility of imaging dense muscular organs, we performed cryo-fMOST imaging of the B6 ACTb-EGFP mouse tongue. The 3D reconstructed tongue tissue with a volume size of 3.38 × 3.64 × 9.43 mm3 is shown in Figure 2A. A total of 3,142 coronal images with 21,765 strips were acquired. The acquisition time was approximately 26.8 h, and the dataset size was approximately 1.63 TB. Figures 2B and 2C show the reconstructed sagittal and transverse planes, respectively, and Figure 2D presents the original coronal plane. These results demonstrate that our system enables us to achieve consistent imaging resolution and contrast in the whole organ. All four types of intrinsic muscles are identified in each anatomical orientation, namely the superior longitudinal muscle (SLM), inferior longitudinal muscle (ILM), vertical muscle (VM), and transverse muscle (TM) (Aoyagi et al., 2015). These muscles are symmetrically distributed on both sides of the tongue, and the tightly arranged muscle fibers are well defined. Our imaging resolution and contrast allow tensor analysis for labeling the fiber orientations, as shown on the right side in Figure 2D. The different types of muscles are almost perpendicular and interlaced with each other, as shown in the 3D reconstructed cube with the high contrast visibility in Figure 2E; this demonstrates that the system achieves good cutting regardless of whether it is bundles or lamellae as functional units in the muscles. Acquiring the arrangement pattern of the muscle fibers is helpful to understand the actions and functions of the tongue in swallowing, pronunciation, and other functions. The enlarged view of a TM indicated by the white rectangle in Figure 2D shows that the submicron resolution of cryo-fMOST allows distinguishing the sarcomeres with a period of approximately 2 μm, as shown in Figure 2F. The genioglossus muscle (GM) (Aoyagi et al., 2015) is also shown in Figures 2B–2D. This extrinsic muscle originates from the bones and extends to the bottom of the tongue, forming a fan shape in the sagittal plane (Figure 2B). Cryo-fixation preserved the spatial position of the GM without obvious deformation despite the lack of peripheral tissue support. A pair of lingual arteries is also shown in the coronal plane in Figure 2D (Goździewska-Harłajczuk et al., 2018). In the corresponding enlarged view shown in Figure 2G, the round-shaped lingual artery is surrounded by the VMs. These results demonstrate that cryo-fMOST potentially quantifies the 3D distributions and directions of intricate muscle fibers and vessels in the whole-organ range. We also imaged another mouse tongue in the transverse plane. A total of 1,320 transverse images with 11,456 strips were acquired using the same acquisition parameters. The data size of 1.5 TB implies that the two samples have similar volumes, but the total acquisition time in the transverse plane was shortened to 19 h because of the longer imaging strips and fewer cutting layers than in the coronal plane.
Figure 2.

Imaging of the B6 ACTb-EGFP mouse tongue
(A) 3D rendering of the whole tongue.
(B and C) Reconstructed middle sagittal and transverse images; scale bars: 1 mm. (D) Acquired middle coronal image. The color-coded tensor image is on the left half; scale bar: 1 mm.
(E) Reconstructed 3D data block corresponding to the white cube in (A) to show intricate muscle orientations.
(F and G) Enlarged views of the corresponding white rectangles in (D); scale bars: 10 (F) and 20 (G) μm. SLM: superior longitudinal muscle; VM: vertical muscle; TM: transverse muscle; ILM: inferior longitudinal muscle; GM: genioglossus muscle; LA: lingual artery. D-V, dorsal-ventral; A-P, anterior-posterior; L-R, left-right. The experiment was repeated two times with similar results.
Imaging microstructures of the whole kidney
To verify the ability to image a hydrated substantial organ, we first imaged the whole frozen kidney of the mT/mG mouse using cryo-fMOST. The entire dataset was approximately 1.5 TB, and the total acquisition time was approximately 17.8 h for 1,336 slice images at steps of 3 μm and 668 cuttings at a sectioning thickness of 6 μm. Figure 3A presents the original frontal image of the kidney with a voxel resolution of 0.32 × 0.32 × 3 μm3. Various regions of the kidney were demarcated according to differences in the fluorescent signal intensity and microstructural morphology. The cortex (COR), outer stripe of the outer medulla (OSOM), inner stripe of the outer medulla (ISOM), and inner medulla (IM) are separated and marked by yellow dotted lines (Figure 3A). Figures 3B–3E show the enlarged views of the corresponding white rectangles in each region in Figure 3A. Typical anatomical microstructural features, such as the glomerular tuft (GT), Bowman’s space (BS), renal corpuscle (RC), renal tubule (RT), artery, and vein in the cortex are visible in the enlarged view in Figure 3B. The artery and vein are distinguished by the difference in their contour feature; the vein has a larger diameter with a thinner vascular wall than the artery (dela Paz and D’Amore, 2009). The wall thicknesses of the artery and vein indicated by the arrows in Figure 3B were 7.1 and 1.3 μm, respectively. Similarly, specific microstructures can be observed in specific anatomical regions (Martha A. Delaney et al., 2018), such as medullary rays (MRs) in the OSOM (Figure 3C), vascular bundle (VB), and Henle’s loop (HL) in the ISOM (Figure 3D), and collecting ducts (CDs) in the IM (Figure 3E). The high resolution of our cryo-imaging allows us to measure the VB with a wall thickness of 1.7 μm. Figure 3F presents the reconstructed transverse section image, which is divided into three different anatomical regions. The microstructures, such as the GT and artery in the cortex, are shown in the inset, similar to Figure 3B. We further performed a 3D rendering of the whole kidney with a volume size of 5.94 × 4.01 × 10.06 mm3, as shown in Figure 3G. The transverse section indicates the position illustrated in Figure 3F. Micron-level imaging resolution and optical sectioning allow us to trace, reconstruct, and quantify the fine structures in 3D. We traced the artery indicated in the inset of Figure 3F and its adjacent microstructures with a volume size of 2.8 × 1.7 × 0.6 mm3. The enlarged view in Figure 3H shows the 3D reconstruction of the artery (red), two GTs (golden), and a proximal convoluted tubule (PCT) (purple) near the starting position of the tracing. The diameters of the artery and PCT are 49.7 and 29.6 μm, respectively. We also show another segment of the artery in a volume of 800 × 800 × 600 μm3 in Figure 3I. Ten GTs are distributed around the artery with an average diameter of 81.5 ± 8.8 μm and an average volume of 2.93 × 10⁵ ± 1.06 × 105 μm3. One adjacent vein is located close to the artery. We automatically identified and counted the kidney-wide GT distributions. The total number of GTs was 14,489, agreed with previous studies (Cary et al., 2012; Edwin J et al., 2016; IngaMurawski et al., 2010; Klingberg et al., 2017) (Video S1). Both the diameter and volume of the glomerulus show a Gaussian distribution. The maximum and minimum diameters were 134.6 and 37.0 μm, respectively. The maximum and minimum volumes were 1277.690 × 103 and 26.460 × 103 μm3, respectively. The median volume is 237.636 × 103 μm3, agreed with the result measured by stereology (Edwin J et al., 2016). For comparison, the median measured glomerular volume for cleared kidneys was 80 × 103 μm3. This difference is due to the sample volume shrinkage caused by the optical clearing (Klingberg et al., 2017). This quantitative visualization of the 3D organizations and positions of fine microstructures in the whole organ potentially facilitates systematic studies of the structural and functional interrelation of the collecting ducts, renal tubules, and blood vessels in the healthy and diseased whole kidneys. In combination with disease models, we have the potential to more systematically and objectively capture and analyze glomerular morphological changes in different diseases, which is of great significance for understanding kidney function and promoting the development of nephrology.
Figure 3.

Imaging of the whole mT/mG mouse kidney tissue expressing tdTomato fluorescent protein
(A) Typical frontal section image. OSOM: outer stripe of the outer medulla; ISOM: inner stripe of the outer medulla; IM: inner medulla; scale bar: 1 mm.
(B–E) Enlarged views of the corresponding white squares in (A). GT: glomerular tuft; BS: Bowman’s space; RC: renal corpuscle; RT: renal tubule; MR: medullary ray; VB: vascular bundle; HL: Henle’s loop; CD: collecting duct; scale bar: 50 μm.
(F) Reconstructed transverse image and an inset showing the enlarged segment of the cortex, corresponding to the white rectangle in the main image; scale bars: 1 mm and 100 μm, respectively.
(G) 3D rendering of the whole kidney with a local microstructural network reconstructed along the artery indicated in the inset of (F).
(H) Enlarged view of a partially reconstructed nephron at the starting position of the tracing in (G). PCT: proximal convoluted tubule.
(I) Enlarged view of the corresponding data block in (G). The experiment was repeated three times with similar results.
Visualizing anatomical microstructure of the healthy and infarcted whole hearts
To demonstrate the ability of cryo-fMOST to image hollow organs, we also imaged the whole heart of another mT/mG mouse at a voxel resolution of 0.32 × 0.32 × 3 μm3 (Figure 4). Cardiac cells were labeled with the tdTomato fluorescent protein. A total of 1,138 slices were cut at a thickness of 6 μm, and 2,276 sagittal sections were imaged in the line confocal mode. The total data acquisition time was approximately 44 h, and the entire dataset size was approximately 3.5 TB. The 3D rendering of the whole heart and its sagittal images with an interval of 1.2 mm are shown in Figure 4A; the images demonstrate that the cutting and imaging quality of our system is very stable and consistent. The total size of the heart was approximately 8.84 × 6.76 × 6.83 mm3. The integrity of the ventricles indicates that both cryo-fixation and cryo-cutting are suitable for the preservation of hollow structures. It is observed that the PM in the left ventricle (LV) is well preserved in different sections., and this indicates that cryo-fixation enhances the stiffness of the dangled soft tissues for tolerating cryo-cutting. Figure 4B shows an enlarged view of the corresponding white rectangle in the middle sagittal image (Z = 3.3 mm) in Figure 4A. Owing to the high resolution and contrast, we could identify the cardiomyocytes (CMs) in two directions as dots (white arrowhead) and strips (white arrow) in the cross-section, as shown in Figure 4B; this demonstrates that the cardiomyocytes are approximately cylindrical, which is consistent with a previous study (Bensley et al., 2016). Cellular bridges (white arrows) with a thickness of 3.5 μm were observed to crosslink the CMs in Figure 4C. We further distinguished the vascular walls for not only the big arteries, indicated by the blue arrows in Figure 4B, but also the small arteries with a wall thickness of 2 μm enlarged in Figures 4D and 4E. These high-quality data provide the potential to trace and reconstruct complex vascular architectures with multiple grade branches, as shown in Figure 4F. We identified the septal artery (SA) between the ventricles and adjacent major vessels. The arterial diameters of the five branches indicated by the white arrowheads are approximately 210, 188, 158, 141, and 96 μm, respectively. The diameter of the vessel ends was approximately 7 μm.
Figure 4.

Imaging of the mT/mG mice hearts
(A) 3D rendering and sequential sagittal images at equal intervals of 1.2 mm; scale bar: 2 mm. LV: left ventricle, PM: papillary muscle.
(B) Enlarged view of the corresponding white rectangle in (A). CM: cardiomyocytes; scale bar: 100 μm.
(C–E) Enlarged views of the corresponding white rectangles in (B); scale bar: 10 μm. Arrows in (C) indicate cellular bridges.
(F) Volumetric reconstruction of the healthy heart and major coronary vessels. Ao: aorta; RCA: right coronary artery; LCA: left coronary artery; SA: septal artery; LC: left circumflex branch; AI: anterior interventricular branch; LAD: left anterior descending; PC: proximal left collateral. The experiment was repeated three times with similar results.
(G) Volumetric reconstruction of the MI heart and major coronary vessels. Insert shows the image of the section indicated by the white arrowheads in (G). Scale bar: 1 mm in the insert.
(H) Enlarged 3D reconstruction view of the major vessels in the corresponding white cube in (G). CA: collateral artery. Yellow and purple vessels represent the infarcted and collateral arteries, respectively.
(I–L) Enlarged views of the sections of the pre-ligation, ligated, post-ligation, and collateral arteries, respectively. The white arrows indicate the locations of the corresponding arteries. The dotted circle indicates the ligated artery. Scale bar: 50 μm.
Furthermore, we performed myocardial infarction (MI) in a 10-week-old mT/mG mouse and imaged the heart five weeks later, as shown in Figure 4G. The volume of the infarction area is about 14.43 mm³. We traced the major vessels and found the ligated artery with a length of 0.51 mm was completely infarcted (enlarged in Figure 4J). In contrast, the diameters of the preligation and postligation arteries were 59.3 and 17.5 μm (enlarged in Figures 4I and 4K). Fortunately, we also observed a collateral artery (CA) with a length of 2.53 mm bridging the ligated artery and a neighboring artery (Figures 4G, 4H, and 4J). Three-dimensional whole-organ imaging allows us to identify this vessel subtype by its only defining feature from 3D tracing; this is difficult to achieve in traditional tissue sections (Das et al., 2019). We observed that the fluorescence intensity of the cardiomyocytes in the MI area was significantly lower than that in other parts (the inset of Figures 4G and Figures 4I, 4K, and 4L), whereas there was no recovery of the fluorescence intensity of the cardiomyocytes near the CA (Figure 4J). These results indicate that the establishment of collateral circulation may only restore vascular transport, but not reverse the damaged cardiomyocytes. These results demonstrate that cryo-fMOST is capable of providing a quantitative volume of view with the detailed microstructures of whole hollow organs in an anatomical context.
Imaging specific neuron distribution of the mouse brain and compatibility with sugar phosphates determination and mRNA assay
To demonstrate the ability of imaging soft tissue, we imaged the Thy1-GFP line M mouse right brain (Feng et al., 2000) in the line confocal mode. A total of 693 sections were cut at a thickness of 12 μm, and four continuous images were acquired before each cutting action. It took approximately 28.5 h to collect the whole right-brain dataset with a size of 2.1 TB. Figure 5A presents nine maximum intensity projection (MIP) coronal images with a thickness of 300 μm at intervals of approximately 1 mm. Typical brain regions can be identified easily. There was no significant deformation of the ventricles, unlike in resin-embedding-based 3D imaging. The midbrain and its surrounding tissue in the last image in Figure 5A also remained in their relative positions and did not separate as agarose-embedding-based 3D imaging. To verify the imaging performance between different modes, Figure 5B shows a DSM image containing the enlarged view of the selected coronal image indicated by the white rectangle in Figure 5A. The DSM image had a lesser background and higher contrast than the line-confocal image. Enlarged views of the corresponding white squares in Figure 5B with different imaging modes are shown in Figure 5C. These results further demonstrate that the DSM has better background suppression with sharper and clearer neuronal somata and fibers than the line confocal mode. The normalized intensity profiles along the corresponding colored lines in Figure 5C are shown in Figure 5D. The FWHMs of the dendrite are 3.01 and 1.58 μm in the line confocal and DSM images, respectively. The signal-to-background ratios of this neural fiber are 5.6 and 16.1 in the line confocal and DSM images, respectively. The results indicate that our method is suitable for the visualization of complex multi-component organs and provides the flexibility to adjust the optical sectioning capability according to the regions and features of interest.
Figure 5.

Imaging results of a Thy1-GFP line M mouse brain
(A) MIP of 300 μm brain sections at intervals of approximately 1 mm; scale bar: 1 mm.
(B) Reconstructed DSM image corresponding to the white rectangle in (A); scale bar: 1 mm.
(C) Enlarged views with different imaging modes of the corresponding white squares in (B); scale bar: 50 μm.
(D) Normalized intensity profiles along the corresponding color lines in (C). CTX: cerebral cortex; cc: corpus callosum; fx: columns of the fornix; ac: anterior commissure; fi: fimbria; HPF: hippocampal formation; BLA: basolateral amygdalar nucleus. The experiment was repeated three times with similar results.
Sugar phosphates play an important role in organisms by taking part in energy and central carbon metabolism as the intermediates (Huck et al., 2003). To demonstrate the potential for compatibility with sugar phosphates determination, we manually collected several imaged hippocampal slices during the abovementioned experiment. The imaged slices are the 471–472nd, 474–475th, 477–478th, and 480–481st tissue slices of the right brain, and the in situ images are the 1,881–1,888th, 1,893–1,900th, 1,905–1,912nd and 1,917–1,924th images in the right brain dataset. Two consecutive slices were performed sugar-phosphate isomers detection by isotope chemical labeling combined with reversed-phase (RP) liquid chromatography−mass spectrometry (LC-MS) strategy (Li et al., 2022); one was measured directly, and the other was measured after tissue clearing. Besides, the left brain was cut by the cryostat (CM3050S, Leica, Germany) with a thickness of 12 μm, and several corresponding hippocampal slices were collected manually. All detected results are shown in Figures 6, and 9 metabolic intermediate sugar phosphates are detected, including trehalose 6-phosphate (T6P), D-glucose 6-phosphate (G6P), D-glucose 1-phosphate (G1P), sedoheptulose 7-phosphate (S7P), D-fructose 6-phosphate (F6P), D-mannose 6-phosphate (M6P), D-ribose 5-phosphate (R5P), D-ribulose 5-phosphate (Ru5P), and D-xylulose 5-phosphate (Xu5P). Inositol 1-phosphate (In1P) that an isomer of G6P is also detected. All target analysts can be detected in original slices, with In1P the most and Ru5P the least. Slices dealt with tissue clearing are detected with significantly little or none, which demonstrates that tissue clearing cannot preserve small molecules of sugar phosphates. The similar detected results of right and left brain original slices indicate that the sugar phosphates are preserved during long time cryo-imaging. These results show that the slice collected from the cryo-fMOST system is compatible with the sugar phosphates determination, suggesting the potential for tissue metabolic analysis.
Figure 6.

Ten targeted metabolic intermediates detection results of left and right brain slices with or without dealing with tissue clearing
OSLB, original slices of the left brain; TCSLB, tissue clearing slices of the left brain; OSRB, original slices of the right brain; TCSRB, tissue clearing slices of the right brain. (n = 4, min to max).
Finally, to further verify the potential for compatibility with mRNA assay, we manually collected an imaged hippocampal slice from the right brain and performed FISH imaging. FISH imaging of camkII2α mRNA was performed using the carboxytetramethylrhodamine (TAMRA) dye. The in situ image is shown in Figure 7A. The imaged slice is the 442nd tissue slice of the right brain, and the in situ images are the 1,765–1,768th images in the right-brain dataset. Figure 7B shows the enlarged in situ and slice views and their merged image for the corresponding white squares in Figure 7A. The results demonstrate that although inevitable deformation was introduced during manual slice collection, the cells of interest were precisely located via the registration between the slice image and the corresponding in situ image. Figure 7C presents the views of the slice hippocampus for the regions marked by the corresponding white rectangles in Figure 7A; the blue/green/red channels and their merged result are depicted. Figure 7D shows the enlarged views of the corresponding white rectangles in Figure 7C. The relative positions of neurons (GFP), nuclei (DAPI), and camkII2α genes (FISH) are clarified in the merged image. The insets in Figure 7D demonstrate that the spatial distribution of the camkII2α gene expression covers several DAPI-stained nuclei, and one of them is a GFP-labeled pyramidal neuron. These results show that the slice collected from the cryo-fMOST system is compatible with the FISH assay, suggesting that the RNA is preserved via a series of workflow processes.
Figure 7.

FISH imaging of a brain slice
(A) Image of the slice in situ image by cryo-imaging; scale bar: 1 mm.
(B) Registration of the enlarged views of the corresponding squares in (A); scale bar: 500 μm (20 μm in the inset).
(C) Three color images and their merged image of the slice hippocampal structure enlargement corresponding to the white rectangle in (A); scale bar: 500 μm.
(D) Partial enlargement of the corresponding white rectangles in (C); scale bar: 100 μm (10 μm in the inset). The experiment was repeated three times with similar results.
Discussion
We developed cryo-fMOST to achieve volumetric imaging and visualization of fine anatomical details in various frozen whole organs without obvious deformation. The accurate recognition of micron-scale microstructures, such as sarcomeres and vessel walls, demonstrates the submicron resolution of the imaging module and the vibration-free operation of the in-house sample tank refrigeration system. The working temperature of approximately −20°C in the sample tank is suitable for maintaining a variety of complex morphological microstructures in different organs. Approximately 44 h of continuous data acquisition for the mouse heart demonstrates that the heat insulation device allows the objective lens to work normally close to the low-temperature imaging environment for a long time. Our method shows broad applicability to various types of muscular, hydrous, tubular, or cavity organs and tissues and potentially for the whole body. Our system is capable of two-color imaging, although only single-fluorescence-labeled organs are shown in each experiment. Even so, the submicron resolution still enables us to distinguish between different fine anatomical microstructures in these results. By combining multiple fluorescent labels, our system is expected to demonstrate the simultaneous acquisition and visualization of multiple structures of interest.
Frozen sample processing is very simple and easy to use. It has good adaptability to various organs, different with clearing treatment. The diversity of our results also shows that our method applies to the samples with or without paraformaldehyde (PFA) fixation. Unlike existing high-resolution whole-brain imaging techniques that use resin or agar embedding, our frozen embedding and cryo-fMOST imaging better preserves the original biochemical information and is compatible with subsequent omics measurements. In particular, the compatibility of mouse brain imaging with subsequent sugar phosphates determination verifies our method complements the deficiencies of optical clearing in the detection of small molecules such as lipids and metabolites. To further optimize the freezing fixation protocols for various omics measurement, cryo-fMOST can be potentially combined with RNA sequencing and mass spectrometry to provide a new research tool for spatial multi-omics mapping in the future.
We showed consistent high resolution and excellent morphology preservation of the whole-organ dataset in different organs; this is very important for quantitative analysis of the fine morphology and organ-wide distribution of the functional units of the whole organs. Our results of the accurate segmentation and reconstruction of the glomerulus are closer to the true values, compared with the additional shrink deformation introduced by optical clearing in the previous study (Klingberg et al., 2017); this indicates our potential for acquiring quantitative morphological and distribution changes of basic functional units for the study of nephrology and other diseases. The heart reconstructions in mT/mG mice demonstrate our ability to detect the vascular distribution of the whole organ. This indicates that our approach combined with lineage tracing and mouse genetics has the potential to answer the important and unsolved question of how collateral circulation is established in the mouse heart and provides an important tool for related angiogenesis and repair studies. We also noticed that, due to the working distance limitation, although the same magnification is adopted, the low NA of our objective lens leads to the slight sacrifice of the imaging resolution and weak signal detection. Our method is not yet suitable for whole morphology reconstruction of single neurons, which is the most demanding application scenario of whole-brain imaging. We may achieve more detailed 3D organ-wide cryo-imaging with a higher-NA objective lens by further improving the compatibility between the objective lens and the freezing imaging environment.
In summary, our work establishes and experimentally demonstrates a versatile platform, cryo-fMOST, to visualize and reconstruct the detailed anatomical structures and maintain biochemical information of various organs. It potentially facilitates the study of the structural and omics relationship among different cells, blood vessels, or other basic functional units in specific organs, further understanding the functional mechanism of relevant organs and exploring the pathogenesis of related diseases.
Limitations of the study
Potentially the cryo-fMOST can be applied in different disease model research. Because our laboratory currently lacks pathological model mice, we only imaged an infarcted heart to validate the cryo-fMOST in cardiovascular disease abnormal structural study in the present work. But to demonstrate that cryo-fMOST is adapted to the complex structural characteristics and compatibility of various organs, we also imaged and visualized various types of muscular (tongue), hydrous (kidney), tubular, and cavity (heart) organs. In the future study, we will cooperate with researchers, pathologists, and clinicians to further study the various disease models.
STAR★Methods
Key resources table
| REAGENT or RESOURCE | SOURCE | IDENTIFIER |
|---|---|---|
| Chemicals, peptides, and recombinant proteins | ||
| Phosphate buffered saline (PBS) | Sigma-Aldrich | P4417 |
| Paraformaldehyde(PFA) | Sigma-Aldrich | 158127 |
| Diethyl pyrocarbonate (DEPC) | Sigma-Aldrich | D5758 |
| Sucrose | Sigma-Aldrich | V900116 |
| Tetrahydrofuran | Sigma-Aldrich | 401757 |
| Dibenzyl ether | Sigma-Aldrich | 33630 |
| Methanol | Sigma-Aldrich | 34860 |
| Acetonitrile | Sigma-Aldrich | 34851 |
| RNaseZapTM RNase | Thermo Fisher Scientific | 01142539 |
| Aormic acid | Sinopharm Chemical Reagent Co. | 80065518 |
| Optimal cutting temperature (OCT) compound | Sakura Finetek USA Inc. | 4583 |
| Experimental models: Organisms/strains | ||
| B6 ACTb-EGFP | Donated by the Second Military Medical University | NA |
| mT/mG | Jackson Laboratory | 007676 |
| Thy1-GFP line M | Jackson Laboratory | 007788 |
| Software and algorithms | ||
| Amira software | Thermo Fisher Scientific | http://www.fei.com/software/amira-avizo |
| MATLAB | Mathworks | https://www.mathworks.com |
| Imaris | Bitplane | https://imaris.oxinst.com |
| ImageJ | National Institutes of Health | https://imagej.net |
| LabSolutions | Shimadzu | https://shimadzu.com.au/labsolutions |
| SOLIDWORKS | Dassault Systemes | https://www.solidworks.com |
| GraphPad Prism | GraphPad Software | http://www.graphpad.com |
Resource availability
Lead contact
Further information and requests for resources and reagents should be directed to and will be fulfilled by the corresponding author, Jing Yuan (yuanj@hust.edu.cn).
Materials availability
This study did not generate new unique reagents.
Experimental model and subject details
Animals
Two adult male B6 ACTb-EGFP mice were donated by the Second Military Medical University, three adult male mT/mG mice (The Jackson Laboratory, Catalog # 007676), and an adult male Thy1-GFP line M mouse (The Jackson Laboratory, Catalog # 007788) were used in this study. The mice were kept in a 12-h light/dark cycle with food and water provided ad libitum. All the animal experiments followed procedures approved by the Institutional Animal Ethics Committees of Huazhong University of Science and Technology and Army Medical University.
Method details
3D cryo-fMOST system
A schematic diagram of the 3D cryo-fMOST system is shown in Figure S1. Considering both imaging throughput and quality, we employed a previously developed strip scanning microscope (Zhong et al., 2021a) as the imaging module and used an objective lens with a 7 mm working distance (LUCPLFLN 20×, NA = 0.45, Olympus, Japan) to adapt to the freezing imaging environment. Single-line detection of the camera applies a virtual confocal slit to inhibit the defocus background. In specific design, the light source consists of two CW diode lasers (Cobolt 06-MLD 488 nm 100 mW, Cobolt 06-DPL 561 nm 100 mW, Hübner Photonics, Germany). The two beams are coupled into a concentric beam using a dichroic mirror (DM1, LM01-503-25, Semrock, USA), and expanded by a 4f optical imaging system comprising two lenses (L1, AC050-008-A-ML, f = 7.5 mm and L2, AC254-250-A, f = 250 mm, Thorlabs, USA). Then, the illumination beam is focused by a cylindrical lens (CL, ACY254-100-A, f = 100 mm, Thorlabs, USA) to form a line illumination. The beam is focused on the sample by using a lens (L3, AC254-125-A, f = 125 mm, Thorlabs, USA), dichroic mirror (DM2, FF493/574-Di01–25×36, Semrock, USA), and an objective (LUCPLFLN 20×, NA = 0.45, Olympus, Japan). The excited fluorescence signal from the sample is collected by the objective and filtered by DM2. Then, the signal is focused by a tube lens (TL, U-TLU, f = 180 mm, Olympus, Japan) and transmitted to the detection part. The signal is split into two beams by a dichroic mirror (DM3, FF560-FDi01–25×36, Semrock, USA), filtered by two emission filters (EM1, FF01-520/28, and EM2, FF01-620/52, Semrock, USA), and then detected by two scientific complementary metal-oxide-semiconductor (sCMOS, Channels 1 and 2, ORCA-Flash 4.0, Hamamatsu, Japan) cameras. To acquire a cross-sectional image, the frozen sample is moved by a 3-axis linear motorized stage (X: XML210, Y: XMS100, Z: GTS30V, Newport, USA) to perform lateral scanning and imaging under line illumination.
Tissue preparation
The mice were anesthetized with a mixture of 2% chloral hydrate and 10% urethane. The B6 ACTb-EGFP and mT/mG mice were subsequently transcardially perfused with 0.1 M PBS (Sigma-Aldrich, USA), followed by 4% PFA (Sigma-Aldrich, USA). Then, the tongues of the B6 ACTb-EGFP mice and the hearts of the mT/mG mice were excised and post-fixed in 4% PFA at 4°C for 24 h. After fixation, the tongues and hearts were rinsed overnight at 4°C in a 0.01 M PBS solution. Next, they were dehydrated using a 30% sucrose solution until the tissue sank, and prepared for embedding. Another mT/mG mouse was transcardially perfused with 0.1 M PBS, and the kidneys were excised and prepared for embedding. The Thy1-GFP M line mouse was transcardially perfused with 0.1 M DEPC-PBS (Sigma-Aldrich, USA), followed by 4% DEPC-PFA (Sigma-Aldrich, USA). Then, the brain was excised and dehydrated in 30% sucrose solution and dealt with DEPC until the tissue sank, and then separated the brain from the raphe and prepared for embedding. The right brain was imaged by cryo-fMOST, and several imaged hippocampal slices were manually collected after about 16 h of continuous imaging. Several sections were used for FISH experiments and the remaining slices were used for sugar phosphates determination experiments. One of each consecutive two of the remaining sections was directly transferred to 0.5mL centrifuge tubes and stored at −80°C, and the other was dealt with tissue clearing before being transferred and stored. The left brain was cut by the cryostat (CM3050S, Leica, Germany) with a thickness of 12 μm, and corresponding hippocampal slices were collected manually. Left brain slices were processed in the same way as the remaining right-brain slices.
To support soft tissue for cryo-sectioning, we placed the tissues in foil molds filled with OCT. The mold was placed on liquid nitrogen for rapid freezing for approximately 5 min to solidify the OCT compound. Then, all prepared samples were stored in liquid nitrogen before use.
In the FISH experiment shown in Figure 7, all solutions used in the brain tissue preparation were dealt with 0.1% diethylpyrocarbonate (DEPC, Sigma-Aldrich, USA) to protect RNA. All experimental devices were soaked in 0.1% DEPC solution for one day and sterilized at high temperature and high pressure in advance. Before the imaging experiment, the system, the corresponding experimental devices, and supplements were wiped using RNaseZapTM RNase (Thermo Fisher Scientific, USA) and then cleaned with ethyl alcohol. Oligonucleotide and fluorophore-tagged oligonucleotides were synthesized by Tianyi Huiyuan Biotech. Ltd., Wuhan, China. The slices were also stained with 4′,6-diamidino-2-phenylindole dihydrochloride (DAPI) before imaging.
Tissue clearing
Left and right brain slices collected were dealt with 3D Imaging of solvent-cleared organs (3DISCO) strategy (Ertürk et al., 2012). Briefly, slices were immersed in 50%, 70%, 80%, 100%, and 100% solutions of tetrahydrofuran for one minute, and then immersed in dibenzyl ether for one minute. Finally, the slices were transferred to 0.5 mL centrifuge tubes and stored at −80 °C before sugar phosphates determination.
Sugar phosphates determination
A stable isotope chemical labeling combined with the reversed-phase (RP) liquid chromatography−mass spectrometry (LC−MS) method was used for the determination of sugar phosphates (Li et al., 2022). Every slice was directly added to 80 μL borate buffer (50 mM, pH 7) for ultrasonic extraction. And then, 10 μL 2-(diazo-methyl)-N-methyl-N-phenyl-benzamide (2-DMBA) was added for the derivatization. After the derivatization reaction, 10 μL internal standards solution (d5-2-DMBA labeled sugar phosphates standards) was added. Subsequently, the mixed solution was transferred to the injection vial for LC-MS analysis. The detection of sugar phosphates was performed on a UHPLC−ESI−MS/MS system consisting of a mass spectrometer (MS-8050, Shimadzu, Japan) and a UHPLC system (LC-30AD, Shimadzu, Japan). The LC separation was performed at 50 °C with a flow rate of 0.3 mL min−1 on a Waters ACQUITY UPLC BEH C18 Column (100 × 2.1 mm, 1.7 μm). For the separation of labeled sugar phosphates, 0.1% formic acid in H2O (A) and acetonitrile/methanol (B) was used as the mobile phases and a linear gradient with the following proportions (v/v) of solvent B was applied, 0–2 min at 5%, 2–25 min from 5 to 35%, 25–25.5 min from 35 to 90%, 25–29 min at 90%, and 29–30 min from 90 to 5%. The optimal conditions for the ionization source were as follows, ion spray voltage 4000 V, DL temperature 250 °C, heat block temperature 400°C, interface temperature 300°C, nebulizing gas 2 L min−1, drying gas 10 L min−1, and heating gas 10 L min−1. Sugar phosphates were quantified by multiple reaction monitoring (MRM). Data evaluation and instrument control were performed by LabSolutions software (version 5.97sp2, Shimadzu, Tokyo, Japan).
Adult LCA ligations
To induce MI in 10-week-old mice, we permanently ligated the left anterior descending (LAD) coronary artery (Wang et al., 2017). Briefly, under 2% isoflurane anesthesia, the LAD was sutured with 7–0 silk, 2–3 mm distal to the left atrial appendage.
Quantification and statistical analysis
MATLAB (2017a) and GraphPad Prism (7.01) were used for the graphics and statistical analysis. All data are presented as the means ± standard deviation, with the sample number n stated wherever relevant.
Acknowledgments
We thank the members of the MOST group from the Britton Chance Centre for Biomedical Photonics for their assistance in biological tissue processing, imaging, data analysis, and comments on the manuscript. We are grateful to Profs. Haohong Li and Zhihong Zhang for constructive comments and Mei Yao, Siqi Chen, and Songlin Huang for experimental help. We acknowledge support from the National Natural Science Foundation of China (81827901, 61890954) and the National Key Research and Development Program of China (2017YFA0700402). We also thank the Analytical and Testing Center (HUST) and Optical Bioimaging Core Facility of WNLO-HUST for the support in data acquisition and the director fund of the WNLO.
Author contributions
J. Y. and Q. L. conceived of and designed the study. L. D., Y. L., Y. H., J. C., and J. Y. constructed the microscopes and performed data acquisition. G. F., J. Y., and D. C. performed the tissue preparation and FISH experiment. Y. Z. performed the tissue clearing, and S. L. and Y. F. performed the sugar phosphates determination experiment. W. F., W. W., and Y. W. performed MI experiment. L. D., B. L., K. N., S. N., Z. Z., D. S., and J. Y. performed image processing and visualization and analyzed the data. L. D. and J. C. wrote the manuscript. J. Y. and Q. L. modified the manuscript.
Declaration of interests
Q. L., J. Y., L. D., and J. C. have filed patent applications based on this work.
Published: August 19, 2022
Footnotes
Supplemental information can be found online at https://doi.org/10.1016/j.isci.2022.104805.
Contributor Information
Qingming Luo, Email: qluo@hainanu.edu.cn.
Jing Yuan, Email: yuanj@hust.edu.cn.
Supplemental information
Data and code availability
-
•
Data reported in this paper will be shared by the lead contact upon request.
-
•
This paper does not report original codes.
-
•
Any additional information required to reanalyze the data reported in this paper is available from the lead contact upon request.
References
- Aoyagi H., Iwasaki S.-i., Nakamura K. Three-dimensional observation of mouse tongue muscles using micro-computed tomography. Odontology. 2015;103:1–8. doi: 10.1007/s10266-013-0131-4. [DOI] [PubMed] [Google Scholar]
- Bensley J.G., De Matteo R., Harding R., Black M.J. Three-dimensional direct measurement of cardiomyocyte volume, nuclearity, and ploidy in thick histological sections. Sci. Rep. 2016;6 doi: 10.1038/srep23756. [DOI] [PMC free article] [PubMed] [Google Scholar]
- Cai R., Pan C., Ghasemigharagoz A., Todorov M.I., Förstera B., Zhao S., Bhatia H.S., Parra-Damas A., Mrowka L., Theodorou D., et al. Panoptic imaging of transparent mice reveals whole-body neuronal projections and skull–meninges connections. Nat. Neurosci. 2019;22:317–327. doi: 10.1038/s41593-018-0301-3. [DOI] [PMC free article] [PubMed] [Google Scholar]
- Cary S., Allen K.P., Mattson D.L., Lerch-Gaggl A., Reddy S., El-Meanawy A. Prematurity in mice leads to reduction in nephron number, hypertension, and proteinuria. Transl. Res. 2012;159:80–89. doi: 10.1016/j.trsl.2011.10.004. [DOI] [PMC free article] [PubMed] [Google Scholar]
- Chen Y., Li X., Zhang D., Wang C., Feng R., Li X., Wen Y., Xu H., Zhang X.S., Yang X., et al. A versatile tiling light sheet microscope for imaging of cleared tissues. Cell Rep. 2020;33:108349. doi: 10.1016/j.celrep.2020.108349. [DOI] [PubMed] [Google Scholar]
- Das S., Goldstone A.B., Wang H., Farry J., D’Amato G., Paulsen M.J., Eskandari A., Hironaka C.E., Phansalkar R., Sharma B., et al. A unique collateral artery development Program promotes neonatal heart regeneration. Cell. 2019;176:1128–1142.e18. doi: 10.1016/j.cell.2018.12.023. [DOI] [PMC free article] [PubMed] [Google Scholar]
- dela Paz N.G., D’Amore P.A. Arterial versus venous endothelial cells. Cell Tissue Res. 2009;335:5–16. doi: 10.1007/s00441-008-0706-5. [DOI] [PMC free article] [PubMed] [Google Scholar]
- Dodt H.-U., Leischner U., Schierloh A., Jährling N., Mauch C.P., Deininger K., Deussing J.M., Eder M., Zieglgänsberger W., Becker K. Ultramicroscopy: three-dimensional visualization of neuronal networks in the whole mouse brain. Nat. Methods. 2007;4:331–336. doi: 10.1038/nmeth1036. [DOI] [PubMed] [Google Scholar]
- Dusch E., Dorval T., Vincent N., Wachsmuth M., Genovesio A. Three-dimensional point spread function model for line-scanning confocal microscope with high-aperture objective. J. Microsc. 2007;228:132–138. doi: 10.1111/j.1365-2818.2007.01844.x. [DOI] [PubMed] [Google Scholar]
- Economo M.N., Clack N.G., Lavis L.D., Gerfen C.R., Svoboda K., Myers E.W., Chandrashekar J. A platform for brain-wide imaging and reconstruction of individual neurons. Elife. 2016;5:e10566. doi: 10.7554/eLife.10566. [DOI] [PMC free article] [PubMed] [Google Scholar]
- Edwin J B., Charlton J.R., Beeman S.C., Hann B.D., Cullen-McEwen L., Pearl V.M., Bertram J.F., Wu T., Zhang M., Bennett K.M. Phenotyping by magnetic resonance imaging nondestructively measures glomerular number and volume distribution in mice with and without nephron reduction. Kidney Int. 2016;89:498–505. doi: 10.1038/ki.2015.316. [DOI] [PMC free article] [PubMed] [Google Scholar]
- Ertürk A., Becker K., Jährling N., Mauch C.P., Hojer C.D., Egen J.G., Hellal F., Bradke F., Sheng M., Dodt H.U. Three-dimensional imaging of solvent-cleared organs using 3DISCO. Nat. Protoc. 2012;7:1983–1995. doi: 10.1038/nprot.2012.119. [DOI] [PubMed] [Google Scholar]
- Feng G., Mellor R.H., Bernstein M., Keller-Peck C., Nguyen Q.T., Wallace M., Nerbonne J.M., Lichtman J.W., Sanes J.R. Imaging neuronal subsets in transgenic mice expressing multiple spectral variants of GFP. Neuron. 2000;28:41–51. doi: 10.1016/s0896-6273(00)00084-2. [DOI] [PubMed] [Google Scholar]
- Gong H., Xu D., Yuan J., Li X., Guo C., Peng J., Li Y., Schwarz L.A., Li A., Hu B., et al. High-throughput dual-colour precision imaging for brain-wide connectome with cytoarchitectonic landmarks at the cellular level. Nat. Commun. 2016;7:12142. doi: 10.1038/ncomms12142. [DOI] [PMC free article] [PubMed] [Google Scholar]
- Goździewska-Harłajczuk K., Klećkowska-Nawrot J., Barszcz K. Macroscopic and microscopic study of the tongue of the aardvark (Orycteropus afer, Orycteropodidae) Tissue Cell. 2018;54:127–138. doi: 10.1016/j.tice.2018.08.015. [DOI] [PubMed] [Google Scholar]
- Huck J.H.J., Struys E.A., Verhoeven N.M., Jakobs C., Van Der Knaap M.S. Profiling of pentose phosphate pathway intermediates in blood spots by tandem mass spectrometry: application to transaldolase deficiency. Clin. Chem. 2003;49:1375–1380. doi: 10.1373/49.8.1375. [DOI] [PubMed] [Google Scholar]
- Murawski I.J., Maina R.W., Gupta I.R. The relationship between nephron number, kidney size and body weight in two inbred mouse strains. Organogenesis. 2010;6:189–194. doi: 10.4161/org.6.3.12125. [DOI] [PMC free article] [PubMed] [Google Scholar]
- Jiang T., Long B., Gong H., Xu T., Li X., Duan Z., Li A., Deng L., Zhong Q., Peng X., Yuan J. A platform for efficient identification of molecular phenotypes of brain-wide neural circuits. Sci. Rep. 2017;7:13891. doi: 10.1038/s41598-017-14360-6. [DOI] [PMC free article] [PubMed] [Google Scholar]
- Jing D., Zhang S., Luo W., Gao X., Men Y., Ma C., Liu X., Yi Y., Bugde A., Zhou B.O., et al. Optical clearing of both hard and soft tissue organs with the PEGASOS method. Cell Res. 2018;28:803–818. doi: 10.1038/s41422-018-0049-z. [DOI] [PMC free article] [PubMed] [Google Scholar]
- Klingberg A., Hasenberg A., Ludwig-Portugall I., Medyukhina A., Männ L., Brenzel A., Engel D.R., Figge M.T., Kurts C., Gunzer M. Fully automated evaluation of total glomerular number and capillary tuft size in nephritic kidneys using lightsheet microscopy. J. Am. Soc. Nephrol. 2017;28:452–459. doi: 10.1681/ASN.2016020232. [DOI] [PMC free article] [PubMed] [Google Scholar]
- Krishnamurthi G., Wang C.Y., Steyer G., Wilson D.L. Removal of subsurface fluorescence in cryo-imaging using deconvolution. Opt Express. 2010;18:22324–22338. doi: 10.1364/oe.18.022324. [DOI] [PMC free article] [PubMed] [Google Scholar]
- Langhorst M.F., Schaffer J., Goetze B. Structure brings clarity: structured illumination microscopy in cell biology. Biotechnol. J. 2009;4:858–865. doi: 10.1002/biot.200900025. [DOI] [PubMed] [Google Scholar]
- Li A., Gong H., Zhang B., Wang Q., Yan C., Wu J., Liu Q., Zeng S., Luo Q. Micro-optical sectioning tomography to obtain a high-resolution atlas of the mouse brain. Science. 2010;330:1404–1408. doi: 10.1126/science.1191776. [DOI] [PubMed] [Google Scholar]
- Li S., Liu F.-L., Zhang Z., Yin X.-M., Ye T.-T., Yuan B.-F., Feng Y.-Q. Ultrasensitive determination of sugar phosphates in trace samples by stable isotope chemical labeling combined with RPLC–MS. Anal. Chem. 2022;94:4866–4873. doi: 10.1021/acs.analchem.2c00346. [DOI] [PubMed] [Google Scholar]
- Luo Y., Wang A., Liu M., Lei T., Zhang X., Gao Z., Jiang H., Gong H., Yuan J. Label-free brainwide visualization of senile plaque using cryo-micro-optical sectioning tomography. Opt. Lett. 2017;42:4247–4250. doi: 10.1364/OL.42.004247. [DOI] [PubMed] [Google Scholar]
- Delaney M.A., Kowalewska J., Treuting P.M. In: Comparative Anatomy and Histology. Treuting P.M., Dintzis S.M., Montine K.S., editors. Elsevier; 2018. Urinary system; pp. 229–251. [Google Scholar]
- Neil M.A., Juškaitis R., Wilson T. Method of obtaining optical sectioning by using structured light in a conventional microscope. Opt. Lett. 1997;22:1905–1907. doi: 10.1364/ol.22.001905. [DOI] [PubMed] [Google Scholar]
- Pan C., Cai R., Quacquarelli F.P., Ghasemigharagoz A., Lourbopoulos A., Matryba P., Plesnila N., Dichgans M., Hellal F., Ertürk A. Shrinkage-mediated imaging of entire organs and organisms using uDISCO. Nat. Methods. 2016;13:859–867. doi: 10.1038/nmeth.3964. [DOI] [PubMed] [Google Scholar]
- Qi Y., Yu T., Xu J., Wan P., Ma Y., Zhu J., Li Y., Gong H., Luo Q., Zhu D. FDISCO: advanced solvent-based clearing method for imaging whole organs. Sci. Adv. 2019;5:eaau8355. doi: 10.1126/sciadv.aau8355. [DOI] [PMC free article] [PubMed] [Google Scholar]
- Qiao W., Jin R., Luo T., Li Y., Fan G., Luo Q., Yuan J. Single-scan HiLo with line-illumination strategy for optical section imaging of thick tissues. Biomed. Opt Express. 2021;12:2373–2383. doi: 10.1364/BOE.419377. [DOI] [PMC free article] [PubMed] [Google Scholar]
- Ragan T., Kadiri L.R., Venkataraju K.U., Bahlmann K., Sutin J., Taranda J., Arganda-Carreras I., Kim Y., Seung H.S., Osten P. Serial two-photon tomography for automated ex vivo mouse brain imaging. Nat. Methods. 2012;9:255–258. doi: 10.1038/nmeth.1854. [DOI] [PMC free article] [PubMed] [Google Scholar]
- Ranji M., Motlagh M.M., Salehpour F., Sepehr R., Heisner J.S., Dash R.K., Camara A.K.S. Optical cryoimaging reveals a heterogeneous distribution of mitochondrial redox state in ex vivo Guinea pig hearts and its alteration during ischemia and reperfusion. IEEE J. Transl. Eng. Health Med. 2016;4:1800210–1800211. doi: 10.1109/jtehm.2016.2570219. [DOI] [PMC free article] [PubMed] [Google Scholar]
- Richardson D.S., Lichtman J.W. Clarifying optical clearing. Cell. 2015;162:246–257. doi: 10.1016/j.cell.2015.06.067. [DOI] [PMC free article] [PubMed] [Google Scholar]
- Roy D., Steyer G.J., Gargesha M., Stone M.E., Wilson D.L. 3D cryo-imaging: a very high-resolution view of the whole mouse. Anat. Rec. 2009;292:342–351. doi: 10.1002/ar.20849. [DOI] [PMC free article] [PubMed] [Google Scholar]
- Seiriki K., Kasai A., Hashimoto T., Schulze W., Niu M., Yamaguchi S., Nakazawa T., Inoue K.-i., Uezono S., Takada M., et al. High-speed and scalable whole-brain imaging in rodents and primates. Neuron. 2017;94:1085–1100.e6. doi: 10.1016/j.neuron.2017.05.017. [DOI] [PubMed] [Google Scholar]
- Spencer L., Bancroft J., Bancroft J., Gamble M. 7nd ed. Elsevier Health Sciences; 2012. Tissue Processing. Bancroft's Theory and Practice of Histological Techniques; pp. 105–123. [Google Scholar]
- Steyer G.J., Roy D., Salvado O., Stone M.E., Wilson D.L. Removal of out-of-plane fluorescence for single cell visualization and quantification in cryo-imaging. Ann. Biomed. Eng. 2009;37:1613–1628. doi: 10.1007/s10439-009-9726-x. [DOI] [PMC free article] [PubMed] [Google Scholar]
- Susaki E.A., Tainaka K., Perrin D., Kishino F., Tawara T., Watanabe T.M., Yokoyama C., Onoe H., Eguchi M., Yamaguchi S., et al. Whole-brain imaging with single-cell resolution using chemical cocktails and computational analysis. Cell. 2014;157:726–739. doi: 10.1016/j.cell.2014.03.042. [DOI] [PubMed] [Google Scholar]
- Thomas B., Momany M., Kner P. Optical sectioning structured illumination microscopy with enhanced sensitivity. J. Opt. 2013;15:094004. [Google Scholar]
- Treweek J.B., Chan K.Y., Flytzanis N.C., Yang B., Deverman B.E., Greenbaum A., Lignell A., Xiao C., Cai L., Ladinsky M.S., et al. Whole-body tissue stabilization and selective extractions via tissue-hydrogel hybrids for high-resolution intact circuit mapping and phenotyping. Nat. Protoc. 2015;10:1860–1896. doi: 10.1038/nprot.2015.122. [DOI] [PMC free article] [PubMed] [Google Scholar]
- Truong T.V., Supatto W., Koos D.S., Choi J.M., Fraser S.E. Deep and fast live imaging with two-photon scanned light-sheet microscopy. Nat. Methods. 2011;8:757–760. doi: 10.1038/nmeth.1652. [DOI] [PubMed] [Google Scholar]
- Ueda H.R., Dodt H.-U., Osten P., Economo M.N., Chandrashekar J., Keller P.J. Whole-brain profiling of cells and circuits in mammals by optical clearing and light-sheet microscopy. Neuron. 2020;106:369–387. doi: 10.1016/j.neuron.2020.03.004. [DOI] [PMC free article] [PubMed] [Google Scholar]
- Ueda H.R., Ertürk A., Chung K., Gradinaru V., Chédotal A., Tomancak P., Keller P.J. Optical clearing and its applications in neuroscience. Nat. Rev. Neurosci. 2020;21:61–79. doi: 10.1038/s41583-020-0291-5. [DOI] [PubMed] [Google Scholar]
- Wang W.E., Li L., Xia X., Fu W., Liao Q., Lan C., Yang D., Chen H., Yue R., Zeng C., et al. Dedifferentiation, proliferation, and redifferentiation of adult mammalian cardiomyocytes after ischemic injury. Circulation. 2017;136:834–848. doi: 10.1161/circulationaha.116.024307. [DOI] [PMC free article] [PubMed] [Google Scholar]
- Wang X., Xiong H., Liu Y., Yang T., Li A., Huang F., Yin F., Su L., Liu L., Li N., et al. Chemical sectioning fluorescence tomography: high-throughput, high-contrast, multicolor, whole-brain imaging at subcellular resolution. Cell Rep. 2021;34:108709. doi: 10.1016/j.celrep.2021.108709. [DOI] [PubMed] [Google Scholar]
- Weiss K.R., Voigt F.F., Shepherd D.P., Huisken J. Tutorial: practical considerations for optical clearing and imaging. Nat. Protoc. 2021;16:2732–2748. doi: 10.1038/s41596-021-00502-8. [DOI] [PMC free article] [PubMed] [Google Scholar]
- Yang T., Zheng T., Shang Z., Wang X., Lv X., Yuan J., Zeng S. Rapid imaging of large tissues using high-resolution stage-scanning microscopy. Biomed. Opt Express. 2015;6:1867–1875. doi: 10.1364/BOE.6.001867. [DOI] [PMC free article] [PubMed] [Google Scholar]
- Yang Z., Hu B., Zhang Y., Luo Q., Gong H. Development of a plastic embedding method for large-volume and fluorescent-protein-expressing tissues. PLoS One. 2013;8:e60877. doi: 10.1371/journal.pone.0060877. [DOI] [PMC free article] [PubMed] [Google Scholar]
- Zhong Q., Jiang C., Zhang D., Chen S., Jin R., Gong H., Yuan J. High-throughput optical sectioning via line-scanning imaging with digital structured modulation. Opt. Lett. 2021;46:504–507. doi: 10.1364/OL.412323. [DOI] [PubMed] [Google Scholar]
- Zhong Q., Li A., Jin R., Zhang D., Li X., Jia X., Ding Z., Luo P., Zhou C., Jiang C., et al. High-definition imaging using line-illumination modulation microscopy. Nat. Methods. 2021;18:309–315. doi: 10.1038/s41592-021-01074-x. [DOI] [PubMed] [Google Scholar]
Associated Data
This section collects any data citations, data availability statements, or supplementary materials included in this article.
Supplementary Materials
Data Availability Statement
-
•
Data reported in this paper will be shared by the lead contact upon request.
-
•
This paper does not report original codes.
-
•
Any additional information required to reanalyze the data reported in this paper is available from the lead contact upon request.