

Abstract
Purpose
Triple-negative breast cancer (TNBC) is the most aggressive subtype of breast cancer that is frequently treated with chemotherapy. However, many patients exhibit either de novo chemoresistance or ultimately develop resistance to chemotherapy, leading to significantly high mortality rates. Therefore, increasing the efficacy of chemotherapy has potential to improve patient outcomes.
Methods
Here, we performed whole transcriptome sequencing (both RNA and small RNA-sequencing), coupled with network simulations and patient survival data analyses to build a novel miRNA-mRNA interaction network governing chemoresistance in TNBC. We performed cell proliferation assay, Western blotting, RNAi/miRNA mimic experiments, FN coating, 3D cultures, and ChIP assays to validate the interactions in the network, and their functional roles in chemoresistance. We developed xenograft models to test the therapeutic potential of the identified key miRNA/proteins in potentiating chemoresponse in vivo. We also analyzed several patient datasets to evaluate the clinical relevance of our findings.
Results
We identified fibronectin (FN1) as a central chemoresistance driver gene. Overexpressing miR-326 reversed FN1-driven chemoresistance by targeting FN1 receptor, ITGA5. miR-326 was downregulated by increased hypoxia/HIF1A and ECM stiffness in chemoresistant tumors, leading to upregulation of ITGA5 and activation of the downstream FAK/Src signaling pathways. Overexpression of miR-326 or inhibition of ITGA5 overcame FN1-driven chemotherapy resistance in vitro by inhibiting FAK/Src pathway and potentiated the efficacy of chemotherapy in vivo. Importantly, lower expression of miR-326 or higher levels of predicted miR-326 target genes was significantly associated with worse overall survival in chemotherapy-treated TNBC patients.
Conclusion
FN1 is central in chemoresistance. In chemoresistant tumors, hypoxia and resulting ECM stiffness repress the expression of the tumor suppressor miRNA, miR-326. Hence, re-expression of miR-326 or inhibition of its target ITGA5 reverses FN1-driven chemoresistance making them attractive therapeutic approaches to enhance chemotherapy response in TNBCs.
Keywords: TNBC, miRNA-mRNA network, Chemoresistance, miR-326, Fibronectin, Integrin, Hypoxia, ECM stiffness
Introduction
Breast cancer is the leading cause of cancer deaths among women worldwide [1]. Triple-negative breast cancer (TNBC) represents 15–20% of all breast cancers and is a heterogeneous disease that is molecularly characterized by lack of estrogen receptor (ER), progesterone receptor (PR), and human epidermal growth factor receptor 2 (HER2) expression [2]. TNBC is the most aggressive breast cancer subtype that is frequently observed in women at younger ages, is diagnosed at an advanced stage and has poor prognosis [3]. Due to lack of targetable receptors, TNBC patients heavily rely on chemotherapy, particularly anthracycline- (e.g., doxorubicin) and taxane-based (e.g., paclitaxel) agents [4, 5]. Even though TNBC patients initially respond to chemotherapy at relatively higher rates compared to non-TNBCs [5–8], more than half of the chemotherapy-treated TNBC patients experience disease relapse [4, 9]. The improvement in progression-free survival with the immune checkpoint inhibitor (ICI), atezolizumab which has been approved for the treatment of refractory TNBCs in 2019 [10], is limited to 3 months with only a small portion of the patients benefiting this therapy and many experiencing treatment-related adverse events [11]. Therefore, there is an urgent need to unravel novel mechanisms of chemotherapy resistance in TNBCs and to achieve pathological complete response (pCR) among patients that are not responsive to chemotherapy. The first targeted therapy agent, sacituzumab govitecan-hziy (Trodelvy), which is an antibody–drug conjugate of the human trophoblast cell-surface antigen 2 (Trop-2) coupled to SN-38 (topoisomerase I inhibitor), has recently been approved by the Food and Drug Administration (FDA) to be used in metastatic TNBC patients that have progressed on at least two prior therapies; however, only 16.7% of the patients exhibit response for 12 or more months [12]. Therefore, there is still a dire need to identify novel therapy options that can improve survival rates in TNBCs.
Tumor cells are surrounded by a complex network of stromal cells and factors that collectively form the tumor microenvironment (TME). The extracellular matrix (ECM) is an important part of the TME that consists of proteoglycans and various fibrous proteins, such as collagen, fibronectin (FN1), and laminin of which expression and secretion are frequently induced in low oxygen, i.e., hypoxic environments [13]. The increase in tumor stiffness by increased abundance and crosslinking of different ECM components correlates with reduced drug delivery, cancer cell invasion, and metastasis and associates with worse clinical outcome [14]. For instance, we have shown that upregulation of lysyl oxidase (LOX) in TNBC tumors mediates chemoresistance via enhancing collagen crosslinking and fibronectin assembly in ECM, thereby reducing chemotherapy penetration, and activating pro-survival signaling [15]. The cues originating from tumor ECM are transduced into the cell via integrin family of proteins which are composed of 24 heterodimeric receptors that mediate adhesion to various ECM components. Binding of integrins to ECM has been shown to trigger intracellular signaling cascades that induce cell survival, proliferation, migration, and promote resistance to chemotherapy [16–18]. For instance, Integrin Subunit Alpha 5 (ITGA5) which is a subunit of the heterodimeric receptor (ITGA5/ITGB1) recognizing FN1 is found to be a prognostic biomarker in different cancers [19, 20] and also strongly correlates with LOX expression in TNBC patients [15]. Owing to these multifaceted roles of tumor ECM in promoting tumor aggressiveness, therapeutic strategies that modulate tumor stiffness or disrupt the signal transduction from ECM to cancer cells have great potential in overcoming resistance to given therapy in cancers accommodating stiff tumors [21, 22].
The systems biology approaches, involving analyses of multiple types of discrete and continuous data, such as omics data (transcriptomics, genomics, etc.), clinical data (subtyping, survival, etc.), and mathematical data (network simulation, etc.) have undergone tremendous improvements over the last few decades, offering new approaches for candidate prioritization, target modulation, and cancer treatment [23]. Integration of these approaches with multilayered analyses of miRNAs and their potential mRNA targets can enable the identification of the most prominent interactions present in a given cellular state, providing a unique opportunity to robustly determine the key drivers of disease progression. Modulation of these drivers can, therefore, provide efficient blockage of the complex network of interactions present in refractory tumors and has great potential to promote tumor regression in the presence of a given therapy [24].
Here, we built the first miRNA-mRNA interaction network of chemoresistance in TNBC to discover novel molecular players. We showed that chemoresistance in TNBCs is, in part, driven by the miR-326/ITGA5-FN1 axis that is regulated by hypoxia and ECM stiffness. Increasing miR-326 expression or inhibiting its downstream target, ITGA5 overcomes ECM-mediated chemoresistance. Our results provide pre-clinical rationale for modulating miR-326 or its target to enhance chemoresponse in TNBCs.
Results
miRNA-mRNA interaction network of TNBC chemoresistance identifies FN1 as a central node
To identify the miRNA-mRNA interaction network regulating chemoresistance in TNBCs, we developed an in vivo doxorubicin-resistance model by continuous doxorubicin treatment of the xenografts of a highly aggressive TNBC cell line, MDA-MB-231 (Fig. 1a) [15]. We collected tumors from several mice when they were responsive to therapy as assessed by the reduction in tumor size, and we classified them as sensitive. The rest of the mice were kept under doxorubicin treatment until the tumors exhibited re-growth at rates comparable to vehicle-treated tumors, and the tumors were classified as resistant [15]. We performed mRNA and miRNA profiling of the doxorubicin-sensitive and resistant tumors and analyzed the differentially expressed mRNAs and miRNAs (− 0.59 ≥ log2FC ≥0.59, P < 0.05) using the Ingenuity Pathway Analysis (IPA) (Fig. 1a, b). Upon a multi-step analysis pipeline that is based on directional pairing of miRNAs and their predicted mRNA targets and grouping into relevant pathways by integrating the upstream regulators (Fig. 1b), we obtained a network composed of 72 mRNAs, 20 miRNAs and 13 upstream regulators (Fig. S1). To further narrow down the list of miRNAs and mRNAs in the doxorubicin-resistance network, we integrated TNBC patient survival data into our pipeline. Using Kaplan–Meier Plotter [25] and GSE58812 [26] dataset, we identified the down or upregulated prognostic transcription factors (TFs) and mRNAs that either positively or negatively associate with chemo-treated TNBC patient survival, respectively (Fig. 1c). Accordingly, we shortlisted the genes that have hazard ratio (HR) > 1 in chemo-treated TNBC patients and at the same time, are upregulated in resistant xenografts and predicted to be the targets of downregulated miRNAs in the network, and vice versa. As a result, we obtained a core doxorubicin-resistance (DoxoR) network including 14 mRNAs, 4 miRNAs targeting those mRNAs and 4 TFs regulating their expression (Fig. 1d). In this network, we performed a random walk-based activity flow analysis to measure and rank each network component according to their centrality. Importantly, FN1 has the highest activity flow score showing its central role, followed by its receptor, ITGA5 and its functional partner, type I collagen, COL1A2 (Fig. 1e). These results show that our unbiased approach identified FN1 as a central node in the TNBC miRNA-mRNA chemoresistance network.
Fig. 1.

Constructing miRNA-mRNA interaction network of TNBC chemoresistance. a Schematic representation of the study plan and methodology. b Workflow describing the step-by-step selection process of the candidate miRNAs and mRNAs via IPA to generate doxorubicin-resistance miRNA-mRNA interaction network. c Forest plot showing survival analyses of the genes significantly stratifying patients in KM-Plotter (RFS (relapse-free survival), n = 132) or GSE58812 (OS (overall survival) and MFS (metastasis-free survival), n = 107) in chemotherapy-treated TNBC patients. Genes with no significant effect are not shown and excluded from further analysis. Circles indicate the hazard ratio, and the horizontal bars show the 95% confidence interval. Red color indicates significant (P < 0.05) hazard ratio (HR). d FN1-centered network comprising mRNAs, miRNAs, and upstream regulators involved in the doxorubicin resistance. Red and green nodes represent up- and downregulated mRNAs (circles) or miRNAs (fletching), respectively, where dark gray rhombus nodes represent the upstream regulators. e Random walk-based activity flow analysis to rank each network component according to their centrality. Five genes with the highest activity flow score are shown. Outliers in any data were identified via ROUT method. Statistical significance was evaluated by the Log-rank (Mantel-Cox) test in patient survival analysis
Fibronectin confers chemoresistance that is reversed by miR-326 overexpression
Deregulation of ECM composition, deposition, and crosslinking have previously been associated with chemotherapy response [14]. We have recently demonstrated the roles of the collagen crosslinking enzyme, LOX in driving doxorubicin resistance in TNBC, supporting the notion that ECM modulation is a critical regulator of chemotherapy response in TNBC. Here, we identified another key component of tumor-associated ECM, FN1 (protein: fibronectin) as the center of our doxorubicin-resistance network (Fig. 1). To experimentally demonstrate the involvement of FN1 in driving doxorubicin resistance, we examined the proliferation of MDA-MB-231 cells in uncoated vs. fibronectin-coated wells upon treatment with increasing doses of doxorubicin. We observed that cells grown on top of fibronectin exhibited higher proliferative capacity compared to those grown in the absence of fibronectin upon doxorubicin treatment, implying that FN1 could render TNBC cells resistant to doxorubicin in vitro (Fig. 2a). Furthermore, we observed a dose-dependent increase in the level of the apoptotic marker, cleaved PARP in doxorubicin-treated cells grown in the absence of fibronectin, while the degree of apoptotic cell death was considerably less in the presence of fibronectin (Fig. 2b).
Fig. 2.

Fibronectin confers chemoresistance that is reversed by miR-326 overexpression. a Percent cell proliferation of MDA-MB-231 cells grown on uncoated or 20 μg/mL Fibronectin-coated wells upon doxorubicin treatment. b Western blot analysis showing changes in apoptosis marker cleaved PARP (Cl. PARP) upon doxorubicin treatment for 48 h on uncoated or 20 μg/mL Fibronectin-coated wells in MDA-MB-231 cells. β-actin was used as a loading control. c Expression of miR-326 in doxorubicin-sensitive vs. resistant tumor xenografts. d Percent growth inhibition of MDA-MB-231 cells seeded in 20 μg/ml fibronectin upon combination of miR-326 mimic or doxycycline induction of 231.miR-326 cells with doxorubicin. e Western blot analysis showing changes in the apoptosis marker, cleaved PARP upon combination of miR-326 mimic and doxorubicin in MDA-MB-231 cells seeded on 20 μg/mL FN. β-actin was used as a loading control. f Expression of miR-326 (in log2 scale) in normal vs. tumor tissues (left) and in low vs. highly proliferative tissues (right) from GSE57897 and GSE19536, respectively. g Kaplan–Meier survival curve showing overall survival percentage in TNBC patients (n = 30) separated based on low vs. high miR-326 expression (Q1 vs Q4). *P < 0.05; **P < 0.01; ***P < 0.001. Normality/Lognormality was assessed by D’Agostino-Pearson or Shapiro–Wilk test. Statistical significance was evaluated by unpaired t test or Mann–Whitney test for all figures except by the Log-rank (Mantel-Cox) test in g
Of the 4 miRNAs in the DoxoR network, two of them (miR-326 and miR-342–3p) were downregulated in doxorubicin-resistant xenografts (Figs. 2c and S2a). We examined if re-expression of these miRNAs (with miRNA mimic transfection or inducible miRNA expression) could overcome FN1-driven doxorubicin resistance in vitro. miR-326 overexpression, but not miR-342–3p, led to a higher growth inhibition mediated by doxorubicin in MDA-MB-231 cells cultured on fibronectin at different doses of doxorubicin (Figs. 2d and S2b). The role of miR-326 in chemosensitization was further validated in MDA-MB-157 and MDA-MB-436 cells cultured in fibronectin-coated wells (Fig. S3a, b). Furthermore, miR-326 overexpression increased the response to not only doxorubicin but also to paclitaxel (Fig. S3c–e), supporting the notion that miR-326 could be a general chemosensitizer in TNBC. We have also observed a marked increase in apoptosis upon combination treatment compared to miR-326 overexpression or doxorubicin alone (Fig. 2e).
To uncover the clinical relevance of miR-326, we first examined the expression of miR-326 in noncancerous breast vs. breast cancer tissues (GSE57897 [27]) and in tumors with low proliferative vs. high proliferative capacity (GSE19536 [28]). We demonstrated that miR-326 expression is lower in cancer tissues or tumors with high proliferative capacity, supporting its tumor suppressor role (Fig. 2f). Similarly, we observed that low miR-326 expression in TNBC patients with adjuvant therapy associated with poorer overall survival compared to patients with high miR-326 expression (GSE40267 [29]) (Fig. 2g). Survival analysis using TCGA TNBC patients yielded a similar result with a trend (p = 0.055) towards worse survival in case of low expression of miR-326 (Fig. S4a). Importantly, higher expression of the predicted targets of miR-326 also predicts worse overall survival, similar to patients with low miR-326 expression (Fig. S4b). Overall, we conclude that miR-326 may function as a tumor suppressor in TNBC and can overcome FN1-mediated doxorubicin resistance.
miR-326 potentiates doxorubicin response in vivo
We next tested if miR-326 could potentiate doxorubicin response in vivo. To this end, we used derivatives of the luciferase expressing MDA-MB-231-Luc2-GFP cells (“231. Luc2.GFP”) that stably express doxycycline-inducible miR-326 (“231.miR-326”). Next, we orthotopically injected the control and inducible miR-326 expressing cells into mammary fat pads (MFPs) of nude mice. Induction of miR-326 expression in combination with a low dose of doxorubicin after tumors became palpable led to a prominent decrease in tumor growth as compared to single-agent treatments (Fig. 3a). Accordingly, in vivo imaging revealed a marked reduction (> 3-fold) of luminescence signal coming from the combination-treated tumors (Fig. 3b and c). Moreover, tumors obtained from the combination group were considerably smaller than those of the miR-326, doxorubicin, and control groups (Fig. 3d and e). Finally, we confirmed the upregulation of miR-326 in doxycycline-treated tumors collected at the end of the experiment (Fig. 3f). These data suggest that miR-326 overexpression potentiates the efficacy of doxorubicin in vivo.
Fig. 3.

miR-326 potentiates doxorubicin response in vivo. a Changes in tumor volume in MDA-MB-231 xenografts upon vehicle treatment or miR-326 induction in the presence or absence of doxorubicin treatment (n = 8). Treatments and miR-326 induction were started once tumors reached to 100 mm3. n indicates tumor number. b IVIS images of mice (n = 4) from A, taken on the last day of the experiment. c Quantifications of luciferase intensity in tumors from b. d Images showing isolated tumors from a. e Dot plots comparing the weights of tumors from each group shown in a. f Expression of miR-326 in control vs miR-326 group xenografts. Normality/Lognormality was assessed by D’Agostino-Pearson or Shapiro–Wilk test. Statistical significance was evaluated by unpaired t test
miR-326 targets the FN1 receptor, ITGA5 and blocks the downstream FAK/Src signaling
To elucidate the molecular mechanisms of doxorubicin sensitization upon miR-326 overexpression, we re-examined our DoxoR miRNA-mRNA network. ITGA5, which is a subunit of the major FN1-recognizing heterodimeric receptor (ITGA5/ITGB1), was among the predicted targets of miR-326. Furthermore, we have previously showed that inhibition of the ECM remodeler, LOX downregulated ITGA5 and FN1 and led to de-activation of downstream FAK/Src signaling and chemosensitization, suggesting that ITGA5-FN1 axis is a critical effector in modulating chemotherapy response [15]. Based on these, we hypothesize that miR-326 might function as a chemotherapy sensitizer via targeting ITGA5. Using TargetScan [30], we identified a conserved miR-326 binding site in the 3’-UTR of the ITGA5 mRNA (Fig. 4a). Overexpressing miR-326 in three different TNBC cell lines, MDA-MB-231, MDA-MB-157, and MDA-MB-436 was able to suppress ITGA5 at mRNA and protein levels (Figs. 4b, c, S3f). We further validated the direct binding of miR-326 to ITGA5 3’-UTR by dual-luciferase assay (Fig. 4d).
Fig. 4.
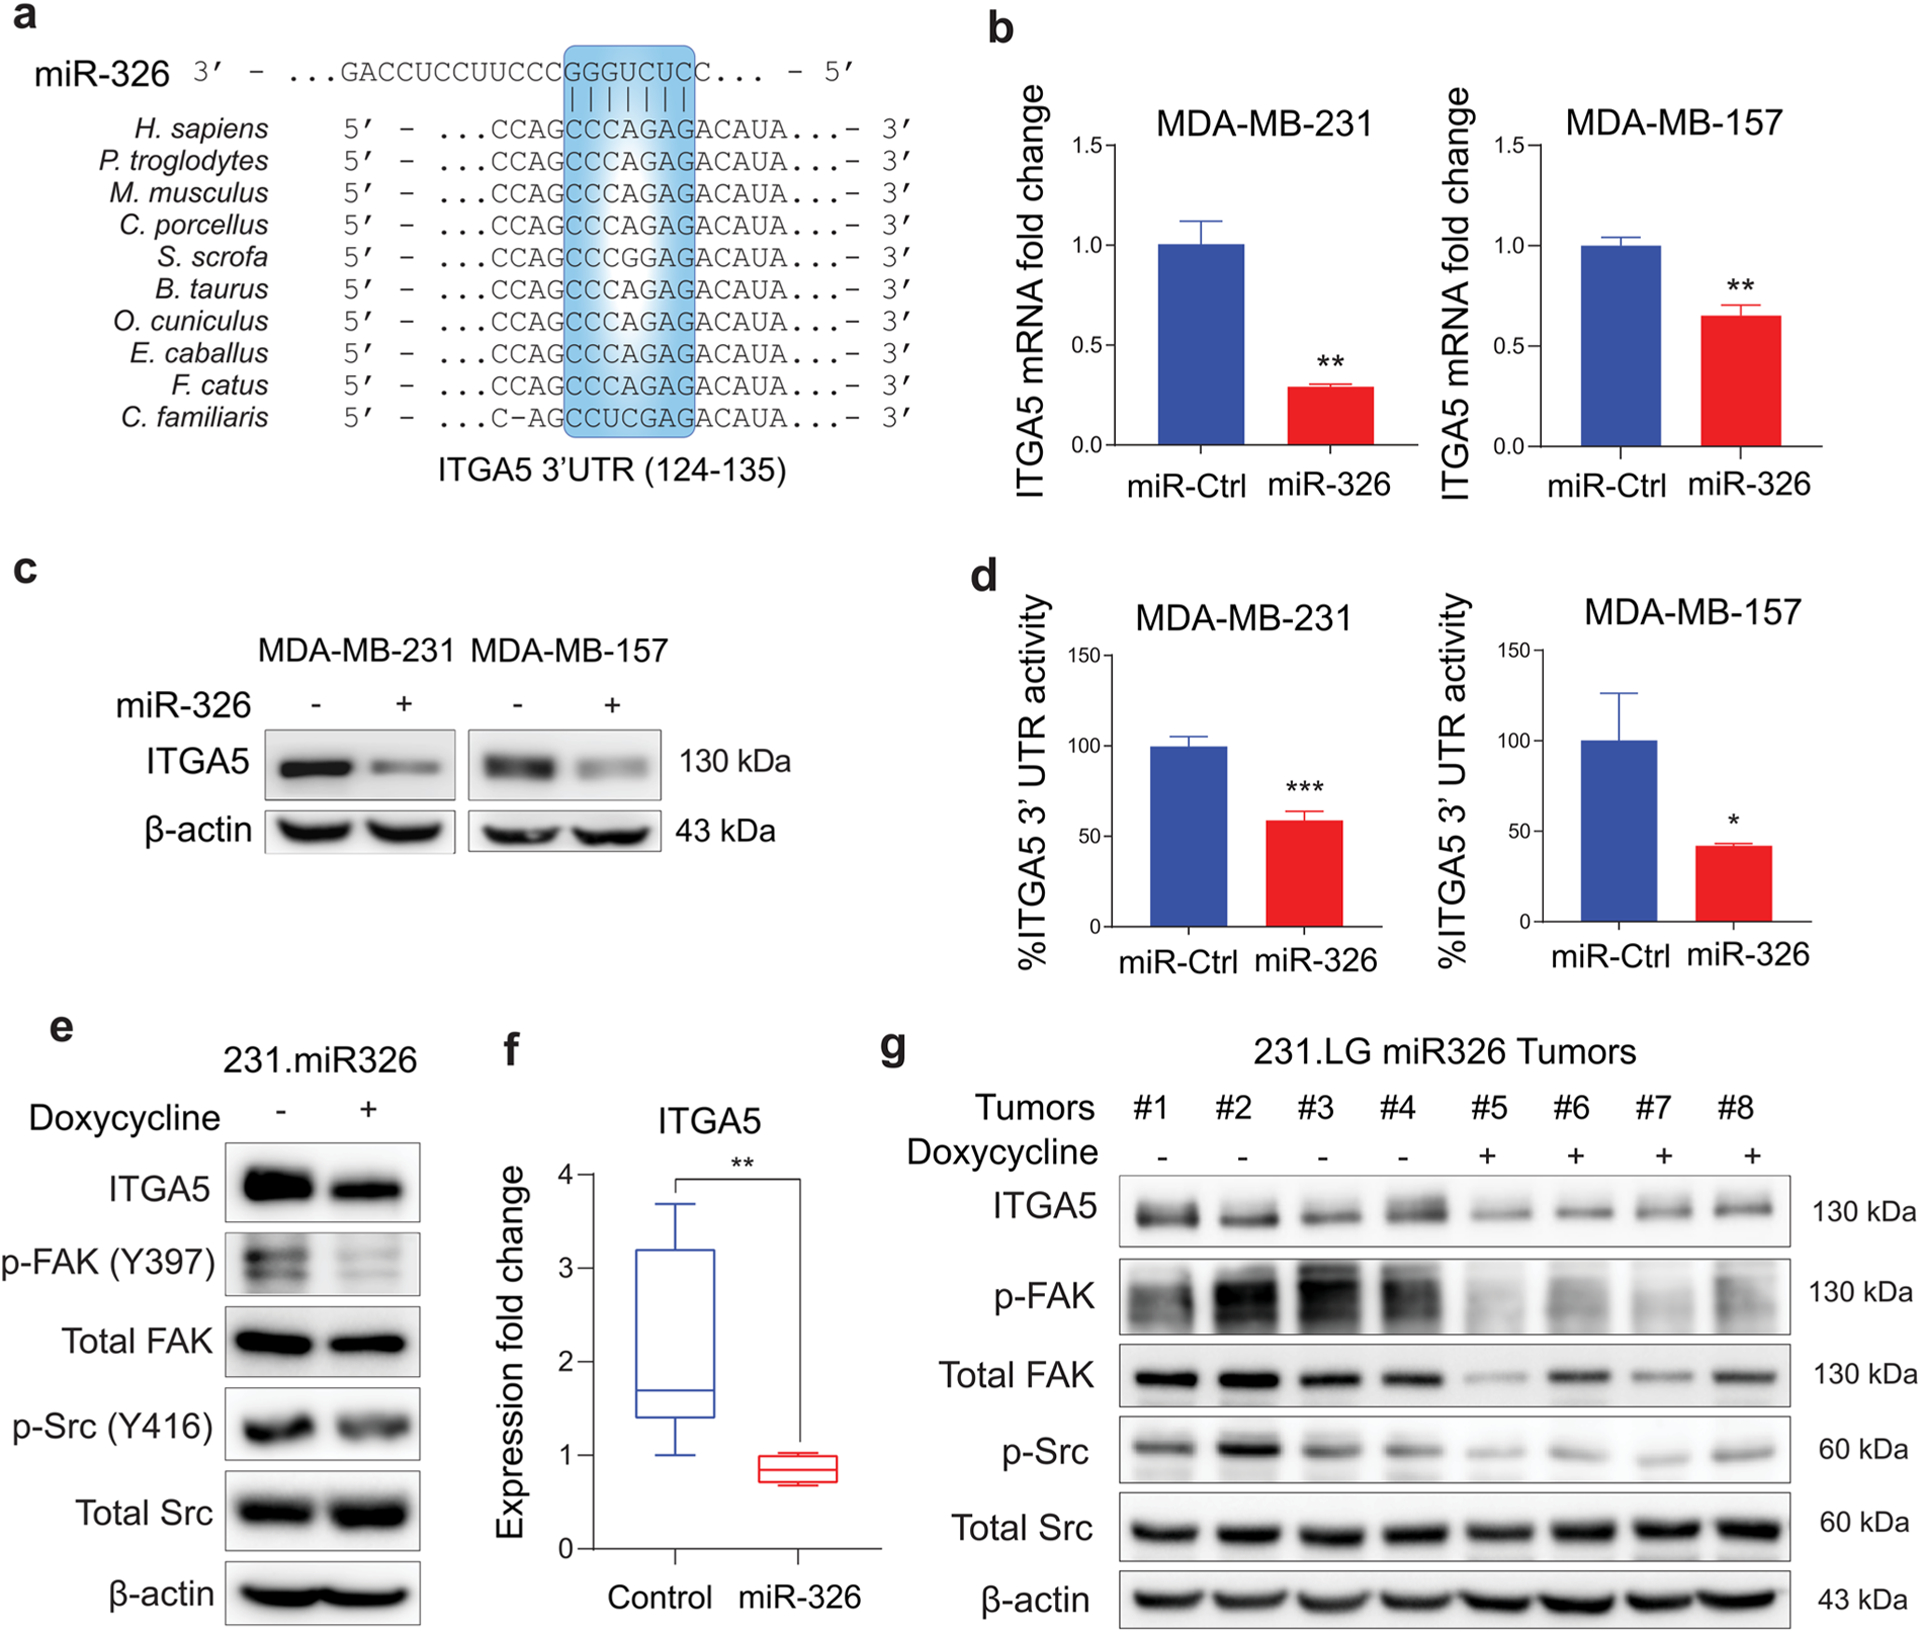
miR-326 targets FN1 receptor, ITGA5 and blocks its downstream FAK/Src signaling. a Graphical representation of conserved miR-326-binding site within the 3′-UTRs of ITGA5 from different species. b, c qRT-PCR (b) and Western blot (c) analyses showing changes at ITGA5 levels upon miR-326 transfection in MDA-MB-231 (left) and MDA-MB-157 (right) cells for 48 h. d Luciferase activity of the reporter construct fused with 3′-UTR of ITGA5 in MDA-MB-231 (left) and MDA-MB-157 (right) cells transfected with miR-Ctrl or miR-326. e Western blot analysis showing changes in ITGA5, p-FAK, total FAK, p-Src, and total Src levels in 231. miR-326 cells either not induced or induced with doxycycline to express miR-326. f Expression of ITGA5 mRNA in control vs. miR-326 expression-induced tumors. g Western blot analysis showing changes in FN1, ITGA5, p-FAK, total FAK, p-Src, and total Src levels in 231. miR-326 xenografts either not induced or induced with doxycycline to express miR-326. Statistical significance was evaluated by unpaired t test
To experimentally test the effect of miR-326 on the pathways downstream of FN1/ITGA5, we performed Western blot analysis of the relevant downstream targets. We demonstrated that p-FAK Y397 and p-Src Y416 were strongly diminished, which were accompanied by a concomitant decrease in ITGA5 protein levels following miR-326 overexpression upon doxycycline induction (Fig. 4e). We observed similar results when we compared ITGA5 expression and the signaling activity in miR-326 overexpressing tumors to the control tumors (Fig. 4f–g). Overall, we showed that miR-326 directly targets ITGA5, a subunit of the FN1 receptor, thus, inhibiting the activity of the downstream FAK/Src pathway.
Inhibiting ITGA5 overcomes FN1-driven chemoresistance in vitro and potentiates chemoresponse in vivo
We next tested if ITGA5 is involved in fibronectin-driven chemoresistance downstream of miR-326. We first engineered MDA-MB-231-Luc2-GFP cells to stably express shITGA5 upon induction with doxycycline (“231. shITGA5”). After validating ITGA5 knockdown with doxycycline induction at mRNA and protein levels (Fig. 5a, b), we examined the combinatorial effect of ITGA5 knockdown and doxorubicin on the viability of cells seeded onto fibronectin-coated wells. We observed that cells became more sensitive to doxorubicin treatment upon induction of shITGA5 (Fig. 5c), indicating that ITGA5 downregulation potentiates doxorubicin response. Moreover, there was a noticeable increase in the level of the apoptotic marker, cleaved PARP, upon shITGA5 induction combined with doxorubicin compared to their individual effects (Fig. 5d). Importantly, we observed a reduction in p-FAK Y397 and p-Src Y416 following ITGA5 silencing (Fig. 5e). These results suggest that ITGA5, whose expression is controlled by miR-326, is a central gene that conveys signals from fibronectin-rich ECM to intracellular space, leading to activation of survival pathways, inhibition of drug-induced apoptosis, and induction of chemoresistance.
Fig. 5.

Inhibiting ITGA5 overcomes FN1-driven chemoresistance in vitro and potentiates chemoresponse in vivo. a, b qRT-PCR (a) and Western blot (b) analysis validating ITGA5 knockdown in 231. shITGA5 cells after 48 h of induction. c Percent growth inhibition of 231.shITGA5 cells seeded onto 20 μg/mL fibronectin upon combination of doxycycline induction and doxorubicin. d Western blot analysis showing changes in the apoptosis marker, cleaved PARP, upon combination of shITGA5 induction and doxorubicin in MDA-MB-231.shITGA5 cells seeded onto 20 μg/mL FN. e Western blot analysis showing changes in ITGA5, p-FAK, total FAK, p-Src, and total Src levels in 231.shITGA5 cells either not induced or induced with doxycycline to express shITGA5. f Changes in tumor volume in MDA-MB-231 xenografts upon vehicle treatment or shITGA5 induction in the presence or absence of doxorubicin treatment (n = 4 for control and Doxo groups, and n = 6 for shITGA5 and combination groups). Treatments and shITGA5 induction were started once tumors reached to 100 mm3. n indicates tumor number. g IVIS images of mice from F, taken on the last day of the experiment. h Quantifications of luciferase intensity in tumors from g. i Images showing isolated tumors from f. j Dot plots comparing the weights of tumors from each group shown in f. k Western blot analysis showing changes in FN1, ITGA5, p-FAK, total FAK, p-Src, and total Src levels in 231. shITGA5 xenografts either not induced or induced with doxycycline to express shITGA5. Statistical significance was evaluated by unpaired t test
Next, we tested the effects of ITGA5 silencing on potentiating doxorubicin response in vivo. We developed primary tumor xenografts of the 231.shITGA5 cells and treated them with a low dose of doxorubicin along with doxycycline to induce shITGA5 expression (Fig. 5f). We showed that combination treatment induced a significant delay in tumor growth compared to single-agent treatments, as clearly shown by bioluminescent imaging and tumor weight measurements (Fig. 5g–j). We also compared the signaling activity in shITGA5 expressing tumors to the control tumors and observed an overall reduction in p-FAK Y397 and p-Src Y416 levels in addition to a clear decrease in ITGA5 (Fig. 5k). Altogether, these results corroborate our hypothesis that ITGA5 is the principal component of the DoxoR miRNA-mRNA network that is activated by FN1 and suppressed by miR-326 to reduce doxorubicin response.
HIF1α and ECM stiffness regulate miR-326 expression
Having showed miR-326 as a key determinant of doxorubicin response, we next sought to identify its upstream regulators. Increased tumor stiffness was shown to modulate the expression of genes including HIF1A and VEGFA [31]. Furthermore, we previously demonstrated that TNBC tumors become stiff as they acquire chemoresistance via LOX-mediated collagen crosslinking and fibronectin assembly [15]. These data suggest that expression of miR-326 which we identified to be downregulated in chemoresistant TNBC tumors could be controlled by tumor stiffness. To test this hypothesis, we first examined the association of miR-326 expression with ECM stiffness in TNBC patient tumors and observed a significant enrichment of genes related to ECM organization (including genes modulating ECM stiffness) in TNBC tumors expressing low miR-326 in two different datasets (Figs. 6a, S5a). To experimentally test the role of ECM stiffness in regulating miR-326 expression, we modeled increased stiffness in vitro, using 3D culture of MDA-MB-231 cells. To this end, collagen type I and matrigel were mixed at different concentrations as previously reported. It was shown that increasing collagen concentration [32], or addition of matrigel to collagen matrices increases ECM stiffness [33]. In line with this, we observed a gradual decrease in miR-326 expression with increasing ECM stiffness (Fig. 6b), supporting the critical role it has in ECM-driven chemoresistance.
Fig. 6.

HIF-1α and tumor stiffness regulate miR-326 expression. a Genes associated with extracellular matrix organization are enriched in tumors of patients with low miR-326 expression in GSE19783 dataset. b qRT-PCR analysis of miR-326 expression in MDA-MB-231 cells embedded in ECM with increasing stiffness generated by 0.5 or 1 mg/mL collagen type I (C) with or without Matrigel (M) in comparison with only cells (OC). c Pearson correlation analysis of miR-326 expression with HIF1A expression or hallmark hypoxia score in GSE19783 dataset. d Genes associated with hypoxia are enriched in tumors of patients with low miR-326 expression in GSE19783 dataset. e qRT-PCR analysis showing miR-326 expression in MDA-MB-231 cells under hypoxic conditions at 0, 12, and 24 h time points. f qRT-PCR analysis showing miR-326 expression upon HIF1A siRNA transfection in MDA-MB-231 cells for 48 h. g HRE and HAS motifs on miR-326-host gene, ARRB1, promoter region, and ChIP analysis showing increased ARRB1 promoter occupancy by HIF-1α upon CoCl2 treatment. h Schematic representation of the mechanistic summary. Statistical significance was evaluated by unpaired t test
In the DoxoR miRNA-mRNA network, it was predicted that the hypoxia-regulated transcription factor, HIF1α inhibits miR-326 expression (Fig. 1d). Furthermore, we had previously shown that doxorubicin-resistant tumors are hypoxic, and hypoxia can increase ECM stiffness via HIF1α-mediated transcription of genes involved in ECM modulation, including LOX [15]. Here, we demonstrated that expression of HIF1α and hallmark hypoxia score are negatively correlated with the expression of miR-326 in multiple breast cancer patient datasets (Figs. 6c and S5b), suggesting that HIF1α may be negatively regulating miR-326 expression. Furthermore, genes upregulated in response to hypoxia are enriched in tumors of patients with low miR-326 expression (Fig. 6d). Experimentally, we demonstrated that culturing MDA-MB-231 cells under hypoxic conditions for 12 and 24 h resulted in a significant decrease in miR-326 levels by qRT-PCR (Fig. 6e). To test whether the downregulation of miR-326 was mediated directly by HIF1α, we inhibited HIF1α in MDA-MB-231 cells and observed a significant increase in miR-326 levels (Fig. 6f). Our in-silico analysis revealed multiple hypoxia response elements (HRE) and hypoxia ancillary sequences (HAS) in the genomic locus in which miR-326 resides (Fig. 6g). HREs are functionally activated when the region contains an adjacent HAS within 7 to 15 nt downstream [34, 35]. Accordingly, we designed 4 different sets of primers that collectively target all HREs, including those adjacent to HAS, and 1 primer set that does not target any HRE, as a negative control (region #4). We used a primer set amplifying the promoter region of VEGF as the positive control. We then carried out a ChIP experiment and pulled down HIF1α under hypoxic conditions induced by CoCl2 treatment. This showed that HIF1α directly binds to HREs within the miR-326 locus at elevated levels, leading to its transcriptional repression.
Discussion
Although TNBC patients respond to chemotherapy at relatively higher rates—as high as 60% for some chemotherapy regimens—compared to non-TNBC patients, many patients either have de novo resistance or ultimately develop resistance to chemotherapy, limiting their long-term use and dramatically exacerbating the mortality rates [5, 7–9]. Despite the recent approval of the immune checkpoint inhibitors, e.g., atezolizumab [10], and the antibody–drug conjugate, Sacituzumab govitecan-hziy [12] in refractory, metastatic TNBCs, the improvement in progression-free survival is limited, which necessitates the identification of novel therapy options that can improve survival rates in TNBCs. Here, we developed, to the best of our knowledge, the first miRNA-mRNA network of chemoresistance in TNBCs by integrating mRNA- and miRNA-sequencing, network simulations, and patient data analyses (Fig. 1a). This identified FN1 as the hub of the chemoresistance network (Fig. 1d, e). We further demonstrated the functional importance of FN1 in the acquisition of resistance via activation of its cell-surface receptor ITGA5, and the downstream pro-survival signaling, leading to the blockage of drug-induced apoptosis in TNBC (Fig. 2a, b). The activity of integrin signaling was controlled by hypoxia-regulated miR-326, whose overexpression transcriptionally suppressed ITGA5 and deactivated the downstream FAK/Src signaling pathway, leading to increased response to chemotherapy in vitro and in vivo. These results were recapitulated by ITGA5 knockdown in vitro and in vivo, supporting the role of miR-326 on chemoresponse via modulation of integrin signaling in TNBCs.
Fibronectin (gene: FN1) is a fibrillary protein that constitutes one of the crucial ECM components and acts as a mechanical support for cells owing to its elastic characteristics [36]. In addition, the interaction of fibronectin with the integrin α5β1 receptor facilitates bidirectional signaling processes between ECM and the intracellular compartments [37]. The role of the heterodimeric integrin α5β1 receptor in tumorigenesis and as a potential therapeutic target has previously been studied in detail [38, 39]. ITGB1 is the well-studied component of the heterodimeric receptor that has been demonstrated to provide de novo doxorubicin resistance in both hormone receptor positive and negative models in vitro, as well as to facilitate acquired doxorubicin resistance in multiple cancer types including TNBC [16, 18, 40]. However, ITGA5 has not been studied to the same extent although it confers high specificity for the binding of the complex to fibronectin [39, 41]. Our study identified FN1 and ITGA5 as crucial players in determining response to different chemotherapy agents, including doxorubicin and paclitaxel which are among the commonly used chemotherapies in TNBC, through integrin signaling activation (Figs. 2a, b, 5, S3). We validated our results using three different TNBC cell lines, namely, MDA-MB-231, MDA-MB-157 and MDA-MB-436. Among those, MDA-MB-231 is the well-established and commonly used tumorigenic cell line [42, 43]. Hence, we generated xenografts of MDA-MB-231 cells expressing miR-326/shITGA5 to test the role of miR-326/ITGA5 axis in chemotherapy response in vivo. Future studies are needed to further support the roles of miR-326/ITGA5-FN1 axis in regulating in vivo response of cell line models belonging to different TNBC subtypes to different classes of chemotherapies, such as the platinum-based agents. We have previously demonstrated that expressions of both of these genes were regulated by the ECM remodeler, LOX, and were significantly associated with clinical outcome in chemotherapy-treated TNBC patients [15]. LOX crosslinks and stabilizes collagen and elastin fibers together with the induction of fibronectin assembly, thereby controlling tissue stiffness [44], which further leads to reduced drug uptake [15]. In addition to regulating drug penetration, tissue stiffness may also modulate the expression of genes that are important for growth and invasiveness, such as HIF1A and VEGFA [31]. Along these lines, we showed that miR-326 expression is strongly reduced upon culturing TNBC cells in the presence of ECM with increasing stiffness. Given the functional roles of LOX in increasing tumor stiffness in chemoresistant TNBC tumors, it would be interesting to test a potential regulation of the miR-326/ITGA5-FN1 axis by LOX and a potential contribution of the axis to drug penetration. Moreover, a type I collagen (COL1A2) was also found in our miRNA–mRNA network of doxorubicin resistance that further corroborates the importance of ECM modulation, at the level of transcription, post-transcription, and assembly in chemoresistant TNBCs. Given the well-known association of ECM regulation and integrin signaling with metastasis, a potential role of miR-326 in breast cancer metastasis can also be investigated in the future. There are indeed a few studies showing a potential involvement of miR-326 in inhibiting cell invasion in vitro in different cancers including breast cancer [45, 46]. Nevertheless, a more extensive investigation including in vivo testing is warranted.
MicroRNAs post-transcriptionally regulate more than 60% of human protein-coding genes, ultimately linking them to a plethora of cellular and physiological processes. They are indispensable for animal development, differentiation, and homeostasis and are also involved in cancer initiation, progression, and drug resistance as tumor suppressors or oncogenes [47, 48]. Accordingly, miR-326 has been reported to function as a tumor suppressor in different cancer types including breast cancer [45], cervical cancer [49], lung cancer [50], and glioblastoma [51]. Furthermore, miR-326 was shown to regulate multidrug resistance-associated protein (MDR) and confer sensitivity to VP-16 and doxorubicin in ER-positive breast cancer cells [52]. Here, we demonstrated the tumor suppressor role of miR-326 as a stiffness- and hypoxia-regulated chemosensitizer in TNBC that post-transcriptionally regulate several key components of the ECM, including FN1 and its receptor ITGA5 (Figs. 2c–e, 3a–e, and 4e–g). These findings together with our previously published data on the role of ECM crosslinking in the acquisition of chemoresistance suggest a multilayered modulation of the ECM at transcriptional, post-transcriptional, and protein assembly levels that controls not only drug penetration but also the expression of resistance-regulating miRNAs (here: miR-326) and thereby modulating downstream survival signaling pathways (here: integrin signaling). In this line, we anticipate a strong translational potential of targeting the ECM re-modelers or integrins or restoring the expression of ECM-regulating miRNAs to augment clinical outcome in chemoresistant TNBCs.
Hypoxia is a hallmark of high-stage tumors which is generally observed within the core of solid tumors that is characterized by oxygen deprivation due to incomplete vascularization [53]. Hypoxia drives certain intracellular and extracellular changes that ultimately provides better adaptation to the microenvironment and to evade apoptosis under drug treatment. Hypoxia-driven changes frequently occur via activation of the hypoxia-inducible factors (HIFs) [54]. HIF1A encodes HIF-1α protein which constitutes the oxygen-sensitive subunit of the heterodimeric HIF transcription factor [55]. It has previously been reported by us and others as a modulator of several ECM components, including FN1 and ITGA5 to advance the tumorigenic process and also as a mediator of doxorubicin resistance in multiple cancer types [15, 38, 56, 57]. In this study, we identified a novel miRNA target of HIF-1α (Figs. 1d, 6), miR-326, upstream of integrin signaling that triggers chemoresistance in TNBCs. We identified several HREs in miR-326 promoter and showed direct binding of HIF-1α, leading to suppression of miR-326 expression under hypoxic conditions (Fig. 6e–g).
Conclusion
In brief, we deciphered a novel molecular mechanism of chemotherapy resistance in TNBC that involves the stiffness/hypoxia-regulated HIF1A/miR-326/ITGA5-FN1 axis by utilizing a network-based approach that integrates profiling of miRNA and mRNAs, network simulations, and patient data analyses. Downregulation of miR-326 in cancer cells in contact with a stiff ECM under hypoxia, and the subsequent activation of integrin/FAK signaling pathway upon increased ITGA5 lead to chemotherapy resistance (Fig. 6h). Therefore, we propose that ectopic expression of miR-326 decreases ITGA5 expression and impairs downstream signaling, thus, resulting in chemotherapy sensitization and tumor growth inhibition (Fig. 6h). These findings provide a pre-clinical support for the potential use of miR-326 or inhibitors against miR-326 targets, namely ITGA5, to overcome chemotherapy resistance in TNBC.
Materials and methods
In vivo experiments
All animal experiments were approved by the Animal Ethics Committee of Bilkent University. The studies were carried out in compliance with the ARRIVE guidelines. All methods were carried out in accordance with relevant guidelines and regulations. 6–8-week-old female athymic nu/nu mice were subcutaneously injected with 2 × 10⁶ 231.Luc2.GFP cells prepared in 100 μL PBS:Matrigel (1:1) solution into the left and right mammary fat pads (MFPs). After tumors became palpable, their growth was measured regularly twice a week using a caliper, and tumor volume was calculated as (length × width2)/2. Development of doxorubicin-sensitive/resistance xenografts has previously been described [15]. To test the effects of miR-326 overexpression or shITGA5 on doxorubicin response, mice with palpable tumors were treated with doxorubicin (2.5 mg/kg) after induction of miR-326 or shITGA5 expressions with doxycycline (100 μg/mL). To perform the tumor bioluminescence imaging, mice were anesthetized with isoflurane, 150 mg/kg D-luciferin (Sigma Aldrich, St Louis, MO, USA) was injected into intraperitoneal (i.p.) cavity, and the images were acquired using Lumina III In vivo Imaging System (Perkin Elmer, Waltham, MA, USA). All mice were sacrificed when the tumors of control group reached 1500 mm3, and the tumors were collected and weighed.
Whole transcriptome sequencing (RNA-Seq and small RNA-Seq) and data analyses
After total RNA was isolated from doxorubicin-sensitive and doxorubicin-resistance tumors, RNA-Seq and small RNA-Seq were performed with 4 tumors from each group using Illumina HiSeq 2500 platform at McGill University Genome Centre. The procedure on how RNA-Seq was done and analyzed is described previously [15], and the raw data are uploaded with an accession number of PRJNA607780. Data analysis for miRNA-Seq was done by aligning raw sequence data with UCSC Homo sapiens reference genome (hg19, GRCh37) using Bowtie v1.1.2 according to default parameters. Identification of the differentially expressed miRNA was performed using three different differential expression algorithms (edgeR, DESeq, and NOISEQ) to increase robustness. Consensus miRNAs from these three programs were taken for further analyses.
Network activity flow
Activity flow analysis was used to measure and simulate the effects of regulatory interactions between miRNAs, upstream regulators, and proteins in the given network based on random walks on graphs. Briefly, initial activity level of upstream regulators and upregulated proteins and miRNAs were designated as “1” while the rest was valued as “0.” Induction edges and inhibition edges exerted positive and negative effects, respectively, over the interacted nodes (proteins, miRNAs, and upstream regulators). Activity flow score of each node is modeled as a discrete-time continuous-state Markov processes and the steady-state activity levels are found by simulation via our in-house code written in Java. Later, each node was ranked according to its activity flow score that also reflected the centrality of that node in the given network.
Cell culture and reagents
Human breast cancer cell lines MDA-MB-231, MDA-MB-157, and MDA-MB-436 were obtained from ATCC (Manassas, VA, USA) whereas MDA-MB-231.Luc2.GFP (shortly 231.Luc2.GFP), a modified and labeled version of MDA-MB-231, was a kind gift from Dr. Dihua Yu (MD Anderson Cancer Center, Houston, TX, USA). All cell lines were cultured in Dulbecco Modified Eagle Medium (DMEM) supplemented with 50 U/ml penicillin/streptomycin, 1% non-essential amino acids, and 10% fetal bovine serum (FBS). Mycoplasma contamination test was performed regularly using MycoAlert mycoplasma detection kit (Lonza, Basel, Switzerland).
Cell seeding on fibronectin-coated wells
The concentration of fibronectin (Sigma Aldrich, St Louis, MO, USA) was adjusted to 20 μg/mL in PBS, and as much as 40 μL or 900 μL was added to 96 or 6-well plates, respectively. Plates were incubated at 4 °C overnight and then washed once with PBS. Then, 8000 cells/well or 200,000 cells/well were seeded on top of fibronectin-coated wells in 2% FBS containing DMEM for 96-well or 6-well plates, respectively.
Cell embedding to ECM with increasing stiffness
Mixtures of collagen type I and matrigel were prepared at a ratio of 1:1 with different collagen concentrations. Collagen mixtures were prepared as described before [15] at a final concentration of 0.5 or 1 mg/mL with or without an equal volume of matrigel. MDA-MB-231 cells were suspended in these mixtures and seeded on 12 well plates and cultured for 4 days.
Transient transfection with miRNA mimics and reporter constructs
Transfections were performed as previously described [58–60]. miR-326 mimic and siHIF1A were transfected at 20 nM concentrations, then RNA or protein was isolated 48-h post-transfection. Reporter construct carrying the 3’-UTR of human ITGA5 (NM_002205) was transfected at a dose of 50 ng per well in 96-well experiment setup for the luciferase reporter assay experiments.
Cell viability assays
Fibronectin coating and cell seeding were performed as described above. Doxorubicin and paclitaxel treatments were carried out 12 h after miRNA mimics or siRNA transfection. In case of experiments without transfection, drug was given 24 h after cell seeding. Cell viability assay was performed with Cell Titer-Glo Luminescent Cell Viability (Promega, Madison, WI, USA) 48 h post-drug treatment.
Quantitative RT-PCR analysis
Total RNA was obtained from cultured cells or mice xenograft tumors using TRIsure (Bioline, Luckenwalde, Germany). For isolating RNA from ECM-embedded cells, collagen was degraded using 2 mg/mL collagenase at 37 °C for 10 min, followed by 3 washes with cold PBS. For isolation of RNA from xenograft tumors, tumors were sliced into small pieces, a part of which was homogenized for complete lysis. Then, cDNA synthesis was performed using RevertAid RT Reverse Transcription Kit (Life Technologies) following manufacturer’s protocol. Quantitative real-time PCR assay was carried out using Light Cycler 480 SYBR Green I Master kit (Roche) in triplicates. GAPDH and HPRT were used as housekeeping genes. The sequences of the qRT-PCR primers are provided in Supplementary Table 1a. For qRT-PCR data analysis, ΔΔCT method was utilized. For miRNA qRT-PCR experiments, RNU44 and RNU48 were used as housekeeping genes, and qRT-PCR was performed by TaqMan Real-Time PCR Assays (Thermo Fisher Scientific).
Chromatin immunoprecipitation (ChIP) assay
ChIP experiment was done using the EZ-Magna ChIP™ A/G Chromatin Immunoprecipitation Kit from Sigma-Aldrich (17–10,086), following manufacturer’s instructions. Briefly, 10 × 106 MDA-MB-231 cells were fixed with 1% formaldehyde for 10 min followed by quenching with 125 mM glycine for 5 min. Cells were lysed in 500 uL lysis buffer, and nuclear lysates were extracted. Sonication was done for 20 s intervals for a total of 15 rounds. 150 uL chromatin was incubated with the beads together with the HIF-1α (39,665, Active Motif) or IgG antibodies at + 4 °C, overnight with slow agitation. Samples were washed with low and high salt wash buffers, and Proteinase K treatment was done for 2 h at 62 C with shaking. Samples were incubated at 95 °C for 10 min and separated from the beads using a magnetic separator. DNA was isolated, and RT-PCR was performed using primers targeting miR-326 or VEGF promoters. The results are normalized to IgG and input controls.
Western blotting
Protein isolation and Western blotting were performed as previously described [59, 60]. Briefly, proteins were extracted using RIPA lysis buffer with the addition of protease and phosphatase inhibitor cocktails, and protein concentrations were measured using the BCA Protein Assay Reagent Kit (Thermo Scientific, Rockford, IL). Equal amounts of protein were separated using 8–10% SDS-PAGE gel. Separated proteins were transferred onto PVDF membranes (Bio-Rad, USA) using Trans-Blot turbo transfer system (Bio-Rad) and incubated with primary antibodies (Supplementary Table 1b). Horseradish peroxidase-conjugated anti-mouse or anti-rabbit antibodies (Cell signaling Technology, USA) were used as secondary antibodies, and signals were detected by enhanced chemiluminescence reagent (Amersham Pharmacia Biotech, Amersham, UK) using a CCD imager (GE Healthcare, Chicago, Illinois, USA).
Hypoxia assay
MDA-MB-231 cells were seeded into 6-well plate and incubated at 37 °C in normoxic conditions. 24-h post-cell seeding, plates were transferred in Hypoxia Incubator Chamber (StemCell Technologies, Vancouver, Canada) with 1% oxygen, 5% CO2, and 94% nitrogen at 37 °C. At certain time points, cells were harvested by trypsinization and preserved for RNA isolation.
Construction of 3′-UTR plasmids
The construction of plasmids was carried out as previously described [61]. The 3′-UTR of ITGA5 containing binding sites for miR-326 was amplified using primers listed in Supplementary Table 1c. Amplicons of 3′-UTR of ITGA5 were ligated into psiCHECK2 vector backbone.
Dual-luciferase reporter assay
Dual-luciferase reporter assay was performed as previously described [61]. Luciferase activity was measured in Synergy HT microplate reader (BioTek, Vermont, USA) 24 h post-transfection, and the values were normalized to firefly luciferase activity.
Stable transfections using lentiviral vectors
shMIMIC-inducible mCMV-turboRFP human lentiviral hsa-miR-326, TRIPZ-inducible lentiviral non-silencing shRNA Control, and TRIPZ-inducible Lentiviral human ITGA5 shRNA (shortly shITGA5) were purchased from Dharmacon (Lafayette, CO, USA). Transduction using miR-326 viral particles into 231.Luc2.GFP cells was performed in 6-well plates. 20-h post-transduction, the medium containing virus was changed with fresh medium, allowing cells to grow further. Selection was done by incubating cells in the medium containing 2 μg/mL puromycin for 72 h. To generate viral particles used for shRNA vectors, 6 μg of vectors along with 4.3 μL of trans-lentiviral packaging mix was co-transfected into HEK293FT cells in 6-well plate using CaCl2 reagent as suggested in the manufacturer’s protocol (Dharmacon). After 48 h incubation, the viral particles were collected and transduced into 231.Luc2.GFP cells. Further selection was done by treating cells with the medium containing 2 μg/mL puromycin for 72 h.
miRNA–mRNA interaction network construction
The threshold of differentially expressed miRNAs and mRNAs between sensitive and resistant xenografts was set as log2FC ≤ − 0.59 and log2FC ≥ + 0.59, P value < 0.05, yielding 1280 mRNAs and 68 miRNAs. List of these mRNAs and miRNAs was then uploaded to web-based software application for omics analysis, namely Ingenuity Pathway Analysis (IPA) (QIAGEN Inc., https://qiagenbioinformatics.com/). In IPA, the miRNAs were initially paired with their predicted mRNA targets using “microRNA target filter” analysis. This resulted in 616 mRNAs being regulated by 42 miRNAs in 1718 interactions. As miRNA-mRNA expressions are expected to be inversely correlated, inverse pairing analysis was performed using “expression pairing” filter. This reduced the numbers into 463 mRNAs, 41 miRNAs, and 870 interactions. List of 463 mRNAs was again uploaded to the IPA core analysis to check the associated pathways. Genes from identified pathways were recollected and constructed in network used IPA “connect” function. In addition, “grow within own data” function provided in IPA was also used to find the closely related genes from the initial uploaded genes. Then, upstream regulators were added to the network followed by miRNA integration. The network was finalized by removing positively correlated miRNA-mRNA interactions. Open-source platform-based program, namely Cytoscape (https://cytoscape.org/), was also utilized to re-visualize the network obtained from IPA.
Pathway analysis, patient data, and statistical analyses
Patient data were retrieved from the NCBI GEO database and from online survival analysis tool, KM plotter [62]. Survival curves were generated based on median separation using Kaplan–Meier method, and significance between groups was calculated by Log-rank test. Chemotherapy-treated patient subgroup from the KM Plotter database (release version 2017) was created by selecting the adjuvant chemotherapy-treated patients and excluding the endocrine-treated ones.
miRWalk2.0 [63] was used as target prediction algorithm to predict miRNA gene targets in the network. This online available tool is a comprehensive program for miRNA target prediction that can combine other 11 miRNA target prediction databases including TargetScan, PITA, and miRDB in the analysis. To get more robust data, a stringent threshold was applied by taking common genes identified from at least 8 of those 12 databases.
We generated miR-326 target signature using the list of predicted miR-326 targets and Hallmark hypoxia signature directly from the Molecular Signatures Database and calculated a score for both signatures for each patient in GSE19783 [28] dataset using the following approach: We extracted the expression values of genes found in either of the signatures and converted them into z-scores. We then added up the z-scores to assign a signature score for each patient.
Pearson correlation co-efficient was used for correlation analysis. 2-tailed Student’s t test was performed to compare two experimental groups. Box plots show median number, and the 25th to 75th quartiles. Upper and lower whiskers denote the minimum and maximum values in the corresponding group. Graphs and curves were drawn using GraphPad software (GraphPad software Inc., La Jolla, CA, USA). Significance threshold was described as *P < 0.05; **P < 0.01; ***P < 0.001; ns, not significant.
Supplementary Material
Acknowledgements
We are thankful to the members of the Ozgur Sahin laboratory for invaluable discussion and advice. We thank Jitao David Zhang for his help with RNA-sequencing data.
Funding
This work was supported by European Commission FP7 Marie Curie Career Integration Grant PCIG14-GA-2013-631149 (OS), the American Cancer Society Institutional Research Grant IRG-17-179-04 (OS), NIH Research Project Grants R01-CA267101 (OS) and 2P20GM109091-06 (OS), the scholarship from Higher Education Commission of Pakistan (UR), the scholarship from 2211/A TÜBİTAK Domestic PhD Scholarship Program (UMT), and Susan G. Komen Interdisciplinary Graduate Training to Eliminate Cancer Disparities (IGniTE-CD) GTDR17500160 (OzgeS). YR is a research scholar of Fonds de recherche du Québec—Santé (FRQS).
Footnotes
Conflict of interest O.S. is the co-founder and manager of OncoCube Therapeutics LLC and founder and president of LoxiGen, Inc. The other authors declare no potential conflict of interest.
Supplementary Information The online version contains supplementary material available at https://doi.org/10.1007/s10549-022-06569-5.
Data availability
Raw RNA-seq data analyzed in the current study have been made available on NCBI Sequence Read Archive with accession PRJNA607780. The small RNA-Seq data have also been deposited to the SRA with the submission ID: PRJNA806717.
References
- 1.Bray F, Ferlay J, Soerjomataram I, Siegel RL, Torre LA, Jemal A (2018) Global cancer statistics 2018: GLOBOCAN estimates of incidence and mortality worldwide for 36 cancers in 185 countries. CA Cancer J Clin 68:394–424. 10.3322/caac.21492 [DOI] [PubMed] [Google Scholar]
- 2.Hwang SY, Park S, Kwon Y (2019) Recent therapeutic trends and promising targets in triple negative breast cancer. Pharmacol Ther 199:30–57. 10.1016/j.pharmthera.2019.02.006 [DOI] [PubMed] [Google Scholar]
- 3.Boyle P (2012) Triple-negative breast cancer: epidemiological considerations and recommendations. Ann Oncol 23(6):7–12. 10.1093/annonc/mds187 [DOI] [PubMed] [Google Scholar]
- 4.Bianchini G, Balko JM, Mayer IA, Sanders ME, Gianni L (2016) Triple-negative breast cancer: challenges and opportunities of a heterogeneous disease. Nat Rev Clin Oncol 13:674–690. 10.1038/nrclinonc.2016.66 [DOI] [PMC free article] [PubMed] [Google Scholar]
- 5.Santonja A, Sanchez-Munoz A, Lluch A, Chica-Parrado MR, Albanell J, Chacon JI et al. (2018) Triple negative breast cancer subtypes and pathologic complete response rate to neoadjuvant chemotherapy. Oncotarget 9:26406–26416. 10.18632/oncotarget.25413 [DOI] [PMC free article] [PubMed] [Google Scholar]
- 6.Carey LA, Dees EC, Sawyer L, Gatti L, Moore DT, Collichio F et al. (2007) The triple negative paradox: primary tumor chemo-sensitivity of breast cancer subtypes. Clin Cancer Res 13:2329–2334. 10.1158/1078-0432.CCR-06-1109 [DOI] [PubMed] [Google Scholar]
- 7.Gass P, Lux MP, Rauh C, Hein A, Bani MR, Fiessler C et al. (2018) Prediction of pathological complete response and prognosis in patients with neoadjuvant treatment for triple-negative breast cancer. BMC Cancer 18:1051. 10.1186/s12885-018-4925-1 [DOI] [PMC free article] [PubMed] [Google Scholar]
- 8.Lebert JM, Lester R, Powell E, Seal M, McCarthy J (2018) Advances in the systemic treatment of triple-negative breast cancer. Curr Oncol 25:S142–S150. 10.3747/co.25.3954 [DOI] [PMC free article] [PubMed] [Google Scholar]
- 9.Liedtke C, Mazouni C, Hess KR, Andre F, Tordai A, Mejia JA et al. (2008) Response to neoadjuvant therapy and long-term survival in patients with triple-negative breast cancer. J Clin Oncol 26:1275–1281. 10.1200/JCO.2007.14.4147 [DOI] [PubMed] [Google Scholar]
- 10.Schmid P, Adams S, Rugo HS, Schneeweiss A, Barrios CH, Iwata H et al. (2018) Atezolizumab and nab-paclitaxel in advanced triple-negative breast cancer. N Engl J Med 379:2108–2121. 10.1056/NEJMoa1809615 [DOI] [PubMed] [Google Scholar]
- 11.Keenan TE, Tolaney SM (2020) Role of immunotherapy in triple-negative breast cancer. J Natl Compr Canc Netw 18:479–489. 10.6004/jnccn.2020.7554 [DOI] [PubMed] [Google Scholar]
- 12.Bardia A, Mayer IA, Vahdat LT, Tolaney SM, Isakoff SJ, Diamond JR et al. (2019) Sacituzumab govitecan-hziy in refractory metastatic triple-negative breast cancer. N Engl J Med 380:741–751. 10.1056/NEJMoa1814213 [DOI] [PubMed] [Google Scholar]
- 13.Egeblad M, Nakasone ES, Werb Z (2010) Tumors as organs: complex tissues that interface with the entire organism. Dev Cell 18:884–901. 10.1016/j.devcel.2010.05.012 [DOI] [PMC free article] [PubMed] [Google Scholar]
- 14.Henke E, Nandigama R, Ergun S (2019) Extracellular matrix in the tumor microenvironment and its impact on cancer therapy. Front Mol Biosci 6:160. 10.3389/fmolb.2019.00160 [DOI] [PMC free article] [PubMed] [Google Scholar]
- 15.Saatci O, Kaymak A, Raza U, Ersan PG, Akbulut O, Banister CE et al. (2020) Targeting lysyl oxidase (LOX) overcomes chemotherapy resistance in triple negative breast cancer. Nat Commun 11:2416. 10.1038/s41467-020-16199-4 [DOI] [PMC free article] [PubMed] [Google Scholar]
- 16.Berrazouane S, Boisvert M, Salti S, Mourad W, Al-Daccak R, Barabe F et al. (2019) Beta1 integrin blockade overcomes doxorubicin resistance in human T-cell acute lymphoblastic leukemia. Cell Death Dis 10:357. 10.1038/s41419-019-1593-2 [DOI] [PMC free article] [PubMed] [Google Scholar]
- 17.Cooper J, Giancotti FG (2019) Integrin signaling in cancer: mechanotransduction, stemness, epithelial plasticity, and therapeutic resistance. Cancer Cell 35:347–367. 10.1016/j.ccell.2019.01.007 [DOI] [PMC free article] [PubMed] [Google Scholar]
- 18.Lovitt CJ, Shelper TB, Avery VM (2018) Doxorubicin resistance in breast cancer cells is mediated by extracellular matrix proteins. BMC Cancer 18:41. 10.1186/s12885-017-3953-6 [DOI] [PMC free article] [PubMed] [Google Scholar]
- 19.Zhu H, Wang G, Zhu H, Xu A (2021) ITGA5 is a prognostic biomarker and correlated with immune infiltration in gastrointestinal tumors. BMC Cancer 21:269. 10.1186/s12885-021-07996-1 [DOI] [PMC free article] [PubMed] [Google Scholar]
- 20.Zhou C, Shen Y, Wei Z, Shen Z, Tang M, Shen Y et al. (2022) ITGA5 is an independent prognostic biomarker and potential therapeutic target for laryngeal squamous cell carcinoma. J Clin Lab Anal. 10.1002/jcla.24228 [DOI] [PMC free article] [PubMed] [Google Scholar]
- 21.Gilbert LA, Hemann MT (2011) Chemotherapeutic resistance: surviving stressful situations. Cancer Res 71:5062–5066. 10.1158/0008-5472.CAN-11-0277 [DOI] [PMC free article] [PubMed] [Google Scholar]
- 22.Senthebane DA, Rowe A, Thomford NE, Shipanga H, Munro D, Mazeedi M et al. (2017) The role of tumor microenvironment in chemoresistance: to survive, keep your enemies closer. Int J Mol Sci. 10.3390/ijms18071586 [DOI] [PMC free article] [PubMed] [Google Scholar]
- 23.Hwang D, Rust AG, Ramsey S, Smith JJ, Leslie DM, Weston AD et al. (2005) A data integration methodology for systems biology. Proc Natl Acad Sci U S A 102:17296–17301. 10.1073/pnas.0508647102 [DOI] [PMC free article] [PubMed] [Google Scholar]
- 24.Archer TC, Fertig EJ, Gosline SJ, Hafner M, Hughes SK, Joughin BA et al. (2016) Systems approaches to cancer biology. Cancer Res 76:6774–6777. 10.1158/0008-5472.CAN-16-1580 [DOI] [PMC free article] [PubMed] [Google Scholar]
- 25.Nagy A, Lanczky A, Menyhart O, Gyorffy B (2018) Validation of miRNA prognostic power in hepatocellular carcinoma using expression data of independent datasets. Sci Rep 8:9227. 10.1038/s41598-018-27521-y [DOI] [PMC free article] [PubMed] [Google Scholar]
- 26.Jezequel P, Loussouarn D, Guerin-Charbonnel C, Campion L, Vanier A, Gouraud W et al. (2015) Gene-expression molecular subtyping of triple-negative breast cancer tumours: importance of immune response. Breast Cancer Res 17:43. 10.1186/s13058-015-0550-y [DOI] [PMC free article] [PubMed] [Google Scholar]
- 27.Zhao XG, Hu JY, Tang J, Yi W, Zhang MY, Deng R et al. (2019) miR-665 expression predicts poor survival and promotes tumor metastasis by targeting NR4A3 in breast cancer. Cell Death Dis 10:479. 10.1038/s41419-019-1705-z [DOI] [PMC free article] [PubMed] [Google Scholar]
- 28.Enerly E, Steinfeld I, Kleivi K, Leivonen SK, Aure MR, Russnes HG et al. (2011) miRNA-mRNA integrated analysis reveals roles for miRNAs in primary breast tumors. PLoS ONE 6:e16915. 10.1371/journal.pone.0016915 [DOI] [PMC free article] [PubMed] [Google Scholar]
- 29.de Rinaldis E, Gazinska P, Mera A, Modrusan Z, Fedorowicz GM, Burford B et al. (2013) Integrated genomic analysis of triple-negative breast cancers reveals novel microRNAs associated with clinical and molecular phenotypes and sheds light on the pathways they control. BMC Genomics 14:643. 10.1186/1471-2164-14-643 [DOI] [PMC free article] [PubMed] [Google Scholar]
- 30.Agarwal V, Bell GW, Nam JW, Bartel DP (2015) Predicting effective microRNA target sites in mammalian mRNAs. Elife. 10.7554/eLife.05005 [DOI] [PMC free article] [PubMed] [Google Scholar]
- 31.Szot CS, Buchanan CF, Freeman JW, Rylander MN (2011) 3D in vitro bioengineered tumors based on collagen I hydrogels. Bio-materials 32:7905–7912. 10.1016/j.biomaterials.2011.07.001 [DOI] [PMC free article] [PubMed] [Google Scholar]
- 32.Motte S, Kaufman LJ (2013) Strain stiffening in collagen I networks. Biopolymers 99:35–46. 10.1002/bip.22133 [DOI] [PubMed] [Google Scholar]
- 33.Anguiano M, Castilla C, Maska M, Ederra C, Pelaez R, Morales X et al. (2017) Characterization of three-dimensional cancer cell migration in mixed collagen-Matrigel scaffolds using microfluidics and image analysis. PLoS ONE 12:e0171417. 10.1371/journal.pone.0171417 [DOI] [PMC free article] [PubMed] [Google Scholar]
- 34.Kimura H, Weisz A, Ogura T, Hitomi Y, Kurashima Y, Hashimoto K et al. (2001) Identification of hypoxia-inducible factor 1 ancillary sequence and its function in vascular endothelial growth factor gene induction by hypoxia and nitric oxide. J Biol Chem 276:2292–2298. 10.1074/jbc.M008398200 [DOI] [PubMed] [Google Scholar]
- 35.Rashid I, Pathak AK, Kumar R, Srivastava P, Singh M, Murali S et al. (2019) Genome-wide comparative analysis of HIF binding sites in cyprinus carpio for in silico identification of functional hypoxia response elements. Front Genet 10:659. 10.3389/fgene.2019.00659 [DOI] [PMC free article] [PubMed] [Google Scholar]
- 36.Singh P, Carraher C, Schwarzbauer JE (2010) Assembly of fibronectin extracellular matrix. Annu Rev Cell Dev Biol 26:397–419. 10.1146/annurev-cellbio-100109-104020 [DOI] [PMC free article] [PubMed] [Google Scholar]
- 37.Hamidi H, Pietila M, Ivaska J (2016) The complexity of integrins in cancer and new scopes for therapeutic targeting. Br J Cancer 115:1017–1023. 10.1038/bjc.2016.312 [DOI] [PMC free article] [PubMed] [Google Scholar]
- 38.Ju JA, Godet I, Ye IC, Byun J, Jayatilaka H, Lee SJ et al. (2017) Hypoxia selectively enhances integrin alpha5beta1 receptor expression in breast cancer to promote metastasis. Mol Cancer Res 15:723–734. 10.1158/1541-7786.MCR-16-0338 [DOI] [PMC free article] [PubMed] [Google Scholar]
- 39.Schaffner F, Ray AM, Dontenwill M (2013) Integrin alpha5beta1, the fibronectin receptor, as a pertinent therapeutic target in solid tumors. Cancers 5:27–47. 10.3390/cancers5010027 [DOI] [PMC free article] [PubMed] [Google Scholar]
- 40.Morozevich GE, Kozlova NI, Susova OY, Lupatov AY, Berman AE (2017) Hyperexpression of Integrin alpha5beta1 Promotes Resistance of MCF-7 Human Breast Carcinoma Cells to Doxorubicin via ERK Protein Kinase Downregulation. Biochemistry (Mosc) 82:1017–1024. 10.1134/S0006297917090048 [DOI] [PubMed] [Google Scholar]
- 41.Aota S, Nomizu M, Yamada KM (1994) The short amino acid sequence Pro-His-Ser-Arg-Asn in human fibronectin enhances cell-adhesive function. J Biol Chem 269:24756–24761 [PubMed] [Google Scholar]
- 42.Chavez KJ, Garimella SV, Lipkowitz S (2010) Triple negative breast cancer cell lines: one tool in the search for better treatment of triple negative breast cancer. Breast Dis 32:35–48. 10.3233/BD-2010-0307 [DOI] [PMC free article] [PubMed] [Google Scholar]
- 43.Holliday DL, Speirs V (2011) Choosing the right cell line for breast cancer research. Breast Cancer Res 13:215. 10.1186/bcr2889 [DOI] [PMC free article] [PubMed] [Google Scholar]
- 44.Lucero HA, Kagan HM (2006) Lysyl oxidase: an oxidative enzyme and effector of cell function. Cell Mol Life Sci 63:2304–2316. 10.1007/s00018-006-6149-9 [DOI] [PMC free article] [PubMed] [Google Scholar]
- 45.Ghaemi Z, Soltani BM, Mowla SJ (2019) MicroRNA-326 functions as a tumor suppressor in breast cancer by targeting ErbB/PI3K signaling pathway. Front Oncol 9:653. 10.3389/fonc.2019.00653 [DOI] [PMC free article] [PubMed] [Google Scholar] [Retracted]
- 46.Hu S, Ran Y, Chen W, Zhang Y, Xu Y (2017) MicroRNA-326 inhibits cell proliferation and invasion, activating apoptosis in hepatocellular carcinoma by directly targeting LIM and SH3 protein 1. Oncol Rep 38:1569–1578. 10.3892/or.2017.5810 [DOI] [PubMed] [Google Scholar]
- 47.Hong BS, Ryu HS, Kim N, Kim J, Lee E, Moon H et al. (2019) Tumor suppressor miRNA-204–5p regulates growth, metastasis, and immune microenvironment remodeling in breast cancer. Cancer Res 79:1520–1534. 10.1158/0008-5472.CAN-18-0891 [DOI] [PubMed] [Google Scholar]
- 48.Rupaimoole R, Calin GA, Lopez-Berestein G, Sood AK (2016) miRNA deregulation in cancer cells and the tumor microenvironment. Cancer Discov 6:235–246. 10.1158/2159-8290.CD-15-0893 [DOI] [PMC free article] [PubMed] [Google Scholar]
- 49.Zhang P, Kong F, Deng X, Yu Y, Hou C, Liang T et al. (2017) MicroRNA-326 suppresses the proliferation, migration and invasion of cervical cancer cells by targeting ELK1. Oncol Lett 13:2949–2956. 10.3892/ol.2017.5852 [DOI] [PMC free article] [PubMed] [Google Scholar]
- 50.Sun C, Huang C, Li S, Yang C, Xi Y, Wang L et al. (2016) Has-miR-326 targets CCND1 and inhibits non-small cell lung cancer development. Oncotarget 7:8341–8359. 10.18632/oncotarget.7071 [DOI] [PMC free article] [PubMed] [Google Scholar]
- 51.Nawaz Z, Patil V, Paul Y, Hegde AS, Arivazhagan A, Santosh V et al. (2016) PI3 kinase pathway regulated miRNome in glioblastoma: identification of miR-326 as a tumour suppressor miRNA. Mol Cancer 15:74. 10.1186/s12943-016-0557-8 [DOI] [PMC free article] [PubMed] [Google Scholar]
- 52.Liang Z, Wu H, Xia J, Li Y, Zhang Y, Huang K et al. (2010) Involvement of miR-326 in chemotherapy resistance of breast cancer through modulating expression of multidrug resistance-associated protein 1. Biochem Pharmacol 79:817–824. 10.1016/j.bcp.2009.10.017 [DOI] [PubMed] [Google Scholar]
- 53.Hockel M, Vaupel P (2001) Tumor hypoxia: definitions and current clinical, biologic, and molecular aspects. J Natl Cancer Inst 93:266–276. 10.1093/jnci/93.4.266 [DOI] [PubMed] [Google Scholar]
- 54.Rohwer N, Cramer T (2011) Hypoxia-mediated drug resistance: novel insights on the functional interaction of HIFs and cell death pathways. Drug Resist Updat 14:191–201. 10.1016/j.drup.2011.03.001 [DOI] [PubMed] [Google Scholar]
- 55.Bertout JA, Patel SA, Simon MC (2008) The impact of O2 availability on human cancer. Nat Rev Cancer 8:967–975. 10.1038/nrc2540 [DOI] [PMC free article] [PubMed] [Google Scholar]
- 56.Krishnamachary B, Berg-Dixon S, Kelly B, Agani F, Feldser D, Ferreira G et al. (2003) Regulation of colon carcinoma cell invasion by hypoxia-inducible factor 1. Cancer Res 63:1138–1143 [PubMed] [Google Scholar]
- 57.Song X, Liu X, Chi W, Liu Y, Wei L, Wang X et al. (2006) Hypoxia-induced resistance to cisplatin and doxorubicin in non-small cell lung cancer is inhibited by silencing of HIF-1alpha gene. Cancer Chemother Pharmacol 58:776–784. 10.1007/s00280-006-0224-7 [DOI] [PubMed] [Google Scholar]
- 58.Botla SK, Gholami AM, Malekpour M, Moskalev EA, Fallah M, Jandaghi P et al. (2012) Diagnostic values of GHSR DNA methylation pattern in breast cancer. Breast Cancer Res Treat 135:705–713. 10.1007/s10549-012-2197-z [DOI] [PubMed] [Google Scholar]
- 59.Mishra RR, Belder N, Ansari SA, Kayhan M, Bal H, Raza U et al. (2018) Reactivation of cAMP pathway by PDE4D inhibition represents a novel druggable axis for overcoming tamoxifen resistance in ER-positive breast cancer. Clin Cancer Res 24:1987–2001. 10.1158/1078-0432.CCR-17-2776 [DOI] [PubMed] [Google Scholar]
- 60.Saatci O, Borgoni S, Akbulut O, Durmus S, Raza U, Eyupoglu E et al. (2018) Targeting PLK1 overcomes T-DM1 resistance via CDK1-dependent phosphorylation and inactivation of Bcl-2/xL in HER2-positive breast cancer. Oncogene 37:2251–2269. 10.1038/s41388-017-0108-9 [DOI] [PubMed] [Google Scholar]
- 61.Raza U, Saatci O, Uhlmann S, Ansari SA, Eyupoglu E, Yurdusev E et al. (2016) The miR-644a/CTBP1/p53 axis suppresses drug resistance by simultaneous inhibition of cell survival and epithelial-mesenchymal transition in breast cancer. Oncotarget 7:49859–49877. 10.18632/oncotarget.10489 [DOI] [PMC free article] [PubMed] [Google Scholar]
- 62.Gyorffy B, Lanczky A, Eklund AC, Denkert C, Budczies J, Li Q et al. (2010) An online survival analysis tool to rapidly assess the effect of 22,277 genes on breast cancer prognosis using microarray data of 1,809 patients. Breast Cancer Res Treat 123:725–731. 10.1007/s10549-009-0674-9 [DOI] [PubMed] [Google Scholar]
- 63.Dweep H, Gretz N (2015) miRWalk20: a comprehensive atlas of microRNA-target interactions. Nat Methods 12:697. 10.1038/nmeth.3485 [DOI] [PubMed] [Google Scholar]
Associated Data
This section collects any data citations, data availability statements, or supplementary materials included in this article.
Supplementary Materials
Data Availability Statement
Raw RNA-seq data analyzed in the current study have been made available on NCBI Sequence Read Archive with accession PRJNA607780. The small RNA-Seq data have also been deposited to the SRA with the submission ID: PRJNA806717.