

ABSTRACT
The present study aims to investigate the effect of amount of lateralization and/or anteversion of the point where the iliac cut meets with the posterior column cut of periacetabular osteotomy (PAO), on X-ray parameters such as Center of edge (CE) angle, retroversion index (RVI) and sharp angle. Fourteen patients with symptomatic hip dysplasia (CE° < 20°) were included. Pelvis Computerized tomography (CT) sections were used for 3D printing. PAO was then performed on these models. The point (A), 1 cm lateral to the pelvic brim, is marked where the iliac cut intersects the posterior column cut. In Group I (1.5–0), point A is lateralized parallel to the osteotomy line for 1.5 cm. In Group II (1.5–0.5), it is additionally anteverted for 0.5 cm. In Group III (3–0), point A is lateralized for 3 cm and then additionally anteverted for 1 cm (Group IV: 3–1). Radiographs were taken in each stage. The lateral CE angle, RVI and sharp angle were measured. All had an increase in the CE angle and RVI and a decrease in the sharp angle compared to the control group (P < 0.05). The amount of CE angle (ΔCE) or RVI increase (ΔRV) was as follows: 3–1(38°, 0.3) > 3–0(27°, 0.2) and 1.5–0.5(25°, 0.1) > 1.5–0(17°, 0.07) (P < 0.05) (with no difference between groups 1.5–0.5 and 3–0, P = 0.7). The amount of sharp angle decrease was as follows: 3–1(20°), 3–0(18°) < 1.5–0.5(11°) < 1.5–0(8°) (P < 0.05). The lateralization of the intersection point where the iliac wing cut meets with the posterior column cut along the cut surface led to an increase of lateral cover and focal retroversion. Additional anteversion leads to further increases in those parameters, while groups 1.5–0.5 and 3–0 did not differ between.
INTRODUCTION
Periacetabular osteotomy (PAO) is the main treatment modality in symptomatic hip dysplasia [1]. The outcome of PAO is dependent on the precise reorientation of the free acetabular fragment; therefore, intraoperative measures of this reorientation are most important [2, 3]. The intraoperative correction amount is mostly judged using fluoroscopy or pelvic radiographs [4].
Three-dimensional printing is a recent, very accurate technology ‘better than 1 mm’ and used in various aspects of orthopedics, including preoperative planning of PAO [5–9]. The preoperative CT-based 3D printed model is then used to create cutting templates to be used later or decide the amount of correction of the free acetabular fragment intraoperatively [8–10].
As reported, 3D-based models used at PAO created reproducible planning to obtain predetermined or planned radiographic parameters possibly better than traditional PAO, and the amount of translation and/or rotation of the free acetabular fragment could be decided from these printed models [8–10]. In the present study, 3D printed pelvises of the dysplastic patients were used, and the present study tried to clarify the amount of change in pelvic radiograph parameters when a determined surgical point (e.g. point of osteotomy where the iliac and posterior column cuts intersect that is proximal to the pelvic brim and two cuts make an angle of approximately 120° between each other [11]) is lateralized and plus anteverted. Thus, the present study aims to investigate the effect of a certain degree of the lateralization and/or plus anteversion of the free acetabular fragment through a determined point ‘intersection of the iliac and posterior column cuts’ that is easily recognized intraoperatively, on pelvis radiograph parameters. The hypothesis was that lateralization of that particular point through the pelvis brim parallel inner surface will both increase lateral coverage and retroversion; however, lateralization plus anteversion would further increase lateral coverage without an increase of retroversion.
METHODS
Fourteen adult patients with symptomatic hip dysplasia (CE° < 20°) who were consecutive patients from a single surgeon were included in this study. Local institutional ethics committee approval was taken. There were 1 male and 13 female patients. The mean age of the patients was 28 ± 7 years. Symptomatic side was included for analysis.
The preoperative and postoperative images were acquired by CT with 3-ml-thick slices. The CT images were segmented using imported 3D Slicer (version 4.8.1), an open-source software (https://www.slicer.org). The 3D reconstruction was digitally cleaned from all surrounding artifacts and remnants of the soft tissue, which was then saved as an stereolithography (STL) file. After that, the STL file imported an open-source program in Autodesk MeshMixer (Autodesk Inc, San Rafael, CA). In Autodesk MeshMixer (version 3.5.4), the reconstructed holes/lines within the STL file are halved with the plane cut command. The final hemipelvis models of the 3D image are again exported in the STL format.
Print preparation was made using Cura (version 4.5.0) software, and fused deposition type 3D printing was made on an Ultimaker 3+ Extended FDM printer (Ultimaker BV, the Netherlands) using the polylactic acid (PLA) filament. The following parameters were used for printing: layer height of 0.2 mm, wall thickness of 2.5 mm and, in order to print the model hollow, 0% infill. Hollow PLA models were easily cut with the oscillating bone saw with less debris to navigate than models with infill.
The average print time was 16 h, and the average amount of filament used was 250 g for the hemipelvis model. The printed femoral head and pertrochanteric area were fused to the lower part of the ischium to delineate the center of the femoral head for the measurement of the lateral CE angle later. Three pieces of the pelvis (two hemipelvis and a sacrum) were assembled together, and 12-mm space was provided between the rami of the pubis to replicate the cartilage of symphysis pubis [12–14].
Then, traditional Bernese PAO was performed [11]. Before the start of the retro-acetabular cut, the point (A), 1 cm lateral to the pelvic brim, was marked where the iliac cut intersects the posterior column cut (Figs 1 and 2). The second marked point is the start point of the iliac wing cut at the anterior inferior iliac spine (B). Point A could be easily detected during surgery, and a surgeon could easily assess the degree of displacement of the free fragment using this point as a reference due to the jigsaw appearance of cut bones. Configurations were made sequentially at 14 pelvis models. Thereafter, point A was lateralized along (or parallel to) the osteotomy line and medial surface of the iliac wing for 1.5 cm (Group I; 1.5–0), plus anteverted for 0.5 cm (Group II: 1.5–0.5) and lateralized for 3 cm (Group III: 3–0) and then additionally anteverted for 1 cm (Group IV: 3–1) (Fig. 2). Distances were measured with digital calipers.
Fig. 1.

Demonstration of osteotomies on the models (a) osteotomy, (b) extension of the fragment, (c,d) abduction plus external rotation or anteversion of the fragment so intersection points are exactly on the osteotomy line (Group I) and (e) additional 0.5 cm anteversion (Group II).
Fig. 2.

Illustration of PAO on the pelvis model and formation of groups according to the amount of lateralization and anteversion of point A. Group I (1.5–0): point A, 1.5 cm lateralized; Group II (1.5–0.5): plus 0.5 cm anteverted; Group III (3–0): point A, 3 cm lateralized; Group IV ([1–3]): plus 1 cm anteverted.
For neutral pelvis X-ray, the pelvis was positioned with the pubic symphysis and bilateral anterior superior iliac spines supporting the construct on a flat radiograph cassette, replicating the anatomical frontal plane [12, 13, 15, 16]. X-ray tube distance was set on the symphysis pubis with a tube to cassette distance of 120 cm [15]. A neutral anteroposterior pelvic X-ray verified that the bilateral obturator foramen and iliac wing appeared symmetric, and the tip of the coccyx was 1–3 cm directly over the pubic symphysis [16]. Neutral pelvis X-rays were taken at each stage (no correct, 1.5 cm lateralization, 1.5 cm lateralization + 0.5 cm anteversion, 3 cm lateralization and 3 cm lateralization + 1 cm anteversion). The lateral CE angle, sharp angle and acetabular retroversion index (RVI) were then measured.
The lateral CE angle was defined as the angle between the lateral-most point of the acetabulum and vertical line (90° to pelvic inclination line ‘connecting right, left ischial tuberosity’ passing through the center of the femoral head ‘found with best-fit circle’) (Fig. 3). The sharp angle was the angle between a pelvic inclination line and the line joining the outermost ossified portion of the acetabulum to the pelvic teardrop (Fig. 4). The RVI was the ratio of the length of the lateral overlap of the anterior rim to the entire length of the acetabular opening [17–19] (Fig. 5). All measurements were done by two senior orthopedic surgeons.
Fig. 3.
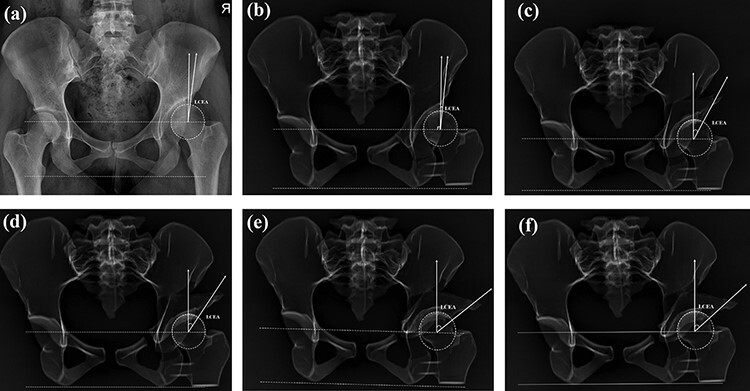
Lateral center-edge angle measurement: (a) measurement on the pelvis X-ray, (b) measurements on the control group 3D model X-rays, (c) measurements on Group I (1.5 cm lateralized and 0° anteverted) 3D model X-rays, (d) measurements on Group II (1.5 cm lateralized and 0.5 cm anteverted) 3D model X-rays, (e) measurements on Group III (3 cm lateralized and 0° anteverted) 3D model X-rays and (f) measurements on Group IV (3 cm lateralized and 1 cm anteverted) 3D model X-rays.
Fig. 4.
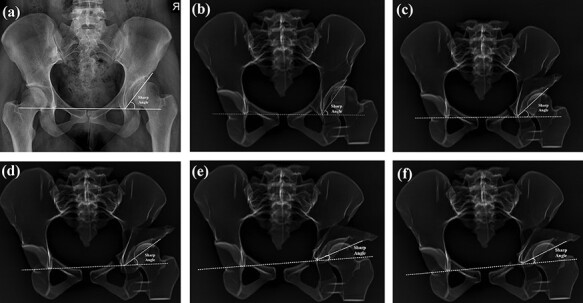
Sharp angle measurement: (a) measurement on the pelvis X-ray, (b) measurements on the control group 3D model X-rays, (c) measurements on Group I (1.5 cm lateralized and 0° anteverted) 3D model X-rays, (d) measurements on Group II (1.5 cm lateralized and 0.5 cm anteverted) 3D model X-rays, (e) measurements on Group III (3 cm lateralized and 0° anteverted) 3D model X-rays and (f) measurements on the Group IV (3 cm lateralized and 1 cm anteverted) 3D model X-rays.
Fig. 5.
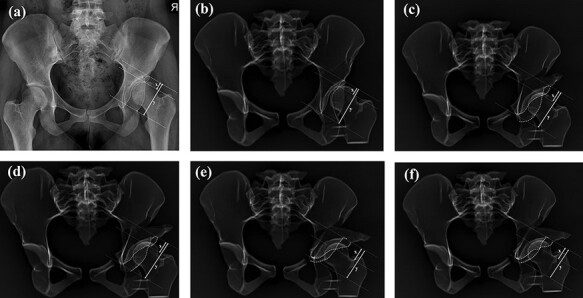
RVI measurement: (a) measurement on the pelvis X-ray, (b) measurements on the control group 3D model X-rays, (c) measurements on Group I (1.5 cm lateralized and 0° anteverted) 3D model X-rays, (d) measurements on Group II (1.5 cm lateralized and 0.5 cm anteverted) 3D model X-rays, (e) measurements on Group III (3 cm lateralized and 0° anteverted) 3D model X-rays and (f) measurements on Group IV (3 cm lateralized and 1 cm anteverted) 3D model X-rays.
Data were evaluated with IBM SPSS Statistics Standard Concurrent User V 26 (IBM Corp., Armonk, NY, USA). The Wilcoxon matched pairs test was used to analyze dependent, continuous data. First, comparison was made with the control group. Second, the amount of change of measured parameters compared to the control group was analyzed (ΔCE, ΔRV and ΔSharp) and was compared with each other. P < 0.05 was considered statistically significant.
RESULTS
All had an increase in the CE angle and RV index and a decrease in the sharp angle compared to the control group (P < 0.05). The amount of CE angle increase (ΔCE) was as follows: IV (38°) < III (27°) and II (25°) < I (17°) (P < 0.05), while no difference was found between III and II groups (P = 0.7).
The amount of RV index (ΔRV) increase was also similar to IV (0.3) < III (0.2), II (0.1) < I (0.07) (P < 0.05) with no difference between III and II groups (P = 0.2).
The amount of sharp angle decrease (ΔSharp) was like IV (20°), III (18°) < II (11°) < I (8°) (P < 0.05) with no difference between IV vs. III groups (P = 0.1). The results are summarized in Table I.
Table I.
Radiological measurement statistics in all groups (lateralizationcm-anteversioncm)
|
Groups
(n:14) |
CE° (Δ) | RVI(Δ) | Sharp angle° (Δ) | ASIS (mm) |
|---|---|---|---|---|
| Control | 8 ± 8 | 0.1 ± 0.1 | 48 ± 4 | – |
| I (1.5–0) | 26 ± 7 (17°)a,b | 0.2 ± 0.1 (0.07)f,g | 39 ± 5 (8°)k,l | 22 ± 4 |
| II (1.5–0.5) | 33 ± 10 (25°)a,c,d | 0.3 ± 0.1 (0.1)f,h,i | 36 ± 7 (11°)k,m,n | 29 ± 5 |
| III (3–0) | 36 ± 10 (27°)b,c,e | 0.3 ± 0.2 (0.2)g,h,j | 30 ± 7 (18°)l,m,o | 42 ± 6 |
| IV (3–1) | 46 ± 6 (38°)d,e | 0.5 ± 0.3 (0.3)i,j | 27 ± 7 (20°)n,o | 51 ± 6 |
CE: lateral center-edge angle, ASIS: anterior inferior iliac spine.
P = 0.009, bP = 0.01, cP = 0.7, dP = 0.001, eP = 0.002, fP = 0.03, gP = 0.006, hP = 0.2, iP = 0.002, jP = 0.02, kP = 0.02, lP = 0.001, mP = 0.002, nP = 0.001, oP = 0.1
DISCUSSION
The hypothesis was partly proven that lateralization of that intersection point through the pelvis brim or parallel to the cut inner surface increased both lateral coverage and retroversion; however, lateralization plus anteversion also led to an increase in both parameters failing to prevent the increase of retroversion.
Three-dimensional printing is a recent technology that has been used both preoperatively for planning or intraoperatively to aid the surgical steps, including PAO surgery, and has been shown to be beneficial to reduce surgery time X-ray exposure [7–9, 20]. Also, the degree of correction in X-ray or CT images after various osteotomies of orthopedic surgery at 3D printed models has been studied, including pelvic osteotomies for acetabular dysplasia [21–23].
Caffrey et al. [23] reported the effects of various pelvic osteotomies on the acetabular version, volume and coverage angles using pre- and postoperative CT images of 3D printed pelvic models. To our knowledge, for peri-acetabular osteotomy, there is not any study clarifying the effects of the degree of lateralization or anteversion of the osteotomized-free acetabular fragment on postoperative X-ray parameters. There are two types of usage of 3D printing technology for PAO. The first type is creating a preoperative 3D pelvis of the patient and deciding the correction amount using that model intraoperatively. The second type is creating a 3D printed custom cutting template to be used later during surgery [7–10, 24].
Fukushima et al. [9] reported that using the preoperative 3D pelvic patient model allowed them to do osteotomy lines, determining the position of the fragment accurately. They decided to decrease the amount of lateralization of the fragment to 1 cm instead of 1.5 cm to prevent anterior impingement with the femoral head.
In the second study, Shelton et al. [8] reported that using a 3D printed model of the patient allowed them to create an accurate surgical plan and obtain predetermined postoperative hip coverage parameters. A sterilized 3D printed (PAO performed) model is put next to the surgical field after the cuts are performed. They then orient and correct the fragment to match the 3D model.
During this match with the model, the version and orientation of the fragment were arranged concerning the intersection point of medial iliac/posterior column cuts like the point used in the present study. They also continue matching the model by obtaining the same distance from the edge of the proximal segment to the corrected distal segment.
Last, Markhardt et al. [7] retrospectively compared patients receiving PAO with additional preoperative planning with the 3D model with patients having traditional PAO and reported a nonsignificant reduction of surgery or correction times in the study group. They relate this to the presence of additional surgeries like labral repair and cam decompression.
In the present study, lateralization of the free fragments parallel to the pelvic brim or parallel to the medial surface of the wing without any anteversion led to both increases of lateral cover and focal retroversion. 1.5 cm lateralization led to a mean of 17° increase in the CE angle, while 3 cm lateralization led to 27° increase. 3 cm lateralization or 15 cm lateralization plus 0.5 cm anteversion possess some risk of iatrogenic overcoverage (CE > 40°) that only Group I never led to overcoverage (mean CE: 26 ± 7°), however, with a possible risk of insufficient correction of CE (resultant CE still <20°).
As we expected, there was also an increase of retroversion in no anteversion groups (I ‘1.5–0’ and III ‘3–0’) (0.07 at 1.5 cm and 0.2 at 3 cm) due to both lateralization plus anterior migration of the fragment as constant point (point A) is translated along the inner surface of the iliac wing.
Interestingly, 0.5 cm anteversion in Group II (1.5–0.5) or 1 cm anteversion in Group IV (3–1) led to an increase in both lateral cover and retroversion. However, increases of lateral cover and retroversion were similar between Groups II (1.5–0.5) and III (3–0).
This could be explained that this amount of the posterior rotation of the fragment at that point (point A) (intersection of the iliac wing and the posterior column cut) is not enough to correct retroversion or much effect is lateralization possibly due to the lateral localization of this pivot point or rigid character of the model not permitting the rotation of the fragment through the center of the hip, leading to a further increase of retroversion. Further studies are certainly needed to understand the effects of localization of various pivot points (e.g. medial to point used in the present study) and the amount of rotation on RVI measured on X-rays.
Point A could easily be localized during surgery, and the amount of lateral displacement and anteversion of this point, as done in the present study, could easily and reproducibly be produced due to the osteotomy line having a jigsaw appearance and being fully traceable here. As the 1.5–0.5 group increased the lateral cover and retroversion similar to group 3–0, with still some risk of overcoverage, and group 1 (1.5–0) never led to overcovarage, 1.5 cm lateralization plus lesser than 0.5 cm anteversion seem to be ideal for correcting lateral cover, however, still with an increase of focal retroversion.
There exist some limitations. The present study cannot fully replicate in vivo scenario that joints are more flexible and soft tissues are excluded here. This study could have been performed on cadavers; however, obtaining young-aged cadavers with acetabular dysplasia is extremely challenging. As stated before, 3D-based models used at PAO have been proved to be successful in obtaining predetermined or planned radiographic parameters [8–10]. Second, 3D models have been started to be used to investigate the effects of various osteotomies on measured parameters on X-ray or CT images [21–23].
Second, this model, although described in the literature, may not replicate the position of the pelvis while obtaining an antero-posterior (AP) radiograph [12, 13, 15, 16]. The number of specimens was limited to certainly report that 1.5 cm of lateralization of the free fragment will increase the CE° by 15°–17° and 3 cm lateralization increase by 27°–30°. Further studies are needed to delineate this clearly and also investigate the effects of the amount of anteversion and/or localization of the point where it is anteverted or translated on retroversion values measured on postop X-rays.
CONCLUSIONS
The lateralization of the point where the iliac wing cut meets with the last ‘posterior column’ cut along the osteotomy line led to an increase of both lateral cover and focal retroversion. Further additional anteversion led to further increases, partly rejecting the initial hypothesis ‘lateralization plus anteversion would further increase lateral coverage without an increase of retroversion’, while Group II (1.5–0.5) and Group III (3–0) did not differ for the magnitude of increases. At least 1.5-cm lateralization plus some degree of anteversion are needed for optimal CE values.
ACKNOWLEDGEMENTS
We thank our colleagues at Dokuz Eylul University who provided insight and expertise that greatly assisted the research.
Contributor Information
Onur Hapa, Department of Orthopedic Surgery, Dokuz Eylul University, Izmir 35330, Turkey.
Selahattin Aydemir, Department of Orthopedic Surgery, Dokuz Eylul University, Izmir 35330, Turkey.
R Bugra Husemoglu, Department of Biomechanics, Dokuz Eylul University, Izmir 35330, Turkey.
Berkay Yanik, Department of Orthopedic Surgery, Izmir Provincial Health Directorate Urla State Hospital, Izmir 35430, Turkey.
Onur Gursan, Department of Orthopedic Surgery, Dokuz Eylul University, Izmir 35330, Turkey.
Ali Balci, Department of Radiology, Dokuz Eylul University, Izmir 35330, Turkey.
Hasan Havitcioglu, Department of Orthopedic Surgery, Dokuz Eylul University, Izmir 35330, Turkey.
FUNDING
We declare that no financial support has been received from any institution for the submitted work.
CONFLICT OF INTEREST STATEMENT
None declared.
REFERENCES
- 1. Ganz R, Klaue K, Vinh TS. et al. A new periacetabular osteotomy for the treatment of hip dysplasias: technique and preliminary results. Clin Orthop Relat Res 1988; 232: 26–36. [PubMed] [Google Scholar]
- 2. Hartig-Andreasen C, Troelsen A, Thillemann TM. et al. What factors predict failure 4 to 12 years after periacetabular osteotomy? Clin Orthop Relat Res 2012; 470: 2978–87. [DOI] [PMC free article] [PubMed] [Google Scholar]
- 3. Siebenrock KA, Schöll E, Lottenbach M. et al. Bernese periacetabular osteotomy. Clin Orthop Relat Res 1999; 363: 9–20. [PubMed] [Google Scholar]
- 4. Kosuge D, Cordier T, Solomon LB. et al. Dilemmas in imaging for peri-acetabular osteotomy. Bone Joint J 2014; 96–B: 1155–60. [DOI] [PubMed] [Google Scholar]
- 5. George E, Liacouras P, Rybicki FJ. et al. Measuring and establishing the accuracy and reproducibility of 3D printed medical models. Radiographics 2017; 37: 1424–50. [DOI] [PMC free article] [PubMed] [Google Scholar]
- 6. Wang J, Cai L, Xie L. et al. 3D printing-based Ganz approach for treatment of femoral head fractures: a prospective analysis. J Orthop Surg Res 2019; 14: 338. [DOI] [PMC free article] [PubMed] [Google Scholar]
- 7. Markhardt BK, Beilfuss MA, Hetzel SJ. et al. 3D-printed models for periacetabular osteotomy surgical planning. J Hip Preserv Surg 2020; 7: 748–54. [DOI] [PMC free article] [PubMed] [Google Scholar]
- 8. Shelton TJ, Monazzam S, Calafi A. et al. Preoperative 3D modeling and printing for guiding periacetabular osteotomy. J Pediatr Orthop 2021; 41: 149–58. [DOI] [PubMed] [Google Scholar]
- 9. Fukushima K, Takahira N, Uchiyama K. et al. Pre-operative simulation of periacetabular osteotomy via a three-dimensional model constructed from salt. Sicot-j 2017; 3: 14. [DOI] [PMC free article] [PubMed] [Google Scholar]
- 10. Wang X, Liu S, Peng J. et al. Development of a novel customized cutting and rotating template for Bernese periacetabular osteotomy. J Orthop Surg Res 2019; 14: 217. [DOI] [PMC free article] [PubMed] [Google Scholar]
- 11. Clohisy JC, Barrett SE, Gordon JE. et al. Periacetabular osteotomy in the treatment of severe acetabular dysplasia. JBJS 2006; 88: 65–83. [DOI] [PubMed] [Google Scholar]
- 12. Li RT, Liu RW, Neral M. et al. Use of the false-profile radiographic view to measure pelvic incidence. Am J Sports Med 2018; 46: 2089–95. [DOI] [PubMed] [Google Scholar]
- 13. Gebhart JJ, Streit JJ, Bedi A. et al. Correlation of pelvic incidence with cam and pincer lesions. Am J Sports Med 2014; 42: 2649–53. [DOI] [PubMed] [Google Scholar]
- 14. Tague RG. Variation in pelvic size between males and females. Am J Phys Anthropol 1989; 80: 59–71. [DOI] [PubMed] [Google Scholar]
- 15. Maruyama M, Feinberg JR, Capello WN. et al. The Frank Stinchfield Award: morphologic features of the acetabulum and femur: anteversion angle and implant positioning. Clin Orthop Relat Res 2001; 393: 52–65. [PubMed] [Google Scholar]
- 16. Li RT, Hu E, Gould H. et al. Does pelvic rotation alter radiologic measurement of anterior and lateral acetabular coverage? Arthrosc J Arthrosc Relat Surg 2019; 35: 1111–1116.e1. [DOI] [PubMed] [Google Scholar]
- 17. Monazzam S, Bomar JD, Cidambi K. et al. Lateral center-edge angle on conventional radiography and computed tomography. Clin Orthop Relat Res 2013; 471: 2233–7. [DOI] [PMC free article] [PubMed] [Google Scholar]
- 18. Siebenrock KA, Kalbermatten DF, Ganz R. Effect of pelvic tilt on acetabular retroversion: a study of pelves from cadavers. Clin Orthop Relat Res 2003; 407: 241–8. [DOI] [PubMed] [Google Scholar]
- 19. Bittersohl B, Freitas J, Zaps D. et al. EOS imaging of the human pelvis: reliability, validity, and controlled comparison with radiography. JBJS 2013; 95: 58. [DOI] [PubMed] [Google Scholar]
- 20. Raza M, Murphy D, Gelfer Y. The effect of three-dimensional (3D) printing on quantitative and qualitative outcomes in paediatric orthopaedic osteotomies: a systematic review. EFORT Open Rev 2021; 6: 130–8. [DOI] [PMC free article] [PubMed] [Google Scholar]
- 21. Weinheimer K, Campbell B, Roush EP. et al. Effects of variations in Dwyer calcaneal osteotomy determined by three-dimensional printed patient-specific modeling. J Orthop Res 2020; 38: 2619–24. [DOI] [PubMed] [Google Scholar]
- 22. Pfeffer GB, Michalski MP, Basak T. et al. Use of 3D prints to compare the efficacy of three different calcaneal osteotomies for the correction of heel varus. Foot Ankle Int 2018; 39: 591–7. [DOI] [PubMed] [Google Scholar]
- 23. Caffrey JP, Jeffords ME, Farnsworth CL. et al. Comparison of 3 pediatric pelvic osteotomies for acetabular dysplasia using patient-specific 3D-printed models. J Pediatr Orthop 2019; 39: 159–64. [DOI] [PubMed] [Google Scholar]
- 24. Zhou Y, Kang X, Li C. et al. Application of a 3-dimensional printed navigation template in Bernese periacetabular osteotomies: A cadaveric study. Medicine (Baltimore) 2016; 95: 5557. [DOI] [PMC free article] [PubMed] [Google Scholar]