

Objectives
The aim of this study was to evaluate the feasibility and accuracy of cardiac late enhancement (LE) scanning for extracellular volume (ECV) quantification with dual-source photon-counting detector computed tomography (PCD-CT).
Materials and Methods
In this institutional review board–approved study, 30 patients (mean age, 79 years; 12 women; mean body mass index, 28 kg/m2) with severe aortic stenosis undergoing PCD-CT as part of their preprocedural workup for transcatheter aortic valve replacement were included. The scan protocol consisted of a nonenhanced calcium-scoring scan, coronary CT angiography (CTA) followed by CTA of the thoracoabdominal aorta, and a low-dose LE scan 5 minutes after the administration of 100 mL contrast media (all scans electrocardiogram-gated). Virtual monoenergetic (65 keV) and dual-energy (DE) iodine images were reconstructed from the LE scan. Extracellular volume was calculated using the iodine ratios of myocardium and blood-pool of the LE scan, and additionally based on single-energy (SE) subtraction of the nonenhanced scan from the LE scan. Three-dimensional analysis was performed automatically for the whole-heart myocardial volume by matching a heart model generated from the respective coronary CTA data. Bland-Altman and correlation analysis were used to compare the ECV values determined by both methods.
Results
The median dose length product for the LE scan was 84 mGy·cm (interquartile range, 69; 125 mGy·cm). Extracellular volume quantification was feasible in all patients. The median ECV value was 30.5% (interquartile range, 28.4%–33.6%). Two focal ECV elevations matched known prior myocardial infarction. The DE- and SE-based ECV quantification correlated well (r = 0.87, P < 0.001). Bland-Altman analysis showed small mean errors between DE- and SE-based ECV quantification (0.9%; 95% confidence interval, 0.1%–1.6%) with narrow limits of agreement (−3.3% to 5.0%).
Conclusions
Dual-source PCD-CT enables accurate ECV quantification using an LE cardiac DE scan at low radiation dose. Extracellular volume calculation from iodine ratios of the LE scan obviates the need for acquisition of a true nonenhanced scan and is not affected by potential misregistration between 2 separate scans.
Key Words: computed tomography, cardiac, extracellular volume, spectral imaging, aortic stenosis
Myocardial extracellular volume (ECV) reflects the proportion of extracellular matrix in the whole myocardium and expands in most pathologies affecting the heart muscle.1–4 The current reference standard for noninvasive quantification of ECV is cardiac magnetic resonance imaging (MRI) using late gadolinium enhancement.1,3
Recently, computed tomography (CT) has been shown to be an alternative noninvasive method for ECV quantification.1,5–10 Extracellular volume quantification with CT requires a late enhancement (LE) scan acquired at least 3 minutes after contrast media injection.7,11 At the time of the LE scan, a relative equilibrium is established between the contrast in the blood pool and in the myocardium, which is a requisite for accurate ECV quantification.7,8 Currently, 2 distinct methods exist to calculate ECV from CT data using conventional energy-integrating detectors. The single-energy (SE) approach derives contrast media distribution and hence ECV by the change of CT attenuation between the precontrast and LE images.1,6,8,12–14 This method has been validated against histology as well as cardiac MRI.6,8 An alternative method is to use dual-energy (DE), which enables the reconstruction of iodine maps from DE-LE scans for calculation of the ECV.10–13
In patients with severe aortic stenosis, ECV reflects the extent of myocardial fibrosis and has been identified as a measure of left heart failure and being an independent predictor of mortality.3 Moreover, these patients often have coexisting cardiac amyloidosis (CA) with a reported prevalence of up to 16%, which has been also associated with worsening prognosis.15,16 Cardiac amyloidosis is characterized by the extracellular accumulation of amyloid fibrils most frequently in the myocardium and the valves, hereby increasing the ECV.7,15,16
The recent introduction of the first whole-body, full field-of-view, dual-source photon-counting detector CT (PCD-CT) heralds a new era in CT imaging. The new detector technology is based on semiconductors directly converting x-ray photons to electrical signals.17–20 Compared with conventional energy-integrating detectors (EIDs), PCD-CT is characterized by an increased contrast-to-noise ratio, improved spatial resolution, reduced electronic noise, and the acquisition of spectral data during every scan.21–28 The inherent spectral capabilities of PCD-CT bear the potential for new ways of data processing such as the direct computation of DE iodine images from the LE scan.18,29
The purpose of our study was to evaluate the feasibility and accuracy of cardiac LE scanning for ECV quantification with dual-source PCD-CT.
MATERIALS AND METHODS
Study Population
Between July and October 2021, 30 patients undergoing CT as part of their preprocedural workup before transcatheter aortic valve replacement (TAVR) as part of a nationwide prospective TAVR registry were included (clinicalTrials.gov Identifier: NCT01368250, blinded for review). The hematocrit levels within 8 hours before CT were noted. Records were screened for prior cardiac imaging examinations with other modalities. Written informed consent was obtained from all patients. This single-center study had local ethics committee approval and was performed in compliance with the Declaration of Helsinki.
Computed Tomography Data Acquisition
All scans were acquired on a first-generation, whole-body, dual-source PCD-CT system (NAEOTOM Alpha; Siemens Healthcare GmbH; Forchheim, Germany) equipped with 2 photon-counting detectors (cadmium telluride), each with a 144 × 0.4-mm collimation. Tube voltage was set at 120 kV, and tube current was automatically adjusted to the chosen image quality (IQ) level in each scan. Gantry rotation time was 0.25 seconds. Electrocardiogram (ECG)-triggered sequential acquisitions were performed for the cardiac scans in the QuantumPlus mode.
First, a nonenhanced scan was acquired for coronary and aortic valve calcium scoring at an IQ level of 20 and an ECG-triggered window fixed to an absolute RR interval of 280 milliseconds. After the injection of 100 mL intravenous iodinated contrast medium (iopromidum, Ultravist 370 mg I/mL; Bayer Healthcare, Berlin, Germany) accompanied by a saline chaser (NaCl 0.9%) of 20 mL with a flow rate of 5 to 6 mL/s, coronary CTA was performed with an IQ level of 44, followed by a high-pitch CTA of the thoracoabdominal aorta with an IQ level of 68. For coronary CTA, the ECG-triggered window was set from 30% to 80% of the RR interval. Finally, an LE cardiac scan was acquired 5 minutes after the contrast injection with an IQ level of 50 and an ECG-triggered window fixed to an absolute RR interval of 280 milliseconds (Fig. 1).
FIGURE 1.

Computed tomography (CT) imaging protocol. Timeline illustrating the preprocedural transcatheter aortic valve replacement planning and extracellular volume (ECV) quantification CT protocol. The LE scan was acquired 5 minutes after the intravenous injection of 100 mL iodinated contrast media. ECG, electrocardiogram; cCTA, coronary CT angiography; CTA, CT angiography.
Image Reconstruction and Extracellular Volume Analysis
Virtual monoenergetic images (VMIs) at 65 keV and a fixed absolute RR interval of 280 milliseconds were reconstructed with quantum iterative reconstruction (QIR) level 3, reconstruction kernel Qr40, 1.5 mm slice thickness, and 1 mm increment for the nonenhanced scan, the coronary CTA, and the LE scan. Dual-energy iodine images were generated from the LE scan.
Extracellular volume was calculated with prototype software (CT Cardiac Functional Analyses; Siemens Healthcare, Forchheim, Germany) in 2 different ways. First, calculation was based on DE-derived iodine concentration in the myocardium and blood pool of the LE scan following the formula:
Second, ECV was computed using the SE method in which the nonenhanced scan is subtracted from the LE postcontrast equilibrium phase images:
Three-dimensional (3D) analysis was performed for the whole heart by matching a heart model generated from the respective coronary CTA data. VMI of the nonenhanced and LE scans were both registered to the CTA data by nonrigid registration.
The LV heart model, automatically determined from the coronary CTA data, was overlaid onto the respective ECV volume data. Results were displayed and numerically exported as 17-segment polar maps. The software included the calculation of ECV in transmural subcompartments by restriction to a percent range of the local radial profile: endocardial (inner 10% to 50%), midmyocardial (inner 25% to outer 25%), and epicardial (50% to outer 10%). For the comparison of ECV(DE) versus ECV(SE), ECV for the total myocardium (10 to 90%) and for the midmyocardial wall (25 to 75%) was determined. In addition, regional ECV patterns were investigated by calculating the difference between endocardial and epicardial ECV, as well as the variation from base to apex.
Statistical Analysis
Analyses were performed using commercially available software (R, version 4.0.2; R Foundation for Statistical Computing, Vienna, Austria, https://www.R-project.org/ and MedCalc, version 19.2.6; MedCalc Software Ltd, Ostend, Belgium, https://www.medcalc.org). Categorical variables are presented as count and percentages. Quantitative variables were expressed as mean ± standard deviation or as median (interquartile range), as appropriate. Confidence intervals were provided as follows: lower limit, upper limit. Bland-Altman and correlation analysis were performed to compare global and midmyocardial wall between ECV(DE) and ECV(SE) quantification. Regional ECV analyses were compared using the Friedman test, the paired Wilcoxon test, and the signed rank sum test. A 2-tailed P value below 0.05 was considered to indicate statistical significance.
RESULTS
Overall, 34 eligible adult patients were identified. One patient with a body mass index (BMI) of 56 kg/m2 showing severe artifacts in every scan (ie, true nonenhanced, coronary CTA, LE scan) was excluded from analysis. Three subjects were not considered for the ECV(SE) versus ECV(DE) comparison because of artifacts in the true nonenhanced scan allowing no precise registration with the LE scan (n = 2) and because of a large left ventricular myocardial infarct making the robust definition of the whole-heart volume of interest impossible (n = 1). Importantly, ECV quantification was feasible in all these 3 patients with the DE method.
A total of 30 patients (12 women, 18 men; mean age, 79 ± 9 years; mean BMI, 28 ± 5 kg/m2) were finally included and considered for analyses. Mean hematocrit in these 30 patients was 0.39 ± 0.06 L/L (Table 1).
TABLE 1.
Patient Characteristics
| No. Subjects | 30 |
|---|---|
| Age, y | 79 ± 9 |
| Sex | 12 women, 18 men |
| Body weight, kg | 75 ± 14 |
| BMI, kg/m2 | 28 ± 5 |
| Hematocrit, L/L | 0.39 ± 0.06 |
| Medical history | |
| Hypertension | 25 (83) |
| Dyslipidemia | 14 (47) |
| Smoking | 13 (43) |
| Diabetes | 15 (50) |
| Significant coronary stenosis (>50%) | 17 (57) |
| Previous myocardial infarction | 4 (13) |
| Previous PTCA | 5 (17) |
| Chronic kidney disease | 12 (40) |
| Echocardiographic measures | |
| Mean LVEF | 51% ± 15% |
| Transvalvular gradient, mm Hg | 34 ± 14 |
| Low-flow low-gradient aortic stenosis | 8 (27) |
Values are given as means ± standard deviations or as n with percentages in parentheses.
BMI, body mass index; PTCA, percutaneous transluminal coronary angioplasty; LVEF, left ventricular ejection fraction.
Radiation Dose
The median dose length product of the LE scan was 84 mGy·cm (69, 125 mGy·cm). Using a conversion coefficient of 0.014 mSv·mGycm−1,30,31 this dose length product resulted in a median effective radiation dose of 1.2 mSv (0.97, 1.75 mSv) for the LE scan. The k-factor for cardiothoracic CT is currently under discussion.32 We chose the old definition to make dose values comparable to other DE studies in the literature.11,13
Extracellular Volume Quantification
Automatic 3D analysis for the whole-heart total volume and myocardial midwall volume was feasible in all 30 patients (100%).
The median total ECV values for the DE and SE method were 30.5% (28.4%, 33.6%) and 30.0% (28.8%, 32.5%); the median midwall ECV values were 30.1% (28.9%, 33.7%) and 29.6% (28.5%, 31.7%), respectively. The ECV(DE) and ECV(SE) values showed a high and significant correlation (r = 0.87 for total, r = 0.88 for midwall, both P < 0.001).
Bland-Altman analysis comparing DE- and SE-derived ECV showed small mean errors of 0.9% (95% confidence interval, 0.1%–1.6%) and narrow limits of agreement (−3.3%, 5.0%) for total ECV (Fig. 2), and of 1.1% (95% confidence interval, 0.3%–1.9%) with narrow limits of agreement (−3.0% to 5.2%) for midmyocardial wall ECV. Two focal ECV elevations matched known prior myocardial infarction. Two representative examples are shown in Figures 3 and 4.
FIGURE 2.
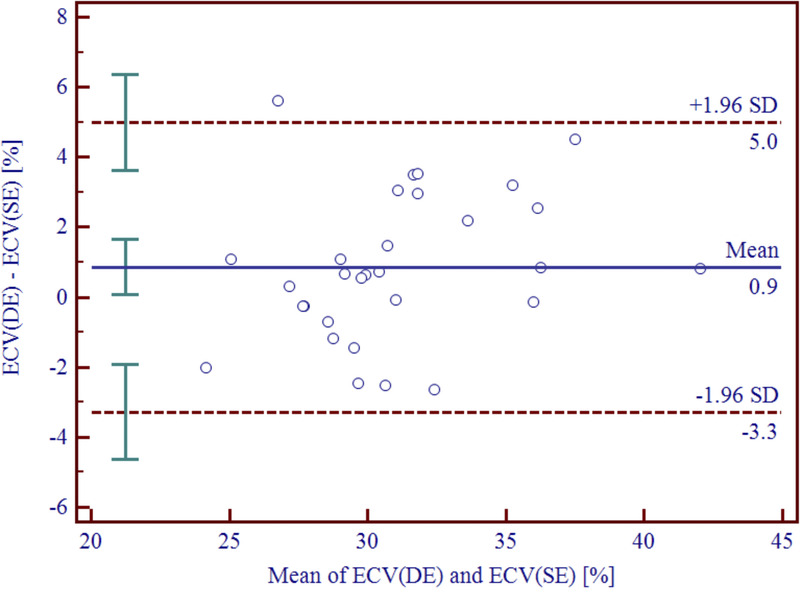
Bland-Altman plot depicting the difference between total ECV(DE) versus ECV(SE) quantification. Bland-Altman analysis showing a small mean error between DE- and SE-derived ECV quantification of 0.9% (95% confidence interval, 0.1%, 1.6%) with narrow limits of agreement of (−3.3%, 5.0%). DE, dual-energy; SD, standard deviation; SE, single-energy.
FIGURE 3.

Automated heart model with elevated ECV. Extracellular volume maps generated from the dual-energy iodine images superimposed on the coronary CT angiography. In this 80-year-old male patient with severe aortic stenosis, hematocrit level was 0.36 L/L and mean midmyocardial ECV was 37.3%. Images are displayed as short axis (A), 2-chamber views (C, D), and ECV American Heart Association 17-segment polar map (B). Hct, hematocrit.
FIGURE 4.
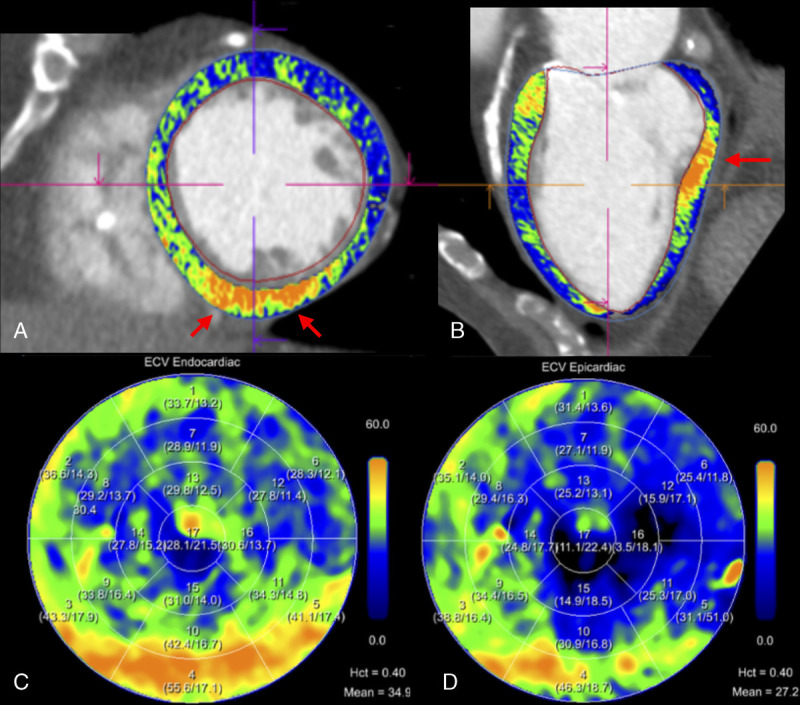
Automated heart model with confirmed infarct. Extracellular volume maps generated from the dual-energy iodine images superimposed on the coronary CT angiography. In this 78-year-old male patient with severe aortic stenosis, hematocrit level was 0.40 L/L and mean midmyocardial ECV was 31.3%. Extracellular volume quantification shows a focal subendocardial lesion of the inferobasal left ventricular wall with ECV values above 50% matching a known prior infarct. Images are displayed as short axis (A), 2-chamber views (B), and ECV American Heart Association 17-segment polar map (C, D). Hct, hematocrit.
Regional Extracellular Volume Analysis
Regional analysis of the transmural ECV gradients as determined with the DE method showed median gradients of 4.8% (2.8%–6.0%), 6.3% (5.1%–7.0%), 3.2% (1.8%–4.9%), and 0.3% (−0.6%, 1.8%) for the anterior, lateral, posterior, and septal wall, respectively (Fig. 5). All gradients were significantly different from zero (P < 0.0001, signed rank sum test) except for the septum (P = 0.28). All gradients were also significantly different from each other (P < 0.00001, Friedman test).
FIGURE 5.

Boxplots presenting regional transmural gradients. Transmural gradients were calculated for the anterior, lateral, posterior, and septal myocardial walls by subtracting epicardial ECV from endocardial ECV. All transmural gradients were significantly different from zero (P < 0.0001) except for the septum (P = 0.28), and significantly different from each other (P < 0.00001). Note the highest transmural gradient in the lateral wall (median, 6.2%; interquartile range, 5.1%–7.0%) and the lowest transmural gradient in the septal wall (median, 0.3%; interquartile range, −0.6% to 1.8%). ∆ECV, difference of extracellular volume; gAnt, gradient anterior wall; gLat, gradient lateral wall; gPost, gradient posterior wall; gSept, gradient septal wall.
Extracellular volume values showed significant variations from the base to the apex of the left ventricle (P = 0.006, Friedman test). The highest median ECV was found at the base (31.3% [28.9%, 34.3%]), compared with midventricular (30.3% [27.6%, 34.3%]) and apical (29.4% [27.6%, 34.2%]) ECV. Basal ECV was significantly higher than both midventricular and apical ECV (P < 0.05, paired Wilcoxon test) (Fig. 6).
FIGURE 6.

Boxplot presenting the ECV variation from base to apex. Basal, midventricular, and apical ECV were significantly different (P = 0.006), with basal ECV being significantly higher compared with both midventricular and apical ECV (P < 0.05). Mid, midventricular.
DISCUSSION
The current study investigated the feasibility of ECV quantification based on DE iodine images from the LE scan obtained with dual-source PCD-CT in comparison to the previously validated SE method. The DE- and SE-derived ECV quantification showed a high correlation between each other (r = 0.87, P < 0.001) with a small mean error of 0.9% and with narrow limits of agreement. The median total ECV value in our patients with severe aortic stenosis, as determined with dual-source PCD-CT, was 30.5% (28.4%–33.6%).
Extracellular volume calculation using DE iodine images from the LE scan is an innovative method and has been assessed in a few recent studies using DE CT data sets acquired with EID-CTs.5,9,11,12,14,33 Dual-energy–derived ECV quantification has some advantages compared with an SE approach. The SE method requires the acquisition of precontrast and postcontrast images to derive contrast media distribution by the change of CT attenuation. However, misregistration of these 2 series or artifacts in 1 of the scans can impair ECV accuracy. Considering the present patient population, SE-derived ECV quantification failed in 3 subjects because of misregistration or because of inaccurate definition of the whole-heart volume of interest. Importantly, DE-based ECV quantification, which relies on 1 scan only, could be performed in all these 3 patients.
This is the first study to assess ECV quantification with PCD-CT. Compared with conventional EID, the new photon-counting detector technology allows acquisition of spectral CT data at a single tube voltage and the consecutive computation of iodine images from the LE acquisition. Present results prove that ECV quantification is feasible in a patient population with an average body mass index of 28 ± 5 kg/m2. The median radiation dose for the LE scan was 1.2 mSv. Only 1 patient with morbid obesity (56 kg/m2) had to be excluded from analysis because of insufficient scan quality. Emoto et al13 investigated the accuracy of ECV quantification using the SE and DE method with an EID-CT and reported a mean radiation dose of 5.2 mSv for the LE scan in a patient population with a body mass index of 23 kg/m2. Suzuki et al11 evaluated the association between ECV measured with the DE approach on an EID-CT and clinical outcomes in patients with aortic stenosis undergoing aortic valve replacement and indicated a mean radiation dose of 4.7 mSv for the LE scan in a patient population with a body mass index of 23 kg/m2. Compared with these values, LE scan acquisition with PCD-CT is feasible at a low radiation dose.
It must be emphasized that 3D analysis for the whole heart by matching a coronary CTA-generated heart model was feasible in all patients. Thus, ECV quantification appears not operator dependent and provides objective results. In addition to the determination of global and midwall myocardial ECV, DE-based ECV quantification allowed robust regional analyses. We found median ECV values of 30.5%, which is in good agreement with values reported in the literature for patients with severe aortic stenosis.6,7,11,34 Bandula et al6 determined the ECV of 23 patients with severe aortic stenosis using CT and cardiac MRI and reported mean ECV values of 31% and 30%, respectively. Dubourg et al34 also derived ECV from CT and MRI in 21 patients before TAVR and found mean ECV values of 29.9% and 29.1%. Scully et al7 and Suzuki et al11 calculated the ECV in 93 and 95 patients with severe aortic stenosis using CT and reported mean ECV values of 33% and 28%, respectively.
Considering the transmural ECV gradients, we found significant endoepicardial gradients for the anterior, lateral, and posterior walls of the left ventricle. This fibrosis gradient has already been previously described in patients with severe aortic stenosis and may be reflective of a reparative response to low-endocardial perfusion and consecutive myocardial ischemia.35 Although both diffuse myocardial fibrosis caused by severe aortic stenosis and CA show a progressive degeneration of the ECV from apex to base, apical sparing is more pronounced in patients with amyloidosis.4,36,37 Basal predominance of myocardial fibrosis in patients with severe aortic stenosis is thought to be due to the high regional wall stress at the base as a result to the flat curvature of the left ventricle.38 This is in accordance with our findings demonstrating significantly higher ECV in the base compared with midventricular and apical segments.
Our study is hampered by some limitations, which should be addressed in further studies. First, this was a single-center study with a limited sample size. Second, only patients with severe aortic stenosis were investigated, and no normal ECV values of healthy myocardium were determined. Third, ECV quantification by CT was not correlated to another modality such as, for example, T1-mapping with MRI, the latter being considered the reference standard modality for ECV quantification. Fourth, we applied a fixed amount of 100 mL contrast media for the entire protocol and did not test whether smaller volumes would be feasible as well. Finally, we provide no outcome data indicating the importance of ECV quantification in our patient population.
In conclusion, our first experience indicates that single-scan ECV(DE) quantification from LE cardiac dual-source PCD-CT is feasible and accurate compared with ECV(SE) calculation at low radiation dose. Extracellular volume calculation using iodine ratios from LE scanning obviates the need for a true nonenhanced scan and is not subject to potential misregistration between 2 separate scans.
Footnotes
Conflicts of interest and sources of funding: E.K. and B.S. are employees of Siemens Healthcare GmbH. The remaining authors declare that the research was conducted in the absence of any commercial or financial relationships that could be construed as a potential conflict of interest. V.M. is funded by the research grant “Young Talents in Clinical Research” of the SAMS and the G & J Bangerter-Rhyner Foundation.
Contributor Information
Victor Mergen, Email: victor.mergen@usz.ch.
Thomas Sartoretti, Email: thomas.sartoretti@usz.ch.
Ernst Klotz, Email: ernst.klotz.ext@siemens-healthineers.com.
Bernhard Schmidt, Email: bernhard.schmidt@siemens-healthineers.com.
Lisa Jungblut, Email: lisa.jungblut@usz.ch.
Kai Higashigaito, Email: kai.higashigaito@usz.ch.
Robert Manka, Email: robert.manka@usz.ch.
André Euler, Email: andre.euler@usz.ch.
Markus Kasel, Email: markus.kasel@usz.ch.
Matthias Eberhard, Email: matthias.eberhard@usz.ch.
REFERENCES
- 1.Scully PR Bastarrika G Moon JC, et al. Myocardial extracellular volume quantification by cardiovascular magnetic resonance and computed tomography. Curr Cardiol Rep. 2018;20:15. [DOI] [PMC free article] [PubMed] [Google Scholar]
- 2.Pucci A Aimo A Musetti V, et al. Amyloid deposits and fibrosis on left ventricular endomyocardial biopsy correlate with extracellular volume in cardiac amyloidosis. J Am Heart Assoc. 2021;10:e020358. [DOI] [PMC free article] [PubMed] [Google Scholar]
- 3.Everett RJ Treibel TA Fukui M, et al. Extracellular myocardial volume in patients with aortic stenosis. J Am Coll Cardiol. 2020;75:304–316. [DOI] [PMC free article] [PubMed] [Google Scholar]
- 4.Dorbala S Ando Y Bokhari S, et al. ASNC/AHA/ASE/EANM/HFSA/ISA/SCMR/SNMMI expert consensus recommendations for multimodality imaging in cardiac amyloidosis: part 1 of 2-evidence base and standardized methods of imaging. Circ Cardiovasc Imaging. 2021;14:e000029. [DOI] [PubMed] [Google Scholar]
- 5.Lee HJ Im DJ Youn JC, et al. Myocardial extracellular volume fraction with dual-energy equilibrium contrast-enhanced cardiac CT in nonischemic cardiomyopathy: a prospective comparison with cardiac MR imaging. Radiology. 2016;280:49–57. [DOI] [PubMed] [Google Scholar]
- 6.Bandula S White SK Flett AS, et al. Measurement of myocardial extracellular volume fraction by using equilibrium contrast-enhanced CT: validation against histologic findings. Radiology. 2013;269:396–403. [DOI] [PubMed] [Google Scholar]
- 7.Scully PR Patel KP Saberwal B, et al. Identifying cardiac amyloid in aortic stenosis: ECV quantification by CT in TAVR patients. JACC Cardiovasc Imaging. 2020;13:2177–2189. [DOI] [PMC free article] [PubMed] [Google Scholar]
- 8.Treibel TA Bandula S Fontana M, et al. Extracellular volume quantification by dynamic equilibrium cardiac computed tomography in cardiac amyloidosis. J Cardiovasc Comput Tomogr. 2015;9:585–592. [DOI] [PMC free article] [PubMed] [Google Scholar]
- 9.Ohta Y Kishimoto J Kitao S, et al. Investigation of myocardial extracellular volume fraction in heart failure patients using iodine map with rapid-kV switching dual-energy CT: segmental comparison with MRI T1 mapping. J Cardiovasc Comput Tomogr. 2020;14:349–355. [DOI] [PubMed] [Google Scholar]
- 10.Oda S Emoto T Nakaura T, et al. Myocardial late iodine enhancement and extracellular volume quantification with dual-layer spectral detector dual-energy cardiac CT. Radiol Cardiothorac Imaging. 2019;1:e180003. [DOI] [PMC free article] [PubMed] [Google Scholar]
- 11.Suzuki M Toba T Izawa Y, et al. Prognostic impact of myocardial extracellular volume fraction assessment using dual-energy computed tomography in patients treated with aortic valve replacement for severe aortic stenosis. J Am Heart Assoc. 2021;10:e020655. [DOI] [PMC free article] [PubMed] [Google Scholar]
- 12.Kim NY Im DJ Youn JC, et al. Synthetic extracellular volume fraction derived using virtual unenhanced attenuation of blood on dual-energy contrast-enhanced cardiac CT in nonischemic cardiomyopathy. AJR Am J Roentgenol. 2021. [DOI] [PubMed] [Google Scholar]
- 13.Emoto T Oda S Kidoh M, et al. Myocardial extracellular volume quantification using cardiac computed tomography: a comparison of the dual-energy iodine method and the standard subtraction method. Acad Radiol. 2021;28:e119–e126. [DOI] [PubMed] [Google Scholar]
- 14.van Assen M De Cecco CN Sahbaee P, et al. Feasibility of extracellular volume quantification using dual-energy CT. J Cardiovasc Comput Tomogr. 2019;13:81–84. [DOI] [PubMed] [Google Scholar]
- 15.Ternacle J Krapf L Mohty D, et al. Aortic stenosis and cardiac amyloidosis: JACC review topic of the week. J Am Coll Cardiol. 2019;74:2638–2651. [DOI] [PubMed] [Google Scholar]
- 16.Nitsche C Scully PR Patel KP, et al. Prevalence and outcomes of concomitant aortic stenosis and cardiac amyloidosis. J Am Coll Cardiol. 2021;77:128–139. [DOI] [PMC free article] [PubMed] [Google Scholar]
- 17.Flohr T Petersilka M Henning A, et al. Photon-counting CT review. Phys Med. 2020;79:126–136. [DOI] [PubMed] [Google Scholar]
- 18.Willemink MJ Persson M Pourmorteza A, et al. Photon-counting CT: technical principles and clinical prospects. Radiology. 2018;289:293–312. [DOI] [PubMed] [Google Scholar]
- 19.Alkadhi H, Euler A. The future of computed tomography: personalized, functional, and precise. Invest Radiol. 2020;55:545–555. [DOI] [PubMed] [Google Scholar]
- 20.Petritsch B Petri N Weng AM, et al. Photon-counting computed tomography for coronary stent imaging: in vitro evaluation of 28 coronary stents. Invest Radiol. 2021;56:653–660. [DOI] [PubMed] [Google Scholar]
- 21.Sandstedt M Marsh J Jr. Rajendran K, et al. Improved coronary calcification quantification using photon-counting-detector CT: an ex vivo study in cadaveric specimens. Eur Radiol. 2021;31:6621–6630. [DOI] [PMC free article] [PubMed] [Google Scholar]
- 22.Euler A Higashigaito K Mergen V, et al. High-pitch photon-counting detector computed tomography angiography of the aorta: intraindividual comparison to energy-integrating detector computed tomography at equal radiation dose. Invest Radiol. 2021. [DOI] [PubMed] [Google Scholar]
- 23.Sartoretti T Eberhard M Nowak T, et al. Photon-counting multienergy computed tomography with spectrally optimized contrast media for plaque removal and stenosis assessment. Invest Radiol. 2021;56:563–570. [DOI] [PubMed] [Google Scholar]
- 24.Zhou W Michalak GJ Weaver JM, et al. A universal protocol for abdominal CT examinations performed on a photon-counting detector CT system: a feasibility study. Invest Radiol. 2020;55:226–232. [DOI] [PMC free article] [PubMed] [Google Scholar]
- 25.Ren L Huber N Rajendran K, et al. Dual-contrast biphasic liver imaging with iodine and gadolinium using photon-counting detector computed tomography: an exploratory animal study. Invest Radiol. 2021. [DOI] [PMC free article] [PubMed] [Google Scholar]
- 26.Boccalini S Si-Mohamed SA Lacombe H, et al. First in-human results of computed tomography angiography for coronary stent assessment with a spectral photon counting computed tomography. Invest Radiol. 2021. [DOI] [PMC free article] [PubMed] [Google Scholar]
- 27.Jungblut L Blüthgen C Polacin M, et al. First performance evaluation of an artificial intelligence-based computer-aided detection system for pulmonary nodule evaluation in dual-source photon-counting detector CT at different low-dose levels. Invest Radiol. 2021. [DOI] [PubMed] [Google Scholar]
- 28.Mannil M Hickethier T von Spiczak J, et al. Photon-counting CT: high-resolution imaging of coronary stents. Invest Radiol. 2018;53:143–149. [DOI] [PubMed] [Google Scholar]
- 29.Leng S Bruesewitz M Tao S, et al. Photon-counting detector CT: system design and clinical applications of an emerging technology. Radiographics. 2019;39:729–743. [DOI] [PMC free article] [PubMed] [Google Scholar]
- 30.Bongartz G Golding S Jurik A, et al. European guidelines for multislice computed tomography. European Commission. 2004. Available at: https://op.europa.eu/en/publication-detail/-/publication/d229c9e1-a967-49de-b169-59ee68605f1a. [Google Scholar]
- 31.American Association of Physicists in Medicine . The Measurement, Reporting, and Management of Radiation Dose in CT. Report No. 96. College Park, MD: American Association of Physicists in Medicine; 2008. [Google Scholar]
- 32.Trattner S Halliburton S Thompson CM, et al. Cardiac-specific conversion factors to estimate radiation effective dose from dose-length product in computed tomography. JACC Cardiovasc Imaging. 2018;11:64–74. [DOI] [PMC free article] [PubMed] [Google Scholar]
- 33.Qi RX Shao J Jiang JS, et al. Myocardial extracellular volume fraction quantitation using cardiac dual-energy CT with late iodine enhancement in patients with heart failure without coronary artery disease: a single-center prospective study. Eur J Radiol. 2021;140:109743. [DOI] [PubMed] [Google Scholar]
- 34.Dubourg B Dacher JN Durand E, et al. Single-source dual energy CT to assess myocardial extracellular volume fraction in aortic stenosis before transcatheter aortic valve implantation (TAVI). Diagn Interv Imaging. 2021;102:561–570. [DOI] [PubMed] [Google Scholar]
- 35.Treibel TA López B González A, et al. Reappraising myocardial fibrosis in severe aortic stenosis: an invasive and non-invasive study in 133 patients. Eur Heart J. 2018;39:699–709. [DOI] [PMC free article] [PubMed] [Google Scholar]
- 36.Phelan D Collier P Thavendiranathan P, et al. Relative apical sparing of longitudinal strain using two-dimensional speckle-tracking echocardiography is both sensitive and specific for the diagnosis of cardiac amyloidosis. Heart. 2012;98:1442–1448. [DOI] [PubMed] [Google Scholar]
- 37.Hoffmann R Altiok E Friedman Z, et al. Myocardial deformation imaging by two-dimensional speckle-tracking echocardiography in comparison to late gadolinium enhancement cardiac magnetic resonance for analysis of myocardial fibrosis in severe aortic stenosis. Am J Cardiol. 2014;114:1083–1088. [DOI] [PubMed] [Google Scholar]
- 38.Weidemann F Herrmann S Störk S, et al. Impact of myocardial fibrosis in patients with symptomatic severe aortic stenosis. Circulation. 2009;120:577–584. [DOI] [PubMed] [Google Scholar]