Abstract
Background:
Postural orthostatic tachycardia syndrome (POTS) is a disorder of orthostatic intolerance that primarily affects women of childbearing age. The underlying pathophysiology of POTS is not fully understood, but it has been suggested that autoimmunity may play a role. The aim of this study was to compare concentrations of autoantibodies to cardiovascular G protein–coupled receptors between patients with POTS and healthy controls.
Methods:
Sera were collected from 116 patients with POTS (91% female; medium age, 29 years) and 81 healthy controls (84% female; medium age, 27 years) from Calgary, Canada, and Malmö, Sweden. Samples were evaluated for autoantibodies to 11 receptors (adrenergic, muscarinic, angiotensin II, and endothelin) using a commercially available enzyme-linked immunosorbent assay.
Results:
Autoantibody concentrations against all of the receptors tested were not significantly different between controls and patients with POTS. The majority of patients with POTS (98.3%) and all controls (100%) had α1 adrenergic receptor autoantibody concentrations above the seropositive threshold provided by the manufacturer (7 units/mL). The proportion of patients with POTS versus healthy controls who fell above the diagnostic thresholds was not different for any tested autoantibodies. Receiver operating characteristic curves showed a poor ability to discriminate between patients with POTS and controls.
Conclusions:
Patients with POTS and healthy controls do not differ in their enzyme-linked immunosorbent assay–derived autoantibody concentrations to cardiovascular G protein–coupled receptors. These findings suggest that these tests are not useful for establishing the role of autoimmunity in POTS.
Keywords: autoimmunity, enzyme-linked immunosorbent assay, postural orthostatic tachycardia syndrome
Clinical Perspective.
What Is New?
Commercially available autoantibody concentrations of G protein–coupled receptors are not increased or altered in patients with postural orthostatic tachycardia syndrome (POTS) relative to healthy controls as assessed using enzyme-linked immunosorbent assay.
This study suggests that G protein–coupled receptor autoantibody concentrations alone cannot explain the pathophysiology of POTS; autoantibody activity and signals not picked up by enzyme-linked immunosorbent assay should be explored because these results may provide more insights into POTS.
What Are the Clinical Implications?
Commercially available autoantibody concentrations alone cannot be used to differentiate between patients with POTS and healthy controls.
The presence of G protein–coupled receptor autoantibodies alone is not diagnostic of POTS.
Postural orthostatic tachycardia syndrome (POTS) is a disorder of orthostatic intolerance that primarily affects female patients of childbearing age.1 It is characterized by orthostatic tachycardia (≥30 bpm) within 10 minutes of standing in the absence of orthostatic hypotension (≥20/10 mm Hg) and symptoms that are worse when upright and improve with recumbence.2,3 The cause and underlying pathophysiology of this condition are not fully understood. Several pathophysiologic mechanisms have been described in patients with POTS, often with multiple mechanisms coexisting within the same patient.3 Included among these potential mechanisms are partial autonomic denervation,4 hypovolemia,5 and deconditioning.6 One area of particular interest has been the role of autoimmunity in the pathophysiology of POTS.7 This hypothesis is supported by the abnormally high rates of autoimmune disorders in patients with POTS.8 A number of studies have explored this area by studying the prevalence and activity of autoantibodies against cardiovascular G protein–coupled receptors (GPCRs) in patients with POTS.7,9–15 Some studies have found increased concentrations of GPCR autoantibodies, as well as a variety of others, in patients with POTS.10,11 Despite this extensive research, there is no consensus as to what role autoantibodies against GPCRs and other receptors play in the pathophysiology of POTS. There are important differences between different autoantibody assay methods: some assays detect the presence of autoantibody binding, whereas others measure biological effects of specific antibodies. In addition, autoantibodies have been found in healthy controls as well as in patients.15 Most studies of GPCR autoantibodies in POTS have had small samples sizes and have lacked appropriate internal controls.16 Using a relatively large multicenter cohort, we sought to test the null hypothesis that GPCR autoantibody concentrations are not different between patients with POTS and healthy controls using an established, commercially available enzyme-linked immunosorbent assay (ELISA).
Methods
Participants
The data that support this study’s findings can be made available from the corresponding author upon reasonable request. POTS diagnosis was on the basis of current consensus criteria2: an orthostatic increase in heart rate of ≥30 bpm within 10 minutes of standing and in the absence of hypotension, reproduction of orthostatic intolerance symptoms during the test, and a duration of characteristic symptoms >6 months. Patient and healthy control data came from both Calgary, Canada, and Malmö, Sweden. Patients with POTS (ntotal=116) from both Calgary (n=52) and Malmö (n=64) had a physician-confirmed POTS diagnosis. None of the healthy controls (ntotal=81) from Calgary (n=16) or Malmö (n=65) had a known history of autonomic dysfunction, active autoimmune disease, or any other chronic inflammatory condition.
In Calgary, patient and healthy control data and samples came from participants enrolled in the Pathophysiological Role of Adrenergic Antibodies in POTS study. Patients with POTS and controls were recruited for this study as of February 2016. Participants were included if they were between 18 and 60 years of age and provided written informed consent. Patients with POTS and controls were excluded if they had conflicting health conditions (e.g., were smokers or had substantial cardiovascular, pulmonary, hepatic, or hematologic disease). This study (POTS Adrenergic Ab; URL: https://www.clinicaltrials.gov; Unique identifier: NCT02673996) was approved by the Calgary Conjoint Health Research Ethics Board.
In Malmö, both patient and healthy control data and samples were from the POTS substudy of SYSTEMA (Syncope Study of Unselected Population in Malmö). Details of the SYSTEMA POTS cohort are described elsewhere.17 The SYSTEMA study protocol consisted of cardiovascular autonomic testing including head-up tilt (HUT) testing with continuous hemodynamic monitoring. Data from 64 patients with POTS with a heart rate increase of ≥30 bpm during HUT and chronic symptoms for ≥6 months from the SYSTEMA cohort were selected between October 2017 and January 2020. Sixty-five controls were recruited through personal invitation (e.g., healthy medical students, Skåne University Hospital staff, and younger participants of parallel population-based epidemiologic programs in Malmö, Sweden). Controls had no history of syncope, orthostatic intolerance, POTS, or endocrine disease. All cardiovascular pharmacologic agents such as β-blockers, ivabradine, midodrine, and droxidopa were discontinued 72 hours before examination. All participants in SYSTEMA and the substudy provided informed consent before their involvement. These studies were approved by the regional ethical review board in Lund (DNR 08/82 and 17/295) and all procedures were performed in accordance with the Helsinki Declaration.
ELISA Autoantibody Assay
In both Calgary and Malmö, patient and control blood samples were collected during dedicated study visits after overnight fasting. A trained nurse performed an antecubital venipuncture in a designated room after 10 minutes rest in a supine position. Serum was separated by centrifugation, divided into aliquots, and stored at -80°C. The serum aliquots were thereafter collected in an automatized manner from the freezer, blinded, and shipped on dry ice to CellTrend GmbH (Luckenwalde, Germany) for evaluation.9 According to the manufacturer, at this stage the appropriate human GPCR was precoated onto a microtiter pate. During the first incubation, the anti-GPCR antibodies of the studied sample were immobilized on the plate. Autoantibodies were detected with a peroxidase-labeled antihuman immunoglobulin G antibody. In the following enzymatic substrate reaction, the intensity of the color correlated with the concentration or avidity of respective anti-GPCR antibodies. Serum samples were evaluated for autoantibody concentrations to several cardiovascular GPCRs: angiotensin II receptor type 1 (AT1R), endothelin receptor A (ETAR), α1 adrenergic receptors (α1-AR), α2 adrenergic receptors (α2-AR), β1 adrenergic receptors (β1-AR), β2 adrenergic receptors (β2-AR), and muscarinic receptors 1 through 5 (M1R, M2R, M3R, M4R, M5R). These concentrations were determined using CellTrend’s commercially available ELISA.
Statistical Analysis
Continuous results for demographic information and autoantibody concentrations are reported as median (interquartile range). Statistical analyses were conducted through a Mann-Whitney U test. Categorical demographic information was compared using a Pearson chi-square test. Analyses of positive versus negative serotypes on an individual basis were done according to the threshold concentrations in units/mL that were provided by the manufacturer (CellTrend), except for autoantibodies to M1R, M2R, or M5R, where thresholds were not provided. As an alternative to the manufacturer-provided thresholds, we determined our own thresholds for each receptor as 2 SD above the mean autoantibody concentration of the control sample. Participants who had an autoantibody concentration above the threshold value for a given receptor autoantibody were considered seropositive for that autoantibody. The proportions of seropositive participants are reported as percentages. Statistical analyses for these categorical data were conducted using a Fisher exact test.
Receiver operating characteristic (ROC) curves were generated to create a graphical representation of the diagnostic ability of a given autoantibody concentration to discriminate between patients with POTS and healthy controls. The area under the curve (AUC; Harrel C statistic) is a reliable indication of the validity of a given diagnostic test, where an AUC of 0.5 suggests that the ability of a test to discriminate between those with or without the disease is left to chance.18 In general, an AUC above 0.7 has good discrimination ability, whereas an AUC between 0.9 and 1.00 is able to discriminate between healthy and diseased with excellent accuracy.19 ROC data are reported as AUC (95% CI).
To generate ROC curves that encompassed several GPCR autoantibodies, we combined data from GPCR autoantibodies that were most promising when evaluated separately. For instance, ROC curves for autoantibodies to AT1R, ETAR, and a1-AR each had a greater AUC compared with the other receptors tested. The results of these tests were combined and then divided by results of autoantibodies to receptors that were higher in the control population, such as M3R.
Test results were considered statistically significant if a 2-sided P value was ≤0.05. Statistical analyses were performed using IBM SPSS Statistics version 26. Figures were made in GraphPad Prism version 7.
Results
Study Population Characteristics
The majority of patients with POTS (91%) and healthy controls (84%) were women (P=0.2). The median age of patients with POTS (29.0 [23.0–37.0] years) was not significantly different from that of healthy controls (27.0 [23.5–38.5] years; P=0.9). When analyzed by center, the findings were concordant. In Calgary, the majority of patients with POTS (96%) and healthy controls (100%) were women (P=0.4). In Malmö, patients with POTS (86%) and healthy controls (80%) were also mostly women (P=0.4). The median age of patients with POTS did not differ between Calgary (29.5 [24.3–36.8] years) and Malmö (26.5 [23.0–37.0] years; P=0.4), but the median age of healthy controls was lower in Calgary (24.5 [22.0–27.8] years) than in Malmö (29.0 [24.0–40.5] years; P=0.041).
Antibody Concentrations
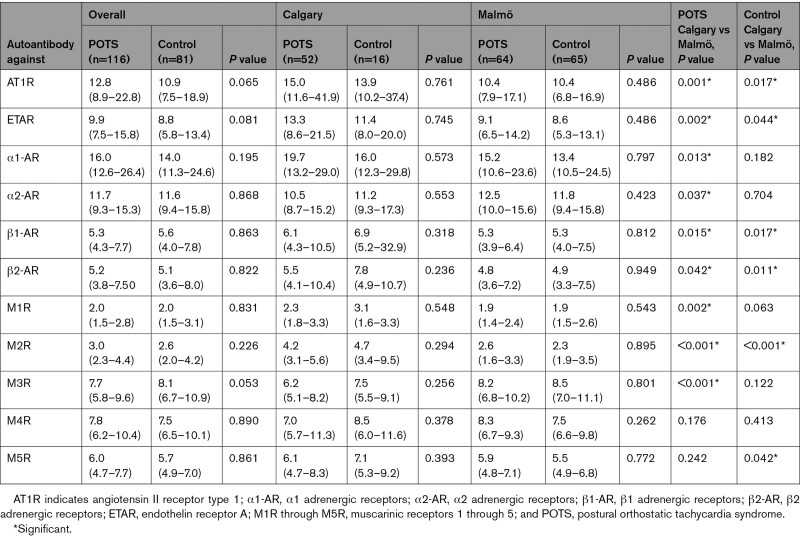
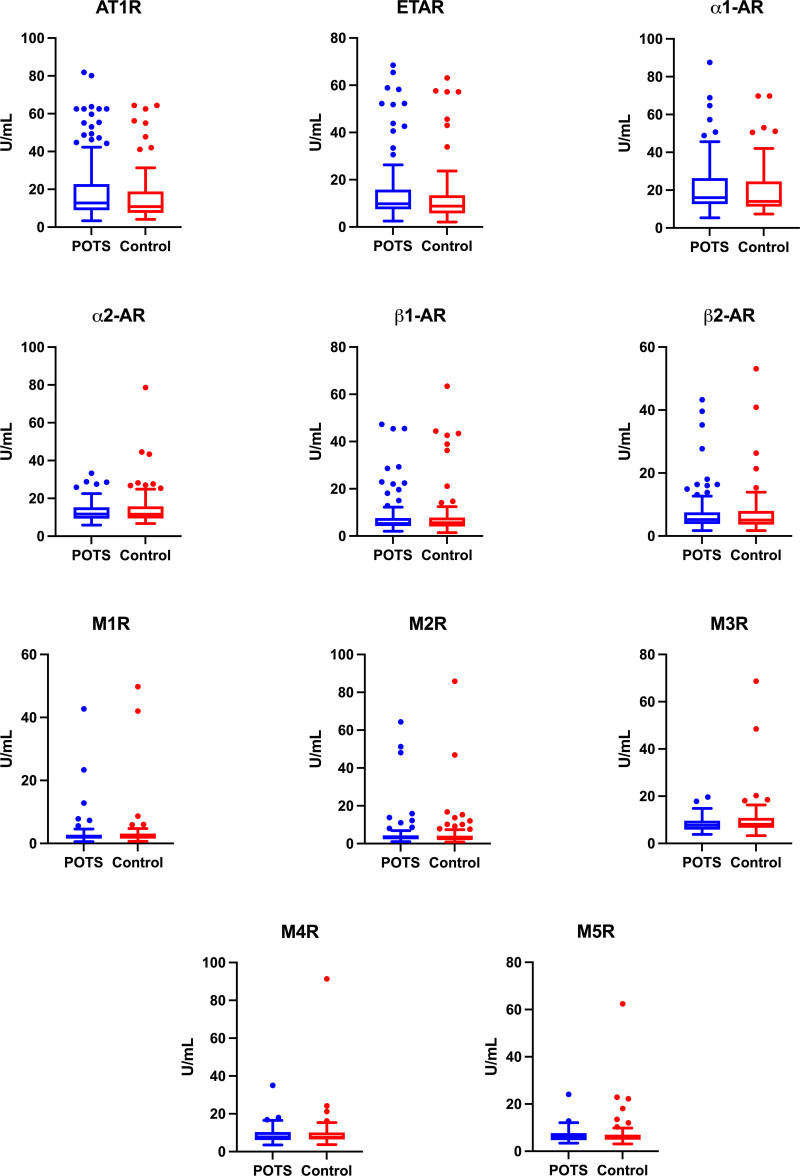
There were no significant differences between patients with POTS and healthy controls in median autoantibody concentration against any of the receptors evaluated (Table 1 and Figure 1). The same result was observed when data from each center were evaluated separately (Table 1).
Table 1.
Median Autoantibody Concentrations Split, by Center
Figure 1.
Autoantibody concentrations to 11 cardiovascular G protein–coupled receptors in patients with postural orthostatic tachycardia syndrome versus healthy controls. Autoantibody concentrations (units/mL) to angiotensin II receptor type 1 (AT1R), endothelin receptor A (ETAR), α1 adrenergic receptors (α1-AR), α2 adrenergic receptors (α2-AR), β1 adrenergic receptors (β1-AR), β2 adrenergic receptors (β2-AR), and muscarinic receptors 1 through 5 (M1R, M2R, M3R, M4R, M5R). Data are presented as box and whiskers plots where the box represents the interquartile range and the line represents the median. The whisker (error bar) length is 1.5 times the interquartile range. The individual points are outliers above or below the whiskers. POTS indicates postural orthostatic tachycardia syndrome.
Autoantibody concentrations against all but 2 of the GPCRs tested, M4R (P=0.176) and M5R (P=0.242), were different between patients with POTS in Calgary and in Malmö. The autoantibody concentrations that were different between centers were significantly higher in Calgary except those to α2-AR (P=0.037) and M3R (P<0.001), which were higher in Malmö (Table 1). Likewise, healthy controls in Calgary had significantly higher autoantibody concentrations against 6 of the 11 GPCRs tested compared with the healthy controls in Malmö (Table 1).
Categorical Seropositivity Using Manufacturer Thresholds
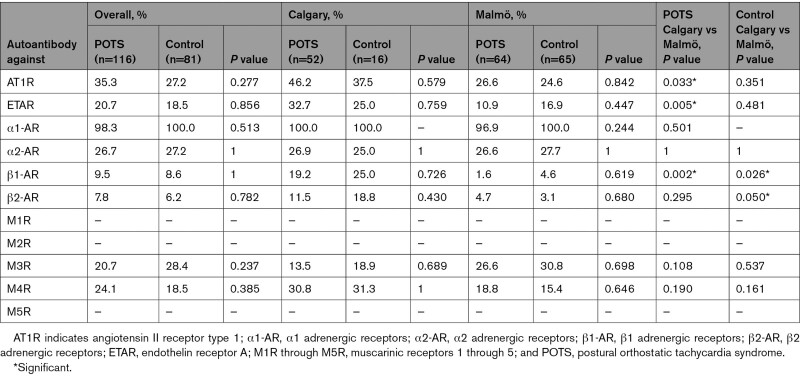
The assay manufacturer provided threshold (upper limit of normal) autoantibody concentrations for 8 of the 11 GPCRs tested. On the basis of these thresholds, a large number of patients with POTS and healthy controls were considered seropositive for several autoantibodies (Table 2). The majority of patients with POTS (98%) and all healthy controls (100%) were seropositive for anti–α1-AR (P=0.5). The seropositivity rate for the remaining autoantibodies was lower and there were no significant differences in the proportion of patients with POTS versus healthy controls who were seropositive for any of the autoantibodies tested.
Table 2.
Percent Seropositive on the Basis of Manufacturer-Provided Diagnostic Thresholds
When comparing patients with POTS with healthy controls, both centers had a similar proportion of patients with POTS and healthy controls who were seropositive for each of the autoantibodies tested (Table 2).
Between centers, patients with POTS in Calgary were more likely to be seropositive for anti-AT1R (P=0.033), anti-ETAR (P=0.005), and anti-β1-AR (P=0.002) than were patients with POTS in Malmö. Healthy controls in Calgary were more likely to be seropositive for anti-β1-AR (P=0.026) and anti-β2-AR (P=0.050; Table 2).
Categorical Seropositivity Using the Mean +2 SD Threshold
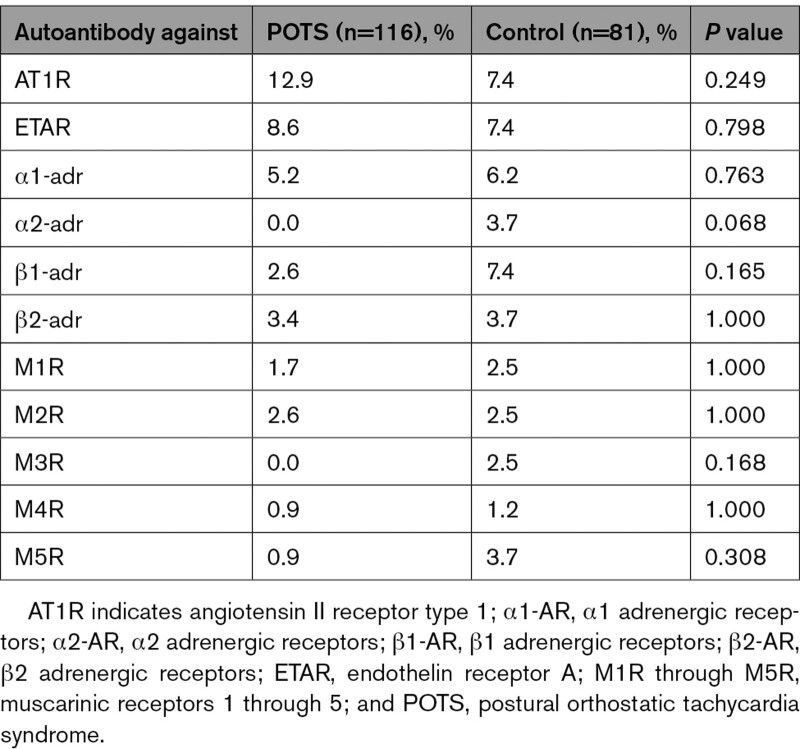
Using a threshold on the basis of the control sample’s mean +2 SD, there were no significant differences in the proportion of patients with POTS versus healthy controls who were seropositive for antibodies against any of the GPCRs tested. Using this criterion, very few participants in either the POTS group or the healthy control group were considered positive for autoantibodies to any of the receptors. The receptors with the greatest seropositive rates from both patients with POTS and healthy controls were AT1R (12.9% of patients with POTS vs 7.4% of controls; P=0.2) and ETAR (8.6% of patients with POTS vs 7.4% of controls; P=0.8; Table 3). These findings were unchanged when the 2 sites were analyzed individually.
Table 3.
Percent Seropositive on the Basis of Mean +2 SD Threshold
ROC Curves
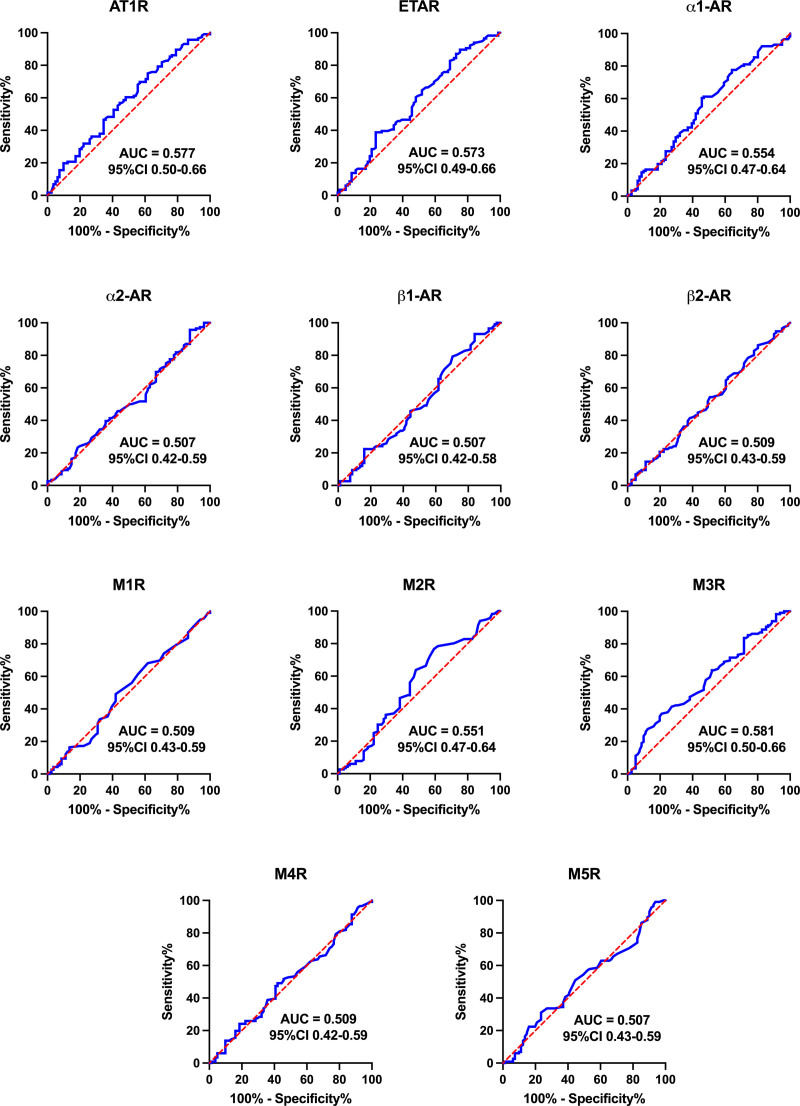
The ROC curves for each of the GPCR autoantibodies tested are shown in Figure 2. None of the autoantibody tests had significant ability to discriminate between patients with POTS and healthy controls. Most provided a C statistic below 0.51 and no autoantibody had a C statistic >0.6. These findings held true for the individual centers.
Figure 2.
Receiver operating characteristic curves for autoantibodies to 11 cardiovascular G protein–coupled receptors, split by group (patients with postural orthostatic tachycardia syndrome versus healthy controls). Data are presented as area under the curve (AUC) and 95% CI. A greater AUC indicates greater ability for the concentration of that autoantibody to discriminate whether a person has postural orthostatic tachycardia syndrome (POTS). If 0.5 is contained within the 95% CI, then there is no significant difference between patients with POTS and healthy controls. α1-AR indicates α1 adrenergic receptors; α2-AR, α2 adrenergic receptors; AT1R, angiotensin II receptor type 1; β1-AR, β1 adrenergic receptors; β2-AR, β2 adrenergic receptors; ETAR, endothelin receptor A; and M1R through M5R, muscarinic receptors 1 through 5.
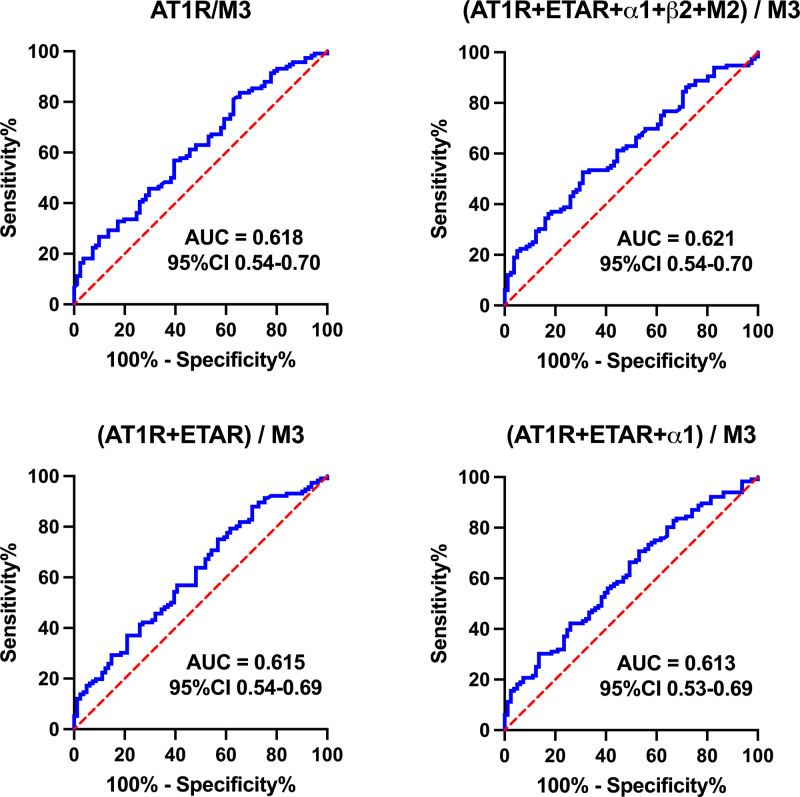
The most promising combinations of GPCR autoantibody improved the ROC C statistic to between 0.60 and 0.65 and are shown in Figure 3.
Figure 3.
Receiver operating characteristic curves for combinations of autoantibody concentrations to G protein–coupled receptors. Data are presented as area under the curve (AUC) and 95% CI. A greater AUC indicates greater ability for the concentration of that autoantibody to discriminate whether a person has postural orthostatic tachycardia syndrome (POTS). α1-AR indicates α1 adrenergic receptors; α2-AR, α2 adrenergic receptors; AT1R, angiotensin II receptor type 1; β1-AR, β1 adrenergic receptors; β2-AR, β2 adrenergic receptors; ETAR, endothelin receptor A; and M1R through M5R, muscarinic receptors 1 through 5.
Discussion
The results of our study indicate that the commercially available ELISA offered by the manufacturer used in this study have no diagnostic value when evaluating GPCR autoantibody levels in patients with POTS and should not be used as a clinical test. On the basis of this assay, there are no significant differences in GPCR autoantibody concentrations, categorical seropositivity rates, and ROC curves between patients with POTS and healthy controls. Previous research focused on patients with POTS only, without a control group, providing misleading results supporting the validity of these tests in patients with POTS.10 However, our study includes healthy controls, allowing for direct comparison between patients with POTS and the control group. With the addition of this control group, we have demonstrated that there are no differences in GPCR autoantibody concentrations between patients with POTS and healthy controls on the basis of the results of this assay.
These findings do not negate the potential role of immune dysregulation in the pathophysiology of POTS. However, this role cannot be shown using the ELISA-based tests of GCPR autoantibodies in serum presented here and these tests should not be used in the clinical diagnosis of POTS.
Antibody Concentrations
Autoantibody concentrations to AT1R, ETAR, α1-AR, α2-AR, β1-AR, β2-AR, and M1R through M5R were not different between patients with POTS and healthy controls. This was consistent whether analyzed in total or separately in 2 geographically distinct populations. These results are in line with other studies that have found that autoantibodies exist in healthy populations at the same concentrations that they do in patients with autoimmune disease.20 As such, all future studies of autoantibody markers in POTS must include an adequate number of relevant matched controls.
Categorical Seropositivity
There were no significant differences in the proportion of participants in each group who were seropositive on the basis of the manufacturer-provided antibody concentration thresholds. Gunning et al.10 have previously reported that 89% of patients with POTS demonstrated seropositivity to α1-AR, similar to our finding of 98%. However, 100% of healthy controls in our study were also positive, highlighting the importance of a control group. These data illustrate that the presence of autoantibodies above a certain concentration, as measured by ELISA, cannot be used to diagnose POTS. These results were also consistent across centers, highlighting the fact that results were not skewed by extraneous, center-dependent variables.
There were no differences between patients with POTS and healthy controls for the percentage of participants who were seropositive when using the mean +2 SD threshold. In contrast to the manufacturer thresholds, few participants from either population were seropositive for any of the autoantibodies tested using this more rigorous threshold. Regardless of the threshold value used, there were no differences between the patients with POTS and healthy controls.
Discriminating Value of GPCR Autoantibody Seropositivity
ROC curves allowed us to examine the use of GPCR autoantibody concentrations in the diagnosis of POTS. The largest C statistic for any of the GPCR autoantibodies individually was 0.581 (with 0.5 being totally uninformative), suggesting that none of the GPCR autoantibodies tested is able to discriminate accurately between patients with POTS and healthy controls. Even when we added several GPCR autoantibody concentrations together, the best AUC we found was 0.621. This diagnostic yield is not high enough to be of clinical significance for the diagnosis of POTS. Our results highlight the fact that GPCR autoantibody concentrations derived from the commercially available ELISA-based assays that are currently available cannot be used to discriminate patients with POTS from healthy patients or for therapy monitoring.
Calgary Versus Sweden
Autoantibody concentrations and seropositivity were the same in patients with POTS compared with controls in both the Calgary and Malmö cohorts. These data increase our confidence that these findings are likely representative of the broader patient population. When we compared autoantibody concentrations between patients with POTS in Calgary and Malmö, we found that autoantibodies against several GPCRs were significantly higher in the Calgary POTS population. Likewise, healthy controls in Calgary tended to have higher median autoantibody concentrations compared with healthy controls in Malmö. These differences in GPCR autoantibody concentrations between centers parallel previous findings of geographic differences in autoantibody profiles and highlight the need for studies to have locally recruited healthy controls for comparison.21
Previous Research on Autoimmune Involvement in POTS
Enzyme-Linked Immunosorbent Assay
Previous work asserted that elevated autoantibody levels to various GPCRs in patients with POTS could be used to help diagnose POTS.10 These studies failed to consider whether high GPCR autoantibody levels were unique to patients with POTS or if comparably high levels were present in healthy controls. Our main finding is that we cannot use the current commercially available ELISA methods of determining the presence of autoantibodies to GPCRs as a diagnostic criterion for POTS because these metrics are similar between individuals who do and do not have POTS. These data also demonstrate the importance of having control data available to ensure that a given variable is truly different in a disease group.
Functional Assays
Functional assays evaluate the ability of autoantibodies to activate GPCR receptors, rather than just evaluating for the presence of the autoantibodies. Previous studies have found that cardiovascular GPCR activity to both α1-AR and β1-AR9 is elevated when exposed to sera from patients with POTS compared with controls.22 This has raised the question of whether the presence of autoantibodies in POTS can be used as a surrogate measure of altered autoantibody activity. The results of the current study suggest that exclusively measuring autoantibody presence through an ELISA may not be a good surrogate. Yu et al.13 found that patients with POTS displayed significantly higher autoantibody activity to the angiotensin II type I receptor, even when seropositivity was the same between patients with POTS and controls. Alternative methods to commercial ELISA are needed to evaluate the role of GPCR autoantibodies in POTS.
Our findings do not reject a role for autoantibodies in the pathophysiology of POTS and several previous studies have shown that serum- or immunoglobulin G–dependent GPCR activity may be altered in the POTS population.9,13,14,22 It is important that POTS research explores the mechanisms that underlie altered autoantibody activity in POTS, what the downstream effects of this altered activity are, and how this contributes to the pathogenesis of POTS.
Limitations
This study examined only a single proprietary ELISA method and not functional autoantibody assays. The latter may be more relevant to the role of autoimmunity in POTS and should be the focus for future studies. Our approach was reasonable given that it is currently in clinical use by patients with POTS. Another limitation is that the current study did not control for the role of disease flares in the detection of autoantibodies. Autoimmune conditions can go through active and inactive states. Thus, differences between the patients with POTS and controls may be absent during quiescent periods. That being said, despite the fact that disease flares may play a role, on the basis of the manufacturer threshold concentrations that were used to deem a given participant positive or negative for a certain autoantibody, even some controls were positive in unflared states. As such, the conclusion that the commercially available ELISA method is unable to differentiate between patients with POTS and controls on the basis of these thresholds holds true.
Conclusions
Our results support the hypothesis that GPCR autoantibody concentrations, as detected by standard ELISA, are not different between patients with POTS and healthy controls. Future studies are needed to further characterize the role of autoimmunity in POTS using alternative assays and methodology.
Article Information
Acknowledgments
The authors thank the participants of these studies.
Sources of Funding
This work was supported by the Canadian Institutes of Health Research (grant MOP142426), 2019 Dysautonomia International Grant-in-Aid, the Vanderbilt Institute for Clinical and Translational Research (National Institutes of Health grant UL1-TR000445), the Swedish Heart and Lung Foundation (grant 20190383), and the Crafoord Foundation (grant 20190006).
Disclosures
Dr Vernino reports grants from Dysautonomia International and the National Institutes of Health; contracts from Genentech, Alterity, and BioHaven; licensing contract to Quest Diagnostics; consulting fees from Alterity, Genentech, ArgenX, and Sage Therapeutics; honoraria from the American Council of Life Insurers, American Association of Neuromuscular & Electrodiagnostic Medicine, American Academy of Neurology, and Texas Neurological Society; and is an unpaid Board member for the American Autonomic Society. Dr Hamrefors reports payment for a lecture at The Swedish Society of Cardiology and financial support for attending congresses at the Crafoord Foundation. Dr Fedorowski reports funding for the article from Dysautonomia International, Heart and Lung Foundation, and the Crafoord Foundation; consulting fees from Medtronic Inc; payment from Medtronic Inc and Biotronik for presentations; and participation on a board for Medtronic Inc. Dr Raj reports receiving funding for the article from the Canadian Institutes of Health Research; grants from Dysautonomia International, the Canadian Institutes of Health Research, and the Cardiac Arrhythmia Network of Canada; consulting fees from Lundbeck LLC and Theravance Biopharma USA; payment for development of teaching materials by Medscape LCC, Spire Learning, and the Academy for Continued Healthcare Learning; payment for expert testimony by Faris Law; participation on a data safety monitoring board for Arena Pharmaceuticals; is past president and member of the board for the American Autonomic Society; and is on the board of directors for the Canadian Cardiovascular Society Academy. The other authors report no conflicts of interest.
Nonstandard Abbreviations and Acronyms
- α1-AR
- α1 adrenergic receptor
- α2-AR
- α2 adrenergic receptor
- AT1R
- angiotensin II receptor type 1
- AUC
- area under the curve
- β1-AR
- β1 adrenergic receptor
- β2-AR
- β2 adrenergic receptor
- ELISA
- enzyme-linked immunosorbent assay
- ETAR
- endothelin receptor A
- GPCR
- G protein–coupled receptor
- HUT
- head-up tilt
- M1R through M5R
- muscarinic receptors 1 through 5
- POTS
- postural orthostatic tachycardia syndrome
- ROC
- receiver operating characteristic
- SYSTEMA
- Syncope Study of Unselected Population in Malmö
Circulation is available at www.ahajournals.org/journal/circ
This manuscript was sent to Suzanne Oparil, Guest Editor, for review by expert referees, editorial decision, and final disposition.
A. Fedorowski and S.R. Raj contributed equally.
For Sources of Funding and Disclosures, see page 621–622.
Contributor Information
Kate M. Bourne, Email: kate.bourne1@ucalgary.ca.
Steven Vernino, Email: Steven.Vernino@UTSouthwestern.edu.
Viktor Hamrefors, Email: viktor.hamrefors@med.lu.se.
Isabella Kharraziha, Email: isabella.kharraziha@med.lu.se.
Jan Nilsson, Email: jan.nilsson@med.lu.se.
Robert S. Sheldon, Email: sheldon@ucalgary.ca.
Artur Fedorowski, Email: artur.fedorowski@med.lu.se.
References
- 1.Shaw BH, Stiles LE, Bourne K, Green EA, Shibao CA, Okamoto LE, Garland EM, Gamboa A, Diedrich A, Raj V, et al. The face of postural tachycardia syndrome: insights from a large cross-sectional online community-based survey. J Intern Med. 2019;286:438–448. doi: 10.1111/joim.12895 [DOI] [PMC free article] [PubMed] [Google Scholar]
- 2.Sheldon RS, Grubb BP, Olshansky B, Shen WK, Calkins H, Brignole M, Raj SR, Krahn AD, Morillo CA, Stewart JM, et al. 2015 Heart Rhythm Society expert consensus statement on the diagnosis and treatment of postural tachycardia syndrome, inappropriate sinus tachycardia, and vasovagal syncope. Heart Rhythm. 2015;12:e41–e63. doi: 10.1016/j.hrthm.2015.03.029 [DOI] [PMC free article] [PubMed] [Google Scholar]
- 3.Raj SR, Guzman JC, Harvey P, Richer L, Schondorf R, Seifer C, Thibodeau-Jarry N, Sheldon RS. Canadian Cardiovascular Society position statement on postural orthostatic tachycardia syndrome (POTS) and related disorders of chronic orthostatic intolerance. Can J Cardiol. 2020;36:357–372. doi: 10.1016/j.cjca.2019.12.024 [DOI] [PubMed] [Google Scholar]
- 4.Benarroch EE. Postural tachycardia syndrome: a heterogeneous and multifactorial disorder. Mayo Clin Proc. 2012;87:1214–1225. doi: 10.1016/j.mayocp.2012.08.013 [DOI] [PMC free article] [PubMed] [Google Scholar]
- 5.Raj SR, Biaggioni I, Yamhure PC, Black BK, Paranjape SY, Byrne DW, Robertson D. Renin-aldosterone paradox and perturbed blood volume regulation underlying postural tachycardia syndrome. Circulation. 2005;111:1574–1582. doi: 10.1161/01.CIR.0000160356.97313.5D [DOI] [PubMed] [Google Scholar]
- 6.Fu Q, Vangundy TB, Galbreath MM, Shibata S, Jain M, Hastings JL, Bhella PS, Levine BD. Cardiac origins of the postural orthostatic tachycardia syndrome. J Am Coll Cardiol. 2010;55:2858–2868. doi: 10.1016/j.jacc.2010.02.043 [DOI] [PMC free article] [PubMed] [Google Scholar]
- 7.Vernino S, Stiles LE. Autoimmunity in postural orthostatic tachycardia syndrome: current understanding. Auton Neurosci Basic Clin. 2018;215:78–82. doi: 10.1016/j.autneu.2018.04.005 [DOI] [PubMed] [Google Scholar]
- 8.Blitshteyn S. Autoimmune markers and autoimmune disorders in patients with postural tachycardia syndrome (POTS). Lupus. 2015;24:1364–1369. doi: 10.1177/0961203315587566 [DOI] [PubMed] [Google Scholar]
- 9.Fedorowski A, Li H, Yu X, Koelsch KA, Harris VM, Liles C, Murphy TA, Quadri SMS, Scofield RH, Sutton R, et al. Antiadrenergic autoimmunity in postural tachycardia syndrome. Europace. 2017;19:1211–1219. doi: 10.1093/europace/euw154 [DOI] [PMC free article] [PubMed] [Google Scholar]
- 10.Gunning WT, Kvale H, Kramer PM, Karabin BL, Grubb BP. Postural orthostatic tachycardia syndrome is associated with elevated G-protein coupled receptor autoantibodies. J Am Heart Assoc. 2019;8:e013602. doi: 10.1161/JAHA.119.013602 [DOI] [PMC free article] [PubMed] [Google Scholar]
- 11.Li H, Yu X, Liles C, Khan M, Vanderlinde-Wood M, Galloway A, Zillner C, Benbrook A, Reim S, Collier D, et al. Autoimmune basis for postural tachycardia syndrome. J Am Heart Assoc. 2014;3:1–10. doi: 10.1161/JAHA.113.000755 [DOI] [PMC free article] [PubMed] [Google Scholar]
- 12.Ruzieh M, Batizy L, Dasa O, Oostra C, Grubb B. The role of autoantibodies in the syndromes of orthostatic intolerance: a systematic review. Scand Cardiovasc J. 2017;51:243–247. doi: 10.1080/14017431.2017.1355068 [DOI] [PubMed] [Google Scholar]
- 13.Yu X, Li H, Murphy TA, Nuss Z, Liles J, Liles C, Aston CE, Raj SR, Fedorowski A, Kem DC. Angiotensin II type 1 receptor autoantibodies in postural tachycardia syndrome. J Am Heart Assoc. 2018;7:1–7. doi: 10.1161/JAHA.117.008351 [DOI] [PMC free article] [PubMed] [Google Scholar]
- 14.Kharraziha I, Axelsson J, Ricci F, Di Martino G, Persson M, Sutton R, Fedorowski A, Hamrefors V. Serum activity against G protein–coupled receptors and severity of orthostatic symptoms in postural orthostatic tachycardia syndrome. J Am Heart Assoc. 2020;9:e015989. doi: 10.1161/JAHA.120.015989 [DOI] [PMC free article] [PubMed] [Google Scholar]
- 15.Bryarly M, Raj SR, Phillips L, Hynan LS, Okamoto LE, Arnold AC, Paranjape SY, Vernino M, Black BK, Vernino S. Ganglionic acetylcholine receptor antibodies in postural tachycardia syndrome. Neurol Clin Pract. 2021;11:e397–e401. doi: 10.1212/CPJ.0000000000001047 [DOI] [PMC free article] [PubMed] [Google Scholar]
- 16.Miglis MG, Muppidi S. Is postural tachycardia syndrome an autoimmune disorder? And other updates on recent autonomic research. Clin Auton Res. 2020;30:3–5. doi: 10.1007/s10286-019-00661-5 [DOI] [PubMed] [Google Scholar]
- 17.Johansson M, Ricci F, Schulte J, Persson M, Melander O, Sutton R, Hamrefors V, Fedorowski A. Circulating levels of growth hormone in postural orthostatic tachycardia syndrome. Sci Rep. 2021;11:1–7. doi: 10.1038/s41598-021-87983-5 [DOI] [PMC free article] [PubMed] [Google Scholar]
- 18.Habibzadeh F, Habibzadeh P, Yadollahie M. On determining the most appropriate test cut-off value: the case of tests with continuous results. Biochem Medica. 2016;26:297–307. doi: 10.11613/BM.2016.034 [DOI] [PMC free article] [PubMed] [Google Scholar]
- 19.ROC-ing along: Evaluation and interpretation of receiver operating characteristic curves. Surgery. 2016;159:1638–1645. doi: 10.1016/j.surg.2015.12.029 [DOI] [PubMed] [Google Scholar]
- 20.Cabral-Marques O, Marques A, Giil LM, De Vito R, Rademacher J, Günther J, Lange T, Humrich JY, Klapa S, Schinke S, et al. GPCR-specific autoantibody signatures are associated with physiological and pathological immune homeostasis. Nat Commun. 2018;9. doi: 10.1038/s41467-018-07598-9 [DOI] [PMC free article] [PubMed] [Google Scholar]
- 21.Shapira Y, Katz BSP, Gilburd B, Barzilai O, Ram M, Blank M, Lindeberg S, Frostegård J, Anaya JM, Bizzaro N, et al. Geographical differences in autoantibodies and anti-infectious agents antibodies among healthy adults. Clin Rev Allergy Immunol. 2012;42:154–163. doi: 10.1007/s12016-010-8241-z [DOI] [PubMed] [Google Scholar]
- 22.Badiudeen T, Forsythe EA, Bennett G, Li H, Yu X, Beel M, Nuss Z, Blick KE, Okamoto LE, Arnold AC, et al. A functional cell-based bioassay for assessing adrenergic autoantibody activity in postural tachycardia syndrome. J Transl Autoimmun. 2019;2:100006. doi: 10.1016/j.jtauto.2019.100006 [DOI] [PMC free article] [PubMed] [Google Scholar]


