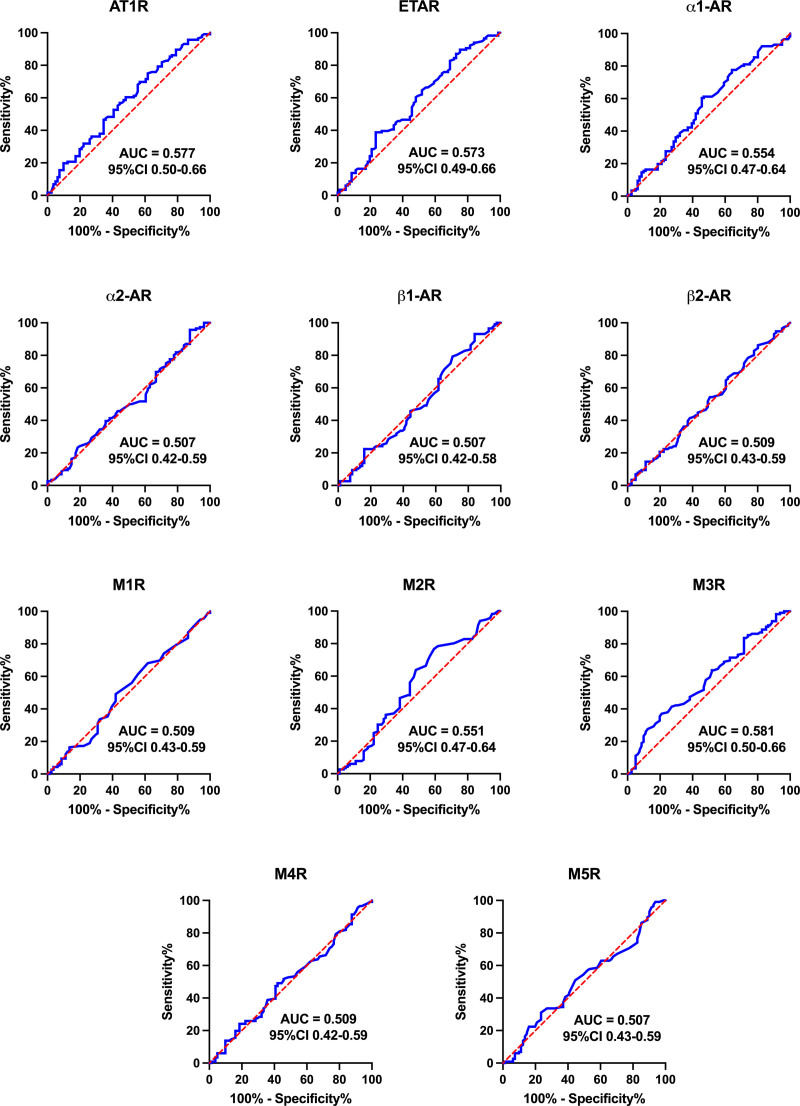
Figure 2.
Receiver operating characteristic curves for autoantibodies to 11 cardiovascular G protein–coupled receptors, split by group (patients with postural orthostatic tachycardia syndrome versus healthy controls). Data are presented as area under the curve (AUC) and 95% CI. A greater AUC indicates greater ability for the concentration of that autoantibody to discriminate whether a person has postural orthostatic tachycardia syndrome (POTS). If 0.5 is contained within the 95% CI, then there is no significant difference between patients with POTS and healthy controls. α1-AR indicates α1 adrenergic receptors; α2-AR, α2 adrenergic receptors; AT1R, angiotensin II receptor type 1; β1-AR, β1 adrenergic receptors; β2-AR, β2 adrenergic receptors; ETAR, endothelin receptor A; and M1R through M5R, muscarinic receptors 1 through 5.

