

Abstract
A meta-analytic approach was used to identify potential risk factors for dry eye syndrome. PubMed, Embase, and the Cochrane library were systematically searched for studies investigated the risk factors for dry eye syndrome from their inception until September 2021. The odds ratio (OR) with 95% confidence interval (CI) was calculated using the random-effects model. Forty-eight studies comprising 493,630 individuals were included. Older age (OR: 1.82; P<0.001), female sex (OR: 1.56; P<0.001), other race (OR: 1.27; P<0.001), visual display terminal use (OR: 1.32; P<0.001), cataract surgery (OR: 1.80; P<0.001), contact lens wear (OR: 1.74; P<0.001), pterygium (OR: 1.85; P = 0.014), glaucoma (OR: 1.77; P = 0.007), eye surgery (OR: 1.65; P<0.001), depression (OR: 1.83; P<0.001), post-traumatic stress disorder (OR: 1.65; P<0.001), sleep apnea (OR: 1.57; P = 0.003), asthma (OR: 1.43; P<0.001), allergy (OR: 1.38; P<0.001), hypertension (OR: 1.12; P = 0.004), diabetes mellitus (OR: 1.15; P = 0.019), cardiovascular disease (OR: 1.20; P<0.001), stroke (OR: 1.32; P<0.001), rosacea (OR: 1.99; P = 0.001), thyroid disease (OR: 1.60; P<0.001), gout (OR: 1.40; P<0.001), migraines (OR: 1.53; P<0.001), arthritis (OR: 1.76; P<0.001), osteoporosis (OR: 1.36; P = 0.030), tumor (OR: 1.46; P<0.001), eczema (OR: 1.30; P<0.001), and systemic disease (OR: 1.45; P = 0.007) were associated with an increased risk of dry eye syndrome. This study reported risk factors for dry eye syndrome, and identified patients at high risk for dry eye syndrome.
Introduction
Dry eye syndrome (DES) is defined as a multifactorial disease of the tears and ocular surface that could cause discomfort and visual disturbance, with potential damage to the ocular surface. These symptoms could affect quality of life and activities of daily living [1, 2]. The prevalence of DES is increasing and is seen in nearly one in five adults. Thus, this needs more attention from ophthalmologists [3, 4]. The role of the tear film has already been demonstrated. It has been shown to provide lubrication to the eyes, as well as nutrition and oxygen, and eliminate debris from the ocular surface [5]. Moreover, individuals with dry eyes also suffer from systemic diseases [4]. However, the prevalence of dry eyes is often underestimated because of varying presentation and symptoms [6]. Studies have demonstrated that age and sex are significantly associated with increased risk of DES; however, the pathogenesis of DES is not fully understood [7, 8].
Several studies have already identified risk factors for DES. Major risk factors include older age, female sex, having undergone postmenopausal estrogen therapy or ocular surface surgery, and using antihistamine medications [9]. Moreover, the occupational risk factor of visual display terminal (VDT) use was related to the progression of DES, which could be explained by a decreased blink rate and increased proportion of incomplete blinks that could be caused by the increased exposure of the ocular surface to the environment. Outdoor environments, sunlight, and air pollution in tropical countries are also associated with an elevated risk of DES [10, 11]. Furthermore, other risk factors for DES include vitamin D deficiency and diabetes mellitus (DM) [12, 13]. However, whether the comorbidities of individuals could affect the risk of DES remained controversial. We, therefore, performed a systematic review and meta-analysis to independently identify risk factors for DES.
Methods
Data sources, search strategy, and selection criteria
The current study was performed and reported following the Preferred Reporting Items for Systematic Reviews and Meta-Analysis Statement [14]. Studies reporting the risk factors of DES were eligible in our study, and publication language was restricted to English. PubMed, Embase, and the Cochrane library were systematically searched for eligible studies from their inception until September 2021, and using the following text word or Medical Subject Heading terms: "dry eye syndrome", "dry eye disease", "Keratoconjunctivitis Sicca", "Xerophthalmia", and "Risk Factors". The details of search strategy in PubMed are listed in S1 File. The reference lists of relevant original and review articles were manually screened to identify further eligible studies.
Two reviewers (QL and WW) independently performed study assessment following a standardized approach. Any disagreement between reviewers was settled by discussion until a consensus was reached. A study was included if the following criteria were met: (1) it was a cross-sectional, retrospective, or prospective observational study; (2) risk factors were reported for ≥ 3 studies [15] and included such factors as age, sex, race, residence, education level, obesity, dyslipidemia, alcohol, smoking, VDT use, cataract surgery, contact lens wear, pterygium, glaucoma, age-related maculopathy, eye surgery, depression, post-traumatic stress disorder (PTSD), sleep apnea, asthma, allergy, hypertension, DM, cardiovascular disease (CVD), stroke, rosacea, thyroid disease, chronic obstructive pulmonary disease (COPD), gout, migraines, arthritis, osteoporosis, tumor, meibomian gland dysfunction (MGD), eczema, and systemic disease; and (3) it reported effect estimates (relative risk [RR], hazard ratio [HR], or odds ratio [OR]) and 95% confidence interval (CI) for risk factors of DES. Interventional study, animal study, review, and letter to editor was excluded.
Data collection and quality assessment
Two reviewers (QL and WW) independently abstracted the following items, including study group or first author’s name, publication year, country, study design, sample size, age, % of males, population status, % of DES cases, definition of DES, risk factors, adjusted factors, and reported effect estimates. The effect estimate with maximal adjustment for potential confounders was selected if a study reported several multivariable-adjusted effect estimates. Study quality was assessed using the Newcastle-Ottawa Scale (NOS), which has already been validated for assessing the quality of observational studies in meta-analysis [16]. A total of 8 items in 3 subscales were included in NOS. The star system in each study ranged from 0–9. Inconsistent results for the data abstracted and quality assessment between the two reviewers were settled following mutually discussion referred to the original article.
Statistical analysis
Identified risk factors for DES were analyzed based on the OR, RR, or HR, with its 95% CI, in individual studies. Then the pooled ORs with 95%CI were calculated using the random-effects model [17, 18]. I2 and Q statistic were applied to assess heterogeneity across included studies. Significant heterogeneity was defined as I2> 50.0% or P < 0.10 [19, 20]. Sensitivity analysis was performed for factors reported in ≥ 4 studies to assess the robustness of pooled conclusion through sequentially removing individual studies [21]. Subgroup analyses were performed for factors reported in ≥ 4 studies on the basis of the country. The difference between subgroups was assessed using the interaction P test [22]. Visual inspections of funnel plots for factors reported in ≥ 4 studies were performed to qualitatively assess publication bias. The Egger or Begg tests were used to quantitatively assess publication bias [23, 24]. The P-value for all pooled results was 2-sided, and the inspection level was 0.05. All of the statistical analysis in our study was performed using software STATA (version 12.0; Stata Corporation, College Station, TX, USA).
Results
Literature search
A total of 1,672 studies were identified from initial electronic searches. Details of the study selection process are presented in Fig 1. Of these, 912 articles were removed because they were duplicates. A further 671 articles were excluded owing to irrelevant titles or abstracts. The remaining 89 studies were retrieved for full-text evaluations, with 41 studies removed because of: affiliate study (n = 23), evaluated factors < 3 studies (n = 12), and review-type articles (n = 6). A manual search of the reference lists of relevant articles did not yield any additional studies. Finally, 48 studies were selected for the final meta-analysis [25–71]. Characteristics of the included studies and involved individuals are summarized in Table 1.
Fig 1. Details of the literature search and study selection processes.
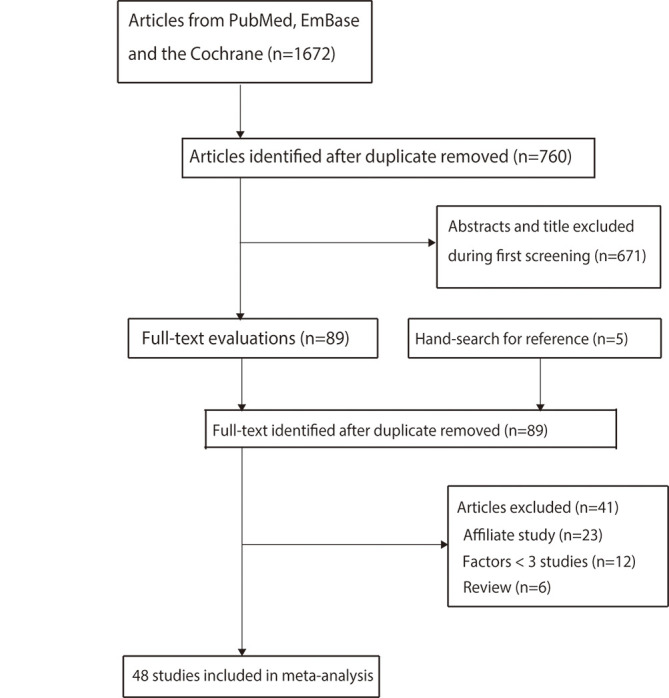
Table 1. The baseline characteristics of included studies.
| Study | Country | Study design | Sample size | Age (years) | Male (%) | Population | DES (%) | Definition of DES | Reported factors | Adjusted factors |
|---|---|---|---|---|---|---|---|---|---|---|
| BDES 2000 [25] | USA | C | 3,722 | 65.0 | 43.0 | PB | 14.4 | Questionnaire | DM, arthritis, TD, osteoporosis, gout, ES, CLW, alcohol, smoking | Age and sex |
| Lee 2002 [26] | Indonesia | C | 1,058 | 37.0 | 47.7 | PB | 27.5 | Questionnaire | Sex, smoking, pterygium | Sex, age, occupation, smoking, and pterygium |
| BMES 2003 [27] | Australia | C | 1,174 | 60.8 | 44.2 | PB | 57.5 | Questionnaire | Arthritis, asthma, DM, gout, smoking, alcohol | Age and sex |
| Sahai 2005 [28] | India | C | 500 | > 20.0 | 55.2 | HB | 18.4 | Questionnaire | Smoking | Age and sex |
| Nichols 2006 [29] | USA | C | 360 | 31.1 | 32.0 | HB | 55.3 | Questionnaire | Sex | Nominal water content, PLTF |
| Uchino 2008 [30] | Japan | C | 3,549 | 22.0–60.0 | 74.4 | PB | 10.1 | Questionnaire | Age, sex, VDT, systemic disease, smoking, contact lens | Age, gender, VDT use, systemic disease systemic medication, smoking, contact lens use |
| Lu 2008 [31] | China | C | 1,840 | 56.3 | 56.0 | PB | 52.4 | TFBT, ST, FSS | Age, education level, smoking alcohol | Crude |
| PHS 2009 [32] | USA | C | 25,444 | 64.4 | 100.0 | PB | 23.0 | Questionnaire | Age, race, hypertension, tumor, DM | Crude |
| TSES 2009 [33] | Spain | C | 654 | 63.6 | 37.2 | PB | 11.0 | Questionnaire | Sex, VDT use, CLW, rosacea, allergy, DM, hypertension, COPD, education level, alcohol, smoking | Age and sex |
| BES 2009 [34] | China | C | 1,957 | 56.5 | 43.1 | PB | 21.0 | Questionnaire | Sex, residence, glaucoma, MD, DM, hypertension, smoking, alcohol | Age, sex, region, undercorrection of refractive error, and nuclear cataract |
| THES 2010 [35] | China | C | 1,816 | 54.9 | 53.9 | PB | 50.1 | TBUT, ST, FSS | Pterygium, age, sex, education level, smoking, alcohol | Crude |
| Kim 2011 [36] | Korea | C | 650 | 71.9 | 48.3 | PB | 30.5 | Questionnaire | Sex, residence, depression, MGD | Crude |
| Koumi Study 2011 [37] | Japan | C | 2,791 | > 40.0 | 43.7 | PB | 16.5 | Questionnaire | Age, smoking, alcohol, BMI, education level, VDT use, CLW, stroke, CVD, hypertension, DM | Age, smoking, alcohol, BMI, education level, VDT use, CLW, stroke, CVD, hypertension, DM |
| USVAP 2011 [38] | USA | R | 16,862 | NA | NA | PB | 12.2 | ICD9 code | Sex, race, DM, hypertension, dyslipidemia, CVD, stroke, PTSD, depression, alcohol, arthritis, gout, TD, tumor, sleep apnea, rosacea, glaucoma | Age and sex |
| Zhang 2012 [39] | China | C | 1,885 | < 18.0 | 50.8 | PB | 23.7 | Questionnaire | CLW, sleep apnea | CLW, sleep apnea, myopia, inadequate refractive correction, topical ophthalmic medication |
| TNHRI 2012 [40] | China | R | 48,028 | 52.4 | 26.6 | PB | 25.0 | ICD9 code | Hypertension,CVD, dyslipidemia, stroke, migraines, arthritis, COPD, asthma, DM, TD, depression, and tumor | Age, sex, region, and incomes |
| TOS 2013 [41] | Japan | C | 561 | 43.3 | 66.7 | PB | 11.6 | Questionnaire | Sex, age, smoking, VDT use, CLW, systemic disease, hypertension | Sex, age, smoking, VDT use, CLW, systemic disease, hypertension |
| TwinUK 2014 [42] | UK | C | 3,824 | 57.1 | 0.0 | PB | 9.6 | Questionnaire | CLW, CS, glaucoma, MD, osteoporosis, asthma, allergy, TD, arthritis, dyslipidemia, hypertension, DM, cancer, stroke, migraine, depression | Age |
| KNHNES 2014 [43] | Korea | C | 11,666 | 49.9 | 42.8 | PB | 8.0 | Questionnaire | Age, sex, education level, residence, hypertension, obesity, dyslipidemia, arthritis, TD, smoking, alcohol, sleep apnea, ES | Age, sex, education level, residence, hypertension, obesity, dyslipidemia, arthritis, TD, smoking, alcohol, sleep apnea, ES |
| Moon 2014 [44] | Korea | C | 288 | 10.9 | 49.3 | PB | 9.7 | Questionnaire | VDT use | Age, and sex |
| BDOS 2014 [45] | USA | C | 3,275 | 49.0 | 45.4 | PB | 14.5 | Questionnaire | Age, sex, CLW, arthritis, allergies, TD, migraine | Age, and sex |
| TNHI 2015 [46] | China | R | 10,325 | 61.9 | 36.7 | PB | 20.0 | ICD9 code | DM, hypertension, dyslipidemia, CVD | DM, hypertension, dyslipidemia, CVD |
| Yang 2015 [47] | China | R | 1,908 | 56.2 | 41.4 | HB | 41.4 | TFBT, ST, and FSS | DM, arthritis, tumor, acne rosacea, PTSD, VDT use | DM, arthritis, tumor, acne rosacea, PTSD, VDT use |
| Tan 2015 [48] | Singapore | C | 1,004 | 38.2 | 44.1 | PB | 12.3 | Questionnaire | Sex, age, CLW, alcohol | Crude |
| Shah 2015 [49] | India | C | 400 | 58.6 | 48.0 | HB | 54.3 | TBUT | DM, ES, MGD | Occupation, indoor table work, DM previous ocular surgery, MGD |
| Olaniyan 2016 [50] | Nigeria | C | 363 | 59.1 | 48.2 | PB | 32.5 | Questionnaire | Age, ES | Age, work place, medication use, ocular surgery, postmenopausal state |
| Alshamrani 2017 [51] | Saudi Arabia | C | 1,858 | 39.3 | 48.0 | PB | 32.1 | Questionnaire | Sex, age, residence, smoking, CLW, DM, hypertension, asthma, CVD, TD, arthritis, gout, osteoporosis | Sex, age, residence, work status, smoking, currently wearing, and history of trachoma |
| NHWS 2017 [52] | USA | C | 73,211 | > 18.0 | 48.4 | PB | 6.9 | Questionnaire | Age, sex, race, education level | Age and sex |
| SMES 2017 [53] | Singapore | P | 1,682 | 56.9 | 44.6 | PB | 5.1 | Questionnaire | DM, hypertension, smoking, CLW, stroke, CVD, TD, glaucoma, MGD, pterygium | Sex, age, income, smoking, CLW, cataract surgery, thyroid disease |
| Gong 2017 [54] | China | C | 1,015 | 54.6 | 29.7 | PB | 27.8 | Questionnaire | VDT use, DM, hypertension, arthritis, smoking, alcohol | Sex, age, VDT use, DM, hypertension, arthritis, dry mouth, smoking, alcohol, and spicy diets |
| Asiedu 2017 [54] | Ghana | C | 650 | 22.0 | 66.6 | PB | 44.3 | Questionnaire | Age, sex, allergies, alcohol, VDT use | Age, sex, allergies, alcohol, VDT use |
| Graue-Hernandez 2018 [55] | Mexico | C | 1,508 | 64.7 | 40.3 | PB | 41.1 | Questionnaire | Sex, smoking, DM, alcohol, hypertension | Sex, smoking, DM, alcohol, hypertension |
| SES 2018 [56] | Spain | C | 264 | 56.8 | 32.7 | PB | 25.4 | TBUT, ST, FSS | Sex, education level, VDT use, alcohol, smoking, hypertension, DM, COPD, CVD, TD, rosacea | Age |
| Iglesias 2018 [57] | USA | R | 86 | 71.0 | 95.0 | HB | 32.1 | Questionnaire | Race, DM, depression, PTSD, sleep apnea, glaucoma | Crude |
| TMS 2018 [58] | France | C | 1,045 | 82.2 | 71.8 | PB | 34.4 | Questionnaire | Obesity, smoking, alcohol, education level, hypertension, DM, depression, CS, MD, glaucoma | Age, and sex |
| Shehadeh-Mashor 2019 [59] | Israel | R | 25,317 | 27.0 | 55.0 | PB | 6.0 | TBUT, and ST | Sex, CLW | Age and sex |
| Zhang 2019 [60] | China | C | 31,124 | NA | 49.1 | HB | 57.6 | ST, and FSS | Sex, age, DM, arthritis, TD, ES | Sex, age, refractive surgery |
| Yasir 2019 [61] | Saudi Arabia | C | 890 | > 40.0 | 55.5 | PB | 35.9 | Questionnaire | Glaucoma, DM, and hypertension | Crude |
| HTS 2019 [62] | Japan | C | 356 | 55.5 | 37.4 | PB | 33.4 | Questionnaire | Sex, smoking, CLW, hypertension | Sex, eye makeup use, smoking CLW, hypertension, sleeping pills |
| Hyon 2019 [63] | Korea | C | 232 | > 20.0 | 15.1 | PB | 42.7 | Questionnaire | Sex, VDT use | Sex, and VDT use |
| Ben-Eli 2019 [64] | Israel | R | 331 | 53.6 | 24.8 | HB | 36.3 | Clinician-diagnosed | Smoking, alcohol | Ethnicity, smoking, alcohol, hospitalization for infection |
| Yu 2019 [65] | China | C | 23,922 | NA | 48.8 | HB | 61.6 | TBUT, and FSS | Sex, age, ES, arthritis, TD | Humidity, air pressure, and air temperature |
| Rossi 2019 [66] | Italy | C | 194 | 41.8 | 34.5 | HB | 16.5 | TBUT, and FSS | Sex, VDT use | Age, sex, VDT use, visual acuity, and presbyopia |
| Wang 2020 [67] | New Zealand | C | 372 | 39.0 | 40.3 | PB | 29.0 | Clinician-diagnosed | Sex, CLW, anxiety, asthma, DM, depression, dyslipidemia, hypertension, cancer, migraine, TD, CS, ES | Age, CLW, ethnicity, migraine, menopause, systemic disease, thyroid disease, antidepressant medication, and oral contraceptive therapy |
| Shanti 2020 [68] | Palestine | C | 769 | 43.6 | 47.3 | PB | 64.0 | TBUT, ST, FSS | Sex, VDT use, smoking, DM, hypertension | Age, sex, VDT use, smoking, systemic disease |
| JPHC 2020 [69] | Japan | P | 102,582 | 58.3 | 46.2 | PB | 24.6 | Questionnaire | VDT use | Age, smoking, education status, income, and public health area |
| Alkabbani 2021 [70] | United Arab Emirates | C | 452 | > 17.0 | 36.3 | PB | 62.6 | Questionnaire | Age, sex, CLW, ES, VDT use, smoking | Age, sex, CLW, ES, VDT use, smoking |
| LCS 2021 [71] | Netherlands | C | 79,866 | 50.4 | 40.8 | PB | 9.1 | Questionnaire | Sex, CLW, MD, glaucoma, ES, CS, arthritis, gout, CVD, stroke, migraine, depression, PTSD, COPD, asthma, sleep apnea, rosacea, allergy, DM, osteoporosis, TD, anemia | Age, and sex |
*BMI: body mass index; C: cross-sectional; CLW: contact lens wear; COPD: chronic obstructive pulmonary disease; CS: cataract surgery; CVD: cardiovascular disease; DM: diabetes mellitus; ES: eye surgery; FSS: fluorescein staining score; HB: hospital-based; MD: macular degeneration; MDG: meibomian gland dysfunction; MI: myocardial infarction; NA: not available; P: prospective; PB: population-based; PLTF: prelens tear film; PTSD: post-traumatic stress disorder; R: retrospective; ST: Schirmer test; TBUT: tear film break-up time; TD: thyroid disease; TFBT: tear film breakup time; VDT: visual display terminal
Study characteristics
Of 48 included studies, 39 studies were designed as cross-sectional, 7 studies were designed as retrospective, and 2 studies designed as prospective. A total of 493,630 individuals were included, and the sample size ranged from 86 to 102,582. The mean age of included individuals ranged from 10.9 to 82.2. Twenty-nine studies were performed in Eastern countries, with the remaining 19 studies conducted in Western countries. Thirty-nine studies were population based. The remaining 9 studies were hospital based. The DES definition based on questionnaire were reported in 33 studies, 10 studies used TBUT, ST, or FSS defined DES, 3 studies applied ICD9 code and the remaining 2 studies used clinician-diagnosed defined DES. Study quality was assessed using the NOS; 11 studies had 8 stars, 18 had 7 stars, and the remaining 19 had 6 stars (S1 Table). The quality of included studies mainly affect by the representativeness of the exposed cohort, and comparability on the basis of the design or analysis.
Meta-analysis
Demographic factors
The number of studies that reported on the association of age, sex, and race as risk factors for DES was 15, 29, and 5, respectively (Fig 2 and S2 File). We noted that older adults (OR: 1.82; 95%CI: 1.47–2.26; P<0.001), females (OR: 1.56; 95%CI: 1.36–1.78; P<0.001), and those of other race (OR: 1.27; 95%CI: 1.11–1.44; P<0.001) had an increased risk of DES. There was significant heterogeneity for age (I2 = 96.0%; P<0.001), sex (I2 = 95.0%; P<0.001), and race (I2 = 52.1%; P = 0.080). Sensitivity analysis indicated these pooled conclusions were robust and not altered by sequentially excluding individual studies (S3 File). The results of subgroup analyses were consistent with overall analysis when stratified according to the region (Table 2). There were no significant publication biases for age (P-value for Egger: 0.175; P-value for Begg: 1.000), sex (P-value for Egger: 0.417; P-value for Begg: 0.253), and race (P-value for Egger: 0.174; P-value for Begg: 0.806) regarding risk for DES (S4 File).
Fig 2. Summary results of risk factors for dry eye syndrome.

Table 2. Subgroup analyses according to region.
| Factors | Subgroup | OR and 95%CI | P value | I2 (%) | P heterogeneity | P value between subgroups |
|---|---|---|---|---|---|---|
| Age (elderly versus younger) | Eastern countries | 1.78 (1.46–2.19) | < 0.001 | 89.4 | < 0.001 | < 0.001 |
| Western countries | 2.04 (1.05–3.97) | 0.036 | 98.7 | < 0.001 | ||
| Sex (female versus male) | Eastern countries | 1.53 (1.36–1.72) | < 0.001 | 84.0 | < 0.001 | < 0.001 |
| Western countries | 1.52 (1.20–1.92) | < 0.001 | 95.8 | < 0.001 | ||
| Race (other versus white) | Eastern countries | - | - | - | - | - |
| Western countries | 1.27 (1.11–1.44) | < 0.001 | 52.1 | 0.080 | ||
| Residence (urban versus rural) | Eastern countries | 1.41 (0.96–2.08) | 0.078 | 87.8 | < 0.001 | - |
| Western countries | - | - | - | - | ||
| Education level (high versus low) | Eastern countries | 1.28 (1.01–1.63) | 0.041 | 60.2 | 0.057 | 0.007 |
| Western countries | 0.86 (0.56–1.33) | 0.505 | 80.7 | 0.001 | ||
| Obesity | Eastern countries | 1.02 (0.83–1.25) | 0.866 | 2.1 | 0.360 | 0.685 |
| Western countries | 1.11 (0.77–1.60) | 0.576 | - | - | ||
| Dyslipidemia | Eastern countries | 1.35 (1.01–1.80) | 0.046 | 94.7 | < 0.001 | < 0.001 |
| Western countries | 1.05 (0.82–1.35) | 0.676 | 77.2 | 0.004 | ||
| Alcohol | Eastern countries | 1.04 (0.90–1.20) | 0.589 | 0.0 | 0.429 | 0.177 |
| Western countries | 0.92 (0.64–1.32) | 0.641 | 76.1 | <0.001 | ||
| Smoking | Eastern countries | 0.96 (0.81–1.15) | 0.668 | 65.2 | < 0.001 | 0.046 |
| Western countries | 1.09 (0.82–1.45) | 0.554 | 60.0 | 0.020 | ||
| VDT use | Eastern countries | 1.33 (1.17–1.53) | < 0.001 | 85.5 | < 0.001 | 0.436 |
| Western countries | 1.33 (1.06–1.68) | 0.015 | 0.0 | 0.457 | ||
| Cataract surgery | Eastern countries | 2.16 (1.62–2.89) | < 0.001 | 0.0 | 0.792 | 0.561 |
| Western countries | 1.69 (1.28–2.21) | < 0.001 | 76.0 | 0.002 | ||
| Contact lens wear | Eastern countries | 2.01 (1.48–2.71) | <0.001 | 72.8 | <0.001 | 0.003 |
| Western countries | 1.41 (0.93–2.14) | 0.105 | 97.1 | <0.001 | ||
| Pterygium | Eastern countries | 1.85 (1.13–3.01) | 0.014 | 89.0 | < 0.001 | - |
| Western countries | - | - | - | - | ||
| Glaucoma | Eastern countries | 2.15 (1.29–3.58) | 0.003 | 26.1 | 0.255 | 0.516 |
| Western countries | 1.57 (0.92–2.68) | 0.098 | 96.5 | < 0.001 | ||
| Age-related maculopathy | Eastern countries | 0.31 (0.07–1.35) | 0.118 | - | - | 0.007 |
| Western countries | 1.91 (1.21–3.01) | 0.005 | 62.9 | 0.067 | ||
| Eye surgery | Eastern countries | 1.62 (1.23–2.14) | 0.001 | 93.6 | <0.001 | <0.001 |
| Western countries | 1.82 (1.39–2.37) | < 0.001 | 32.1 | 0.229 | ||
| Depression | Eastern countries | 2.12 (1.95–2.32) | < 0.001 | 0.0 | 0.876 | < 0.001 |
| Western countries | 1.66 (1.43–1.93) | < 0.001 | 67.0 | 0.010 | ||
| PTSD | Eastern countries | 1.45 (1.04–2.01) | 0.027 | - | - | 0.121 |
| Western countries | 1.71 (1.19–2.46) | 0.004 | 53.0 | 0.119 | ||
| Sleep apnea | Eastern countries | 1.22 (1.11–1.35) | < 0.001 | 4.5 | 0.370 | < 0.001 |
| Western countries | 2.17 (1.95–2.41) | < 0.001 | 0.0 | 0.749 | ||
| Asthma | Eastern countries | 1.19 (0.98–1.45) | 0.076 | 29.0 | 0.235 | < 0.001 |
| Western countries | 1.62 (1.49–1.77) | < 0.001 | 0.0 | 0.869 | ||
| Allergy | Eastern countries | - | - | - | - | - |
| Western countries | 1.38 (1.32–1.45) | < 0.001 | 0.0 | 0.418 | ||
| Hypertension | Eastern countries | 1.06 (0.95–1.17) | 0.306 | 63.7 | 0.001 | 0.005 |
| Western countries | 1.27 (1.14–1.41) | < 0.001 | 24.8 | 0.231 | ||
| DM | Eastern countries | 1.20 (1.06–1.37) | 0.005 | 79.0 | < 0.001 | < 0.001 |
| Western countries | 1.08 (0.87–1.34) | 0.460 | 88.5 | < 0.001 | ||
| CVD | Eastern countries | 1.26 (1.15–1.39) | < 0.001 | 0.0 | 0.753 | 0.084 |
| Western countries | 1.15 (1.00–1.32) | 0.049 | 18.5 | 0.293 | ||
| Stroke | Eastern countries | 1.31 (1.22–1.41) | < 0.001 | 0.0 | 0.978 | 0.667 |
| Western countries | 1.35 (1.20–1.51) | < 0.001 | 0.0 | 0.589 | ||
| Rosacea | Eastern countries | 3.75 (1.97–7.12) | < 0.001 | - | - | 0.032 |
| Western countries | 1.74 (1.20–2.52) | 0.004 | 53.1 | 0.094 | ||
| Thyroid disease | Eastern countries | 1.57 (1.29–1.91) | < 0.001 | 86.0 | <0.001 | 0.752 |
| Western countries | 1.64 (1.45–1.84) | < 0.001 | 26.9 | 0.223 | ||
| COPD | Eastern countries | 1.06 (0.84–1.34) | 0.625 | - | - | 0.006 |
| Western countries | 1.37 (1.00–1.89) | 0.051 | 23.2 | 0.272 | ||
| Gout | Eastern countries | 1.56 (0.70–3.49) | 0.275 | 83.3 | 0.014 | 0.175 |
| Western countries | 1.34 (1.17–1.53) | < 0.001 | 0.0 | 0.860 | ||
| Migraines | Eastern countries | 1.76 (1.57–1.98) | < 0.001 | - | - | < 0.001 |
| Western countries | 1.41 (1.19–1.68) | < 0.001 | 54.2 | 0.088 | ||
| Arthritis | Eastern countries | 1.74 (1.31–2.29) | < 0.001 | 95.6 | < 0.001 | 0.776 |
| Western countries | 1.80 (1.57–2.07) | < 0.001 | 74.7 | 0.001 | ||
| Osteoporosis | Eastern countries | 0.81 (0.51–1.29) | 0.377 | - | - | 0.004 |
| Western countries | 1.53 (1.21–1.93) | < 0.001 | 75.8 | 0.016 | ||
| Tumor | Eastern countries | 2.27 (0.83–6.22) | 0.111 | 94.7 | < 0.001 | 0.339 |
| Western countries | 1.33 (1.17–1.50) | <0.001 | 39.5 | 0.175 |
The number of studies reporting an association of residence, education level, obesity, and dyslipidemia regarding the risk of DES were 4, 8, 4, and 7, respectively (Fig 2 and S2 File). We noted that residence (urban versus rural) (OR: 1.41; 95%CI: 0.96–2.08; P = 0.078), education level (high versus low) (OR: 1.09; 95%CI: 0.88–1.34; P = 0.443), obesity (OR: 1.04; 95%CI: 0.87–1.24; P = 0.671), and dyslipidemia (OR: 1.18; 95%CI: 0.97–1.45; P = 0.104) were not associated with increased risk for DES. There was significant heterogeneity for residence (I2 = 87.8%; P<0.001), education level (I2 = 76.9%; P<0.001), and dyslipidemia (I2 = 92.9%; P<0.001), while there was no evidence of heterogeneity for obesity (I2 = 0.0%; P = 0.530). Sensitivity analyses indicated that residence, education level, and dyslipidemia might be associated with an elevated risk of DES, while the association between obesity and DES persisted (S3 File). Subgroup analyses demonstrated that education level and dyslipidemia were associated with an increased risk of DES when pooling studies conducted in Eastern countries (Table 2). No significant publication bias for residence (P-value for Egger: 0.875; P-value for Begg: 0.734), education level (P-value for Egger: 0.985; P-value for Begg: 0.902), and obesity (P-value for Egger: 0.638; P-value for Begg: 0.308) with the risk of DES was noted, whereas potential significant publication bias for dyslipidemia (P-value for Egger: 0.037; P-value for Begg: 1.000) with the risk of DES was seen (S4 File).
The number of studies reporting an association of alcohol, smoking, and VDT use with the risk of DES was 15, 22, and 14, respectively (Fig 2 and S2 File). We noted that alcohol intake (OR: 0.98; 95%CI: 0.81–1.18; P = 0.808) and current smoking (OR: 1.00; 95%CI: 0.86–1.16; P = 0.986) were not associated with risk for DES, while VDT use was associated with an increased risk of DES (OR: 1.32; 95%CI: 1.17–1.49; P<0.001). There was significant heterogeneity for alcohol (I2 = 62.2%; P = 0.001), smoking (I2 = 64.6%; P<0.001), and VDT use (I2 = 80.1%; P<0.001). Sensitivity analysis indicated that alcohol intake might play an important role in the risk of DES, while the pooled results for the associations of smoking and VDT use with the risk of DES were robust (S3 File). The results of subgroup analyses were consistent with the overall analysis (Table 2). No significant publication bias for smoking (P-value for Egger: 0.569; P-value for Begg: 0.822) and VDT use (P-value for Egger: 0.370; P value for Begg: 0.827) with the risk of DES was found, whereas potential significant publication bias for alcohol (P-value for Egger: 0.032; P-value for Begg: 0.921) with the risk of DES was noted (S4 File).
Clinical characteristics
The number of studies that reported on the association of cataract surgery, contact lens wear, pterygium, glaucoma, age-related maculopathy, and eye surgery with the risk of DES were 7, 17, 4, 9, 3, and 8, respectively (Fig 2 and S2 File). We noted that cataract surgery (OR: 1.80; 95%CI: 1.46–2.21; P<0.001), contact lens wear (OR: 1.74; 95%CI: 1.34–2.25; P<0.001), pterygium (OR: 1.85; 95%CI: 1.13–3.01; P = 0.014), glaucoma (OR: 1.77; 95%CI: 1.17–2.69; P = 0.007), and eye surgery (OR: 1.65; 95%CI: 1.31–2.07; P<0.001) were associated with an increased risk of DES, while age-related maculopathy was not associated with risk of DES (OR: 1.46; 95%CI: 0.79–2.70; P = 0.231). Significant heterogeneity was noted for cataract surgery (I2 = 64.8%; P<0.001), contact lens wear (I2 = 93.5%; P<0.001), pterygium (I2 = 89.0%; P<0.001), glaucoma (I2 = 93.4%; P<0.001), age-related maculopathy (I2 = 76.5%; P = 0.005), and eye surgery (I2 = 94.0%; P<0.001) with the risk of DES. Sensitivity analyses indicated that the pooled results for the association of cataract surgery, contact lens wear, pterygium, glaucoma, and eye surgery with the risk of DES persisted, whereas age-related maculopathy might be associated with the risk of DES (S3 File). Although most results in the subgroup analyses were consistent with the overall analysis, we noted that contact lens wear and glaucoma were not associated with the risk of DES when pooling studies performed in Western countries. Moreover, age-related maculopathy was associated with an increased risk of DES when pooling studies conducted in Western countries (Table 2). There was no significant publication bias for the association of cataract surgery (P-value for Egger: 0.194; P-value for Begg: 0.548), contact lens wear (P-value for Egger: 0.791; P-value for Begg: 0.387), pterygium (P-value for Egger: 0.681; P-value for Begg: 0.734), glaucoma (P-value for Egger: 0.950; P-value for Begg: 0.917), and eye surgery (P-value for Egger: 0.760; P-value for Begg: 0.266) with the risk of DES, while potential significant publication bias was noted for age-related maculopathy (P-value for Egger: 0.017; P-value for Begg: 0.308) with the risk of DES (S4 File).
Comorbidities
The number of studies that reported on the association of depression, PTSD, sleep apnea, asthma, and allergy with the risk of DES were 9, 4, 7, 6, and 6, respectively (Fig 2 and S2 File). We noted that depression (OR: 1.83; 95%CI: 1.57–2.12; P<0.001), PTSD (OR: 1.65; 95%CI: 1.26–2.15; P<0.001), sleep apnea (OR: 1.57; 95%CI: 1.16–2.11; P = 0.003), asthma (OR: 1.43; 95%CI: 1.20–1.71; P<0.001), and allergy (OR: 1.38; 95%CI: 1.32–1.45; P<0.001) were associated with an increased risk of DES. There was significant heterogeneity for depression (I2 = 80.7%; P<0.001), PTSD (I2 = 55.0%; P = 0.083), sleep apnea (I2 = 91.5%; P<0.001), and asthma (I2 = 76.5%; P = 0.001), while no evidence of heterogeneity for allergy was observed (I2 = 0.0%; P = 0.418). Sensitivity analyses indicated that pooled conclusions for the association of depression, PTSD, sleep apnea, asthma, and allergy with the risk of DES were stable after sequentially removing individual studies (S3 File). The results of subgroup analyses were consistent with overall analysis, except that asthma was not associated with the risk of DES if pooled studies were performed in Eastern countries (Table 2). No significant publication bias for the role of depression (P-value for Egger: 0.679; P-value for Begg: 0.348), PTSD (P-value for Egger: 0.415; P-value for Begg: 0.734), sleep apnea (P-value for Egger: 0.959; P-value for Begg: 0.764), asthma (P-value for Egger: 0.949; P-value for Begg: 1.000), and allergy (P-value for Egger: 0.189; P-value for Begg: 0.707) with DES were observed (S4 File).
The number of studies reporting on the association of hypertension, DM, CVD, stroke, rosacea, thyroid disease, and COPD with the risk of DES were 21, 24, 8, 7, 5, 14, and 4, respectively (Fig 2 and S2 File). We noted that hypertension (OR: 1.12; 95%CI: 1.04–1.22; P = 0.004), DM (OR: 1.15; 95%CI: 1.02–1.29; P = 0.019), CVD (OR: 1.20; 95%CI: 1.12–1.29; P<0.001), stroke (OR: 1.32; 95%CI: 1.24–1.40; P<0.001), rosacea (OR: 1.99; 95%CI: 1.34–2.95; P = 0.001), and thyroid disease (OR: 1.60; 95%CI: 1.42–1.80; P<0.001) were associated with an increased risk of DES, while COPD was not associated with risk of DES (OR: 1.22; 95%CI: 10.90–1.66; P = 0.202). There was significant heterogeneity for hypertension (I2 = 60.2%; P<0.001), DM (I2 = 86.7%; P<0.001), rosacea (I2 = 63.6%; P = 0.027), thyroid disease (I2 = 74.6%; P<0.001), and COPD (I2 = 70.6%; P = 0.017), while no significant heterogeneity was observed for CVD (I2 = 4.8%; P = 0.393) and stroke (I2 = 0.0%; P = 0.964). The pooled conclusions for the association of hypertension, CVD, stroke, rosacea, and thyroid disease with the risk of DES were stable, while the conclusions for DM and COPD with DES were variable (S3 File). Although the results of subgroup analyses were consistent with the overall analysis in most subsets, we noted that hypertension was not related to DES if pooling in Eastern country studies, while DM was not associated with the risk of DES if pooled studies were performed in Western countries (Table 2). There was no significant publication bias for hypertension (P-value for Egger: 0.331; P-value for Begg: 0.928), DM (P-value for Egger: 0.765; P-value for Begg: 0.862), CVD (P-value for Egger: 0.357; P-value for Begg: 0.711), stroke (P-value for Egger: 0.485; P-value for Begg: 0.368), rosacea (P-value for Egger: 0.759; P-value for Begg: 0.806), thyroid disease (P-value for Egger: 0.996; P-value for Begg: 0.228), and COPD (P-value for Egger: 0.267; P-value for Begg: 1.000) (S4 File).
The number of studies reporting on the association of gout, migraines, arthritis, osteoporosis, tumor, MGD, eczema, and systemic disease with the risk of DES was 6, 5, 13, 4, 6, 3, 3, and 3, respectively (Fig 2 and S2 File). We noted that gout (OR: 1.40; 95%CI: 1.17–1.68; P<0.001), migraines (OR: 1.53; 95%CI: 1.25–1.89; P<0.001), arthritis (OR: 1.76; 95%CI: 1.51–2.05; P<0.001), osteoporosis (OR: 1.36; 95%CI: 1.03–1.80; P = 0.030), tumor (OR: 1.46; 95%CI: 1.23–1.76; P<0.001), eczema (OR: 1.30; 95%CI: 1.22–1.38; P<0.001), and systemic disease (OR: 1.45; 95%CI: 1.11–1.91; P = 0.007) were associated with an increased risk of DES, while MGD was not associated with risk of DES (OR: 2.47; 95%CI: 0.79–7.70; P = 0.119). There was significant heterogeneity for migraines (I2 = 86.4%; P<0.001), arthritis (I2 = 92.4%; P<0.001), osteoporosis (I2 = 82.1%; P = 0.001), tumor (I2 = 79.9%; P<0.001), and MGD (I2 = 85.2%; P = 0.001), while no significant heterogeneity for gout (I2 = 41.8%; P = 0.126), eczema (I2 = 0.0%; P = 0.609), and systemic disease (I2 = 0.0%; P = 0.007) was observed. The pooled conclusions for the association of gout, migraines, arthritis, osteoporosis, and tumor with the risk of DES were robust after sequentially removing individual studies (S3 File). Although the results of subgroup analyses were consistent with the overall analysis in most subsets, gout, osteoporosis, and tumor were not associated with risk of DES if pooled studies were performed in Eastern countries. There was no significant publication bias for gout (P-value for Egger: 0.902; P-value for Begg: 0.707), migraines (P-value for Egger: 0.249; P-value for Begg: 0.806), arthritis (P-value for Egger: 0.169; P-value for Begg: 0.360), osteoporosis (P-value for Egger: 0.137; P-value for Begg: 0.308), and tumor (P-value for Egger: 0.721; P-value for Begg: 1.000) (S4 File).
Discussion
This systematic review and meta-analysis was based on published observational studies explored potential risk factors for DES and included 493,630 individuals from 48 studies. We found that risk factors for DES included older age, female sex, other race, VDT use, cataract surgery, contact lens wear, pterygium, glaucoma, eye surgery, depression, PTSD, sleep apnea, asthma, allergy, hypertension, DM, CVD, stroke, rosacea, thyroid disease, gout, migraines, arthritis, osteoporosis, tumor, eczema, and systemic disease. Moreover, country of origin could affect association for age, sex, education level, dyslipidemia, smoking, contact lens wear, age-related maculopathy, eye surgery, depression, sleep apnea, asthma, hypertension, DM, rosacea, COPD, migraines, and osteoporosis regarding the risk of DES.
This current study primarily identified potential risk factors for DES, although several factors have already been demonstrated in individual studies. Prior studies have demonstrated that a 5-year incidence of dry eye rises from 10.7% to 17.9% alongside increasing age [72]. A potential reason could be the reduction of tear secretion with biological aging [2, 73]. Moreover, the sex difference in DES could be explained by various hormonal effects on the ocular surface and lacrimal gland [8]. The potential impact for VDT use could be due to increasing rates of incomplete blinks and accelerated evaporation of the tear film [74]. The increased risk of DES after cataract surgery could be explained by cataract surgery inducing tear film dysfunction [75]. The role of contact lens wear on DES could be explained in that placing a lens on the eye could cause disturbance of the tear film [76]. DES could be considered as a precipitating factor of primary pterygium [77]. The treatment of glaucoma could alter the surface of the eye through disturbing tear secretion, which could affect the progression of DES [78]. Studies have already found that open eye surgery could affect altered tear secretion in nearly 91% of patients, thus playing an important role in the risk of DES [79]. The potential role of depression and PTSD could be explained by the dysregulation of neuropeptides coupled with serotonin in human tears and serotonin receptors in human conjunctivae [80]. Sleep apnea is significantly associated with neuropathic pain, which could induce the progression of dry eye syndrome [81]. The role of asthma and allergy on the risk of DES could be explained by antihistaminic and anti-inflammatory agents used for asthma and allergy treatment, which could potentially cause an elevated risk of DES [82].
This study found that hypertension and DM were associated with an increased risk of DES, which was consistent with the results of a prior meta-analysis [83]. A potential reason for this could be hypertension was not direct affect the risk of DES, while the use of anti-hypertensive medication could increase the risk of DES [33]. In addition, the risk of DES were not increased in hypertensive patients treated with anti-hypertensive medications, such as Angiotension Converting Enzyme inhibitors might play a protective role on the risk of DES [34]. Moreover, DM could induce a decrease in corneal sensation and tear production, impaired metabolic activity, and loss of cytoskeletal structure, all of which could affect the progression of DES [84]. The underlying therapies for CVD, stroke, and tumor could be regarded as disposing of factors for DES [25]. Rosacea is a well known risk factor for DES due to is pro-inflammatory effects that induce meibomian gland dysfunction and evaporative DES [85]. Studies have already found that thyroid disease is significantly related to ocular surface damage, eyelid retraction/impaired Bell’s phenomenon, and reduced tear production [86]. Gout was associated with the tophaceous deposits in different locations of the eye, including eyelids, conjunctiva, cornea, iris, sclera, and orbit, a similar reason could explain the role of arthritis on DES [87]. The role of migraines on DES could be explained by an inflammatory status in migraine patients potentially activating inflammation in the eyes [88]. The inflammation and hormone imbalance caused by osteoporosis could explain an elevated risk of DES [89]. The treatment for eczema and systemic disease could cause an elevated risk of DES [90].
Our study found that potential associations for age, sex, education level, dyslipidemia, smoking, contact lens wear, age-related maculopathy, eye surgery, depression, sleep apnea, asthma, hypertension, DM, rosacea, COPD, migraines, and osteoporosis with the risk of DES could be affected by country of origin. The disease distribution for DES is different in Eastern and Western countries, and the health policy in various countries could further affect the progression of DES. Moreover, environmental, dietary, and lifestyle factors among various countries differ, which could affect the progression of DES [91, 92].
Several shortcomings of this study should be acknowledged. First, this study contained cross-sectional, retrospective, and prospective observational studies, and the causality relationships between risk factors and DES could not available. Second, the heterogeneity for most risk factors was substantial, which was not fully explained by sensitivity and subgroup analyses. Third, the comorbidity and underlying therapies for individuals were not fully adjusted, which could affect the progression of DES. Fourth, the cutoff value for age, and definition for systemic disease, eye surgery, and DES are different across included studies, which could induce potential uncontrolled biases. Fifth, the climate type could affect the progression of DES, and nearly all of included studies did not address the climate type. Sixth, the analysis based on published articles, the gray literature and unpublished data were not available, and the publication bias was inevitable. Seventh, the analysis using the pooled data, and the detailed analyses were restricted. Finally, this study was not registered in PROSPERO, and the transparency was restricted.
Conclusions
This study identified comprehensive risk factors for DES, including older age, female sex, other race, VDT use, cataract surgery, contact lens wear, pterygium, glaucoma, eye surgery, depression, PTSD, sleep apnea, asthma, allergy, hypertension, DM, CVD, stroke, rosacea, thyroid disease, gout, migraines, arthritis, osteoporosis, tumor, eczema, and systemic disease. Further large-scale prospective cohort studies should be performed to verify the results of this study.
Supporting information
(PDF)
(DOCX)
(DOCX)
(DOCX)
(DOCX)
(DOCX)
Abbreviations
- CI
confidence interval
- COPD
chronic obstructive pulmonary disease
- CVD
cardiovascular disease
- DES
dry eye syndrome
- DM
diabetes mellitus
- HR
hazard ratio
- MGD
meibomian gland dysfunction
- NOS
Newcastle-Ottawa Scale
- OR
odds ratio
- PTSD
post-traumatic stress disorder
- RR
relative risk
- VDT
visual display terminal
Data Availability
All relevant data are within the paper and its Supporting Information files.
Funding Statement
The authors received no specific funding for this work.
References
- 1.Craig JP, Nichols KK, Akpek EK, Caffery B, Dua HS, Joo CK, et al. TFOS DEWS II Definition and Classification Report. Ocul Surf. 2017;15:276–283. doi: 10.1016/j.jtos.2017.05.008 [DOI] [PubMed] [Google Scholar]
- 2.Gayton JL. Etiology, prevalence, and treatment of dry eye disease. Clin Ophthalmol. 2009;3:405–412. doi: 10.2147/opth.s5555 [DOI] [PMC free article] [PubMed] [Google Scholar]
- 3.Uchino M, Schaumberg D. Dry Eye Disease: Impact on Quality of Life and Vision. Curr Ophthalmol Rep 2013;1:51–7. doi: 10.1007/s40135-013-0009-1 [DOI] [PMC free article] [PubMed] [Google Scholar]
- 4.Findlay Q, Reid K. Dry eye disease: when to treat and when to refer. Aust Prescr 2018; 41:160–3. doi: 10.18773/austprescr.2018.048 [DOI] [PMC free article] [PubMed] [Google Scholar]
- 5.Javadi MA, Feizi S. Dry eye syndrome. J Ophthalmic Vis Res 2011;6:192–8. [PMC free article] [PubMed] [Google Scholar]
- 6.Jain S, Bhavsar A, Bhavsar S. A review on recent advances in dry eye: Pathogenesis and management. Oman J Opthalmol 2011;4:50. doi: 10.4103/0974-620X.83653 [DOI] [PMC free article] [PubMed] [Google Scholar]
- 7.Dana R, Bradley JL, Guerin A, Pivneva I, Stillman IÖ, Evans AM, et al. Estimated Prevalence and Incidence of Dry Eye Disease Based on Coding Analysis of a Large, All-age United States Health Care System. Am J Ophthalmol. 2019;202:47–54. doi: 10.1016/j.ajo.2019.01.026 [DOI] [PubMed] [Google Scholar]
- 8.Song P, Xia W, Wang M, Chang X, Wang J, Jin S, et al. Variations of dry eye disease prevalence by age, sex and geographic characteristics in China: a systematic review and meta-analysis. J Glob Health. 2018;8:020503. doi: 10.7189/jogh.08.020503 [DOI] [PMC free article] [PubMed] [Google Scholar]
- 9.The epidemiology of dry eye disease: report of the Epidemiology Subcommittee of the International Dry Eye WorkShop (2007). Ocul Surf 2007;5:93–107. doi: 10.1016/s1542-0124(12)70082-4 [DOI] [PubMed] [Google Scholar]
- 10.Courtin R, Pereira B, Naughton G, Chamoux A, Chiambaretta F, Lanhers C, et al. Prevalence of dry eye disease in visual display terminal workers: a systematic review and meta-analysis. BMJ Open. 2016;6:e009675. doi: 10.1136/bmjopen-2015-009675 [DOI] [PMC free article] [PubMed] [Google Scholar]
- 11.Ahn J, Ryu SJ, Song J, Kim HR. Shift Work and Dry Eye Disease in the Korean Working Population: A Population-Based Cross-Sectional Study. Int J Environ Res Public Health. 2021;18:5492. doi: 10.3390/ijerph18105492 [DOI] [PMC free article] [PubMed] [Google Scholar]
- 12.Liu J, Dong Y, Wang Y. Vitamin D deficiency is associated with dry eye syndrome: a systematic review and meta-analysis. Acta Ophthalmol. 2020;98:749–754. doi: 10.1111/aos.14470 [DOI] [PubMed] [Google Scholar]
- 13.Yoo TK, Oh E. Diabetes mellitus is associated with dry eye syndrome: a meta-analysis. Int Ophthalmol. 2019;39:2611–2620. doi: 10.1007/s10792-019-01110-y [DOI] [PubMed] [Google Scholar]
- 14.Moher D, Liberati A, Tetzlaff J, Altman DG; PRISMA Group. Preferred reporting items for systematic reviews and meta-analyses: the PRISMA statement. PLoS Med. 2009;6: e1000097. doi: 10.1371/journal.pmed.1000097 [DOI] [PMC free article] [PubMed] [Google Scholar]
- 15.Song P, Rudan D, Zhu Y, Fowkes FJI, Rahimi K, Fowkes FGR, et al. Global, regional, and national prevalence and risk factors for peripheral artery disease in 2015: an updated systematic review and analysis. Lancet Glob Health. 2019;7:e1020–e1030 doi: 10.1016/S2214-109X(19)30255-4 [DOI] [PubMed] [Google Scholar]
- 16.Wells G, Shea B, O’Connell D. The Newcastle-Ottawa Scale (NOS) for assessing the quality of nonrandomised studies in meta-analyses. Ottawa (ON): Ottawa Hospital Research Institute; 2009. Available: http://www.ohri.ca/programs/clinical_epidemiology /oxford.htm. [Google Scholar]
- 17.DerSimonian R, Laird N. Meta-analysis in clinical trials. Control Clin Trials. 1986; 7: 177–88. doi: 10.1016/0197-2456(86)90046-2 [DOI] [PubMed] [Google Scholar]
- 18.Ades AE, Lu G, Higgins JP. The interpretation of random-effects metaanalysis in decision models. Med Decis Making. 2005; 25: 646–54. doi: 10.1177/0272989X05282643 [DOI] [PubMed] [Google Scholar]
- 19.Deeks JJ, Higgins JPT, Altman DG. Analyzing data and undertaking meta-analyses. In: Higgins J, Green S, eds. Cochrane Handbook for Systematic Reviews of Interventions 5.0.1. Oxford, UK: The Cochrane Collaboration: 2008; chap 9. [Google Scholar]
- 20.Higgins JP, Thompson SG, Deeks JJ, Altman DG. Measuring inconsistency in meta-analyses. BMJ. 2003;327:557–60. doi: 10.1136/bmj.327.7414.557 [DOI] [PMC free article] [PubMed] [Google Scholar]
- 21.Tobias A. Assessing the influence of a single study in meta-analysis. Stata Tech Bull. 1999;47:15–7. [Google Scholar]
- 22.Altman DG, Bland JM. Interaction revisited: the difference between two estimates. BMJ. 2003; 326: 219. doi: 10.1136/bmj.326.7382.219 [DOI] [PMC free article] [PubMed] [Google Scholar]
- 23.Egger M, Davey Smith G, Schneider M, Minder C. Bias in meta-analysis detected by a simple, graphical test. BMJ. 1997;315:629–34. doi: 10.1136/bmj.315.7109.629 [DOI] [PMC free article] [PubMed] [Google Scholar]
- 24.Begg CB, Mazumdar M. Operating characteristics of a rank correlation test for publication bias. Biometrics. 1994; 50: 1088–1101. [PubMed] [Google Scholar]
- 25.Moss SE, Klein R, Klein BE. Prevalence of and risk factors for dry eye syndrome. Arch Ophthalmol. 2000;118:1264–8. doi: 10.1001/archopht.118.9.1264 [DOI] [PubMed] [Google Scholar]
- 26.Lee AJ, Lee J, Saw SM, Gazzard G, Koh D, Widjaja D, et al. Prevalence and risk factors associated with dry eye symptoms: a population based study in Indonesia. Br J Ophthalmol. 2002;86:1347–51. doi: 10.1136/bjo.86.12.1347 [DOI] [PMC free article] [PubMed] [Google Scholar]
- 27.Chia EM, Mitchell P, Rochtchina E, Lee AJ, Maroun R, Wang JJ. Prevalence and associations of dry eye syndrome in an older population: the Blue Mountains Eye Study. Clin Exp Ophthalmol. 2003;31:229–32. doi: 10.1046/j.1442-9071.2003.00634.x [DOI] [PubMed] [Google Scholar]
- 28.Sahai A, Malik P. Dry eye: prevalence and attributable risk factors in a hospital-based population. Indian J Ophthalmol. 2005;53:87–91. doi: 10.4103/0301-4738.16170 [DOI] [PubMed] [Google Scholar]
- 29.Nichols JJ, Sinnott LT. Tear film, contact lens, and patient-related factors associated with contact lens-related dry eye. Invest Ophthalmol Vis Sci. 2006;47:1319–28. doi: 10.1167/iovs.05-1392 [DOI] [PubMed] [Google Scholar]
- 30.Uchino M, Schaumberg DA, Dogru M, Uchino Y, Fukagawa K, Shimmura S, et al. Prevalence of dry eye disease among Japanese visual display terminal users. Ophthalmology. 2008;115:1982–8. doi: 10.1016/j.ophtha.2008.06.022 [DOI] [PubMed] [Google Scholar]
- 31.Lu P, Chen X, Liu X, Yu L, Kang Y, Xie Q, et al. Dry eye syndrome in elderly Tibetans at high altitude: a population-based study in China. Cornea. 2008;27:545–51. doi: 10.1097/ICO.0b013e318165b1b7 [DOI] [PubMed] [Google Scholar]
- 32.Schaumberg DA, Dana R, Buring JE, Sullivan DA. Prevalence of dry eye disease among US men: estimates from the Physicians’ Health Studies. Arch Ophthalmol. 2009;127:763–8. doi: 10.1001/archophthalmol.2009.103 [DOI] [PMC free article] [PubMed] [Google Scholar]
- 33.Viso E, Rodriguez-Ares MT, Gude F. Prevalence of and associated factors for dry eye in a Spanish adult population (the Salnes Eye Study). Ophthalmic Epidemiol. 2009;16: 15–21. doi: 10.1080/09286580802228509 [DOI] [PubMed] [Google Scholar]
- 34.Jie Y, Xu L, Wu YY, Jonas JB. Prevalence of dry eye among adult Chinese in the Beijing Eye Study. Eye (Lond). 2009;23:688–93. doi: 10.1038/sj.eye.6703101 [DOI] [PubMed] [Google Scholar]
- 35.Guo B, Lu P, Chen X, Zhang W, Chen R. Prevalence of dry eye disease in Mongolians at high altitude in China: the Henan eye study. Ophthalmic Epidemiol. 2010;17:234–41. doi: 10.3109/09286586.2010.498659 [DOI] [PubMed] [Google Scholar]
- 36.Kim KW, Han SB, Han ER, Woo SJ, Lee JJ, Yoon JC, et al. Association between depression and dry eye disease in an elderly population. Invest Ophthalmol Vis Sci. 2011;52: 7954–8. doi: 10.1167/iovs.11-8050 [DOI] [PubMed] [Google Scholar]
- 37.Uchino M, Nishiwaki Y, Michikawa T, Shirakawa K, Kuwahara E, Yamada M, et al. Prevalence and risk factors of dry eye disease in Japan: Koumi study. Ophthalmology. 2011; 118:2361–7. doi: 10.1016/j.ophtha.2011.05.029 [DOI] [PubMed] [Google Scholar]
- 38.Galor A, Feuer W, Lee DJ, Florez H, Carter D, Pouyeh B, et al. Prevalence and risk factors of dry eye syndrome in a United States veterans affairs population. Am J Ophthalmol. 2011;152:377–384.e2. doi: 10.1016/j.ajo.2011.02.026 [DOI] [PMC free article] [PubMed] [Google Scholar]
- 39.Zhang Y, Chen H, Wu X. Prevalence and risk factors associated with dry eye syndrome among senior high school students in a county of Shandong Province, China. Ophthalmic Epidemiol. 2012;19:226–30. doi: 10.3109/09286586.2012.670742 [DOI] [PubMed] [Google Scholar]
- 40.Wang TJ, Wang IJ, Hu CC, Lin HC. Comorbidities of dry eye disease: a nationwide population-based study. Acta Ophthalmol. 2012;90:663–8. doi: 10.1111/j.1755-3768.2010.01993.x [DOI] [PubMed] [Google Scholar]
- 41.Uchino M, Yokoi N, Uchino Y, Dogru M, Kawashima M, Komuro A, et al. Prevalence of dry eye disease and its risk factors in visual display terminal users: the Osaka study. Am J Ophthalmol. 2013;156:759–66. doi: 10.1016/j.ajo.2013.05.040 [DOI] [PubMed] [Google Scholar]
- 42.Vehof J, Kozareva D, Hysi PG, Hammond CJ. Prevalence and risk factors of dry eye disease in a British female cohort. Br J Ophthalmol. 2014;98:1712–7. doi: 10.1136/bjophthalmol-2014-305201 [DOI] [PubMed] [Google Scholar]
- 43.Ahn JM, Lee SH, Rim TH, Park RJ, Yang HS, Kim TI, et al. Prevalence of and risk factors associated with dry eye: the Korea National Health and Nutrition Examination Survey 2010–2011. Am J Ophthalmol. 2014;158:1205–1214.e7. doi: 10.1016/j.ajo.2014.08.021 [DOI] [PubMed] [Google Scholar]
- 44.Moon JH, Lee MY, Moon NJ. Association between video display terminal use and dry eye disease in school children. J Pediatr Ophthalmol Strabismus. 2014;51:87–92. doi: 10.3928/01913913-20140128-01 [DOI] [PubMed] [Google Scholar]
- 45.Paulsen AJ, Cruickshanks KJ, Fischer ME, Huang GH, Klein BE, Klein R, et al. Dry eye in the beaver dam offspring study: prevalence, risk factors, and health-related quality of life. Am J Ophthalmol. 2014;157:799–806. doi: 10.1016/j.ajo.2013.12.023 [DOI] [PMC free article] [PubMed] [Google Scholar]
- 46.Chen HY, Lin CL, Tsai YY, Kao CH. Association between Glaucoma Medication Usage and Dry Eye in Taiwan. Optom Vis Sci. 2015;92:e227–32. doi: 10.1097/OPX.0000000000000667 [DOI] [PubMed] [Google Scholar]
- 47.Yang WJ, Yang YN, Cao J, Man ZH, Yuan J, Xiao X, et al. Risk Factors for Dry Eye Syndrome: A Retrospective Case-Control Study. Optom Vis Sci. 2015;92:e199–205. doi: 10.1097/OPX.0000000000000541 [DOI] [PubMed] [Google Scholar]
- 48.Tan LL, Morgan P, Cai ZQ, Straughan RA. Prevalence of and risk factors for symptomatic dry eye disease in Singapore. Clin Exp Optom. 2015;98:45–53. doi: 10.1111/cxo.12210 [DOI] [PubMed] [Google Scholar]
- 49.Shah S, Jani H. Prevalence and associated factors of dry eye: Our experience in patients above 40 years of age at a Tertiary Care Center. Oman J Ophthalmol. 2015;8: 151–6. doi: 10.4103/0974-620X.169910 [DOI] [PMC free article] [PubMed] [Google Scholar]
- 50.Olaniyan SI, Fasina O, Bekibele CO, Ogundipe AO. Dry eye disease in an adult population in South-West Nigeria. Cont Lens Anterior Eye. 2016;39:359–64. doi: 10.1016/j.clae.2016.06.008 [DOI] [PubMed] [Google Scholar]
- 51.Alshamrani AA, Almousa AS, Almulhim AA, Alafaleq AA, Alosaimi MB, Alqahtani AM, et al. Prevalence and Risk Factors of Dry Eye Symptoms in a Saudi Arabian Population. Middle East Afr J Ophthalmol. 2017;24:67–73. doi: 10.4103/meajo.MEAJO_281_16 [DOI] [PMC free article] [PubMed] [Google Scholar]
- 52.Farrand KF, Fridman M, Stillman IÖ, Schaumberg DA. Prevalence of Diagnosed Dry Eye Disease in the United States Among Adults Aged 18 Years and Older. Am J Ophthalmol. 2017;182:90–98. doi: 10.1016/j.ajo.2017.06.033 [DOI] [PubMed] [Google Scholar]
- 53.Man REK, Veerappan AR, Tan SP, Fenwick EK, Sabanayagam C, Chua J, et al. Incidence and risk factors of symptomatic dry eye disease in Asian Malays from the Singapore Malay Eye Study. Ocul Surf. 2017;15:742–748. doi: 10.1016/j.jtos.2017.04.004 [DOI] [PubMed] [Google Scholar]
- 54.Gong YY, Zhang F, Zhou J, Li J, Zhang GH, Wang JL, et al. Prevalence of Dry Eye in Uyghur and Han Ethnic Groups in Western China. Ophthalmic Epidemiol. 2017;24:181–187. doi: 10.1080/09286586.2016.1263996 [DOI] [PubMed] [Google Scholar]
- 55.Graue-Hernández EO, Serna-Ojeda JC, Estrada-Reyes C, Navas A, Arrieta-Camacho J, Jiménez-Corona A. Dry eye symptoms and associated risk factors among adults aged 50 or more years in Central Mexico. Salud Publica Mex. 2018;60:520–527. doi: 10.21149/9024 [DOI] [PubMed] [Google Scholar]
- 56.Millán A, Viso E, Gude F, Parafita-Fernández A, Moraña N, Rodríguez-Ares MT. Incidence and Risk Factors of Dry Eye in a Spanish Adult Population: 11-Year Follow-Up From the Salnés Eye Study. Cornea. 2018;37:1527–1534. doi: 10.1097/ICO.0000000000001713 [DOI] [PubMed] [Google Scholar]
- 57.Iglesias E, Sajnani R, Levitt RC, Sarantopoulos CD, Galor A. Epidemiology of Persistent Dry Eye-Like Symptoms After Cataract Surgery. Cornea. 2018;37:893–898. doi: 10.1097/ICO.0000000000001491 [DOI] [PMC free article] [PubMed] [Google Scholar]
- 58.Ferrero A, Alassane S, Binquet C, Bretillon L, Acar N, Arnould L, et al. Dry eye disease in the elderly in a French population-based study (the Montrachet study: Maculopathy, Optic Nerve, nuTRition, neurovAsCular and HEarT diseases): Prevalence and associated factors. Ocul Surf. 2018;16:112–119. doi: 10.1016/j.jtos.2017.09.008 [DOI] [PubMed] [Google Scholar]
- 59.Shehadeh-Mashor R, Mimouni M, Shapira Y, Sela T, Munzer G, Kaiserman I. Risk Factors for Dry Eye After Refractive Surgery. Cornea. 2019;38:1495–1499. doi: 10.1097/ICO.0000000000002152 [DOI] [PubMed] [Google Scholar]
- 60.Zhang S, Hong J. Risk Factors for Dry Eye in Mainland China: A Multi-Center Cross-Sectional Hospital-Based Study. Ophthalmic Epidemiol. 2019;26:393–399. doi: 10.1080/09286586.2019.1632905 [DOI] [PubMed] [Google Scholar]
- 61.Yasir ZH, Chauhan D, Khandekar R, Souru C, Varghese S. Prevalence and Determinants of Dry Eye Disease among 40 Years and Older Population of Riyadh (Except Capital), Saudi Arabia. Middle East Afr J Ophthalmol. 2019;26:27–32. doi: 10.4103/meajo.MEAJO_194_18 [DOI] [PMC free article] [PubMed] [Google Scholar]
- 62.Arita R, Mizoguchi T, Kawashima M, Fukuoka S, Koh S, Shirakawa R, et al. Meibomian Gland Dysfunction and Dry Eye Are Similar but Different Based on a Population-Based Study: The Hirado-Takushima Study in Japan. Am J Ophthalmol. 2019;207:410–418. doi: 10.1016/j.ajo.2019.02.024 [DOI] [PubMed] [Google Scholar]
- 63.Hyon JY, Yang HK, Han SB. Association between Dry Eye Disease and Psychological Stress among Paramedical Workers in Korea. Sci Rep. 2019;9:3783. doi: 10.1038/s41598-019-40539-0 [DOI] [PMC free article] [PubMed] [Google Scholar]
- 64.Ben-Eli H, Aframian DJ, Ben-Chetrit E, Mevorach D, Kleinstern G, Paltiel O, et al. Shared Medical and Environmental Risk Factors in Dry Eye Syndrome, Sjogren’s Syndrome, and B-Cell Non-Hodgkin Lymphoma: A Case-Control Study. J Immunol Res. 2019;2019: 9060842. doi: 10.1155/2019/9060842 [DOI] [PMC free article] [PubMed] [Google Scholar]
- 65.Yu D, Deng Q, Wang J, Chang X, Wang S, Yang R, et al. Air Pollutants are associated with Dry Eye Disease in Urban Ophthalmic Outpatients: a Prevalence Study in China. J Transl Med. 2019;17:46. doi: 10.1186/s12967-019-1794-6 [DOI] [PMC free article] [PubMed] [Google Scholar]
- 66.Rossi GCM, Scudeller L, Bettio F, Pasinetti GM, Bianchi PE. Prevalence of dry eye in video display terminal users: a cross-sectional Caucasian study in Italy. Int Ophthalmol. 2019; 39:1315–1322. doi: 10.1007/s10792-018-0947-6 [DOI] [PubMed] [Google Scholar]
- 67.Wang MTM, Vidal-Rohr M, Muntz A, Diprose WK, Ormonde SE, Wolffsohn JS, et al. Systemic risk factors of dry eye disease subtypes: A New Zealand cross-sectional study. Ocul Surf. 2020;18:374–380. doi: 10.1016/j.jtos.2020.04.003 [DOI] [PubMed] [Google Scholar]
- 68.Shanti Y, Shehada R, Bakkar MM, Qaddumi J. Prevalence and associated risk factors of dry eye disease in 16 northern West bank towns in Palestine: a cross-sectional study. BMC Ophthalmol. 2020;20:26. doi: 10.1186/s12886-019-1290-z [DOI] [PMC free article] [PubMed] [Google Scholar]
- 69.Hanyuda A, Sawada N, Uchino M, Kawashima M, Yuki K, Tsubota K, et al. Physical inactivity, prolonged sedentary behaviors, and use of visual display terminals as potential risk factors for dry eye disease: JPHC-NEXT study. Ocul Surf. 2020;18:56–63. doi: 10.1016/j.jtos.2019.09.007 [DOI] [PubMed] [Google Scholar]
- 70.Alkabbani S, Jeyaseelan L, Rao AP, Thakur SP, Warhekar PT. The prevalence, severity, and risk factors for dry eye disease in Dubai—a cross sectional study. BMC Ophthalmol. 2021;21:219. doi: 10.1186/s12886-021-01978-4 [DOI] [PMC free article] [PubMed] [Google Scholar]
- 71.Vehof J, Snieder H, Jansonius N, Hammond CJ. Prevalence and risk factors of dry eye in 79,866 participants of the population-based Lifelines cohort study in the Netherlands. Ocul Surf. 2021;19:83–93. doi: 10.1016/j.jtos.2020.04.005 [DOI] [PubMed] [Google Scholar]
- 72.Moss SE, Klein R, Klein BE. Incidence of dry eye in an older population. Arch Ophthalmol. 2004;122:369–73. doi: 10.1001/archopht.122.3.369 [DOI] [PubMed] [Google Scholar]
- 73.Gilbard JP. Human tear film electrolyte concentrations in health and dry-eye disease. Int Ophthalmol Clin. 1994;34:27–36. doi: 10.1097/00004397-199403410-00005 [DOI] [PubMed] [Google Scholar]
- 74.Cardona G, García C, Serés C, Vilaseca M, Gispets J. Blink rate, blink amplitude, and tear film integrity during dynamic visual display terminal tasks. Curr Eye Res. 2011;36: 190–7. doi: 10.3109/02713683.2010.544442 [DOI] [PubMed] [Google Scholar]
- 75.Li XM, Hu L, Hu J, Wang W. Investigation of dry eye disease and analysis of the pathogenic factors in patients after cataract surgery. Cornea. 2007;26:S16–20. doi: 10.1097/ICO.0b013e31812f67ca [DOI] [PubMed] [Google Scholar]
- 76.Begley CG, Caffery B, Nichols KK, Chalmers R. Responses of contact lens wearers to a dry eye survey. Optom Vis Sci. 2000;77:40–6. doi: 10.1097/00006324-200001000-00012 [DOI] [PubMed] [Google Scholar]
- 77.Petraevskiĭ AV, Trishkin KS. [Pathogenetic relationship between pterygium and dry eye syndrome (clinical and cytological study)]. Vestn Oftalmol. 2014;130:52–6. Russian. [PubMed] [Google Scholar]
- 78.Bulat N, Cuşnir VV, Procopciuc V, Cușnir V, Cuşnir NV. Diagnosing the Dry Eye Syndrome in modern society and among patients with glaucoma: a prospective study. Rom J Ophthalmol. 2020;64:35–42. [PMC free article] [PubMed] [Google Scholar]
- 79.Samoilă O, Stan C, Vişan O, Crăciun A, Dican L, Mera M. Influenţa intervenţiilor chirurgicale pe gldb deschis asupra secreţiei lacrimale [The influence of ocular surgery for lacrimal secretion]. Oftalmologia. 2007;51:81–5. Romanian. [PubMed] [Google Scholar]
- 80.Galor A, Feuer W, Lee DJ, Florez H, Faler AL, Zann KL, et al. Depression, post-traumatic stress disorder, and dry eye syndrome: a study utilizing the national United States Veterans Affairs administrative database. Am J Ophthalmol. 2012;154:340–346.e2. doi: 10.1016/j.ajo.2012.02.009 [DOI] [PubMed] [Google Scholar]
- 81.Ong ES, Alghamdi YA, Levitt RC, McClellan AL, Lewis G, Sarantopoulos CD, et al. Longitudinal Examination of Frequency of and Risk Factors for Severe Dry Eye Symptoms in US Veterans. JAMA Ophthalmol. 2017;135:116–123. doi: 10.1001/jamaophthalmol.2016.4925 [DOI] [PubMed] [Google Scholar]
- 82.Bielory L. Ocular toxicity of systemic asthma and allergy treatments. Curr Allergy Asthma Rep. 2006;6:299–305. doi: 10.1007/s11882-006-0063-y [DOI] [PubMed] [Google Scholar]
- 83.Tang YL, Cheng YL, Ren YP, Yu XN, Shentu XC. Metabolic syndrome risk factors and dry eye syndrome: a Meta-analysis. Int J Ophthalmol. 2016;9:1038–45. doi: 10.18240/ijo.2016.07.17 [DOI] [PMC free article] [PubMed] [Google Scholar]
- 84.Xu L, You QS, Jonas JB. Prevalence of alcohol consumption and risk of ocular diseases in a general population: the Beijing Eye Study. Ophthalmology. 2009;116:1872–9. doi: 10.1016/j.ophtha.2009.04.014 [DOI] [PubMed] [Google Scholar]
- 85.Woo YR, Cho M, Ju HJ, Bae JM, Cho SH, Lee JD, et al. Ocular Comorbidities in Rosacea: A Case-Control Study Based on Seven Institutions. J Clin Med. 2021;10:2897. doi: 10.3390/jcm10132897 [DOI] [PMC free article] [PubMed] [Google Scholar]
- 86.Eckstein AK, Finkenrath A, Heiligenhaus A, Renzing-Köhler K, Esser J, Krüger C, et al. Dry eye syndrome in thyroid-associated ophthalmopathy: lacrimal expression of TSH receptor suggests involvement of TSHR-specific autoantibodies. Acta Ophthalmol Scand. 2004;82:291–7. doi: 10.1111/j.1395-3907.2004.00268.x [DOI] [PubMed] [Google Scholar]
- 87.Sharon Y, Schlesinger N. Beyond Joints: a Review of Ocular Abnormalities in Gout and Hyperuricemia. Curr Rheumatol Rep. 2016;18:37. doi: 10.1007/s11926-016-0586-8 [DOI] [PubMed] [Google Scholar]
- 88.Koktekir BE, Celik G, Karalezli A, Kal A. Dry eyes and migraines: is there really a correlation? Cornea. 2012;31:1414–6. doi: 10.1097/ICO.0b013e318247ec2a [DOI] [PubMed] [Google Scholar]
- 89.Jeng YT, Lin SY, Hu HY, Lee OK, Kuo LL. Osteoporosis and dry eye syndrome: A previously unappreciated association that may alert active prevention of fall. PLoS One. 2018; 13:e0207008. doi: 10.1371/journal.pone.0207008 [DOI] [PMC free article] [PubMed] [Google Scholar]
- 90.Goulden V, Layton AM, Cunliffe WJ. Long-term safety of isotretinoin as a treatment for acne vulgaris. Br J Dermatol. 1994;131:360–3. doi: 10.1111/j.1365-2133.1994.tb08524.x [DOI] [PubMed] [Google Scholar]
- 91.Klocek P, Klocek M, Jeśman C. [Assessment of the incidence of dry eye syndrome symptoms in Military Police soldiers serving outside the country]. Pol Merkur Lekarski. 2020; 48:82–86. [PubMed] [Google Scholar]
- 92.Youn JS, Seo JW, Park W, Park S, Jeon KJ. Prediction Model for Dry Eye Syndrome Incidence Rate Using Air Pollutants and Meteorological Factors in South Korea: Analysis of Sub-Region Deviations. Int J Environ Res Public Health. 2020;17:4969. doi: 10.3390/ijerph17144969 [DOI] [PMC free article] [PubMed] [Google Scholar]