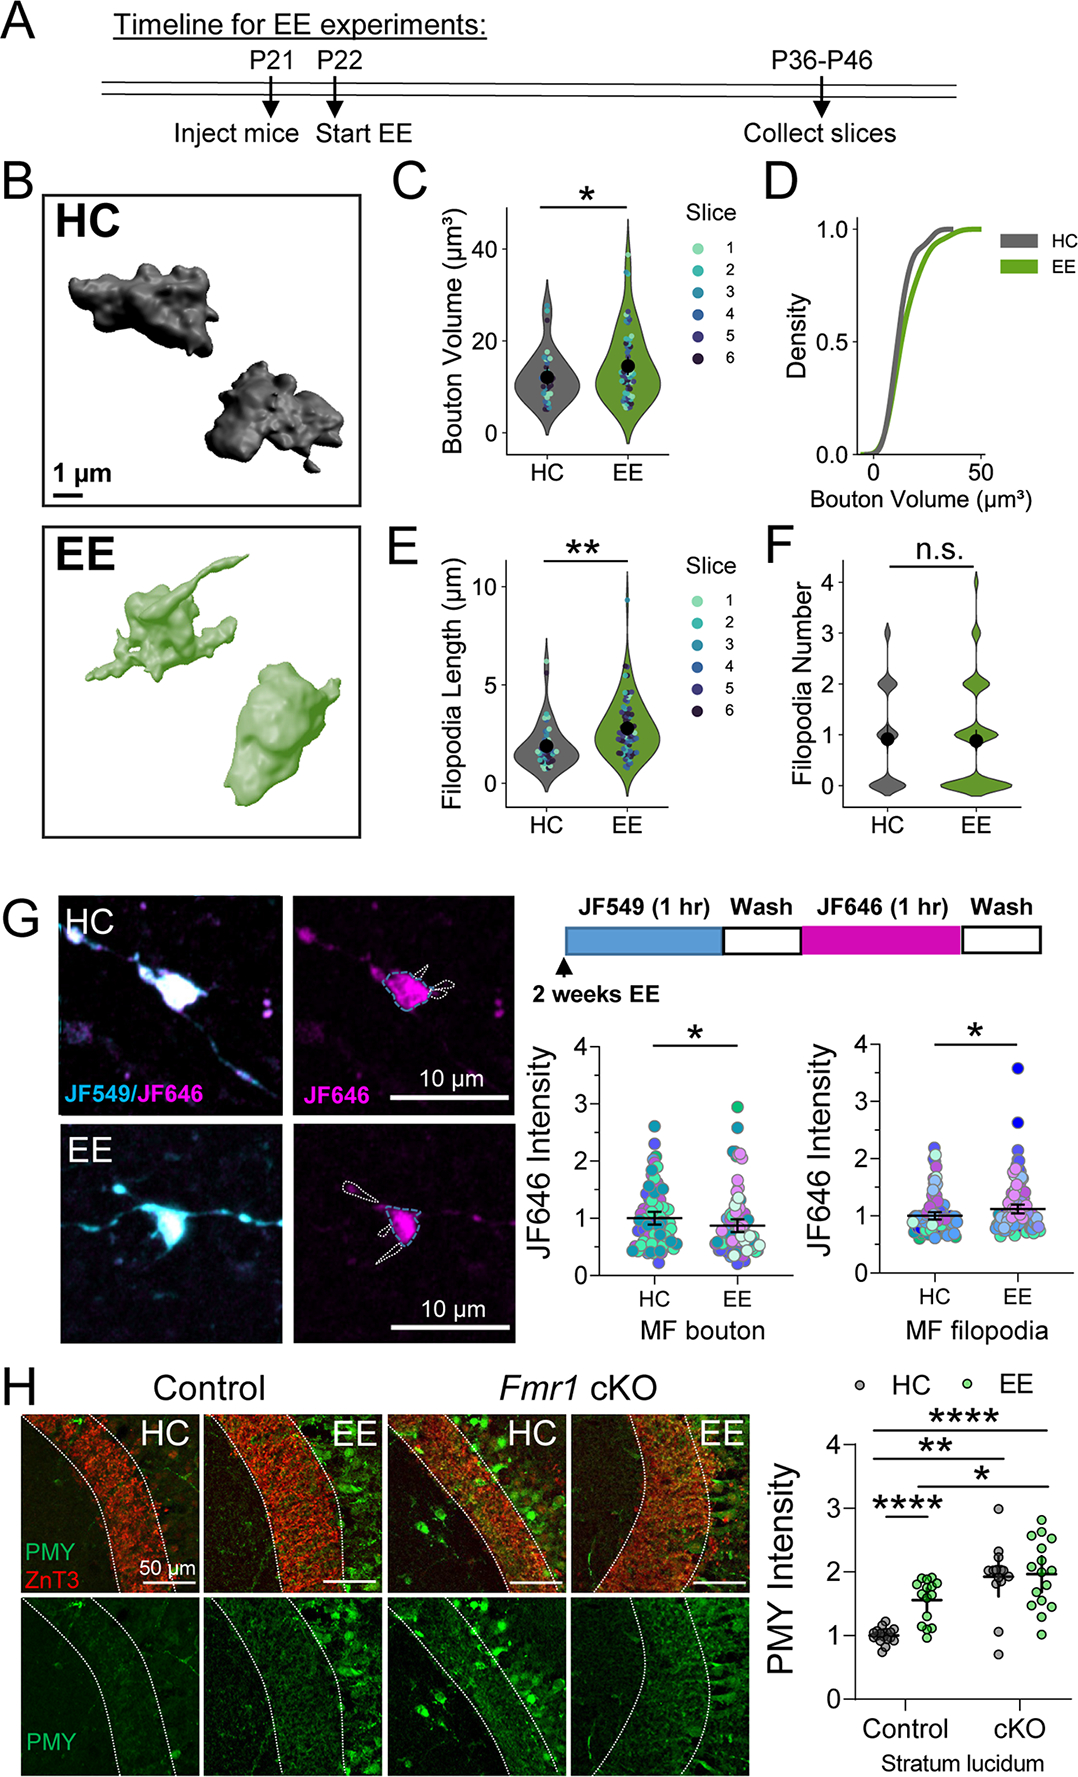
Figure 8. Enriched environment alters structural properties and local protein synthesis of MFs.

A. Representative 3D reconstructions of giant MF boutons.
B. Quantification of MF bouton volume from 3D reconstructions reveals EE changed the overall volume of MF boutons. HC: 12.24 ± 0.66 v. EE: 15.16 ± 1.12 (Mean ± S.E.M. of slices); Two sample t-test, p = 0.04; n = 97, 158 boutons respectively, 6 slices, 5 animals. For all Superplots in this figure, individual points representing boutons are color-coded by slice. Large black circle and bar represent the mean ± 95 % confidence interval of boutons.
C. EE did not alter the distribution of MF bouton volume. KS test, Z = 0.67, p = 0.79
D. EE significantly changes the length of filopodia. HC: 1.75 ± 0.11 v. EE: 2.95 ± 0.29 (Mean ± S.E.M. of slices); Two sample t-test, p = 0.002; n = 42, 80 filopodia, 7, 6 slices respectively, 5 animals.
E. EE had no effect on the number of filopodia/bouton. HC: 0.85 ± 0.14 v. EE: 0.88 ± 0.08; Mann Whitney, p =0.42; n = 47, 92 filopodia, 7, 6 slices respectively, 5 animals.
F. (Left) Representative images of MF boutons expressing Halo-actin virus from mice in HC or 2 weeks EE. (Right, top) Timeline of Halo-actin pulse-chase labeling. (Bottom, right) Halo-actin signal measured in MF boutons was reduced in EE mice compared to HC controls. HC: 1.00 ± 0.10 v. EE: 0.77 ± 0.05 (Mean ± S.E.M. of slices); Two sample t-test, p = 0.04. (Bottom right) Halo-actin signal measured in filopodia of MF boutons was increased in EE mice. HC: 1.00 ± 0.05 v. EE: 1.22 ± 0.08; Mann Whitney, U = 24, p = 0.030. n = 81, 91 boutons/ 100,121 filopodia, 10,11 slices respectively, 5 animals. Points representing individual boutons are normalized to mean of Control.
G. Enriched environment did not occlude increased puromycin labeling (PMY) of newly synthesized proteins in MFs of presynaptic cKO of Fmr1 mice. WT HC: 1.00 ± 0.03 v. Fmr1 cKO HC: 1.90 ± 0.14 v WT EE: 1.56 ± 0.07 v. Fmr1 cKO EE: 1.96 ± 0.13 (Mean ± S.E.M.); Two-Way ANOVA with Tukey’s test for Multiple Comparisons, Interaction: F[1,59] = 6.312, p = 0.015. n = 18,14, 15, 16 slices respectively. Points represent individual slices and are normalized to mean of WT HC.
N = slices. See also Supp. Figure 6.
n.s. = p>0.05; *p≤0.05; **p≤0.01; ***p≤0.001; ****p≤0.0001.
