

Summary
Reactivation of fetal hemoglobin expression by down-regulation of BCL11A is a promising treatment of β-hemoglobinopathies. A detailed understanding of BCL11A-mediated repression of γ-globin gene (HBG1/2) transcription is lacking, as studies to date used perturbations by shRNA or CRISPR/Cas9 gene editing. We leveraged the dTAG PROTAC, degradation platform to acutely deplete BCL11A protein in erythroid cells, and examined consequences by nascent transcriptomics, proteomics, chromatin accessibility, and histone profiling. Among 31 genes repressed by BCL11A, HBG1/2, and HBZ show the most abundant and progressive changes in transcription and chromatin accessibility upon BCL11A loss. Transcriptional changes at HBG1/2 were detected in <2h. Robust HBG1/2 reactivation upon acute BCL11A-depletion occurred without loss of promoter 5-methylcytosine (5mC). Using targeted protein degradation, we establish a hierarchy of gene reactivation at BCL11A targets, in which nascent transcription is followed by increased chromatin accessibility, and both are uncoupled from promoter DNA methylation at the HBG1/2 loci.
Graphical abstract

eTOC blurb
Reactivation of γ-globin by downregulation of BCL11A expression is a promising strategy for the treatment of sickle cell disease. In this issue of Cell Chemical Biology, Mehta et al. (2022) employ PROTAC-mediated depletion of BCL11A to identify a small set of target genes and chart the kinetics of γ-globin induction.
Introduction
Red cells of newborns contain fetal hemoglobin (HbF, α2γ2) and are replaced during infancy by cells with adult hemoglobin (HbA, α2β2). The ‘switch’ from HbF to HbA is initiated transcriptionally in developing erythroid cells by silencing of the γ-globin (HBG1/2) genes and reciprocal activation of the β-globin gene. In adult blood, HbF accounts for ~1% of total hemoglobin. Increased expression of HbF lessens the severity of the β-hemoglobin disorders, sickle cell disease (SCD) and β-thalassemia. Reversing HbF silencing in adult cells has been at the forefront of efforts to treat β-hemoglobinopathies (Orkin, 2021).
The transcription factor BCL11A is a critical effector of the γ/β-globin switch, wherein it directly binds to and represses the promoters of the γ-globin genes (Liu et al., 2018, 2021; Martyn et al., 2018; Sankaran et al., 2008). Down-regulation of BCL11A expression by shRNA or CRISPR/Cas9 gene-editing induces therapeutic levels of γ-globin in SCD and β-thalassemia patients (Esrick et al., 2021; Frangoul et al., 2021). Despite progress in translating findings to the clinic, an understanding of the kinetics of BCL11A’s action is lacking. BCL11A loss-of-function studies have been limited to end-state analyses following genetic manipulations (Guda et al., 2015; Sankaran et al., 2008; Xu et al., 2011). The time lag inherent in examining transcriptional and proteomic consequences allows for compensatory and secondary changes that confound interpretation of primary mechanisms.
Targeted protein degradation offers the opportunity to interrogate the sequence of events that ensue following loss of a protein of interest (POI). ‘Proteolysis Targeting Chimeras’ (PROTACs), which are hetero-bifunctional molecules that recruit a POI to endogenous E3 ligases for ubiquitylation and proteasomal degradation provide an experimental strategy to achieve this goal (Toure and Crews, 2016). To target POIs lacking known ligands, tag-based approaches have been developed (Chung et al., 2015; Nabet et al., 2018; Nishimura et al., 2009). Here, we have employed the “dTAG system,” in which modified FKBP12 (FKBP12F36V) is expressed in fusion with the POI. The bifunctional ‘dTAG-47’ PROTAC, consisting of ligands specific for FKBP12F36V and the E3 Ubiquitin (Ub) ligase CUL4-DDB1-RBX1-CRBN (CRL4CRBN) substrate cereblon (CRBN) targets the fusion POI for CRBN-mediated proteolytic degradation (Huang et al., 2017; Nabet et al., 2018). We utilized the dTAG system to acutely degrade BCL11A protein in immortalized, HbA-expressing erythroid HUDEP-2 cells (Kurita et al., 2013) undergoing erythroid differentiation, and interrogated consequences on nascent transcription, chromatin accessibility, proteomics, histone modifications, and promoter DNA methylation. Our findings reveal the kinetics of transcriptional reactivation and repression upon protein degradation of BCL11A or re-expression upon PROTAC washout.
Results
Conditional degradation of BCL11A protein reactivates HBG1/2 transcription
We tested the dTAG and SMASh (small molecule assisted shutoff of protein) systems (Chung et al., 2015; Nabet et al., 2018) to deplete BCL11A protein in HUDEP-2 cells. (Canver et al., 2015; Hossain et al., 2018; Liu et al., 2021; Masuda et al., 2015). In the dTAG platform, CRBN is recruited by a PROTAC to FKBP12F36V fused to BCL11A (Figure 1a). In contrast, SMASh relies on fusion of a drug-sensitive viral protease and a protein destabilization element to the POI. FKBP12F36V or SMASh sequences linked to p2a-eGFP were introduced in-frame at the C-terminus of the BCL11A locus by nucleofection of a RiboNucleosomal Protein (RNP) mix of CRISPR-Cas9:sgRNA followed by delivery of ~1-1.6kb HDR templates by transduction of crude rAAV6/2 preparations (Mehta et al., 2022) (Figure 1b). The knock-in design generates protein fusions of full-length BCL11A-XL, the isoform implicated in γ-globin silencing (Liu et al., 2018). Levels of BCL11A and HGB1/2 in knock-in cells were comparable to those in wild-type cells (Figure 1c, S1a,b), indicating that the BCL11A protein fusions were unperturbed in expression and retained repressor function.
Figure 1: Acute and specific degradation of BCL11A-FKBPF36V, potent induction of HBG1/2, and limited effects on cell proliferation and erythroid differentiation upon dTAG-47 treatment.
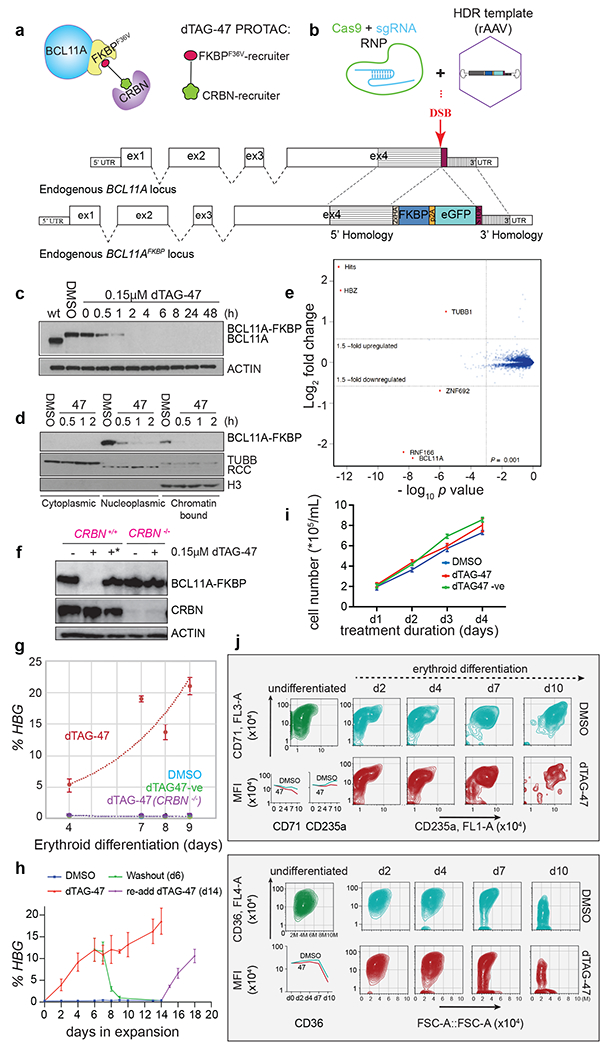
a. The dTAG-47 PROTAC recruits the CRBN E3 ligase complex to BCL11A-FKBP12F36V . b. Strategy to knock-in FKBP12F36V at the 3’ end of BCL11A. Western blot of BCL11A-FKBPF36V in c. whole BCL11AFKBP cells, and in d. cytoplasmic, nuclear, and chromatin-bound protein fractions treated with 0.15μM dTAG-47 or DMSO for indicated times. e. Volcano plot of differentially expressed proteins (moderated t-test, p-value <0.001) in BCL11AFKBP cells treated with 0.1μM dTAG-47 vs. DMSO for 6h. f. Western blot of BCL11A-FKBPF36V in BCL11AFKBP ; CRBN−/− cells treated with 0.15μM dTAG-47 or DMSO, and in BCL11AFKBP cells treated with 0.15μM dTAG-47 or dTAG-47-NEG(*) for 6h. g. RT-qPCR quantification of HBG1/2 from BCL11AFKBP cells treated with 0.15μM dTAG-47, dTAG-47-NEG(*), or DMSO for 6h, and from BCL11AFKBP ; CRBN−/− cells treated with 0.15μM dTAG-47 or DMSO at days 4-9 of erythroid differentiation. 2-3 clones per genotype, error bars = S.D. %HBG=100* [HBG/(HBG+HBB)]. HPRT is endogenous control. h. RT-qPCR quantification of HBG1/2 over the course of treatment of BCL11AFKBP cells with DMSO, or 0.15μM dTAG-47, and washout of dTAG-47 after 6d treatment, followed by re-addition of 0.15μM, dTAG-47 in expansion conditions, error bars = S.D. i. The proliferation of BCl11AFKBP/FKBP cells treated with 0.15μM dTAG-47 or DMSO over 4 days in expansion phase j. Flow-cytometry of cell surface CD71, CD235a, and CD36 in differentiating BCl11AFKBP/FKBP cells treated with 0.15μM dTAG-47 or DMSO. Inset, MFI quantification DSB=double-strand break; rAAV= recombinant AAV, sgRNA=guide RNA, MFI=Mean fluorescence Intensity. See also Figure S1.
Treatment of BCL11AFKBPF36V/FKBF36V (abbreviated as BCL11AFKBP) cells with 0.15μM dTAG-47 resulted in marked degradation of BCL11A within 2h (Figure 1c). Cellular fractionation and Western blotting revealed that BCL11A was found in the nucleoplasm and chromatin, and degraded by 2h with drug (Figure 1d). Treatment over a range of dTAG-47 concentrations elicited the ‘hook-effect’, characteristic of PROTAC molecules (Moreau et al., 2020) (Fig S1c). To assess the specificity of dTAG-47 and initial consequences of BCL11A-FKBP12F36V degradation, we performed multiplexed quantitative mass spectrometry-based proteomics of cells treated for 6h with dTAG-47 or DMSO. 8,164 proteins were quantified. Two peptides unique to BCL11A-FKBP12F36V (K.ASNPVEVGIQVTPEDDDCLSTSSR.G; R.FSTPPGELDGGISGR.S) were used for quantification of BCL11A-FKBP12F36V. Of all proteins analyzed, BCL11A exhibited the largest reduction in relative abundance, followed by two off-targets of pomalidomide, RNF166, and ZNF692, with no known roles in globin regulation (Figure 1e) (Donovan et al., 2018). We also observed relative upregulation of HBZ and TUBB1, direct targets of BCL11A, as determined from chromatin occupancy (Liu et al., 2018), and data presented here. Thus, treatment with dTAG-47 induces highly significant and selective depletion of BCL11A-FKBPF36V in HUDEP-2 cells.
In contrast, we observed that depletion of BCL11A with the SMASh system following addition of Asunaprevir (ASV) occurred after more prolonged treatment and led to a modest reduction in protein abundance (Figure S1d,e). These findings are consistent with the observation that only newly synthesized SMASh-fusion protein is degraded (Chung et al., 2015). Given the acute and profound depletion of BCL11A protein with the dTAG platform compared with SMASh, further studies were limited to the dTAG system.
We confirmed that degradation of BCL11A-FKBP12F36V was mediated through recruitment to CRBN. In CRISPR/Cas9 generated CRBN knockout clones of parental BCL11AFKBP cells, BCL11A was not degraded upon addition of dTAG-47 (Figure 1f). Likewise, treatment of BCL11AFKBP cells with dTAG-47-NEG, a molecule unable to recruit CRBN (Nabet et al., 2020), failed to elicit degradation (Figure 1f). Whereas BCL11AFKBP cells treated with dTAG-47 showed a progressive increase in expression of target HBG1/2 transcripts upon differentiation (Figure 1 g), BCL11AFKBP /CRBN−/− cells treated with dTAG-47, as well as BCL11AFKBP cells treated with dTAG-47-NEG, failed to derepress HBG1/2 (Figure 1g). Moreover, addition of dTAG-47 to BCL11AFKBP cells, followed by washout of the drug, acted as a toggle switch for de-repression and re-repression of HBG1/2 (Figure 1h). Taken together, BCL11A-FKBP12F36V was acutely and specifically degraded by recruitment of CRBN and led to the anticipated de-repression of HBG1/2.
We next assessed the effects of BCL11A loss on the growth and differentiation of HUDEP-2 cells. Cell proliferation was minimally perturbed following depletion of BCL11A (Figure 1i). Differentiation of BCL11A-depleted HUDEP-2 cells, as assessed by flow cytometric analyses of surface markers (CD71, CD235a, and CD36), was comparable to that of parental cells (Figure 1j).
Bcl11aFKBP/FKBP mice phenocopy knockout mice
With the aim of examining BCL11A loss in tissues of an animal, we knocked in FKBP12F36V at the C-terminus of Bcl11a. Bcl11aFKBP/FKBP mice were born at lower frequencies compared to expected Mendelian ratios [χ2(2, N=134) = 12.672, p = 0.002], and all live-born homozygous pups died soon after birth (Figure 2a, S1f). This phenotype is reminiscent of Bcl11a knockout mice, and unexpected if Bcl11a-FKBPF36V protein exhibited a normal half-life. We observed that Bcl11a-FKBPF36V protein was detected at substantially lower levels compared to unmodified Bcl11a protein in 11.5dpc embryos (Figure 2b). By comparison, wild-type and Bcl11a-FKBPF36V bands were less skewed in Bcl11aFKBP/+ MEL (Mouse Erythroleukemia) cells, validating detection of both forms of Bcl11a by Western blot (Figure 2b). Consistent with the reduced level of Bcl11a-FKBPF36V, fetal liver cells of 14.5dpc Bcl11aFKBP/FKBP mice revealed impaired repression of embryonic globins, unlike Bcl11aFKBP/+ and wild-type littermates (Figure 2c).
Figure 2. Bcl11aFKBP/FKBP mice show postnatal lethality due to reduced abundance of Bcl11a-FKBPF36V.
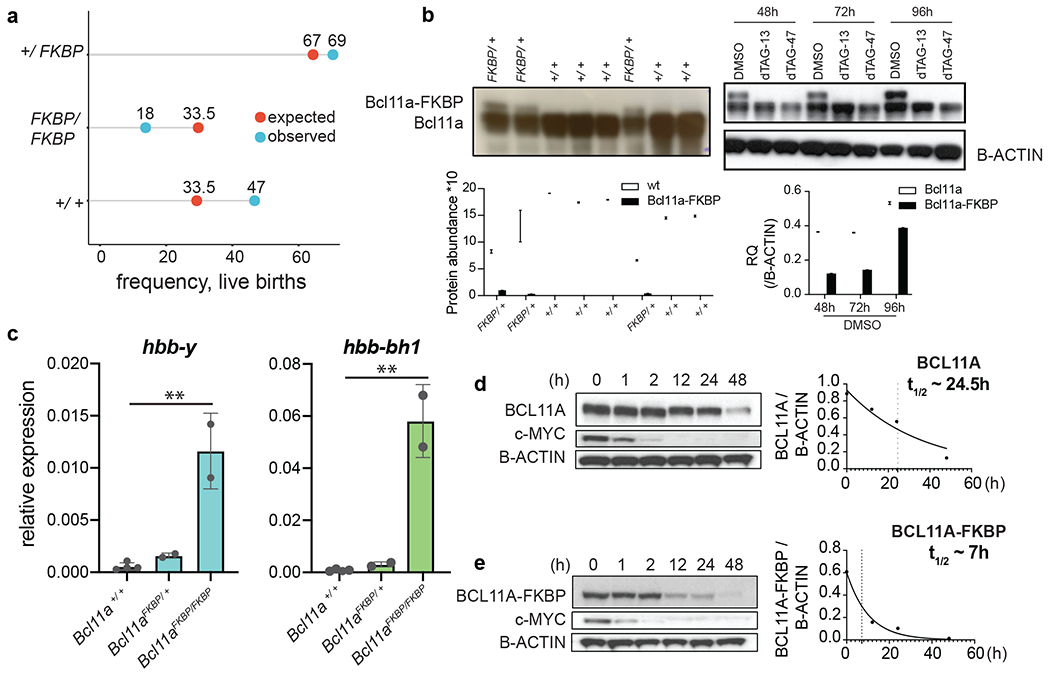
a. Expected vs observed ratio of progeny with genotypes Bcl11a+/+, Bcl11aFKBP/+, and Bcl11aFKBP/FKBP from a Bcl11aFKBP/+ x Bcl11aFKBP/+ cross. Textured bar indicates dead progeny. b. Left: Western blot of Bcl11a-FKBPF36V in Bcl11aFKBP/+ and Bcl11a+/+ 11.5dpc embryos. Right: Western blot of Bcl11a-FKBPF36V in Bcl11aFKBP/+ and Bcl11a+/+ MEL cells treated with dTAG-13, dTAG-47 or DMSO for indicated durations. c. Relative quantification of hbb-y and hbb-hb1 transcripts in 14.5dpc fetal livers of Bcl11aFKBP/+ and Bcl11a+/+ embryos by RT-qPCR. Gapdh is endogenous control. Error bars = S.D. Western blot of d. BCL11A and e. BCL11A-FKBPF36V in BCL11AFKBP cells treated with 5μM cycloheximide for indicated times (n=2). Right, quantified BCL11A and BCL11A-FKBPF36V abundance in the cycloheximide chase assay to determine protein half-life (t1/2). See also Figure S1.
To interrogate how modification of BCL11A protein with FKBPF36V influenced protein stability, we performed cycloheximide chase experiments in HUDEP-2 cells to measure protein half-lives. Whereas BCL11A is a stable protein (t1/2~24.5 h), we observed that BCL11A-FKBPF36V exhibited a t1/2~7h (n=2, Figure 2d,e, S1f). We surmise that a reduced half-life accounts for accelerated loss of the fusion protein in Bcl11aFKBP mice, phenocopying the knockout (Liu, 2003).
Chromatin accessibility closely follows transcription of HBG1/2 upon BCL11A degradation
To interrogate the kinetics of de-repression of HBG1/2, we employed Precision nuclear Run-On sequencing (PRO-seq) and assayed nascent transcription following acute depletion of BCL11A (Mahat et al., 2016). PRO-seq maps the position of RNA Polymerase II at base-pair resolution across the genome, providing quantifiable snapshots of nascent transcription at target loci. We performed PRO-seq in two independent BCL11AFKBP clones at successive times (3h to d5) following addition of dTAG-47 or DMSO. Nascent transcription was induced at the HBG1/2 loci by 3h, progressively increasing thereafter (Figure 3a,c). Chromatin accessibility, as assessed by ATAC-seq, was unchanged at 4 or 24h of dTAG-47 treatment, but increased at d2 and later (Figure 3b,c). Thus, while nascent transcription rapidly initiated at the HBG1/2 locus upon BCL11A-depletion, an increase in chromatin accessibility was detected after a brief lag.
Figure 3. Rapid changes in nascent transcription followed by a delayed change in promoter accessibility at HBG1/2 locus upon acute depletion and restoration of BCL11A.
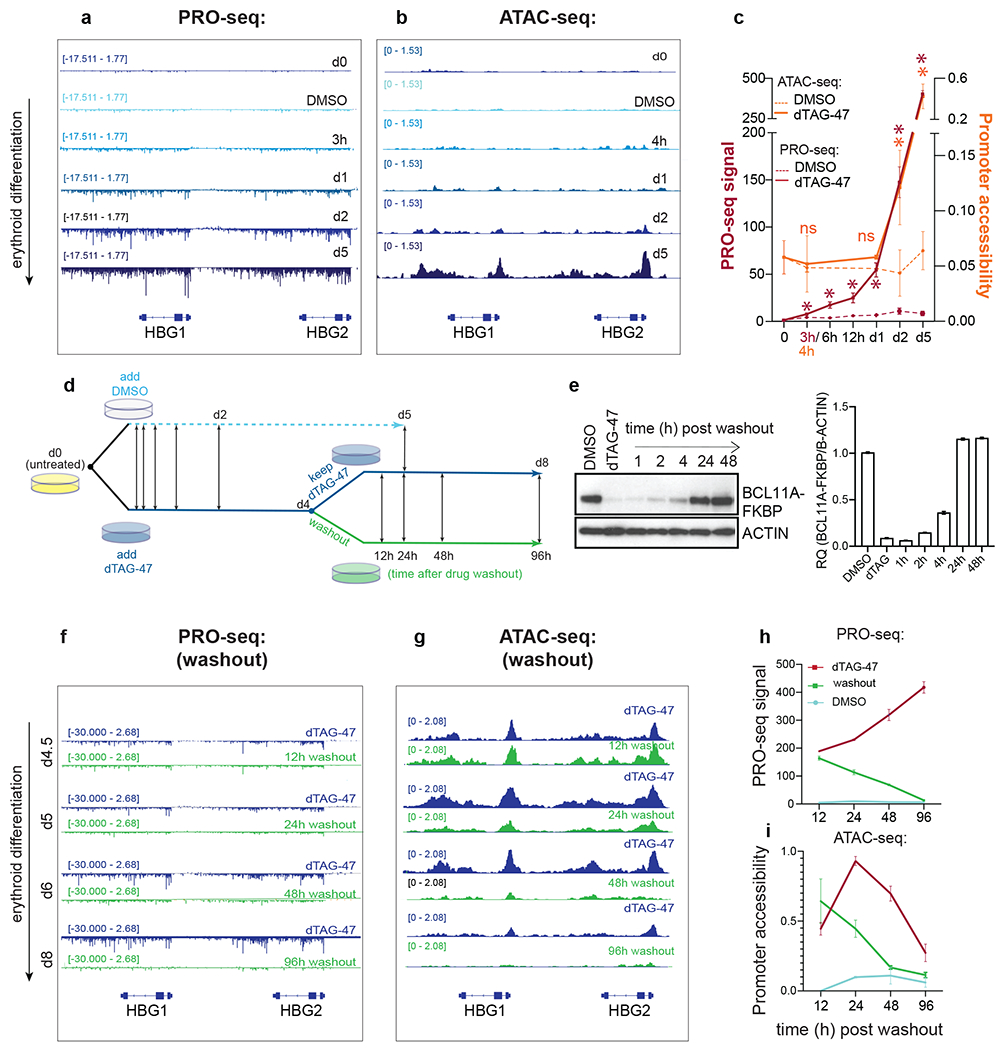
a. PRO-seq tracks of nascent transcription at the HBG1/2 loci in untreated (d0), or 3h, d1, d2 and d5 - DMSO or dTAG-47-treated BCL11AFKBP cells. b. ATAC-seq tracks of chromatin-accessibility at the HBG1/2 loci at the same times. c. Quantified PRO-seq signals at HBG1/2 genes (top), and ATAC-seq signals at HBG1/2 promoters (TSS+/−500bp) at inducated times. *,p < 0.05, DESeq2. Error bars=S.D. d. Schematic of the course of drug treatment and washout. Double-sided arrows indicate sampling for PRO/ATAC-seq at given times. e. Left: Western blot of BCL11A-FKBPF36V in BCL11AF36 cells upon DMSO or dTAG-47 treatment for 4 days, followed by washout of dTAG-47 at various times in differentiating BCL11AFKBP cells. Right: Relative Quantification (RQ) of BCL11A-FKBP with respect to β-ACTIN control, mean +/− s.e.m. f. PRO-seq tracks of nascent transcription at the HBG1/2 loci in BCL11AF36cells treated with dTAG-47 for 4d, and washed off the drug at various times g. ATAC-seq tracks of chromatin-accessibility at the HBG1/2 loci in dTAG-47-treated BCL11AF36 cells washed of the drug at the same times. Quantification of h. PRO-seq signals at HBG1/2 genes (top), and i. ATAC-seq signals at HBG1/2 promoter regions (TSS+/− 500bp, bottom) at various times. n=2, error bars = S.D. See also Figure S2.
We performed drug washout experiments to determine the kinetics of repression of the active HBG1/2 locus by BCL11A (Figure 3d). At four days of treatment, cells were switched to media lacking dTAG-47 to restore BCL11A levels. BCL11A protein was detected within 2 hours and reached the control level within 24h (Figure 3e). By 12h, we observed fewer nascent HBG1/2 transcripts compared to dTAG-47 treated samples, progressively decreasing as the level of BCL11A protein returned to normal (Figure 3f,h). Chromatin accessibility was reduced at 24h and comparable to the control level within 48h of washout (Figure 3g,i). Taken together, these data reveal that a progressive transcriptional response is elicited at the HBG1/2 locus rapidly following BCL11A modulation. Changes in chromatin accessibility are detected afterwards.
BCL11A functions as a repressor at a small set of primary target genes in erythroid cells.
PROTAC-mediated protein depletion affords the opportunity to interrogate the effects of BCL11A loss on a global scale. Thus, primary targets of transcriptional repression by BCL11A may be more accurately determined than through steady-state analyses. BCL11A is undetectable within 2h post dTAG-47 addition. At 3h, significant changes in nascent transcription were detected in 58 genes (FDR<5%, Figure 4a,b, Fig S2a) with 56/58 genes showing increased expression (Figure 4a). A fold change cut-off was not applied to this analysis since a small but sustained increase in nascent transcription could lead to a substantial accumulation of mature RNA (and/or protein). A majority of the genes upregulated at 3h continued to be de-repressed at later times, and nearly 80%, i.e., 44/56 upregulated genes, contained the BCL11A recognition motif (TGA/TCCA/T) in their promoter (TSS +/− 2kb) as compared to a background discovery of 35% (p = 7.4e-11, Fisher exact test, two-sided, Figure 4c). Twenty-two of the 44 genes (50%) had the preferred motif, TGACCA. Neither of the two downregulated genes contained a BCL11A motif. Thus, BCL11A functions solely as a repressor in erythroid cells.
Figure 4. BCL11A represses a small set of 31 genes in erythroid cells.

a. Scatter plot of differential nascent transcription (DE) in BCL11AFKBP cells upon 3h treatment with dTAG-47 vs. DMSO. Red/Blue dots represent genes with significant up-/down-regulation in the dTAG-47-treated samples at FDR<5%, respectively. b. Metagene of nascent transcription at the 56 upregulated genes (FDR<5%) upon 3h dTAG-47 (red) or DMSO (blue) treatment. For comparison, a background of 370 random non-primary genes. c. Circular bar graph of enrichment of BCL11A motifs in 3h DE genes over the whole genome background (p = 7.4e-11, Fisher exact test, two-sided). d. Heatmap of Log2 fold change (FC) in nascent transcription of 3h DE genes at various time points following dTAG-47 treatment vs DMSO (left panels), and after washout of dTAG-47 (vs dTAG-47 treatment, right panels). Hierarchical clustering of genes with average Euclidean distance is shown. e. Heatmap of Log2 fold change in promoter chromatin accessibility (ATAC-seq) (TSS +/− 500bp) of 3h DE genes between dTAG-47 vs DMSO (left panels), and upon washout of dTAG-47 (washout vs. dTAG-47 , right panels), at various times. f. Violin plots of number of BCL11A motif instances per kb of gene length. Mann Whitney U, two-sided test. *p<0.05, **p<0.01. g. Metagene of BCL11A-enrichment at promoter regions of the 31 primary targets of BCL11A. h. Fold change induction in nascent transcription (dTAG-47 vs. DMSO) of genes in all 4 clusters. i. Cumulative plot of % of genes with significantly increased promoter accessibility after dTAG-47 treatment across erythroid differentiation (p<0.05). Clustering as determined in d. j. Metagene of H3K4me3 and H3K9Ac enrichment (ChIP-seq) at TSS (+/− 2kb) in undifferentiated (d0) and dTAG-47 or DMSO-treated cells at d4 of differentiation in the 4 gene clusters. ns, not statistically significant. 2 clones were analyzed. See also Figure S2.
We next charted relative nascent transcription at these 44 upregulated genes that contain the BCL11A motif (Log2FC DMSO vs. dTAG) in two sets of experiments in two independent BCL11AFKBP clones: 3h to d5 after dTAG-47 addition and 12-96h after washout of drug following four days of dTAG-47 treatment, all under differentiation conditions (Figure 4d, Fig S2b), The 44 genes clustered in 4 distinct groups (based on the Log2 fold-change (FC)). Expression of genes in clusters II and IV exhibited modest upregulation upon BCL11A loss and re-repression upon drug washout compared to genes in cluster I. Genes in cluster I, limited to HBG1/2 and HBZ, were the most potently induced, or repressed, upon BCL11A loss and reinstatement, respectively. Cluster IV comprised genes with modest upregulation only at a few time points and were inconsistently re-repressed upon restoration of BCL11A, suggesting that cluster IV genes are not primary targets.
Next, we analyzed chromatin accessibility at the 44 loci by ATAC-seq after adding or removing dTAG-47. Chromatin accessibility trends largely mirrored nascent transcription. Cluster I genes showed the most extensive changes in chromatin accessibility between DMSO and dTAG-47 treated samples, whereas cluster IV genes exhibited no pattern (Figure 4e). Based on these nascent transcriptomic and ATAC-seq data, we conclude that the 31 genes in clusters I, II, and III represent primary targets of BCL11A.
We next enumerated the number and position of BCL11A motifs within promoter regions for all 31 primary targets. Cluster I genes exhibited a greater number of BCL11A motifs compared to clusters II, III, and IV, or to a random selection of genes per kb of gene length (Figure 4f). Chromatin-binding data for BCL11A (Liu et al., 2018) revealed that cluster I genes were the most enriched for BCL11A at their promoter regions (Figure 4g). Of all primary targets, cluster I genes showed a distinct pattern of progressively increasing transcription induction upon BCL11A depletion (Figure 4h).
We then performed an agnostic differential promoter-region-accessibility analysis of dTAG-47 vs. DMSO treated samples. None of the genes showed differential changes at 4h or 24h post-degradation at FDR <5%. Hence, we applied a more lenient cut-off of p-value <5% and identified 10 gene promoters showing increased accessibility at 4h, progressively increasing thereafter. Only ~22% (7/31) of the primary targets showed significantly increased chromatin accessibility in dTAG-47 samples at any time across differentiation, with variation seen between each cluster - all cluster I genes, <60% of cluster II, and only ~25% of cluster III genes showed increased chromatin accessibility upon BCL11A-depletion (Figure 4i). Moreover, it was only at 48h and later that the majority of the primary target gene promoters became differentially accessible (Figure 4i, grey zone, Fig S2c). These results echo observations at HBG1/2 (Figure 3c), where changes in nascent transcription preceded a discernable increase in accessibility at promoter regions.
We also assessed changes in histone modifications upon BCL11A depletion by ChIP-seq during differentiation (Figure 4j). Three modifications that correlate with active chromatin, H3K4me3, H3K9Ac, and H3Ac, showed differential enrichment at the primary BCL11A targets. Whereas promoters of all three clusters of genes were enriched for the active-H3Ac mark in dTAG-treated samples compared to DMSO (Fig S2d), both H3K4me3 and H3K9Ac showed a cluster-specific pattern of enrichment during differentiation: Cluster I gene promoters were not enriched for H3K4me3/H3K9Ac in undifferentiated cells (d0) and remained devoid of H3K4me3/H3K9Ac through differentiation (d4, DMSO). Upon dTAG-treatment, cluster I genes acquired promoter-specific H3K4me3/H3K9Ac (Figure 4j). In contrast, gene promoters in clusters II and III were enriched with active histone modifications at d0, which were lost by d4 of differentiation (d4, DMSO). In cells treated with dTAG-47, active marks at these genes were largely retained. From these results, we postulate that BCL11A-mediated repression of cluster I versus cluster II and III genes takes place in a temporally staggered manner in erythroid differentiation.
Globins are the most abundant, differentially expressed targets of BCL11A in the proteome
To map changes in nascent transcription to the proteome, we performed MS-based proteomic analysis of undifferentiated and differentiated BCL11AFKBP cells, treated with dTAG-47 or DMSO (Figure 5a). Proteomes were acquired by measuring each sample with a single 100 minutes gradient data-independent acquisition (DIA) method (Aebersold and Mann, 2016; Gillet et al., 2012; Karayel et al., 2020; Ludwig et al., 2018). An average of 6,070 proteins were quantified in each sample. We first focused on two unique BCL11A-XL isoform peptides quantified across all samples (DPFLSFGDSR and GAVVGVGDESR, Figure S3a), which confirmed degradation of BCL11A (Figure 5b). We performed differential protein expression analysis of dTAG-47 and DMSO treated samples during differentiation. Among differentially expressed proteins, most were present in greater abundance in dTAG-47 samples, further confirming the role of BCL11A as a repressor. Moreover, we observed high positive correlation in protein abundance between erythroid differentiation in the two conditions (Figure 5a,c, Pearson r2 0.88 at d2, r2 0.85 at d4, r2 0.91 at d7), indicating limited differences in the proteome of BCL11A-depleted cells compared to DMSO. As expected following extended treatment with dTAG-47, samples at d7 showed the largest number of differentially abundant proteins (FDR<1% and S0 0.1, Figure 5c, Figure S3b,c).
Figure 5. Quantitative proteomics analysis reveals modest changes to protein abundance in BCL11A-depleted cells undergoing erythroid differentiation.

a. PCA of BCL11AFKBP cells, dTAG-47 or DMSO treated, at various times in differentiation. b. Log2 MS intensities of two distinct BCL11A-FKBPF36V peptides in undifferentiated HUDEP-2, BCL11A−/− and BCL11AFKBP cells, and in differentiating BCL11AFKBP cells treated with DMSO or dTAG-47. c. Log2 Fold change in protein abundance between dTAG-47 or DMSO treatments at d2,d4, and d7 erythroid differentiation, Proteins that change significantly in abundance (FDR <1%) between dTAG-47 and DMSO-treatments are in blue. d. Overlap between proteins significantly changing in abundance (FDR<5%, s0=0.1) between dTAG-47 vs DMSO-treatments at d3, d4, and d7 of differentiation. e. % of DE proteins at each time point that are primary targets of BCL11A as determined by PRO-seq. % primary targets are represented in grey. f. Heatmaps of Log10 (Est. copy numbers) of proteins differentially abundant at d2, d4, and d7 with dTAG-47 vs. DMSO treatment (FDR<5%, s0=0.1). 3 replicates are shown. See also Figure S3, S4.
By applying an FDR<5% at S0<0.1, we found three proteins at d2, six proteins at d4, and 382 proteins at d7 of differentiation to be differentially expressed between DMSO and dTAG-47 treatments. HBG1/2 and HBZ were upregulated earliest and increased throughout differentiation (Figure 5d, S3c). While all differential protein expression at d2 could be correlated with a change in nascent transcription of primary BCL11A targets, this fraction decreased at later times of dTAG-47 treatment to 66.6% at d4. By d7, only less than 10% of differentially expressed proteins were primary targets of BCL11A (Figure 5e). Thus, a remarkably small set of primary transcriptional targets of BCL11A, including fetal and embryonic globins, culminates in measurable differential protein abundance (d2). The proteins differentially expressed at d7 may reflect secondary effects of prolonged BCL11A loss or dTAG-47 exposure itself.
To gauge the relative abundance of all differentially expressed proteins, we next employed the “proteomic ruler” method to estimate proteome-wide copy numbers of proteins per cell (Wiśniewski et al., 2014). Using this approach, we compared the estimated copy numbers of all differentially expressed proteins (FDR<5% and S0<0.1) at each time. HBG1/2 and HBZ were present at substantially higher copy numbers compared to all other differentially expressed proteins both early (d2) and later (d4) in differentiation (Figure 5f). By d7 of treatment and differentiation, the globins, corresponding to genes of cluster I, far outweighed the abundance of the other ~382 differentially expressed proteins in the differentiating erythroid cells (Figure 5f). We corroborated the findings of increased abundance of HBF and HBZ by HPLC and Western Blot respectively (Figure S4) and detected increased abundance of these proteins as early as 12-24h after addition of dTAG-47 to differentiating cells.
BCL11A-mediated repression of HBG1/2 is independent of promoter CpG methylation.
DNA methylation at promoter CpG dinucleotides has often been associated with transcriptional silencing (Goren et al., 2006). A correlation of HBG1/2 promoter methylation with HbF silencing has provided a rationale for inhibitors of DNA methylation as therapy for hemoglobinopathies. 8 CpG in the HBG1/2 promoters are heavily methylated in adult stage HBB-expressing cells. Acute degradation of BCL11A provides an opportunity to address directly the relationship between HBG1/2 transcription and promoter DNA methylation. We assayed 5-methyl Cytosine (5mC) levels at the HBG1/2 promoter by bisulfite modification and methylation-independent PCR followed by next-generation sequencing (NGS) of PCR amplicons. We ruled out PCR bias in amplifying methylated versus unmethylated targets by assessing methylation at the HBG1/2 promoters of HUDEP-1 and HUDEP-2 cells and in a 1:1 mixture of HUDEP-1: HUDEP-2 genomic DNA as PCR template. HUDEP-1 and HUDEP-2 cells represent fetal- and adult-type cells with unmethylated and methylated HBG1/2 promoters, respectively (Kurita et al., 2013). Our analysis showed that unmethylated and methylated templates were detected comparably in the 1:1 template sample (Figure S5c).
We then quantified CpG methylation at the eight promoter CpG sites at days 4-9 following BCL11A degradation. To ensure high-level globin expression, HUDEP-2 cells were cultured in differentiation media. Robust HbF reactivation was achieved without reduction of DNA methylation at any promoter CpG (Figure 6a–c, Fig S5a,b). At 9 days of dTAG-47 treatment, HBG transcripts represented 35% of the total β-like transcripts, despite no appreciable loss of promoter methylation. Thus, promoter CpG methylation is not the primary mode of HBG 1/2 repression.
Figure 6. BCL11A represses HBG1/2 genes independently of promoter CpG methylation.

% CpG methylation at 8 CpG sites in HBG1/2 promoters at d4 (a), d6 (b), and d9 (c) of differentiation in DMSO (blue dots) and dTAG-47 (red dots) treated BCL11AFKBP cells, as compared to d0. Extent of HBG upregulation shown in orange, red, maroon arrows., n=2 d. HBG1/2 promoter CpG methylation in differentiating BCL11AFKBP cells treated with azacytidine (0μM, 0.1μM, and 0.3μM) and DMSO or dTAG-47. Dots are CpGs, and color intensity indicates % methylation. e. Total promoter CpG methylation represented as the euclidean distance of CpG-methylation values from the methylation pattern at d0, for DMSO or dTAG-47 treatments in conjunction with azacytidine (0μM, 0.1μM and 0.3μM). f. RT-qPCR quantification of HBG1/2 as a percent of total globin RNA in differentiating BCL11AFKBP cells treated with azacytidine (0μM, 0.1μM and 0.3μM) in combination with DMSO (black bars) or dTAG-47 (open bars). HPRT is endogenous control, %HBG = 100* [HBG/ (HBG+HBB)]. See also Figure S5.
To assess the impact of DNA methylation loss in conjunction with loss of BCL11A, we treated cells with azacytidine (AZA), an inhibitor of the maintenance DNA methyltransferase DNMT1. To compare relative contributions of promoter CpG methylation and BCL11A-mediated promoter repression to HBG1/2 silencing, we treated BCL11AFKBP clones with either dTAG-47 or DMSO and added 0, 0.1, or 0.3μM of AZA to the culture media. As expected, promoter 5mC was progressively lost with increasing duration and concentration of AZA treatment (Figure 6d, bottom rows of DMSO treatment). This loss was more pronounced in BCL11A-depleted cells, indicating that removal of the repressor facilitated AZA-mediated loss of promoter CpG methylation (Figure 6d, top rows of dTAG-47 treatment, Fig 6e). Simultaneous treatment of AZA and dTAG-47 led to synergistic induction of HBG1/2, where the contribution of BCL11A loss to de-repression was greater than that of CpG demethylation at all AZA concentrations, especially at 0.1μM, where AZA treatment had a limited effect on cell viability (Figure 6f; Figure S5d). Therefore, removal of promoter 5mC led to a modest effect on HBG1/2 induction and is not the primary barrier to active and abundant HBG1/2 transcription.
Discussion
Here, we show that PROTAC-mediated rapid depletion of BCL11A induces HBG1/2 reactivation comparable to genetic loss-of-function in HUDEP-2 and erythroid-differentiated, CD34+ primary cells. While not unexpected, the correspondence provides proof-of-principle for BCL11A-targeted PROTACS as a potential therapeutic strategy.
Nascent transcription immediately following BCL11A depletion identified an exceedingly small set of 31 genes directly repressed by BCL11A, the globin genes (HBG1/2 and HBZ) showing substantially greater responses to BCL11A depletion in transcription, chromatin accessibility, and protein abundance. While BCL11A plays a pivotal role in silencing HBG1/2 during the globin switch, it also participates in the shutoff of expression of HBZ, the embryonic α-like globin gene, which is partially reactivated in BCL11A−/− cells and mouse models (King et al., 2021). The large fold-change induction of HBZ seen here is manifested by exceedingly low basal (DMSO) levels of HBZ in the presence of BCL11A; HBZ RNA is induced to ~1.5% of total α-like globins (figure S3d).
Through quantitative analysis of the proteome of BCL11A-depleted cells, we showed that the effects of BCL11A depletion are remarkably specific and likely account for the near-normal differentiation of erythroid progenitors in the face of reduced levels of BCL11A (this study), knockout mice (Xu et al., 2011), and in clinical trials for SCD and β-thalassemia (Esrick et al., 2021; Frangoul et al., 2021). The transcription factor ZNF410 exerts dedicated control on HBG1/2 expression via control of an upstream regulator CHD4 (Lan et al., 2021; Vinjamur et al., 2021). Of the already narrow set of primary targets, BCL11A directly and disproportionately controls a niche set of two embryonic/fetal globins in the erythroid cell.
Chromatin accessibility, as assayed in ATAC-seq, reflects physical access of Tn5 to chromatinized DNA. Access may be occluded by the presence of nucleosomes, chromatin-binding factors, or higher-order chromatin. Transcriptionally active regions are accessible to TF and RNA PolII, but the temporal relationship between nascent transcription and chromatin accessibility remains unresolved (Klemm et al., 2019). The staggering of transcriptional induction and chromatin opening in our system is reminiscent of embryonic stem cells, where re-establishment of accessible chromatin following DNA replication was secondary to, and dependent on, nascent transcription of prospectively ‘open’ loci (Stewart-Morgan et al., 2019). Acute oncoprotein depletion has also revealed staggering of nascent transcription and chromatin accessibility (Olsen et al., 2022; Stengel et al., 2021). Chromatin remodeling is a dynamic process that requires the constant engagement of ATP-dependent chromatin remodeling complexes that exhibit differential affinity towards specific modifications of nucleosome substrates (Schick et al., 2021)Dann et al., 2017). BCL11A recruits the NuRD chromatin remodeling complex at the HBG1/2 promoters, which is essential for γ-globin silencing (Sher et al., 2019). While dTAG-47 rapidly depleted BCL11A from chromatin (Figure 1c), we speculate that NuRD complexes, which maintain chromatin compaction, may be removed more slowly or passively upon DNA replication or cell cycle-dependent dilution of associated modified histones (e.g., NuRD-interacting unmethylated H3K4) (Kraushaar et al., 2018). Additionally, loss of NuRD complexes at the γ-globin promoters may be forestalled by independent recruitment by ZBTB7A/LRF to the HBG1/2 promoters (Masuda et al., 2016).
A correlation of promoter DNA methylation with gene repression has served as a rationale for inhibitors of DNA methylation as therapeutics for HbF reactivation (Lavelle, 2004). Our data argue that BCL11A represses HBG1/2 largely independent of promoter DNA methylation. Removal of BCL11A facilitated AZA-mediated loss of CpG methylation and led to synergistic induction of γ-globin, with the contribution of BCL11A-depletion to reactivation considerably greater than that of CpG demethylation alone. PROTAC-mediated degradation of BCL11A temporally uncoupled transcription, chromatin accessibility, and DNA methylation at the HBG1/2 locus and suggests that the loss of DNA methylation seen in previous genetic studies occurs secondary to reactivation of transcription. Such temporal uncoupling may be widespread, as recently reported in differentiating monocytes, where changes in DNA methylation lagged behind transcription and chromatin accessibility by several days (Barnett et al., 2020). As promoter CpG methylation is not the dominant contributor to HBG1/2 repression, we propose that removal of a direct transcriptional repressor, such as BCL11A or ZBTB7A/LRF, is necessary for robust γ-globin reactivation. The rapidity with which γ-globin transcription is reactivated following BCL11A degradation suggests that repression is an active process, and refutes a simple “hit-and-run” model in which a repressor initiates a cascade of events and is dispensable thereafter (Martyn et al., 2018; Varala et al., 2015). The critical role of BCL11A as an active, direct, and dominant repressor of γ-globin transcription raises questions regarding use of epigenetic modifiers for effective reactivation of HbF, unless these modalities also down-regulate BCL11A expression or function.
Within HUDEP-2 cells, BCL11A appears to be an exceedingly long-lived transcription factor (t1/2 24.5, Figure 2d). While still relatively stable for a transcription factor, BCL11A- FKBPF36V exhibited a shorter half-life (t1/2 7 h). Given that the steady-state abundances of BCL11A-FKBP mRNA and protein are comparable to those in parental cells a reduced half-life of the tagged protein is unlikely to confound the effects of acute loss of BCL11A on downstream transcription or proteomics (figure S1A). A reduced half-life would predictably lead to slower recovery of the fusion protein to steady-state levels compared to the wild-type protein, which might alter the kinetics of re-repression. Of note, the level of HbF in BCL11AFKBP cells was equivalent to that of parental HUDEP-2 cells, indicative of full γ-globin repression. However, the failure of mice homozygous for Bcl11aFKBP alleles to survive suggests that primary cells in vivo are less tolerant to alterations in half-lives of critical proteins. We report our findings to caution investigators who may seek to apply the dTAG or other protein degradation platforms in whole animals.
Recent gene therapy and CRISPR/Cas9 editing trials for SCD and β-thalassemia have validated BCL11A as a therapeutic target. As currently practiced, genetic therapies that rely on ex vivo modification of hematopoietic stem cells and reinfusion following myeloablatice chemotherapy cannot address the global burden of these disorders. Small molecules directed to BCL11A offer the prospect of a widely applicable therapeutic option. While many challenges remain, the scarcity of primary targets of BCL11A and dominance of globins in the BCL11A-depleted proteome provide requisite proof-of-principle for further pursuit of this goal.
Potential limitations of the study
The apparent staggering of transcription and chromatin accessibility may reflect an S-phase dependent mechanism. In this scenario, BCL11A-depleted cells undergoing DNA replication might be the first to exhibit a failure of silencing. Increased chromatin accessibility may require dilution of underlying histone marks with each cell division cycle, and be concurrent, but not observable in an asynchronously dividing cell population because of the lack of sensititity of existing technology, These questions call for a direct assessment by single-cell RNA-seq and ATAC-seq analyses, as well as nascent transcription analysis of G1/S/G2M-separated BCL11A-FKBP cells.
STAR METHODS
Resource Availability
Lead Contact and Materials Availability
Lead contact:
Further information and requests for reagents should be directed to and will be fulfilled by the Lead contact, Stuart H Orkin (stuart_orkin@dfci.harvard.edu).
Materials availability:
This study did not generate new unique reagents.
Data and code availability:
NGS and proteomics data have been deposited in GEO and ProteomeXchange/PRIDE databases respectively, and are publicly available as of the date of publication. Accession numbers are listed in the key resources table.
This paper does not report original code.
Any additional information required to reanalyze the data reported in this paper is available from the lead contact upon request.
Key Resources Table
| REAGENT or RESOURCE | SOURCE | IDENTIFIER |
|---|---|---|
| Antibodies | ||
| Rabbit Monoclonal α-BCL11A | Abcam | Cat# ab191401 |
| Mouse monoclonal α-β-ACTIN | Santa Cruz Biotechnology | Cat# Sc-4778 |
| Mouse monoclonal α-Gapdh | Abcam | Cat# ab8245 |
| Human polyclonal α-TUBB | Abexxa | Cat# abx026439 |
| Mouse monoclonal α-RCC | Santa Cruz Biotechnology | Cat# sc-55559 |
| Rabbit polyclonal α-CRBN | Novusbio | Cat# NBP1-91810 |
| Rabbit polyclonal a-c-MYC | Cell Signaling | Cat# 94025 |
| Rabbit polyclonal a-HBZ | Abcam | Cat# 228651 |
| Mouse monoclonal α-HBG | Santa Cruz Biotechnology | Cat# Sc-21756 |
| α-human CD71 PE-cy7 | eBioscience | Cat# 25-0719-42 |
| α-human CD235a FITC | BD Pharmingen | Cat# 559943 |
| α-human CD36 APC | Biolegend | Cat# 33620 |
| Rabbit polyclonal α-H4K4me3 | Actie Motif | Cat# 39915 |
| Rabbit Monoclonal α-H3K9Ac | Actie Motif | Cat# 39917 |
| Rabbit polyclonal α-H3Ac | Actie Motif | Cat# 39040 |
| Normal Rabbit IgG | Cell Signaling | Cat# 2729S |
| Goat Anti-Rabbit IgG (H + L)-HRP Conjugate | Bio-Rad Laboratories | Cat# 1706515 |
| Goat Anti-Mouse IgG (H + L)-HRP Conjugate | Bio-Rad Laboratories | Cat# 1706516 |
| Rabbit polyclonal α-H3 | Abcam | Cat# 1791 |
| Hemoglobin alpha Antibody - BSA Free | Novusbio | Cat# NB110-41083 |
| Anti-Hemoglobin β Antibody (37-8) | SantaCruz | Cat# sc-21757 |
| Biological samples | ||
| pAAV-IRES-hrGFP-mWnt3a | Rodriguez et al 2014 | Addgene: 89771 |
| Chemicals, peptides, and recombinant proteins | ||
| dTAG47 and dTAG47-ve | Nabet et al, 2018 | N/A |
| Cycloheximide | MilliporeSigma | Cat# C4859 |
| Azacytidine | Cayman chemical | Cat# 11164 |
| Asunaprevir | Cayman chemical | Cat# 20835 |
| Alt-R® S.p. Cas9 Nuclease V3 | IDT | Cat# 1081059 |
| Critical commercial assays | ||
| Subcellular Protein Fractionation Kit for Cultured Cells | ThermoFisher | Cat# 78840 |
| D-10 Hemoglobin A1c Program | BioRad laboratories | Cat# 12000949 |
| Deposited data | ||
| ChIP-seq, ATAC-seq, PRO-seq | This paper, GEO database | GSE194348 |
| Multiplexed global proteome analysis with TMT quantitation | This paper, PRISM database | PXD030307 |
| LC-MS/MS global proteome data (DIA) | This paper, ProteomeXchange database | PXD030307 |
| Mouse: MEL cells | Stuart Orkin | N/A |
| Experimental models: Cell lines | ||
| HUDEP-2 | Kurita et al, 2013 | N/A |
| Experimental models: Organisms/strains | ||
| C57BL/6J mice | Jackson labs | RRID:IMSR_JAX:000664 |
| Software and algorithms | ||
| ImageJ | ImageJ | https://imagej.nih.gov/ij/ |
| GraphPad Prism Software | Prism | https://www.graphpad.com |
Experimental Model and Subject Details
HUDEP cell culture and drug treatment
HUDEP-1 and HUDEP-2 (human umbilical cord blood-derived erythroid progenitor, male) lines were provided by Dr. Yukio Nakamura, and cultured as described previously (Vinjamur and Bauer, 2018). Cells were maintained at a density of <0.5x10⁶ in expansion medium: StemSpan™ SFEM (STEMCELL Technologies, 09650) with SCF (50 ng/ml), EPO (3 IU/ml), Dexamethasone (10–6 M), Doxycycline (1 μg/ml), and passaged every other day. Erythroid differentiation was carried out by replacing the medium to EDM2 (Erythroid Differentiation Media: IMDM (Corning, 15–016-CV) supplemented with 330 μg/mL HoloHuman Transferrin, 10 μg/mL Recombinant Human Insulin, 2 IU/mL Heparin, 5% Inactivated Plasma, 3 IU/mL Erythropoietin, 2 mM L-Glutamine, 100 ng/mL SCF, 1 μg/mL doxycycline). Cells were resuspended in medium containing 0.15uM dTAG-47. Every other day, cells were centrifuged at 500g for 5min at 4C and resuspended in fresh media containing the drug.
Mouse work and generation of KI mouse
Animal experiments were performed under protocols approved by the Boston Children’s Hospital Animal Care and Use Committee (15–18). Endogenous tagging of Bcl11a in the mouse was achieved by zygote AAV infection/ and RNP electroporation (Chen et al., 2019). sgRNA targeting the C-terminus of Bcl11a was synthesized in-house (Sher et al., 2019) and complexed with recombinant Cas9 protein (PNAbio) in OptiMEM (Gibco). A serotype-1 AAV carrying the FKBPFKBP sequence flanked by 200bp homology arms was used as a donor template and added to the solution at ~5x10¹² gc/ml, prior to electroporation. Batches of 30 one-cell-stage C57BL/6/N/Crl mouse embryos were electroporated using a square-wave electroporator (7x pulses, 30V, 100 msec intervals), washed in OptiMEM, and transferred into CD1 foster mothers. Founder mice were screened by PCR, and knock-ins confirmed by Sanger sequencing. Mendelian distribution of genotypes was compared using Mendel (Montoliu, 2012). Expression of tagged Bcl11a-dTAG-HA was confirmed by Western Blotting using anti-Bcl11a (Abcam ab191401) and anti-HA (Cell Signaling #2367) antibodies. In vitro transcription of the sgRNA (ATGATATAAAAACTGAATAG) was performed with the following oligos (5’ → 3’): DS_mBclSTOP_IVTfw (GAAATTAATACGACTCACTATAGGATGATATAAAAACTGAATAGGTTTTAGAGCTAGAAATAGCAAGTTAAAATAAGGCTAGTCCG) and DS_IVTrv (AAAAAAGCACCGACTCGGTGCCACTTTTTCAAGTTGATAACGGACTAGCCTTATTTTAACTTGC). E14.5 embryos were not sexed since no sex-based effects on globin expression were expected.
METHOD DETAILS
Generation of indel and knock-in HUDEP2 clones
Cas9/sgRNA RNP was generated by mixing 120 pM guide RNA (2′-O-methyl analog and 3′ phosphorothioate internucleotide modified-sgRNA, custom ordered from Synthego Corp., 5’ to 3’ sequence: augauauaaaaacugaauag) with 61 pM Cas9-Alt-R protein (IDT) and incubated at room temperature for 10 min. Meanwhile, 5 x 10⁴ HUDEP-2 cells were collected by centrifugation at 500xg for 5 min, washed in 1X room temperature PBS, and re-suspended in 20 μL NF-solution (P3 Primary Cell 4D-NucleofectorTM X Kit, Lonza). Thereafter, RNP was mixed with the cells, and nucleofection was carried out in a 4D-nucleofector X Unit with program EO-100. Immediately after nucleofection, cells were supplemented with 80 μL warm expansion medium. After 10 min, cells were collected by centrifugation at 500xg for 5 min and re-suspended in 100 μL expansion medium in one well of a flat-bottom 96-well plate. For generation of knockins, 20 μL crude rAAV viral prep (see below) was added to the cells at this point, and the cells returned to the 37°C incubator for 3 days.
For the generation of CRBN−/− clones, two guides at the 5’ of the CRBN gene were used (5’ to 3’ sequences: aaccaccugccgcuccugcc and UCCUGCUGAUCUCCUUCGC), with RNP electroporation performed as described as above.
The triple-transfection method was used to generate crude rAAV lysates (Robert et al., 2017). HEK293T cells were plated in a 10 cm dish in 1X Penicillin-streptomycin-Glutamine and 10% FBS in DMEM. At 80% confluence, the medium was replaced with fresh medium. Then, cells were triple-transfected using polyethylenimine Max (PEI Max, Polysciences 24765-1) with 12 μg of pAAV-helper, 7.5 μg of pRep2Cap6, and 7.5 μg of transfer plasmid (containing the HDR template with FBBPF36V flanked by a 1.1kb proximal and a 186bp distal arm) (PEI:DNA = 3:1), in DMEM without phenol red (Life Technologies 31053036). 3 days after transfection, cells were scraped and collected by spinning at 1300 RPM for 5 min. The cell pellet was re-suspended in 1-2 mL DPBS without calcium or magnesium and lysed by three rounds of freeze-thaw. This was accomplished by placing them alternately in a dry ice/ethanol bath until completely frozen and in a water bath of 37°C until completely thawed. After the final thaw, cell lysate was spun at 1300 RPM for 5 min, and the supernatant was filtered through a 0.22 μm syringe filter to yield a crude viral lysate. Viral lysates were stored in 25 μL aliquots at 4°C for up to 4 weeks and at −80°C after that.
One week after electroporation/ AAV transduction, single-cell colonies were generated. To isolate single-cell clones, ~30 cells were seeded per 96 well plate. Media was refreshed every 3-4 days over 10-14 days. Wells with >1 colony were excluded. Single clones were expanded and genotyped for the desired knock-in by PCR on genomic DNA extracted with Quickextract solution (Lucigen). Clones showing biallelic knockins were expanded and frozen in LN2 at early passages.
PRO-seq
PRO-seq cell permeabilization
PRO-seq was performed as described (Liu et al., 2021). Five million HUDEP-2 were harvested on ice, and washed with cold PBS. Cells were resuspended in 2 mL cold Buffer W (10 mM Tris-Cl, pH 8.0,10 mM KCl, 250 mM sucrose, 5 mM MgCl2, 0.5 mM DTT, 10% glycerol, 0.5% BSA) using wide-bore P1000 tip and transferred to a 2 mL low binding tube and strained through a 35 micron nylon mesh cell strainer. Immediately add 18 mL Chilled Buffer P (Buffer W supplemented with 0.05% Igepal CA630) to cell suspension and mix gently for 2 min. Cells were centrifuged at 700 x g for 8 min and resuspended in 1 mL Buffer F (50 mM Tris-HCl pH 8.3, 40% glycerol, 5 mM MgCl2, 0.5 mM DTT, 0.5% BSA), and centrifuged again at 700 x g for 8 min. The pellets were resuspended in 400 μL Buffer F and counted using a hemocytometer to ensure that >95% cells were permeabilized. The cell density was adjusted to 1 x 10⁶/100 μL, and the suspension was snap-frozen and stored at −80°C.
PRO-seq run-on and library construction
Aliquots of frozen (−80°C) permeabilized cells were thawed on ice and pipetted gently to fully resuspend. An aliquot was removed and diluted 1:10 in 1xPBS for cell counting using an automatic counter (Biorad TC-20) with counts spot-checked by manual recount using a hemocytometer as needed. An aliquot of each dilution was also stained with Trypan Blue and counting repeated to determine permeabilization efficiency. For each sample, 1 million permeabilized cells were used for nuclear run-on. For normalization, 50,000 permeabilized Drosophila S2 cells were spiked-in to each sample of 1 million mammalian cells. Nuclear run-on assays and library preparation were performed essentially as described (Elrod et al., 2019) with modifications noted below.
The nuclear run-on buffer was prepared as 4X stock (20mM Tris pH 8, 20mM MgCl2, 2mM DTT, 600mM KCl, 40 μM/ea biotin-11-NTPs (Perkin Elmer), 20U SuperaseIN (Thermo). The 4X stock was mixed 1:1 with 2% sarkosyl (Sigma) to yield 2X complete run-on mix. The 3’ adapter (RNA oligo: 5′P-GAUCGUCGGACUGUAGAACUCUGAAC-3’InvdT) was pre-adenylated prior to use (5’ DNA adenylation kit, NEB, according to the manufacturer’s instructions). Adenylated oligo was purified by ethanol precipitation, resuspended in water and quality was modification confirmed by electrophoresis on a 15% TBE-Urea gel (Novex) next to appropriate controls. The adapter concentration was adjusted to 10μM and 1uL was used for each ligation which contained T4 RNA ligase 2, truncated KQ (NEB) with 15% PEG-8000 in the reaction mix. Reactions were incubated at 16°C overnight. Each ligation reaction was then diluted with 180uL of betaine binding buffer (1.42g of betaine brought to 10mL with binding buffer and sterile filtered) containing 1uL of 100μM blocking oligo (TCCGACGATCCCACGTTCCCGTGG/3InvdT/). The blocking oligo is complementary to and overhangs the 3’ end of the 3’ adapter and reduces 5’/3’ adapter dimer formation during the 5’ adapter ligation step. The blocking oligo was modified at its 3’ end to prevent extension by reverse transcriptase. Blocking oligo was also included in final wash solution prior to the 5’ adapter ligation and in the ligation reaction itself, both at 3-fold molar excess over the initial amount of 3’ adapter (i.e. 1uL of 30μM per reaction). The 5’ adapter ligation was performed as as described (Elrod et al., 2019) except that PEG-8000 was increased to 15%.
After reverse transcription, cDNA was immediately amplified for 5-cycles (“preCR” step). A PCR cocktail consisting of NEBNext Ultra II Q5 master mix (NEB) and Illumina TruSeq PCR primers (RP-1, common; and RPI-X, indexing) was added to each cDNA and amplification carried out according to manufacturer’s suggested 2-step cycling conditions for NGS applications. To determine optimal library amplification, the preCRs were thawed on ice and an aliquot serially diluted. Each dilution was mixed with a PCR cocktail (Q5 DNA polymerase with optional high GC enhancer) containing 10 μM/ea of Illumina universal P5 and P7 primers and amplified 15-cycles. The reactions were electrophoresed on a 2.2% agarose gel (SeaKem) cast with SYBR gold (Thermo) and analyzed to determine the optimal number of cycles for final amplification. preCRs were transferred from ice to a pre-heated thermal cycler block and amplified for the appropriate number of additional cycles to reach the total determined in the test amplification. Pooled libraries were sequenced using an Illumina NovaSeq S1 (PE 50), Novaseq S4 (200 cycle kit), NextSeq in high output mode (PE 75), NovaSeq S1 with 100 cycle kit (PE50).
PRO-seq data analysis
Preprocessing. Raw paired-end sequences in FASTQ format were trimmed using cutadapt (Martin, 2011) (version 1.18) to remove adapter sequences and low-quality 3’ bases (--match-read-wildcards -m 20 -q 10). The 3’ adapter sequences of R1 reads (“TGGAATTCTCGGGTGCCAAGGAACTCCAGTCAC”) and the 3’ adapter of R2 reads (“GATCGTCGGACTGTAGAACTCTGAAC”) were removed from all read pairs. The resulting read pairs were mapped to the spike-in Drosophila genome (dm6) using Bowtie2 (Langmead and Salzberg, 2012) (version 2.2.9), with those reads not mapped to the spike genome as input to the primary genome (hg19) using Bowtie2. Reads mapped to the hg19 reference genome were then sorted and indexed using samtools (Danecek et al., 2021) (version 1.9), and subsequently converted to BED format using the bamtobed command from the bedtools suite (Quinlan and Hall, 2010) (version 2.30.0). The 3’ end positions of the R1 end, which correspond to the 3’ end of nascent RNAs, were extracted from the BED files and used as input to generate bedGraph files at single-nucleotide resolution for visualization using the genomecov command from bedtools, with a genome-wide normalization factor being 30 million divided by total read numbers. Thus the signals in the bedGraph files represent the number of nascent transcripts per 30 million transcripts. Because the R1 end in PRO-seq reveals the position of the RNA 3’ end, the “+” and “−” strands were swapped to generate bedGraphs representing 3’ end position at single-nucleotide resolution.
Differential expression analysis.
DESeq2 (Love et al., 2014) (version 1.32.0) was used to identify the statistically differential genes between the DMSO and drug-treated samples. DESeq2 takes the raw counts of nascent transcripts per gene as input and estimates the fold change and significance based on the negative binomial distribution. The raw count matrices of nascent transcripts were generated by mapping the 3’ end of R1 ends to the TSS and TES+3kb region for each gene. We used the 3kb extension for transcription quantification because it is observed that for many highly transcribed genes there is an enrichment of nascent transcripts at the post-TES region. Notably, biological clones were assigned as a confounding factor and were subsequently removed by DESeq2, thus enabling the differential analysis more centered on the effects of the dTAG-47 drug. Genes with adjusted p-value lower than 0.05 were deemed as significant.
Meta-gene plots.
Average metagene plots of PRO-seq read density from TSS to TES of indicated gene groups were generated using computeMatrix and plotProfile commands from deeptools (Ramírez et al., 2016) (version 3.5.1). Each gene was divided from TSS to TES positions into 60 bins, and read density was calculated in each bin and normalized by the bin length. Read density flanking each gene was also calculated (3kb upstream of TSS and 3kb downstream of TES). Average values for each gene group are shown.
BCL11A motif analysis.
BCL11A recognizes the sequence TGA(G)CCA(T) (Liu et al., 2018). To prepare the gene set with the BCL11A motif in the promoter region, the genome was scanned to identify occurrences of the four motif variants (TGACCA, TGGCCA, TGACCT, TGGCCT) by using bowtie (Langmead et al., 2009) (version 1.2.2) with no mismatches allowed. Then all the motif occurrences were overlapped with a merged set of BCL11A binding sites (Liu et al., 2018) using the “intersect” command from bedtools. Only those motif occurrences showing BCL11A binding were considered functional and kept for further analysis. BCL11A binding sites were merged from available BCL11A CUT&RUN data in HUDEP2 cells at various times (Liu et al., 2018).
Sample preparation for LC-MS/MS analysis
Cell pellets were lysed in SDC buffer (1% sodium deoxycholate in100 mM Tris pH 8.5) and immediately boiled for 5 min at 95°C. After cooling the lysates on ice for 5 min, we sonicated them for 15 min at 4° using the Bioruptor® Plus sonication device. Protein concentration was determined by Tryptophan assay as described in (Kulak et al., 2014) to equalize protein amounts before reduction and alkylation by 10 mM TCEP and 40 mM 2-Chloroacetamide, respectively, for 5 min at 45°C. Proteins were subsequently digested by the addition of 1:100 LysC and Trypsin overnight at 37°C with agitation (1,500 rpm). 24 hrs later, ~20 μg of peptide was desalted using an in-StageTip (iST) protocol (Kulak, 2014). Briefly, samples were at least 4-fold diluted with 1% trifluoro-acetic acid (TFA) in isopropanol and loaded onto StageTips prepared in-house using SDB-RPS material (Empore). StageTips were then washed with 200μL of 1% TFA in isopropanol twice and 200μL 0.2% TFA/2% ACN (acetonitrile) once. Peptide elution is performed with 80 μl of 1.25% Ammonium hydroxide (NH4OH)/80% ACN and eluates were dried using a SpeedVac centrifuge (Concentrator Plus; Eppendorf). MS loading buffer (0.2% TFA/2%ACN (v/v)) was added to the dried samples to resuspend prior to LC-MS/MS analysis. Peptide concentrations were measured optically at 280 nm (Nanodrop 2000; Thermo Scientific) and subsequently equalized using the same MS loading buffer. Approximately, 200 ng of peptides from each sample was analyzed using a 100 min DIA method.
LC-MS/MS analysis and data processing
Nanoflow liquid chromatography (LC)-tandem mass spectrometry (MS/MS) measurements were carried out on an EASY-nLC 1200 ultrahigh-pressure system (Thermo Fisher Scientific) coupled to an Orbitrap instrument, namely Orbitrap Exploris 480 and a nano-electrospray ion source (Thermo Fisher Scientific). In-house packed columns (50 cm, 75 μm inner diameter, ReproSil-Pur C18-AQ1.9 μm resin (Dr. Maisch GmbH)) were used and column temperature was kept at 60°C with an in-house developed oven. Peptides were loaded in buffer A (0.1 % formic acid (FA) (v/v)) and eluted with a linear 80 min gradient of 5–30 % of buffer B (80 % acetonitrile (ACN) and 0.1% FA (v/v)), followed by a 4 min increase to 60 % of buffer B and a 4 min increase to 95 % of buffer B, and a 4 min wash of 95% buffer B at a flow rate of 300 nl/min. At the end, buffer B concentration was decreased to 4% in 4 min and stayed at 4% for another 4 min.
MS data for each sample/biological replicate were recorded in singlicates in DIA mode. Full MS scans were acquired in the range of m/z 300–1,650 at a resolution of 120,000 at m/z 200 and the automatic gain control (AGC) set to 3e6. Full MS events were followed by 33 MS/MS windows per cycle at a resolution of 30,000 at m/z 200 and ions were accumulated to reach an AGC target value of 1e5 or an Xcalibur-automated maximum injection time. The spectra were recorded in profile mode. The HCD collision energies (%) was stepped (25.5, 27, and 30).
Subsequently, data were processed in Spectronaut version 15.2.210819.50606 (Biognosys AG) using the human SwissProt reference proteome of canonical and isoform sequences with 42,431 entries downloaded in July 2019 for final protein identification and quantification. We set carbamidomethylation as fixed modification and acetylation of the protein N-terminus and oxidation of methionine as variable modifications. Trypsin/P proteolytic cleavage rule was used with a maximum of two missed cleavages permitted and a peptide length of 7–52 amino acids. A protein and precursor FDR of 1% were used for filtering and subsequent reporting in samples (q-value mode with no imputation).
Bioinformatic analysis of LC-MS/MS data
In preparation for the analysis, protein intensities were log2-transformed and data were filtered to ensure that identified proteins showed expression in all biological triplicates of at least one experimental group. Subsequently, missing values were replaced by random numbers that were drawn from a normal distribution (width = 0.3 and downshift = 1.8). Principle component analysis (PCA) of samples/ biological replicates was performed using Perseus (1.6.1.3) (Tyanova et al., 2016). For the pairwise comparisons between groups, a statistical t-test was performed and permutation-based FDR which was set to 0.01 or 0.05 in conjunction with an S0-parameter of 0.1 was applied. For hierarchical clustering of proteins, protein abundances were z-scored and clustered using Euclidean as a distance measure for row and/or column clustering. Mean log2 ratios of biological triplicates and the corresponding P-values were visualized with volcano plots and significance was based on an FDR < 0.05 or 0.01.
Chromatin Immunoprecipitation and sequencing
About 5-30x106 HUDEP-2 cells were cross-linked with fresh 1% formaldehyde (Fisher Scientific) with/without dTAG-47 for 6 min at room temperature (RT) and quenched with 1.25 M glycine for 5 min at RT. Cells were washed three times in cold phosphate-buffered saline (PBS) containing protease inhibitors and cell pellets flash-frozen in LN2. Nuclei were isolated using the truChIP kit (Covaris Inc.), and chromatin was sheared at 4°C, 140 W, and 200 cycles per burst with 10% duty factor for 8 min (Covaris). Input fraction was saved (1%), and the remaining sheared chromatin was used for ChIP with antibodies specific for an epitope or an immunoglobulin G isotype control (Millipore) in immunoprecipitation buffer [0.1% Triton X-100, 0.1 M tris-HCl (pH 8), 0.5 mM EDTA, and 0.15 M NaCl in 1× Covaris D3 buffer] at 4°C, rotating overnight, followed by incubation with Dynabeads Protein G (10003D, Life Technologies) for 4 hours. The chromatin-bead-antibody complexes were sequentially washed with three buffers of increasing salt concentrations and TE buffer. Chromatin was then eluted using 1% SDS in Tris-EDTA. Cross-linking was reversed by incubation with ribonuclease A (Roche) for 1 hour at 37°C, and with Proteinase K (Roche) at 65°C overnight. DNA was purified with the QIAquick PCR Purification Kit (28104, Qiagen). ChIPseq libraries were prepared using Swift S2 Acel reagents on a Beckman Coulter Biomek i7 liquid handling platform from approximately 1ng of DNA according to manufacturer’s protocol and 14 cycles of PCR amplification. Finished sequencing libraries were quantified by Qubit fluorometer and Agilent TapeStation 2200. Library pooling and indexing was evaluated with shallow sequencing on an Illumina MiSeq. Subsequently, libraries were sequenced on an Illumina NovaSeq6000 targeting 40 million 150bp read pairs by the DFCI Molecular Biology Core.
ChIP-seq data analysis
Raw sequences in FASTQ format were mapped to the spike-in Drosophila genome (dm6) using Bowtie2 (version 2.2.9), with those reads not mapped to the spike genome as input to the primary genome (hg19) using Bowtie2 (version 2.2.9). Mapped reads were then sorted and indexed using samtools (version 1.9). Duplicate reads, as well as reads mapped to the human blacklisted regions (Amemiya et al., 2019), were filtered out. The resulting reads were then used to generate the bigwig files for visualization in genome browser using the bamCoverage command with the CPM (Count Per Million) normalization method. Metagenes plots in this study were generated from the bigwig files using computeMatrix and plotProfile commands from deeptools.
Assay for transposase-accessible chromatin (Omni-ATAC-seq)
Omni-ATAC was performed as before (Liu et al., 2021) with 70,000 HUDEP-2 cells frozen in 10% DMSO/FBS. On the day of the experiment, cells were thawed on ice and permeabilized with 50 μL RSB buffer (10 mM Tris-HCl pH 7.4, 10 mM NaCl, 3 mM MgCl2) with 0.1% NP40, 0.1% Tween-20 and 0.01% Digitonin for 3 minutes on ice. 1 mL of cold RSB containing 0.1% Tween-20 was added before cells were pelleted again. Pellets were resuspended with 50 μL transposition mixture (25 μL 2xTD buffer, 2.5 μL transposase from ATAC-seq kit (Illumina), 16.5 μL PBS, 0.5 μL 1% digitonin, and 0.5 μL 10% Tween20), and the reaction was carried out at 37 °C for 45 minutes. Genomic DNA was extracted with a Qiagen MinElute PCR purification kit according to the manufacturer’s recommended protocol. Total DNA was used as template for amplification, mixed with 15 μL of 2x Ultra II Q5 mix, 1 μL of 10 μM i7 primer (AATGATACGGCGACCACCGAGATCTACACTCGTCGGCAGCGTCAGATGTG), and 1 μL of 10 μM i5 primer (CAAGCAGAAGACGGCATACGAGATNNNNNNNNGTCTCGTGGGCTCGGAGATGT) where the Ns represent barcodes. PCR amplification was performed as follows: 65°C 5 min, 98°C 30 s, 98°C 10 s, 63°C 30 s, repeat step 3-4 for 5-9x, and 63°C 5min. PCR products were purified with AMPure beads and quantified using Qubit and Tapestation before pooling and sequencing. The libraries were sequenced on the NextSeq 500 platform with NextSeq 500/550 High Output Kit v2 (75 cycles). Paired-end sequencing was performed (2x42 bp, 6 bp index).
ATAC-seq data analysis
Raw sequences in FASTQ format were mapped to the spike-in Drosophila genome (dm6) using Bowtie2 (version 2.2.9), with those reads not mapped to the spike genome as input to the primary genome (hg19) using Bowtie2 (version 2.2.9). Mapped reads were then sorted and indexed using samtools (version 1.9). Since Tn5 transposase binds as a dimer and inserts two adaptors separated by 9 bp, all reads mapped to the forward strand need to be offset by +4 bp and those mapped to the reverse strand need to be offset by −5 bp. We used the alignmentSieve command (“--ATACshift”) from deeptools (version 3.5.1) to accomplish the shifting step. Duplicate reads, as well as reads mapped to the human blacklisted regions (Amemiya et al., 2019), were filtered out. The resulting reads were then used to generate the bigwig files for visualization in genome browser using the bamCoverage command with the CPM (Count Per Million) normalization method.
For each sample, peaks were identified using MACSs (Zhang et al., 2008) (version 2.1.1), with the narrow peak mode and q value 0.05 as the statistical cutoff. Peak summits from all samples were pooled, creating a non-redundant peak set for further analysis. Next, the peak summits pooled from all samples were sorted in descending order by the fifth column (i.e. −log 10 P-value). Peak summits from the top of the list were picked and any remaining peaks within 300 bp of the top peak summit were removed. Then, the next peak summit in the list was picked and the process was repeated until the entire list was traversed. In total, 156282 non-redundant peak summits were identified. Each peak summit was then extended by 300bp in both directions and the resulting region was used as the peak region.
Similar to the differential analysis of PRO-seq data, we used DESeq2 for differential chromatin accessibility analysis at gene promoters. Specifically, the featureCounts tool from the subread (Liao et al., 2014) package (version 2.0.0) was used to generate a raw read count matrix of promoter accessibility (TSS +/− 500bp). Then the raw read count matrix was used as input for DESeq2. Genes with a p-value lower than 0.05 were deemed as significant.
Sample preparation, Multiplexed TMT LC-MS3 mass spectrometry and LC-MS data analysis
Clonal HUDEP-2 cells were treated with DMSO or 0.1μM dTAG-47 in biological triplicate for 6 h and cells were harvested by centrifugation. Cells were lysed by addition of lysis buffer (8 M Urea, 50 mM NaCl, 50 mM 4-(2-hydroxyethyl)-1-piperazineethanesulfonic acid (EPPS) pH 8.5, Protease and Phosphatase inhibitors) and manual homogenization by 20 passes through a 21-gauge (1.25 in. long). Bradford assay was used to determine the final protein concentration in the clarified cell lysate. 100 μg of protein for each sample was reduced, alkylated and precipitated using methanol/chloroform as previously described (Donovan et al., 2018) and the resulting washed precipitated protein was allowed to air dry. Precipitated protein was resuspended in 4 M Urea, 50 mM HEPES pH 7.4, followed by dilution to 1 M urea with the addition of 200 mM EPPS, pH 8. Proteins were first digested with LysC (1:50; enzyme:protein) for 12 h at RT. The LysC digestion was diluted to 0.5 M Urea with 200 mM EPPS pH 8 followed by digestion with trypsin (1:50; enzyme:protein) for 6 h at 37 °C. Tandem mass tag (TMT) reagents (Thermo Fisher Scientific) were dissolved in anhydrous acetonitrile (ACN) according to manufacturer’s instructions. Anhydrous ACN was added to each peptide sample to a final concentration of 30% v/v, and labeling was induced with the addition of TMT 11-plex reagent to each sample at a ratio of 1:4 peptide:TMT label. The 11-plex labeling reactions were performed for 1.5 h at RT and the reaction quenched by the addition of hydroxylamine to a final concentration of 0.3% for 15 minutes at RT. Each of the sample channels were combined in a 1:1 ratio, desalted using C18 solid phase extraction cartridges (Waters) and analyzed by LC-MS for quality control checks and channel ratio comparison. Samples were combined using the adjusted volumes determined in the channel ratio analysis and dried down in a speed vacuum. The combined sample was resuspended in 1% formic acid and acidified (pH 2 - 3) before being subjected to desalting with C18 SPE (Sep-Pak, Waters). Sample was then offline fractionated into 96 fractions by high pH reverse-phase HPLC (Agilent LC1260) through an aeris peptide xb-c18 column (phenomenex) with mobile phase A containing 5% acetonitrile and 10 mM NH4HCO3 in LC-MS grade H2O, and mobile phase B containing 90% acetonitrile and 10 mM NH4HCO3 in LC-MS grade H2O (both pH 8.0). The 96 resulting fractions were then pooled in a non-contiguous manner into 24 fractions and desalted using C18 solid phase extraction plates (SOLA, Thermo Fisher Scientific) followed by subsequent mass spectrometry analysis.
Data were collected using an Orbitrap Fusion Lumos mass spectrometer (Thermo Fisher Scientific, San Jose, CA, USA) coupled with a Proxeon EASY-nLC 1200 LC pump (Thermo Fisher Scientific). Peptides were separated on a 100 μm inner diameter microcapillary column packed with ~ 50 cm of Accucore C18 resin (2.6 μM, 100 Å, Thermo Fisher Scientific). Peptides were separated using a 190 min gradient of 6 - 27% acetonitrile in 1.0% formic acid with a flow rate of 350 nL/min.
Each analysis used a MS3-based TMT method as described previously (R Development Core Team, 2015). The data were acquired using a mass range of m/z 340 – 1350, resolution 120,000, AGC target 5 x 10⁵, maximum injection time 100 ms, dynamic exclusion of 120 seconds for the peptide measurements in the Orbitrap. Data dependent MS2 spectra were acquired in the ion trap with a normalized collision energy (NCE) set at 35%, AGC target set to 1.8 × 10⁴ and a maximum injection time of 120 ms. MS3 scans were acquired in the Orbitrap with HCD collision energy set to 55%, AGC target set to 2 × 10⁵, maximum injection time of 150 ms, resolution at 50,000 and with a maximum synchronous precursor selection (SPS) precursors set to 10.
Proteome Discoverer 2.4 (Thermo Fisher Scientific) was used for .RAW file processing and controlling peptide and protein level false discovery rates, assembling proteins from peptides, and protein quantification from peptides. MS/MS spectra were searched against a Swissprot human database (December 2019) with both the forward and reverse sequences. Database search criteria are as follows: tryptic with two missed cleavages, a precursor mass tolerance of 20 ppm, fragment ion mass tolerance of 0.6 Da, static alkylation of cysteine (57.02146 Da), static TMT labelling of lysine residues and N-termini of peptides (229.16293 Da), and variable oxidation of methionine (15.99491 Da). TMT reporter ion intensities were measured using a 0.003 Da window around the theoretical m/z for each reporter ion in the MS3 scan. Peptide spectral matches with poor quality MS3 spectra were excluded from quantitation (summed signal-to-noise across channels < 100 and precursor isolation specificity < 0.5). Reporter ion intensities were normalized and scaled using in-house scripts in the R framework (R Development Core Team, 2015). Statistical analysis was carried out using the limma package within the R framework (Ritchie et al., 2015).
Subcellular protein fractionation
Subcellular protein fractionation of nucleoplasmic, cytoplasmic, and chromatin-bound fractions was performed with the Subcellular Protein Fractionation Kit for Cultured Cells (Thermo fisher, 78840) with the following modifications. Fresh 5x10⁶ HUDEP-2 cells were used per sample/ timepoint and collected by centrifugation at 800g for 5min. Micrococcal nuclease was added to the chromatin-bound fraction at 5x the concentration recommended and incubated at 37°C overnight while shaking at 1000rpm on a thermomixer. An equivalent of 1x10^6 cells for each fraction was loaded on an SDS-PAGE gel for analysis by Western Blot.
Western Blot
Western blot samples were boiled in 1× SDS loading buffer to denature all proteins and separated with 4-15% gradient SDS-PAGE gels. Proteins were then transferred to PVDF membrane with a semi-dry Trans-Blot Turbo System (Biorad) at 2.5 mA/cm2. 25V for 10 min. Membranes were blocked with 5% nonfat milk for 1 hr and then incubated with primary antibodies for 1 hr at room temperature or overnight in the cold room with shaking. Excess antibodies were washed with TBS-T (50 mM Tris pH 8.0, 150 mM NaCl, 0.1% Tween 20) 3 times, and HRP-conjugated secondary antibodies were incubated for 30 min at room temperature. After 3 washes with TBS-T, the membranes were developed with Enhanced Chemiluminescent HRP Substrate (PerkinElmer, NEL104001EA). The following antibodies were used: BCL11A (ab19487, Abcam), and B-ACTIN (Santa Cruz, sc-47778 HRP, CRBN (Novus Biologicals, NBP1-91810), TUBB (Invitrogen, MA5-31940, H3 (Abcam, ab24834), RCC (Santa Cruz Biotechnology, sc-55559). All antibodies were used at 1:1,000 dilutions in TBS-T, except α-B-ACTIN at 1:5000 and α-H3 at (1:7000).
Cycloheximide chase experiments
Cycloheximide was added to HUDEP-2 cells at a non-toxic concentration of 3uM in expansion media. Fifty thousand cells were collected, and cell pellets frozen down immediately, and at various times following the addition of the compound. Western Blot was performed as described below. c-MYC was used as a positive control for cessation of cytosolic translation, whereas B-ACTIN was used as an indicator of a highly stable protein.
Azacytidine treatment, bisulfite conversion of DNA, and analysis of CpG methylation status
HUDEP-2 cells were cultured in differentiating media containing DMSO or 0.15μM dTAG-47 in addition to 0μM, 0.1μM, or 0.3μM Azacytidine. Cells were spun down and re-suspended in fresh media containing the drugs owing to the short half-life of AZA in cell culture. 0.5-1x10⁶ cells were collected, flash-frozen in LN2, and stored at −80°C. On the day of the experiment, DNA was extracted from frozen pellets with an Allprep DNA/RNA Mini Kit (Qiagen). Bisulfite conversion was performed on 1 μg DNA with an Epitect kit (Qiagen), and a 457bp region of the HBG1/2 promoter region was amplified by nested PCR as described previously (Mehta et al., 2015). Primer sequences are given in Supp Table S1. PCR amplicons were sent for Illumina Amplicon next-generation sequencing (Genewiz), yielding 2x250 bp reads.
Fastq files were aligned to each of two custom-made human genomes covering the β-globin locus only: one genome in which all the cytosines (C) are converted to uracil (U), read as thymine (T) by the Illumina sequencer, and another genome which is the wild-type human genome. The wild-type genome signifies the unconverted state as the methylated C’s are resistant to the bisulfite conversion. DNA sequences are expected to align to one of the two custom-made genomes, depending on the extent of bisulfite conversion. Because perfect alignment will not be expected due to differing methylation levels across the CpGs, we scanned for partially aligned sequences and subject them to the second step of counting. For this second step, a computer program was written to locally align each sequence to the entire amplicon again, but this time counted the number of converted cytosines at each of 8 CpG loci, which is seen as a mismatched base T compared to the wildtype genome in the local alignment. Methylation frequencies were computed at each of the CpG loci as the number of aligned sequences containing the converted cytosine at the locus, normalized by the total number of aligned sequences covering the locus (the sum of converted cytosines and unconverted cytosines).
Reverse Transcription and quantitative PCR
RNA was prepared and cDNA was amplified with the Cells-to-ct kit (ThermoFisher, 4402954). 10-30k cells were used per sample. The cDNA was diluted 1.5 times and 2 μL used for each qPCR reaction in a 384-well format with iQ SYBR Green Supermix (Bio-rad) on a Bio-rad CFX Real-Time PCR Detection system. HPRT1 was used as an endogenous control. All the RT-qPCR primers are listed in Table S1. The data were analyzed using 2−ΔCT method and visualized using GraphPad. Three technical replicates were performed, on at least two biological replicates.
QUANTIFICATION AND STATISTICAL ANALYSIS
Statistical analyses of data appropriate to each technique was performed and details iincluded in the relevant method description. Details of statistical tests used, values of n, as well as definition of center, and dispersion and precision measures are as shown in figure legends. For all experiments including NGS analyses, n represents independent BCL11AFKBPclones. For proteomics experiments, a single BCL11AFKBPclone was processed at the n number shown. No methods were used to determine whether the data met assumptions of statistical approaches.
Supplementary Material
Highlights.
PROTAC mediated degradation of BCL11A reactivates high-level γ-globin expression
BCL11A represses <31 primary target genes; HBG, HBZ most induced upon BCL11A-loss
Presence of BCL11A is the major barrier to γ-globin promoter activation
Upon BCL11A loss, increased chromatin accessibility closely follows transcription
Significance.
Reactivation of fetal hemoglobin (HbF, α2γ2) by gene therapy or editing-mediated downregulation of BCL11A expression is a tractable and promising strategy for the treatment of sickle cell disease (SCD) and β-thalassemia. To date, studies of BCL11A function have been limited to steady-state observations, which fail to capture kinetic insights into the repression or reactivation of γ-globin. Here, we utilized the “dTAG” PROTAC system to acutely degrade BCL11A protein in erythroid cells. Nascent transcription and quantitative proteomic analysis show that BCL11A represses a very small set of primary gene targets. Among these, the two fetal/embryonic globins, HBG and HBZ are the most strongly induced upon BCL11A-loss. Moreover, following removal of BCL11A, γ-globin transcription is briskly induced, followed closely by increased chromatin accessibility. By concurrent BCL11A-depletion and exposure to the DNMT1-inhibitor azacytidine, we assess the relative contributions of the presence of BCL11A and promoter CpG methylation in the γ-globin promoter to repression at the locus. The data reveal that the presence of BCL11A is the primary barrier to γ-globin transcription. In summary, our data temporally uncouple transcriptional induction, chromatin accessibility, and DNA methylation at the γ-globin locus in erythroid cells. The paucity of primary targets of BCL11A and dominance of globins in the BCL11A-depleted proteome provides a proof-of-principle for small molecule mediated degradation of BCL11A as a therapeutic option.
Acknowledgments
We thank the Viral Core at BCH, Nascent Transcriptomics Core at HMS, Mouse Gene Manipulation Core at BCH, Molecular Biology Core Facility at DFCI; Brenda A Schulman and Arno Alpi for advice; Igor Paron for technical assistance. This work was supported by R01 HL032259 grant and the HHMI.
Declaration of interests
E.S.F. is a Founder, SAB member and equity holder in Civetta Therapeutics, Jengu Therapeutics (board member), Neomorph Inc, and Proximity Therapeutics, SAB member and equity holder in Avilar Therapeutics and Photys Therapeutics, and a consultant to Novartis, Sanofi, Deerfield, and EcoR1. The Fischer lab receives or has received research funding from Novartis, Astellas, Ajax, Voronoi, Interline, and Deerfield. B.N. is an inventor on patent applications related to the dTAG system (WO/2017/024318, WO/2017/024319, WO/2018/148440, WO/2018/148443, and WO/2020/146250). K.A.D is a consultant to Kronos Bio and Neomorph Inc. SHO is a consultant for Syros Pharmaceuticals and serves on the SAB of PerterBio. SHO is also the inventor on issued patents related to BCL11A, which are licensed by Boston Children’s Hospital. Other authors declare no competing interests.
Footnotes
Publisher's Disclaimer: This is a PDF file of an unedited manuscript that has been accepted for publication. As a service to our customers we are providing this early version of the manuscript. The manuscript will undergo copyediting, typesetting, and review of the resulting proof before it is published in its final form. Please note that during the production process errors may be discovered which could affect the content, and all legal disclaimers that apply to the journal pertain.
Inclusion and Diversity statement
One or more of the authors of this paper self-identifies as living with a disability.
Reference
- Aebersold R and Mann M (2016) Mass-spectrometric exploration of proteome structure and function. Nature 537(7620): 347–355. [DOI] [PubMed] [Google Scholar]
- Amemiya HM, Kundaje A and Boyle AP (2019) The ENCODE Blacklist: Identification of Problematic Regions of the Genome. Scientific reports 9(1): 9354. [DOI] [PMC free article] [PubMed] [Google Scholar]
- Barnett KR, Decato BE, Scott TJ, et al. (2020) ATAC-Me Captures Prolonged DNA Methylation of Dynamic Chromatin Accessibility Loci during Cell Fate Transitions. Molecular cell 77(6). Elsevier: 1350–1364.e6. [DOI] [PMC free article] [PubMed] [Google Scholar]
- Canver MC, Smith EC, Sher F, et al. (2015) BCL11A enhancer dissection by Cas9-mediated in situ saturating mutagenesis. Nature 527(7577): 192–197. [DOI] [PMC free article] [PubMed] [Google Scholar]
- Chen S, Sun S, Moonen D, et al. (2019) CRISPR-READI: Efficient Generation of Knockin Mice by CRISPR RNP Electroporation and AAV Donor Infection. Cell reports 27(13): 3780–3789.e4. [DOI] [PMC free article] [PubMed] [Google Scholar]
- Chung HK, Jacobs CL, Huo Y, et al. (2015) Tunable and reversible drug control of protein production via a self-excising degron. Nature chemical biology 11(9). Nature Publishing Group: 713–720. [DOI] [PMC free article] [PubMed] [Google Scholar]
- Danecek P, Bonfield JK, Liddle J, et al. (2021) Twelve years of SAMtools and BCFtools. GigaScience 10, giab008. [DOI] [PMC free article] [PubMed] [Google Scholar]
- Dann GP, Liszczak GP, Bagert JD, et al. (2017) ISWI chromatin remodellers sense nucleosome modifications to determine substrate preference. Nature 548(7669). Nature Publishing Group: 607–611. [DOI] [PMC free article] [PubMed] [Google Scholar]
- Donovan KA, An J, Nowak RP, et al. (2018) Thalidomide promotes degradation of SALL4, a transcription factor implicated in Duane Radial Ray syndrome. eLife 7. DOI: 10.7554/eLife.38430. [DOI] [PMC free article] [PubMed] [Google Scholar]
- Elrod ND, Henriques T, Huang K-L, et al. (2019) The Integrator Complex Attenuates Promoter-Proximal Transcription at Protein-Coding Genes. Molecular cell 76(5): 738–752.e7. [DOI] [PMC free article] [PubMed] [Google Scholar]
- Esrick EB, Lehmann LE, Biffi A, et al. (2021) Post-Transcriptional Genetic Silencing of BCL11A to Treat Sickle Cell Disease. The New England journal of medicine 384(3): 205–215. [DOI] [PMC free article] [PubMed] [Google Scholar]
- Frangoul H, Altshuler D, Cappellini MD, et al. (2021) CRISPR-Cas9 Gene Editing for Sickle Cell Disease and β-Thalassemia. The New England journal of medicine 384(3): 252–260. [DOI] [PubMed] [Google Scholar]
- Gillet LC, Navarro P, Tate S, et al. (2012) Targeted data extraction of the MS/MS spectra generated by data-independent acquisition: a new concept for consistent and accurate proteome analysis. Molecular & cellular proteomics: MCP 11(6): O111.016717. [DOI] [PMC free article] [PubMed] [Google Scholar]
- Goren A, Simchen G, Fibach E, et al. (2006) Fine tuning of globin gene expression by DNA methylation. PloS one 1. journals.plos.org: e46. [DOI] [PMC free article] [PubMed] [Google Scholar]
- Guda S, Brendel C, Renella R, et al. (2015) miRNA-embedded shRNAs for Lineage-specific BCL11A Knockdown and Hemoglobin F Induction. Molecular therapy: the journal of the American Society of Gene Therapy 23(9): 1465–1474. [DOI] [PMC free article] [PubMed] [Google Scholar]
- Hossain M, Sher F, Seruggia D, et al. (2018) Rational Targeting of a NuRD Sub-Complex for Fetal Hemoglobin Induction Following Comprehensive in Situ Mutagenesis. Blood 132: 2342. [Google Scholar]
- Huang H-T, Seo H-S, Zhang T, et al. (2017) MELK is not necessary for the proliferation of basal-like breast cancer cells. eLife 6. eLife Sciences Publications, Ltd: e26693. [DOI] [PMC free article] [PubMed] [Google Scholar]
- Karayel Ö, Xu P, Bludau I, et al. (2020) Integrative proteomics reveals principles of dynamic phosphosignaling networks in human erythropoiesis. Molecular systems biology 16(12): e9813. [DOI] [PMC free article] [PubMed] [Google Scholar]
- King AJ, Songdej D, Downes DJ, et al. (2021) Reactivation of a developmentally silenced embryonic globin gene. Nature communications 12(1). Nature Publishing Group: 1–15. [DOI] [PMC free article] [PubMed] [Google Scholar]
- Klemm SL, Shipony Z and Greenleaf WJ (2019) Chromatin accessibility and the regulatory epigenome. Nature reviews. Genetics 20(4). Nature Publishing Group: 207–220. [DOI] [PubMed] [Google Scholar]
- Kraushaar DC, Chen Z, Tang Q, et al. (2018) The gene repressor complex NuRD interacts with the histone variant H3.3 at promoters of active genes. Genome research 28(11): 1646–1655. [DOI] [PMC free article] [PubMed] [Google Scholar]
- Kulak NA (2014) Novel Technologies Enabling Streamlined Complete Proteome Analysis. Universitätsbibliothek der Ludwig-Maximilians-Universität. [Google Scholar]
- Kulak NA, Pichler G, Paron I, et al. (2014) Minimal, encapsulated proteomic-sample processing applied to copy-number estimation in eukaryotic cells. Nature methods 11(3). Nature Publishing Group: 319–324. [DOI] [PubMed] [Google Scholar]
- Kurita R, Suda N, Sudo K, et al. (2013) Establishment of immortalized human erythroid progenitor cell lines able to produce enucleated red blood cells. PloS one 8(3). journals.plos.org: e59890. [DOI] [PMC free article] [PubMed] [Google Scholar]
- Lan X, Ren R, Feng R, et al. (2021) ZNF410 Uniquely Activates the NuRD Component CHD4 to Silence Fetal Hemoglobin Expression. Molecular cell 81(2): 239–254.e8. [DOI] [PMC free article] [PubMed] [Google Scholar]
- Langmead B and Salzberg SL (2012) Fast gapped-read alignment with Bowtie 2. Nature Methods. DOI: 10.1038/nmeth.1923. [DOI] [PMC free article] [PubMed] [Google Scholar]
- Langmead B, Trapnell C, Pop M, et al. (2009) Ultrafast and memory-efficient alignment of short DNA sequences to the human genome. Genome biology 10(3): R25. [DOI] [PMC free article] [PubMed] [Google Scholar]
- Lavelle DE (2004) The molecular mechanism of fetal hemoglobin reactivation. Seminars in hematology 41(4 Suppl 6): 3–10. [DOI] [PubMed] [Google Scholar]
- Liao Y, Smyth GK and Shi W (2014) featureCounts: an efficient general purpose program for assigning sequence reads to genomic features. Bioinformatics 30(7): 923–930. [DOI] [PubMed] [Google Scholar]
- Liu N, Hargreaves VV, Zhu Q, et al. (2018) Direct Promoter Repression by BCL11A Controls the Fetal to Adult Hemoglobin Switch. Cell 173(2): 430–442.e17. [DOI] [PMC free article] [PubMed] [Google Scholar]
- Liu N, Xu S, Yao Q, et al. (2021) Transcription factor competition at the γ-globin promoters controls hemoglobin switching. Nature genetics 53(4): 511–520. [DOI] [PMC free article] [PubMed] [Google Scholar]
- Love MI, Huber W and Anders S (2014) Moderated estimation of fold change and dispersion for RNA-seq data with DESeq2. Genome biology 15(12): 550. [DOI] [PMC free article] [PubMed] [Google Scholar]
- Ludwig C, Gillet L, Rosenberger G, et al. (2018) Data-independent acquisition-based SWATH-MS for quantitative proteomics: a tutorial. Molecular systems biology 14(8): e8126. [DOI] [PMC free article] [PubMed] [Google Scholar]
- Mahat DB, Kwak H, Booth GT, et al. (2016) Base-pair-resolution genome-wide mapping of active RNA polymerases using precision nuclear run-on (PRO-seq). Nature protocols 11(8). Nature Publishing Group: 1455–1476. [DOI] [PMC free article] [PubMed] [Google Scholar]
- Martin M (2011) Cutadapt removes adapter sequences from high-throughput sequencing reads. EMBnet.journal 17(1): 10–12. [Google Scholar]
- Martyn GE, Wienert B, Yang L, et al. (2018) Natural regulatory mutations elevate the fetal globin gene via disruption of BCL11A or ZBTB7A binding. Nature genetics 50(4): 498–503. [DOI] [PubMed] [Google Scholar]
- Masuda T, Wang X, Maeda M, et al. (2015) The LRF/ZBTB7A transcription factor is a BCL11A-independent repressor of fetal hemoglobin. Blood 126(23). American Society of Hematology: 2–2.26138535 [Google Scholar]
- Masuda T, Wang X, Maeda M, et al. (2016) Transcription factors LRF and BCL11A independently repress expression of fetal hemoglobin. Science 351(6270): 285–289. [DOI] [PMC free article] [PubMed] [Google Scholar]
- Mehta S, Williamson CM, Ball S, et al. (2015) Transcription driven somatic DNA methylation within the imprinted Gnas cluster. PloS one 10(2): e0117378. [DOI] [PMC free article] [PubMed] [Google Scholar]
- Mehta S, Buyanbat A, Zheng G, et al. (2022) High-efficiency HDR in immortalized cell lines by crude rAAV mediated donor template delivery. bioRxiv. DOI: 10.1101/2022.05.02.490359. [DOI] [Google Scholar]
- Montoliu L (2012) Mendel: a simple excel workbook to compare the observed and expected distributions of genotypes/phenotypes in transgenic and knockout mouse crosses involving up to three unlinked loci by means of a χ2 test. Transgenic research 21(3): 677–681. [DOI] [PubMed] [Google Scholar]
- Moreau K, Coen M, Zhang AX, et al. (2020) Proteolysis-targeting chimeras in drug development: A safety perspective. British journal of pharmacology 177(8). Wiley: 1709–1718. [DOI] [PMC free article] [PubMed] [Google Scholar]
- Nabet B, Roberts JM, Buckley DL, et al. (2018) The dTAG system for immediate and target-specific protein degradation. Nature chemical biology 14(5): 431–441. [DOI] [PMC free article] [PubMed] [Google Scholar]
- Nabet B, Ferguson FM, Seong BKA, et al. (2020) Rapid and direct control of target protein levels with VHL-recruiting dTAG molecules. Nature communications 11(1). Nature Publishing Group: 1–8. [DOI] [PMC free article] [PubMed] [Google Scholar]
- Nishimura K, Fukagawa T, Takisawa H, et al. (2009) An auxin-based degron system for the rapid depletion of proteins in nonplant cells. Nature methods 6(12). nature.com: 917–922. [DOI] [PubMed] [Google Scholar]
- Olsen SN, Godfrey L, Healy JP, et al. (2022) MLL::AF9 degradation induces rapid changes in transcriptional elongation and subsequent loss of an active chromatin landscape. Molecular cell. DOI: 10.1016/j.molcel.2022.02.013. [DOI] [PMC free article] [PubMed] [Google Scholar]
- Orkin SH (2021) MOLECULAR MEDICINE: Found in Translation. Med (New York, N.Y.) 2(2): 122–136. [DOI] [PMC free article] [PubMed] [Google Scholar]
- Quinlan AR and Hall IM (2010) BEDTools: a flexible suite of utilities for comparing genomic features. Bioinformatics 26(6): 841–842. [DOI] [PMC free article] [PubMed] [Google Scholar]
- R Development Core Team (2015) R Development Core Team. R: a language and environment for statistical computing. Vienna, Austria: Foundation for Statistical Computing; 2015. https://www.scirp.org > reference > ReferencesPapershttps://www.scirp.org > reference > ReferencesPapershttps://www.scirp.org > reference > referencespapershttps://www.scirp.org > reference > referencespapers. Available at: https://www.scirp.org/(S(lz5mqp453edsnp55rrgjct55))/reference/ReferencesPapers.aspx?ReferenceID=1787606. [Google Scholar]
- Ramírez F, Ryan DP, Grüning B, et al. (2016) deepTools2: a next generation web server for deep-sequencing data analysis. Nucleic acids research 44(W1): W160–5. [DOI] [PMC free article] [PubMed] [Google Scholar]
- Ritchie ME, Phipson B, Wu D, et al. (2015) limma powers differential expression analyses for RNA-sequencing and microarray studies. Nucleic acids research 43(7): e47. [DOI] [PMC free article] [PubMed] [Google Scholar]
- Robert M-A, Chahal PS, Audy A, et al. (2017) Manufacturing of recombinant adeno-associated viruses using mammalian expression platforms. Biotechnology journal 12(3). Wiley: 1600193. [DOI] [PubMed] [Google Scholar]
- Sankaran VG, Menne TF, Xu J, et al. (2008) Human fetal hemoglobin expression is regulated by the developmental stage-specific repressor BCL11A. Science 322(5909): 1839–1842. [DOI] [PubMed] [Google Scholar]
- Schick S, Grosche S, Kohl KE, et al. (2021) Acute BAF perturbation causes immediate changes in chromatin accessibility. Nature genetics 53(3). Nature Publishing Group: 269–278. [DOI] [PMC free article] [PubMed] [Google Scholar]
- Sher F, Hossain M, Seruggia D, et al. (2019) Rational targeting of a NuRD subcomplex guided by comprehensive in situ mutagenesis. Nature genetics 51(7): 1149–1159. [DOI] [PMC free article] [PubMed] [Google Scholar]
- Stengel KR, Ellis JD, Spielman CL, et al. (2021) Definition of a small core transcriptional circuit regulated by AML1-ETO. Molecular cell 81(3): 530–545.e5. [DOI] [PMC free article] [PubMed] [Google Scholar]
- Stewart-Morgan KR, Reverón-Gómez N and Groth A (2019) Transcription Restart Establishes Chromatin Accessibility after DNA Replication. Molecular cell 75(2): 284–297.e6. [DOI] [PubMed] [Google Scholar]
- Toure M and Crews CM (2016) Small-molecule PROTACS: new approaches to protein degradation. Angewandte Chemie, International Edition. Wiley Online Library. Available at: 10.1002/anie.201507978. [DOI] [PubMed] [Google Scholar]
- Tyanova S, Temu T and Cox J (2016) The MaxQuant computational platform for mass spectrometry-based shotgun proteomics. Nature protocols 11(12): 2301–2319. [DOI] [PubMed] [Google Scholar]
- Varala K, Li Y, Marshall-Colón A, et al. (2015) “Hit-and-Run” leaves its mark: catalyst transcription factors and chromatin modification. BioEssays: news and reviews in molecular, cellular and developmental biology 37(8): 851–856. [DOI] [PMC free article] [PubMed] [Google Scholar]
- Vinjamur DS and Bauer DE (2018) Growing and Genetically Manipulating Human Umbilical Cord Blood-Derived Erythroid Progenitor (HUDEP) Cell Lines. Methods in molecular biology 1698: 275–284. [DOI] [PubMed] [Google Scholar]
- Vinjamur DS, Yao Q, Cole MA, et al. (2021) ZNF410 represses fetal globin by singular control of CHD4. Nature genetics 53(5): 719–728. [DOI] [PMC free article] [PubMed] [Google Scholar]
- Wiśniewski JR, Hein MY, Cox J, et al. (2014) A “proteomic ruler” for protein copy number and concentration estimation without spike-in standards. Molecular & cellular proteomics: MCP 13(12): 3497–3506. [DOI] [PMC free article] [PubMed] [Google Scholar]
- Xu B, Wang H, Wright S, et al. (2021) Acute depletion of CTCF rewires genome-wide chromatin accessibility. London. DOI: 10.1186/s13059-021-02466-0. [DOI] [PMC free article] [PubMed] [Google Scholar]
- Xu J, Peng C, Sankaran VG, et al. (2011) Correction of sickle cell disease in adult mice by interference with fetal hemoglobin silencing. Science 334(6058): 993–996. [DOI] [PMC free article] [PubMed] [Google Scholar]
- Zhang Y, Liu T, Meyer CA, et al. (2008) Model-based analysis of ChIP-Seq (MACS). Genome biology 9(9): R137. [DOI] [PMC free article] [PubMed] [Google Scholar]
Associated Data
This section collects any data citations, data availability statements, or supplementary materials included in this article.
Supplementary Materials
Data Availability Statement
NGS and proteomics data have been deposited in GEO and ProteomeXchange/PRIDE databases respectively, and are publicly available as of the date of publication. Accession numbers are listed in the key resources table.
This paper does not report original code.
Any additional information required to reanalyze the data reported in this paper is available from the lead contact upon request.
Key Resources Table
| REAGENT or RESOURCE | SOURCE | IDENTIFIER |
|---|---|---|
| Antibodies | ||
| Rabbit Monoclonal α-BCL11A | Abcam | Cat# ab191401 |
| Mouse monoclonal α-β-ACTIN | Santa Cruz Biotechnology | Cat# Sc-4778 |
| Mouse monoclonal α-Gapdh | Abcam | Cat# ab8245 |
| Human polyclonal α-TUBB | Abexxa | Cat# abx026439 |
| Mouse monoclonal α-RCC | Santa Cruz Biotechnology | Cat# sc-55559 |
| Rabbit polyclonal α-CRBN | Novusbio | Cat# NBP1-91810 |
| Rabbit polyclonal a-c-MYC | Cell Signaling | Cat# 94025 |
| Rabbit polyclonal a-HBZ | Abcam | Cat# 228651 |
| Mouse monoclonal α-HBG | Santa Cruz Biotechnology | Cat# Sc-21756 |
| α-human CD71 PE-cy7 | eBioscience | Cat# 25-0719-42 |
| α-human CD235a FITC | BD Pharmingen | Cat# 559943 |
| α-human CD36 APC | Biolegend | Cat# 33620 |
| Rabbit polyclonal α-H4K4me3 | Actie Motif | Cat# 39915 |
| Rabbit Monoclonal α-H3K9Ac | Actie Motif | Cat# 39917 |
| Rabbit polyclonal α-H3Ac | Actie Motif | Cat# 39040 |
| Normal Rabbit IgG | Cell Signaling | Cat# 2729S |
| Goat Anti-Rabbit IgG (H + L)-HRP Conjugate | Bio-Rad Laboratories | Cat# 1706515 |
| Goat Anti-Mouse IgG (H + L)-HRP Conjugate | Bio-Rad Laboratories | Cat# 1706516 |
| Rabbit polyclonal α-H3 | Abcam | Cat# 1791 |
| Hemoglobin alpha Antibody - BSA Free | Novusbio | Cat# NB110-41083 |
| Anti-Hemoglobin β Antibody (37-8) | SantaCruz | Cat# sc-21757 |
| Biological samples | ||
| pAAV-IRES-hrGFP-mWnt3a | Rodriguez et al 2014 | Addgene: 89771 |
| Chemicals, peptides, and recombinant proteins | ||
| dTAG47 and dTAG47-ve | Nabet et al, 2018 | N/A |
| Cycloheximide | MilliporeSigma | Cat# C4859 |
| Azacytidine | Cayman chemical | Cat# 11164 |
| Asunaprevir | Cayman chemical | Cat# 20835 |
| Alt-R® S.p. Cas9 Nuclease V3 | IDT | Cat# 1081059 |
| Critical commercial assays | ||
| Subcellular Protein Fractionation Kit for Cultured Cells | ThermoFisher | Cat# 78840 |
| D-10 Hemoglobin A1c Program | BioRad laboratories | Cat# 12000949 |
| Deposited data | ||
| ChIP-seq, ATAC-seq, PRO-seq | This paper, GEO database | GSE194348 |
| Multiplexed global proteome analysis with TMT quantitation | This paper, PRISM database | PXD030307 |
| LC-MS/MS global proteome data (DIA) | This paper, ProteomeXchange database | PXD030307 |
| Mouse: MEL cells | Stuart Orkin | N/A |
| Experimental models: Cell lines | ||
| HUDEP-2 | Kurita et al, 2013 | N/A |
| Experimental models: Organisms/strains | ||
| C57BL/6J mice | Jackson labs | RRID:IMSR_JAX:000664 |
| Software and algorithms | ||
| ImageJ | ImageJ | https://imagej.nih.gov/ij/ |
| GraphPad Prism Software | Prism | https://www.graphpad.com |