

Abstract
A fundamental mechanism that all eukaryotic cells use to adapt to their environment is dynamic protein modification with monosaccharide sugars. In humans, O-linked N-acetylglucosamine (O-GlcNAc) is rapidly added to and removed from diverse protein sites as a response to fluctuating nutrient levels, stressors, and signaling cues. Two aspects remain challenging for tracking functional O-GlcNAc events with chemical strategies: spatial control over subcellular locations and time control during labeling. The objective of this study was to create intracellular proximity labeling tools to identify functional changes in O-GlcNAc patterns with spatiotemporal control. We developed a labeling strategy based on the TurboID proximity labeling system for rapid protein biotin conjugation directed to O-GlcNAc protein modifications inside cells, a set of tools called “GlycoID.” Localized variants to the nucleus and cytosol, nuc-GlycoID and cyt-GlycoID, labeled O-GlcNAc proteins and their interactomes in subcellular space. Labeling during insulin and serum stimulation revealed functional changes in O-GlcNAc proteins as soon as 30 min following signal initiation. We demonstrated using proteomic analysis that the GlycoID strategy captured O-GlcNAcylated “activity hubs” consisting of O-GlcNAc proteins and their associated protein–protein interactions. The ability to follow changes in O-GlcNAc hubs during physiological events such as insulin signaling allows these tools to determine the mechanisms of glycobiological cell regulation. Our functional O-GlcNAc data sets in human cells will be a valuable resource for O-GlcNAc-driven mechanisms.
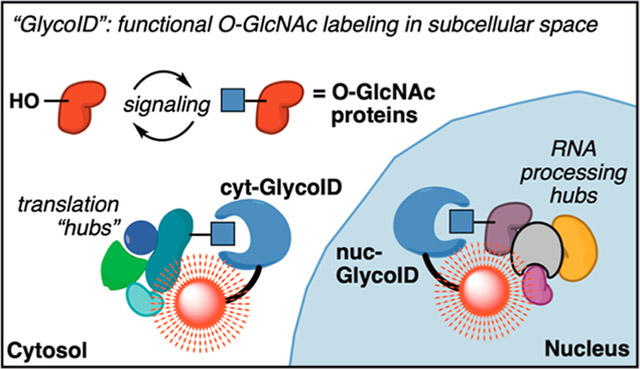
Graphical Abstract
INTRODUCTION
The O-GlcNAc modification on proteins (O-linked N-acetylglucosamine) is a nutrient- and condition-sensing post-translational modification essential for all mammalian cells to adapt to their microenvironment.1,2 Thousands of O-GlcNAc sites3,4 regulate cell biology, including signaling and transcription, in both nutrient-driven5,6 and nutrient-independent7,8 roles. Protein O-GlcNAcylation is cycled by two proteins, O-GlcNAc transferase (OGT) and O-GlcNAcase (OGA) (Figure 1A).1 The OGT gene can produce three isoforms, each of which is most active in a distinct cellular location: nucleocytoplasmic ncOGT is primarily found in the nucleus; mitochondrial mOGT is found in mitochondria; and short sOGT, which lacks a nuclear localization signal and is therefore mainly cytosolic.9,10 During insulin signaling, OGT is known to move to the plasma membrane, where it is then active on membrane proteins.11 Therefore, a crucial facet of O-GlcNAc regulation depends on the spatial location of target proteins in the cell and which isoform(s) of OGT is produced at a given time (Figure 1B).
Figure 1.

Protein O-GlcNAc post-translational modifications allow cells to rapidly adapt to changes in their environments, requiring intracellular tools for functional labeling. (A) O-GlcNAc modifications are cycled by two enzymes on 1000s of known substrates, occurring at varying timescales and driven by fluctuations in nutrients, cell stressors, or signaling cues. (B) OGT isoforms localize to and move between subcellular compartments, enabling spatiotemporal control of protein functions in cells. (C) The GlycoID system for live-cell O-GlcNAc labeling. The GlcNAc-binding lectin GafD localized a proximity labeling enzyme TurboID to O-GlcNAcylated proteins. Treatment with the TurboID substrate (biotin)-labeled proximal proteins in ca. 10 nm radius. Subcellular targeting enabled spatial labeling. Changes in cellular O-GlcNAc proteins and proximal interactomes were obtained in live cells under serum or insulin stimulation. (D) Comparison of two reported O-GlcNAc-active proximity labeling systems, OGA-BioID (ref 20), and the substrate-recognition tetratricopeptide repeat region (TPR) domain of OGT, OGT-TRP-BioID (ref 21). The complete lists of proteins share modest overlap (11–16%), but each label has distinct sets of O-GlcNAc-related protein interactomes.We note that GlycoID and OGT-TPR-BioID were performed in HeLa cells and OGA-BioID is reported in HepG2 cells so this comparison could be affected by cell type-specific proteome differences.
A second mechanism for O-GlcNAc regulation is time-based because O-GlcNAc modifications can be dynamically removed by OGA. In this vein, mammalian cells regulate the balance of OGT/OGA concerning overall O-GlcNAc levels, employing a variety of mechanisms including regulatory modifications,11 expression,12,13 as well as levels of OGT and OGA pre-mRNA transcripts.14 In particular, this mRNA regulation via alternative splicing enables cells to respond to O-GlcNAc perturbations within 30 min14 During OGT/OGA rebalancing, O-GlcNAc events in this 30 min phase are increasingly recognized as critical for a wide range of cellular functions11,15-18.
Recent advances in spatial identification of glycosylated proteins have been developed using proximity labeling tools, including ascorbate peroxidase (APEX)-catalyzed cell-surface galactosamine glycans.19 Toward GlcNAc-active enzymes, biotin ligase-catalyzed proximity labeling and identification (BioID) tools have been directed for protein–protein interactomes of OGA20 and OGT,21 revealing important insights about how protein–protein interactions regulate each protein. These tools fuse BioID to full-length OGA or the TPR of OGT, thought to be the substrate-binding region. The OGA-BioID constructs were expressed primarily in the cytosol,20 and the OGT-TPR-BioID was expressed in both the nucleus and the cytosol.21 To date, no proximity labeling tool has been directly targeted to O-GlcNAc sugar modifications. The lack of a direct O-GlcNAc-directed intracellular labeling tool makes performing defined spatial and temporal GlcNAc-labeling reactions in live-cell settings difficult, leading to a recognized gap in strategies to follow O-GlcNAc with spatiotemporal precision.22,23
Here, we report a strategy that uses intracellular O-GlcNAc-labeling constructs targeted to different cell locations. We rely on the recent discovery and optimization of biochemical proximity labeling protein domain, TurboID,24 coupled to the O-GlcNAc-binding domain GafD25,26 to enable intracellular labeling of O-GlcNAcylated proteins and any associated protein complexes. These tools, which we call “GlycoID,” revealed functional O-GlcNAc “activity hubs” that responded to conditions in live cells, including insulin stimulation and serum feeding (Figure 1C). Comparing the protein targets identified by GlycoID against the prior OGA-BioID20 and OGT-BioID21 results revealed a distinct set of proteins between the three substrate-targeting systems (Figure 1D), with ca. 11–16% overlap between each set of proximity labeling systems. Spatial control within cells was achieved using targeted GlycoID constructs to the nucleus or cytoplasm, revealing location-specific O-GlcNAc hubs. Rapid GlycoID labeling conditions within 30 min of signal induction confirmed the possibility of tracking O-GlcNAc modifications in short timescales relevant to signal transduction. Here, we used these GlycoID tools to establish a method for intracellular O-GlcNAc labeling of functional protein hubs during insulin signaling and growth serum nutrient sensing.
RESULTS AND DISCUSSION
Design of GlycoID Tools for Intracellular O-GlcNAc Labeling.
We designed proximity labeling systems for intracellular, O-GlcNAc-driven protein tagging by fusing the proximity labeling domain miniTurboID (mTurbo) to the GlcNAc-binding lectin GafD27 (Figure 2A). We chose mTurbo because it uses the nontoxic substrate biotin to attach nonhydrolyzable biotin tags to proteins within a small, ca. <10 nm radius from a bound target protein. The relatively modest 28 kDa size of mTurbo enables efficient expression in human cell lines when fused to protein-targeting domains.24 Furthermore, since the parent biotin ligase BirA requires substantial biotin for labeling (KM ≈ 5 μM),28 we can cleanly conduct cellular labeling in media that lack biotin, including the popular Dulbecco’s modified Eagle’s media (DMEM). Finally, APEX-based labeling was not selected due to known effects of H2O2 treatment on O-GlcNAc levels in cells.20 GafD was chosen as the GlcNAc-binding partner of interest because of its selectivity for GlcNAc-linked molecules over other sugars, including >10-fold binding selectivity over glucose-linked molecules, >100-fold selectivity over GalNAc, and no detectable binding against mannose, fucose, galactose, or sialic acid sugars.29 Even though GafD is thought to have evolved as a secreted protein in bacteria to bind terminal GlcNAc residues on mammalian cell surface N-glycans,25 GafD has been artificially expressed within mammalian cells to successfully measure intracellular O-GlcNAc modifications on soluble proteins.26,30 GafD’s reversible and selective O-GlcNAc-binding activity versus nonmembrane-linked glycans was attractive because intracellular GafD offered the possibility of directing our tools to multiple GlcNAc-modified soluble proteins within cells rather than cell surface labeling. Limiting GafD expression to defined cellular locations is a reported strategy to add further specificity, including a possibility to avoid binding glycogen or other glucose-containing biomolecules in the cytosol.26
Figure 2.

Confirmation of GlycoID labeling. (A) Construct design for the GlycoID O-GlcNAc proximity labeling systems. mTurbo = miniTurboID system only (undirected control). GlycoID = GlcNAc-directed system. cyt = cytosol and nuc = nucleus targeting. Immunofluorescence detection of cellular location for each construct. (B) Expression of the indicated construct in HeLa cells. V5 and HA = epitope tags for immunoblotting. (C) Biotin induction at 500 μM, 0.5 h reaction, followed by cell lysis and total cell blotting. Dual-fluorescence blots were probed with a pan-O-GlcNAc antibody (O-GlcNAc MultiMAb) and visualized with an AlexaFluor-555 secondary (green) and streptavidin-Cyanine5 (red) fluorescent conjugates. Strongly overlapping (gold color) bands are indicated by asterisks. (D) Global O-GlcNAc blot following expression of GlycoID constructs for 48 h in HeLa cells.
We used the reported structures of GafD (1oio)31 and BirA (3rux)32 to design our constructs bearing an N-terminal GafD, a short linker containing an HA or V5 tag for immunoblotting and immunofluorescence, and the C-terminal mTurbo domain containing a localization sequence (whole sequences found in Table S3). We hypothesized that GafD-mTurboID constructs, referred to as GlycoID, would bind GlcNAc residues on intracellular proteins for covalent biotin labeling. Because TurboID constructs label proteins in a ca. 10 nm radius around their binding partners, we additionally expected that GlycoID could label the interactomes of O-GlcNAcylated proteins in situ. Transient binding/release of the constructs from targets could label a diverse array of O-GlcNAcylated protein complexes during intracellular functions, including signaling events such as insulin stimulation.
O-GlcNAcylation primarily occurs in the nucleus and cytoplasm of cells.33 We generated two GlycoID constructs that localized to these subcellular compartments, cyt-GlycoID and nuc-GlycoID, using mTurbo plasmids contributed by the Ting group (Figure 2A).24 As control constructs that were not directed to GlcNAc-modified proteins, we expressed cyt-mTurbo and nuc-mTurbo that lacked the GafD domain but maintained cytosolic or nuclear expression patterns, as judged by immunofluorescence staining against the V5- and 3xHA-expression tags (Figure 2A). Transient expression of all four constructs proceeded smoothly in HeLa (Figure 2B) and HEK293T cells (Figure S1).
The activity of these constructs to biotinylate intracellular proteins was shown by incubating GlycoID-expressing cells with 100 μM biotin for 6 h, followed by cell lysis and immunoblotting for O-GlcNAcylation and biotinylation (Figure 2C). Verifying O-GlcNAc binding and labeling activity was shown by dual imaging with anti-O-GlcNAc/AF555 (Figure 2C, green signals) overlaid with streptavidin/Cy5 (Figure 2C, red signals). Gold overlapping bands suggested on-target GlycoID labeling of O-GlcNAcylated proteins in HeLa cells, with more substantial overlap observed in the cyt-GlycoID system. We saw some differences in O-GlcNAc staining (fluorescent green bands, Figure 2C), leading us to investigate the effect of GlycoID expression. O-GlcNAc levels are profoundly sensitive to nutrient, stress, and signaling conditions11,34-36 and can rebalance within 30 min of O-GlcNAc disruptions.14,37 To verify that overexpression of GlcNAc-binding constructs did not disrupt O-GlcNAc functions and affect cellular O-GlcNAc levels, we performed a global O-GlcNAc immunoblotting experiment in cells exposed to standard GlycoID labeling conditions (Figure 2D). We observed minimal disruptions between the four proximity labeling constructs using the O-GlcNAc MultiMAb pool of antibodies raised against nonspecific O-GlcNAc epitopes and traditional chemiluminescence detection, which gives a stronger signal than the fluorescent blotting system.
Optimization and Validation of Intracellular O-GlcNAc Labeling.
We characterized the labeling activity of GlycoID constructs following transient expression. To initiate proximity labeling, we expressed GlycoID constructs in HeLa cells for 48 h. Treatment of biotin in a range from 25 to 500 μM concentrations was applied from an aqueous stock, and labeling reactions were allowed to proceed from 10 min to 6 h (Figure 3A). We observed significant dose- and time-dependent labeling of soluble nucleocytoplasmic proteins in HeLa cells. Balancing concentration and time identified detectable labeling as soon as 10 min at 500 μM [biotin], compared to maximal labeling, which peaked under all concentrations at 6 h. Overnight labeling did not lead to more robust labeling. Complete activity blots are shown in Figure S2.
Figure 3.

Activity optimization for GlycoID labeling in HeLa cells. (A,B) Concentration and time course for the indicated construct. Complete blots are shown in Figure S2. Biotinylated proteins were visualized using a streptavidin-Cy5 fluorescent conjugate. (C,D) O-GlcNAc engineering with RNA silencing of OGT or OGA (siOGT or siOGA, respectively), followed by GlycoID labeling with biotin. Knockdowns were initiated after 48 h of GlycoID expression and 24 h before labeling with biotin using a Horizon Discovery “SMART pool” scramble control, OGT knockdown pool, or OGA knockdown pool as a combination of four siRNA oligonucleotides per target. Indicated immunoblots are shown as controls for each experiment.
We attempted to engineer overall O-GlcNAc levels in cells to confirm specificity for GlcNAc-driven protein labeling. Our constructs’ partial validation of O-GlcNAc binding came from control experiments where either OGT or OGA, the two enzymes that add and remove O-GlcNAc, was suppressed before nuc-GlycoID labeling was labeled induced with biotin treatment. We hypothesized that RNA silencing (siRNA) directed to endogenous OGT or OGA would affect O-GlcNAc levels but not the expression of GlycoID, leading to altered labeling. We found that knockdown of OGT led to a suppression of OGT protein levels. However, the number of biotin-labeled protein bands after 24 h of siRNA-OGT (siOGT) treatment was not significantly perturbed for either construct (Figure 3C,D and C-F). On the other hand, knockdown of OGA (siOGA) was expected to elevate both O-GlcNAc levels and labeling. We observed slightly elevated O-GlcNAcylation levels and the intensity of the biotin bands versus scrambled siRNA control (Figure 3C,D and C-F). The relatively weak intensity of the dual-fluorescence blotting was a limitation for definitive effect tracking. Still, we were encouraged to see a noticeable effect with transient OGA knockdown. Longer knockdown times or increased siRNA concentrations could optimize, but we observed some cell toxicity during the OGT knockdown. Tight regulation of OGT and OGA levels is well-documented,13,14,37 so we propose that our short knockdown studies led to concomitant, feedback-based reduction of OGT and OGA that lessened the effects of these experiments. Complete blots for the GlcNAc engineering experiments are shown in Figure S3, alongside densitometry quantifications for additional clarity (Figure S3C-F).
Overall, the O-GlcNAc suppression and elevation results had a subtle effect on GlycoID-driven labeling patterns, with slightly increased labeling upon OGA knockdown but little to no impact upon OGT knockdown for 24 h. Mammalian cells are well established to rapidly attenuate OGT and OGA protein levels upon inhibition or knockdown of either species to maintain O-GlcNAc homeostasis, so we hypothesize that OGT/OGA regulation over the 24 h periods used for O-GlcNAc elevation or suppression led to reduced impact on overall GlycoID labeling patterns.14
GlycoID identifies physical hubs of O-GlcNAcylated protein clusters in subcellular space.
The targeted constructs cyt-GlycoID versus nuc-GlycoID gave a striking difference in band patterns (Figure 3A), as we had expected from labeling in two different subcellular locations. To compare specific proteins between the two cellular compartments, we carried out tandem mass spectrometry (MS/MS)-based proteomics (LC–MS/MS) to identify which proteins were labeled by our targeted GlycoID constructs. HeLa cells that expressed nuc-GlycoID were compared with cells that expressed nuc-mTurbo as a nonsugar directed control in replicates of four per condition. Each construct was expressed in HeLa cells grown in DMEM media, which lack biotin, to prevent premature labeling (see Figure 3A, 0 μM biotin). Biotin labeling was induced at 48 h postexpression by adding 100 μM biotin and incubating for 6 h at 37 °C to obtain maximum intracellular labeling. Proteomic identification hits were chosen using the default significance (p < 0.05) and fold-enrichment (log2 > 0.5) cutoffs in Perseus (version 1.6.2.1). Hits also had to satisfy the condition of being detected in at least three of the four replicates and have at least three unique peptide matches during MaxQuant processing. We used label-free quantification as a relative difference between mTurbo-only constructs and the full GlycoID constructs. Blots that confirmed similar labeling efficiency between all replicates are shown in Figure S4.
In the nuclear-targeted experiment, we identified 98 proteins exclusive to the nuc-GlycoID versus nuc-mTurbo condition (Figure 4A). Volcano plot analysis showed an additional 4 proteins identified by nuc-GlycoID over nuc-mTurbo (Figure 4B). Comparison with the O-GlcNAcome33 databank revealed that 49% of these 102 identified proteins were known O-GlcNAc proteins. A unique strength of proximity labeling is showing proteins that physically associate with the target proteins in subcellular space.38 To determine whether the remaining 51% of these proteins correspond to O-GlcNAc protein-binding partners, we used the STRING-db39 to analyze reported protein–protein interactions (PPIs) between the nuc-GlycoID data set. Our STRING settings only utilized experimentally verified PPIs. Interestingly, most non-O-GlcNAc protein hits (31/52) are known to have physical associations with O-GlcNAc proteins labeled by nuc-GlycoID. Based on the labeling radius of TurboID,24 these proteins were expected to be within 10 nm of the target-bound GlcNAc glycoproteins. Gene ontology analysis using k-means clustering revealed that these associated proteins comprised five functional O-GlcNAc hubs: mRNA binding, transcription factors, nucleotide binding, gene expression, and splicing (Figure 4C). The PPI enrichment p-value, which compares the observed connections (edges between nodes) in the interaction network against what would be expected with no enrichment, averaged between p = 1.19 × 10⁻⁵ and <1.0 × 10⁻¹⁶. For example, the highly connected splicing cluster had 60 observed PPI edges in our STRING analysis versus the expected number of five “random” PPIs based on the sizes of these proteins alone. This extremely high enrichment of functional protein activity hubs reveals that nuc-GlycoID labeled known interaction partners of O-GlcNAcylated proteins with very high confidence (significance). A summary of the clustering analysis with essential O-GlcNAc proteins identified is shown in Table 1.
Figure 4.

Comparative proteomics with GlycoID constructs. (A) Exclusive hits between GlcNAc-binding nuc-GlycoID and control nuc-mTurbo, 6 h at 100 μM biotin labeling. (B) Enrichment analysis between nuc-mTurbo and nuc-GlycoID shows statistically significant hits above the volcano plot. (C) Physical interactions between nuc-GlycoID hits reveal functional clusters with critical O-GlcNAc linkages. (D) Protein groups labeled by nuc-GlycoID, as defined in the text. (E–H) Analysis for cyt-GlycoID versus cyt-mTurbo. Full-sized STRING plots with labeled O-GlcNAc hits are found in Figures S5 and S7-S9.
Table 1.
GlycoID Labels O-GlcNAc Clusters in Defined Cell Locations. Full Activity Conditions: 6 h with 100 μM Biotin
| cluster | # of nodes (proteins) |
# of edges (interactions) |
PPI enrichment p-value |
sample proteins | |
|---|---|---|---|---|---|
| nuc-GlycoID | mRNA binding | 28 | 46 | <1.0 × 10⁻¹⁶ | DHX9, RMB14, ZFR, WBP11 |
| splicing | 19 | 60 | <1.0 × 10⁻¹⁶ | SF1, SF3A1, SF3B2, RBM25 | |
| transcription factors | 19 | 5 | 4.59 × 10⁻⁵ | HCFC1, JunB, CCAR2, FUBP1 | |
| gene expression | 19 | 14 | 1.19 × 10⁻⁵ | SYMPK, MBNL1, NONO, COIL, AGFG1 | |
| metabolism and signaling | 14 | 7 | 5.41 × 10⁻⁵ | NOLC1, DHDH4, DIDO1, NKRF | |
| Nuc-mTurbo | none | 14 | 1 | 1.0 (no significance) | HSPA8, NUMA, HIST1H1D |
| cyt-GlycoID | translation | 26 | 31 | 2.39 × 10⁻¹⁰ | EF1A1, RPL18, LYAR, LLPH |
| RNA binding | 24 | 10 | 3.34 × 10⁻⁶ | GNL3, RRP1B, THOC2 | |
| cytoskeleton | 17 | 16 | 6.66 × 10⁻¹⁶ | ACTB, ACTA, RRBP1 | |
| cyt-mTurbo | translation | 22 | 48 | 4.44 × 10⁻¹⁶ | RPL3, EIF5B, RPS26 |
| glycolysis | 7 | 6 | 2.217 × 10⁻¹¹ | GAPDH, ALDOA, ENO1 | |
| ubiquitinylation | 9 | 2 | 0.00226 | UBAP2, TRIP12 | |
| spliceosome | 12 | 2 | 0.0337 | SRSF11, SREK1, U2SURP |
Further analysis of possible sources of O-GlcNAc-driven labeling on the remaining proteins without known O-GlcNAc sites or PPIs with O-GlcNAcylated proteins was performed using OGT-PIN, the O-GlcNAc transferase protein-interaction network.40 OGT is known to form functional complexes with various activity hubs in cells,41 including histone chaperone complexes42 and tet protein DNA demethylation complexes,43 and there is a strong likelihood of coincidental proximity-based labeling of proteins within a 10 nm radius of an OGT hub. We used the OGT-PIN to reveal that a third group of proteins labeled by GlycoID constructs overlap with OGT-PIN data. Together, we divided the GlycoID analysis into four groups: Group 1 proteins with known O-GlcNAc sites; Group 2 proteins that interact with O-GlcNAcylated proteins (via STRING-db); Group 3 proteins that form complex with OGT; and Group 4 proteins with no O-GlcNAc connection, likely experimental noise from high-abundance proteins such as thioredoxin. The nuc-GlycoID results from HeLa cells are summarized in Figure 4D. The complete lists of gene names, statistics, and fold-enrichment values for all identified proteins are presented in Appendix Table 1. The entire STRING plot, with labeled groups, is found in Figure S5.
We also performed STRING analysis on the nontargeted nuc-mTurbo-only constructs (Figure S6). The nuc-mTurbo construct identified only 14 proteins in total. These proteins did not cluster into any discrete functions (Table 1) and were primarily high-abundance proteins such as heat shock proteins (HSPA8), histones (HIST1H1D), and microtubule-binding proteins (NUMA1), which indicated that nuclear-mTurboID labeling was dictated more by protein abundance. The whole STRING plot, with labeled groups, is found in Figure S7.
Next, we conducted the cytosolic GlycoID experiment by comparing cyt-GlycoID labeling with cyt-mTurbo-expressing HeLa cells. After a 6 h induction with 100 μM biotin, 32 proteins were exclusive to the cyt-GlycoID (Figure 4e). Volcano plot analysis revealed an additional 37 proteins significantly identified between cyt-GlycoID and cyt-mTurbo (Figure 4f). STRING-db analysis of PPIs reveals that cyt-GlycoID can also identify functional O-GlcNAc hubs in the cytosol of cells (Figure 4g). For cyt-GlycoID, 30% of the data set (21 hits) was known O-GlcNAc proteins, and the majority of the non-O-GlcNAc labeled hits (28 of the remaining 49) are known to be physically associated with these O-GlcNAc proteins (Figure 4h). The cyt-GlycoID results in HeLa cells gave three significant clusters: RNA binding, cytoskeleton dynamics, and translation. The PPI enrichment p-values ranged from p = 3.34 × 10⁻⁶ to 6.66 × 10⁻¹⁶, revealing that cyt-GlycoID labels known protein clusters with high functional significance. A summary of cyt-GlycoID clusters and important O-GlcNAc proteins is found in Table 1. The entire STRING plot, with labeled groups, is located in Figure S8.
Conversely, four significant functional clusters were observed with cyt-mTurbo (Figure S6). The cyt-mTurbo functional clusters had diverging roles of ubiquitinylation, glycolysis, spliceosome (not observed in cyt-GlycoID), and one overlapping role, translation (Table 1). These different labeled functions indicated that cyt-mTurbo and cyt-GlycoID were directed to and labeled alternative complexes over the 6 h labeling period. The full STRING plot for cyt-mTurbo with labeled groups is found in Figure S9.
Among the directly O-GlcNAcylated proteins we observed with nuc-GlycoID, HCFC1, JunB, SF1, and ZFR stood out because they are among the top 10% of the O-GlcNAcome, based on the “O-GlcNAc score” from 0 to 100 that ranks the strength of the evidence for an O-GlcNAc site on a given protein.33 These nuclear proteins are most involved in transcriptional regulation and in production and splicing of mRNA, dynamic nuclear functions that O-GlcNAc is known to regulate.14,44 Among the cyt-GlycoID hits, EF1A1, ACTB, and RRBP1 have high O-GlcNAc scores and are involved in translation and cytoskeletal movements, two essential cytosolic functions regulated by O-GlcNAcylation.45,46 Notably, we did not see several of the most common O-GlcNAcylated proteins, the nucleoporins, although their placement in the nuclear membrane might preclude GlycoID constructs from physically associating in the O-GlcNAcylated pore regions of these proteins.
One of the distinctive features of using an O-GlcNAc-targeted proximity labeling system is the ability to observe O-GlcNAcylated functional hubs made up of protein–protein interactions. The extremely high number of PPIs (up to 60) and the strong p-values between 10−5 and <10−16 suggested that the GlycoID strategy identified O-GlcNAcylated proteins and their physiological interaction partners. These O-GlcNAc interactomes may also be proximally involved in O-GlcNAc-regulated functions. These major clusters focus on transcription and mRNA splicing in the nucleus and translation in the cytosol, consistent with known O-GlcNAc transferase roles in mammalian cell proliferation41 and nutrient sensing.34-36
Functional O-GlcNAc Glycoproteomics of Nutrient Sensing and Insulin Signaling.
The intracellular nature of GlycoID allows monitoring of O-GlcNAc events in real-time and in localized subcellular space. We used our proteomic analysis workflow to analyze O-GlcNAc-related functions in cells to compare the effects of insulin stimulation following overnight serum starvation. Insulin is known to trigger changes in OGT and O-GlcNAcylation levels.11,47,48 Furthermore, engagement of the insulin receptor causes a rapid shift in OGT localization from the nucleus to the plasma membrane and cytosol between 5 and 30 min11 After 60 min, OGT leaves the plasma membrane and returns to the nucleus.11 Therefore, the spatiotemporal features of the GlycoID strategy were poised to track the functional effects of O-GlcNAc during insulin signaling.
We hypothesized that nuc-GlycoID and cyt-GlycoID could detect critical changes in O-GlcNAc-driven functional hubs following starvation versus stimulation. For these experiments, we reduced the labeling time to 30 min to fall within the known time that insulin is known to trigger changes in OGT activity.11 We chose to use HeLa cells for this experiment (ATCC #CCL-2), which display intact insulin receptor expression49 and signaling (activity shown in Figure S10B via Akt-Ser473 phosphorylation). Our initial characterization observed reliable labeling at short time points at higher biotin concentration, so we raised the biotin in these experiments to 500 μM for these 30 min labeling reactions. We performed four replicates of each condition, and hits chosen were observed in at least three of four for the analysis for nuc-GlycoID starved, +serum, or +insulin and cyt-GlycoID starved, +serum, or +insulin. For the starved cyt-GlycoID version, 2/4 proteomic runs failed to give quality data sets. For this condition alone (cyt-GlycoID, starved), we chose hits that were observed in both successful proteomic replicates. Statistical validation was performed in Perseus using the default cutoffs of p = 0.05, fold-change > ±0.5, and at least three unique peptide matches for a protein to be assigned as a high-confidence hit for further analysis. Complete protein blots that confirmed labeling efficiency between all replicates are shown in Figure S10. The full lists of gene names, statistics, and fold-enrichment values for all identified proteins in the starved versus stimulated cell conditions are found in Appendix Table 2.
We used nuc-GlycoID to compare O-GlcNAc proteins between serum-starved and insulin-stimulated O-GlcNAc-related proteins in the nucleus. We observed changes between the nucleus, where 19 proteins were differentially identified between the starved cells and 22 were identified between the insulin-stimulated cells (Figure 5A/B). Of the identified proteins in the nuc-GlycoID insulin data set, a relatively low 32% was O-GlcNAc-modified. We used STRING analysis to identify reported protein interactions between the hits (Figure 5C). We also used the OGT-PIN set to analyze the OGT interactors and split the analysis into the O-GlcNAc-related Groups 1–4, as detailed above (Figure 5D). Our k-means clustering analysis in STRING revealed only one significant functional group involved in the preribosomal assembly. The remaining proteins did not fall into a substantial grouping but included O-GlcNAcylated regulatory proteins such as ABCF1 (translation initiation) and CDK12, a kinase involved in regulating the cell cycle.50 The k-means clustering results are summarized in Table 2. The whole STRING plot, with labeled groups, is found in Figure S11.
Figure 5.

Functional O-GlcNAc proteomics with GlycoID during insulin signaling. (A) Exclusive hits between serum-starved nuc-GlycoID and insulin-stimulated nuc-GlycoID, 30 min at 500 μM biotin labeling. (B) Enrichment analysis between starved and insulin conditions; statistically significant hits are shown above the volcano plot. (C) Physical interactions between nuc-GlycoID/insulin hits revealed one functional cluster with key O-GlcNAc linkages. NS = not significant. (D) The protein groups labeled by nuc-GlycoID/insulin, as defined in the text. (E–H) Similar analysis for cyt-GlycoID-starved versus cyt-GlycoID + insulin. Fully sized STRING plots, with labeled O-GlcNAc hits, are found in Figures S11 and S12
Table 2.
Functional O-GlcNAc Labeling in Stimulated vs Serum-Starved Cellsa
| cluster | # of nodes (proteins) |
# of edges (interactions) |
PPI enrichment p-value |
sample proteins | |
|---|---|---|---|---|---|
| nuc-GlycoID + insulin | pre-ribosome assembly | 8 | 2 | 2.84 × 10⁻³ | GLN3, RPS8, PRS26 |
| no cluster | 22 | 5 | 0.0548 [not significant] | CDK12 (signaling), ABCF1 (translation) | |
| cyt-GlycoID + insulin | translation | 11 | 9 | 7.30 × 10⁻⁴ | RRP1B, EIF5B, RPL29 |
| RNA binding | 8 | 1 | 0.041 | RBBP6, SRSF11, MKI67 | |
| nuc-GlycoID + serum (10%) | RNA binding | 9 | 4 | 2.83 × 10⁻⁶ | LYAR, GL3, LLPH |
| pre-splicosome | 6 | 2 | 4.56 × 10⁻⁴ | KNOP1, RBM39 | |
| pre-ribosome | 4 | 1 | 0.0409 | BRIX1, DDX24 | |
| cyt-GlycoID + serum (10%) | translation | 14 | 17 | 1.05 × 10⁻¹⁶ | LYAR, ABCF1, EIF5B |
| pre-ribosome | 10 | 5 | 4.27 × 10—5 | RBM39, RRBP1, RRP1B |
Labeling: 30 min with 500 μM biotin
The cytosolic analysis revealed 65 starved hits versus 24 insulin-driven proteins (Figure 5E/F). STRING analysis and k-means clustering identified two significant clusters, primarily involved in translation and RNA binding (Figure 5G). There were also several nonclustered proteins involved in actin dynamics (FNLA) and fatty acid biogenesis (ACACA), two metabolic features that respond to insulin. The Group 1–4 analysis revealed that, for known O-GlcNAc proteins, cyt-GlycoID (50% Group 1 labeling) worked moderately better than nuc-GlycoID (32% Group 1 labeling) under insulin, 30 min stimulation (Figure 5H). The functional k-means clustering results are summarized in Table 2. The full STRING plot, with labeled groups, is found in Figure S12.
We also used the serum-starved cells to compare with serum-fed conditions, again at the 30 min time point with 500 μM biotin. Because serum contains both nutrients and growth factors, we hypothesized that GlycoID labeling patterns from cells stimulated by serum would also display different functional hubs. We conducted proteomic analysis for the insulin labeling (Figure S13). We observed three significant clusters in the nuc-GlycoID + serum data set, RNA binding, prespliceosome assembly, and preribosome assembly (entire STRING plot in Figure S14). We observed two significant clusters in the cyt-GlycoID + serum data set: translation and preribosome assembly. The full STRING plots, including groups, are found in Figures S14 and S15.
Overall, we observed fewer total proteins in both functional experiments compared to the first analysis of mTurbo versus GlycoID constructs. We note that the fewer proteins identified may come from two potential reasons: first, the labeling time was 0.5 versus 6 h (albeit at higher biotin concentration); second, in the nature of the comparison. Second, we compared GlycoID with or without insulin and serum in these functional experiments. Therefore, we would have lost any overlapping O-GlcNAcylated proteins that did not change in O-GlcNAc status during stimulation during GlycoID labeling between starved and stimulated. This overlap is expected due to the widespread distribution of O-GlcNAc on proteins; not all proteins will change O-GlcNAc following growth factor stimulation. Our labeling results suggested that only a subset of O-GlcNAcylated proteins actively responded to insulin or serum stimulation at the 30 min time point, which is functionally interesting. Longer induction times might reveal more widespread changes in O-GlcNAc patterns and interactomes. In our insulin labeling experiment, we observed diminished nuc-GlycoID labeling and enhanced cyt-GlycoID labeling, which is approximately the inverse of what we observed under steady-state cell conditions, where OGT is more active in the nucleus (compare Figure 4D-H versus Figure 5D-H). This spatiotemporal effect might reflect the movement of OGT toward the plasma membrane that is reported to peak at 30 min, therefore losing some activity in the nucleus and cytosol.11 Backing up this hypothesis, we did not observe some of the canonical O-GlcNAcylated insulin-signaling proteins that we expected to see, including Akt, PDK1, and IRS1, which may reflect their membrane-associated nature during insulin stimulation.51 A plasma membrane-directed GlycoID variant will likely be required to observe these proteins during insulin activity. Even though we have far from completed a full-time course study of insulin signaling and O-GlcNAc events, which is known to last until at least 4 h poststimulation and would include protein pulldowns as well as an additional plasma membrane construct, our preliminary GlycoID methods are poised to track O-GlcNAc dynamics in live cells over a variety of homeostasis, signaling, and pathological conditions.
CONCLUSIONS
Intracellular O-GlcNAc patterns change in subcellular space and real-time during signaling processes, but tools to capture these functional changes in live cells remain an emerging area. We demonstrated that proximity labeling protein constructs targeted to GlcNAc modifications, GlycoID, as an intracellular strategy to label O-GlcNAcylated proteins and their interactomes. Spatial targeting using cellular localization signals revealed different labeling patterns between O-GlcNAc interactomes in the nucleus versus cytosol. Furthermore, functional O-GlcNAc labeling experiments conducted for short, 30 min periods during insulin or serum stimulation demonstrated the ability to track O-GlcNAcylation patterns and interactome changes in real-time. This functional O-GlcNAc interactome data adds evidence to a growing area of OGT-regulated hubs of activity,40 including splicing,14 metabolism,41 and signaling.50 Despite these advances, we note limitations to our current study that we will be addressing. All experiments and data reported in this paper were performed with transient expression in human cell lines. We felt transient expression plasmids would be the most useful sharable tools and have made our constructs available on the Addgene databank (#184640 and #184641). Further applications are possible with cell lines that stably express GlycoID constructs. A more detailed time course of insulin signaling using stable-GlycoID constructs is underway in our laboratory, in which we are constructing additional mitochondrial and plasma membrane-targeted systems. Improved control over labeling can also be envisioned with peroxidase-based reagents,19 even though we initially chose to avoid APEX strategies due to the requirement for hydrogen peroxide treatment, a factor reported to modulate O-GlcNAc patterns.20 Future efforts will also be directed toward disease models, where genetic engineering can be used to validate GlycoID labeling outcomes further. At present, our tools, labeling methods, and functional data sets reported here can serve as valuable resources for determining the functional effects of dynamic O-GlcNAc modifications in live-cell settings.
METHODS
In Vitro Proximity Labeling of Live Cells.
HeLa or HEK293T cells were seeded on sterile plates and transfected with cyt-mTurbo, nuc-mTurbo, cyt-GlycoID, or nuc-GlycoID with at least 48 h of incubation in DMEM at 37 °C. Media were then replaced with media supplemented with 100 μM biotin and allowed to incubate for 6 h (or alternative times/concentrations as indicated). Then, cells were rinsed with phosphate-buffered saline (PBS) twice before freezing. Cells were harvested via scraping cells off the plates with RIPA buffer and lysed via a passage through a needle (at least 10 passes). For siRNA KD, cells were first transfected with GlycoID tools, followed by 24–48 h of expression before transfection with Dharmacon ON-TARGET plus SMART pool human OGT siRNA, SMART pool human OGA siRNA, or ON-TARGET scrambled control (nontargeting pool) siRNA 24 h before biotin induction. Plasmids generated in this research are available via the Addgene repository with ID# 184640 (cyt-GafD-mTurboID-V5) and ID# 184641 (nuc-GafD-mTurboID-HA).
Immunofluorescence Staining.
HeLa cells were seeded on eight-well glass chamber slides and transfected with TurboID or GlycoID plasmids. After 48 h of expression, cells were fixed, permeabilized, and probed for epitope tags: V5 for cytosolic constructs or HA for nuclear constructs. Anti-rabbit Alexa-Fluor555 secondary antibodies and DAPI nuclear staining were used to display localization.
Preparation of Samples for Proteomics.
Following biotin labeling, cells were harvested with 100 μL of RIPA buffer (150 mM NaCl, 0.5 mM tris, 1% NP40, 0.1% SDS) and lysed via a passage through a needle (at least 10 passes). To enrich biotinylated proteins, samples containing 400 μg of total protein were incubated with streptavidin-coated magnetic beads overnight at 4 °C. The beads were then washed with RIPA buffer, wash buffer (50 mM Tris, pH 7.4, 2% SDS), and twice more with RIPA buffer. The beads were then resuspended in DTT in PBS and treated with iodoacetamide. The beads were then washed with MS-grade water and were resuspended in MS-grade 50% MeCN/50% water. The samples were digested with Lys-C protease for 16 h and with SOLu-Trypsin for 1 h (47 °C) and then for 4 h (37 °C). The supernatants were quenched with formic acid, and the magnetic beads were removed. Samples were dried via vacuum centrifugation and stored at −80 °C.
Proteomic Liquid Chromatography–Tandem Mass Spectrometry Analysis.
Samples were solubilized in 1% trifluoroacetic acid. An EASY nLC UPLC system was used to elute peptides onto a Fusion Tribrid mass spectrometer (Thermo Scientific). MS1 profiling was performed in a 375–1600 m/z range at a resolution of 70,000. MS2 fragmentation was carried out on the top 15 ions by using a 1.6 m/z window and a normalized collision energy of 29 using higher-energy collision-induced dissociation with a dynamic exclusion of 15 s.
Proteomic Data Analysis.
All mass spectra were analyzed with MaxQuant software version 1.6.10.43. MS/MS spectra were searched against the Homo Sapiens Uniprot protein sequence database based on version June 16, 2021. Carbamidomethylation of cysteines was searched for as a fixed modification. Oxidation of methionines and acetylation of protein N-terminal and O-GlcNAc proteins termed as HexNac(ST) in MaxQuant software were searched against as variable modification. The digestion enzyme was set to trypsin and LysC in a specific mode. All other parameters were used as default in MaxQuant. Label-free quantification was selected for group-specific parameters. Using Perseus, all contaminates identified by MaxQuant (streptavidin, reversed proteins, peptides with sequences ≤2, etc.) are filtered out. Then, the data was categorically grouped, peptides filtered for presence in at least three out of four positive replicates, analyzed by t-test analysis, and plotted in a Volcano plot. Note: the serum-starved cyt-GlycoID (30 min of labeling) only had two successful proteomic runs, so for this condition, positive hits were assigned when peptides were present in both replicates. Hits were scored by t-test analysis (p < 0.05) and fold-change (log2 > ±0.05). The full, processed data are presented in Appendix Tables 1 and 2. The MS proteomic data have been deposited to the ProteomeXchange Consortium via the PRIDE partner repository with the data set identifiers PXD033026, PXD033043, PXD033044, PXD033062, PXD033063, and PXD033066.
Supplementary Material
ACKNOWLEDGMENTS
This study was supported by NIH R35GM142637-01, awarded to C.F., and an NIH Initiative for Maximizing Student Diversity (IMSD) fellowship, awarded to Z.M.N. (R25GM058905-22). The NIH:NCI Cancer Center Grant P30CA022453 to the Karmanos Cancer Institute supported contributions from the Wayne State Proteomics Core. The plasmids 3xHA-miniTurbo-NLS_pCDNA3 (Addgene plasmid #107172; http://n2t.net/addgene:107172; RRID:Addgene_107172) and V5-miniTurbo-NES_pCDNA3 were gifts from A. Ting (Addgene plasmid #107170; http://n2t.net/addgene:107170; RRID:Addgene_107170). We also thank D. Haslitt for contributing unpublished preliminary bacterial data to the overall project, G. Leonard for assistance in imaging, and S. Ayodeji for assistance with experimental optimization.
Footnotes
Supporting Information
The Supporting Information is available free of charge at https://pubs.acs.org/doi/10.1021/acschembio.2c00282.
Additional and extended methods, generation of protein constructs, protein labeling optimization, proteomic sample preparation, insulin stimulation, analysis of nonsugar-targeted labeling, analysis of serum-stimulated functional labeling, and full STRING plots for all reported labeling experiments. (PDF)
Complete lists of gene names, statistics, and fold-enrichment values for all identified proteins (XLSX)
Full lists of gene names, statistics, and fold-enrichment values for all identified proteins in the starved versus stimulated cell conditions (XLSX)
The authors declare no competing financial interest.
REFERENCES
- (1).Hart GW; Housley MP; Slawson C Cycling of O-linked β-N-acetylglucosamine on nucleocytoplasmic proteins. Nature 2007, 446, 1017–1022. [DOI] [PubMed] [Google Scholar]
- (2).Chatham J; Marchase R Protein O-GlcNAcylation: A critical regulator of the cellular response to stress. Curr. Signal Transduction Ther 2010, 5, 49–59. [DOI] [PMC free article] [PubMed] [Google Scholar]
- (3).Lund PJ; Elias JE; Davis MM Global Analysis of O-GlcNAc Glycoproteins in Activated Human T Cells. J. Immunol 2016, 197, 3086–3098. [DOI] [PMC free article] [PubMed] [Google Scholar]
- (4).Woo CM; Lund PJ; Huang AC; Davis MM; Bertozzi CR; Pitteri SJ Mapping and quantification of over 2000 O-linked glycopeptides in activated human T cells with isotope-targeted glycoproteomics (Isotag). Mol. Cell. Proteomics 2018, 17, 764–775. [DOI] [PMC free article] [PubMed] [Google Scholar]
- (5).Nagy T; Fisi V; Frank D; Kátai E; Nagy Z; Miseta A Hyperglycemia-Induced Aberrant Cell Proliferation; A Metabolic Challenge Mediated by Protein O-GlcNAc Modification. Cells 2019, 8, 999. [DOI] [PMC free article] [PubMed] [Google Scholar]
- (6).Masaki N; Feng B; Bretón-Romero R; Inagaki E; Weisbrod RM; Fetterman JL; Hamburg NM O-GlcNAcylation Mediates Glucose-Induced Alterations in Endothelial Cell Phenotype in Human Diabetes Mellitus. J. Am. Heart Assoc 2020, 9, No. e014046. [DOI] [PMC free article] [PubMed] [Google Scholar]
- (7).Dupas T; Denis M; Dontaine J; Persello A; Bultot L; Erraud A; Vertommen D; Bouchard B; Dhot J; De Waard M; Olson A; Rozec B; Rosiers CD; Bertrand L; Issad T; Lauzier B O-GlcNAc levels are regulated in a tissue and time specific manner during post-natal development, independently of dietary intake. Arch. Cardiovasc. Dis. Suppl 2020, 12, 221. [Google Scholar]
- (8).Zachara NE; Molina H; Wong KY; Pandey A; Hart GW The dynamic stress-induced “O-GlcNAc-ome” highlights functions for O-GlcNAc in regulating DNA damage/repair and other cellular pathways. Amino Acids 2011, 40, 793–808. [DOI] [PMC free article] [PubMed] [Google Scholar]
- (9).Levine ZG; Walker S The Biochemistry of O-GlcNAc Transferase: Which Functions Make It Essential in Mammalian Cells? Annu. Rev. Biochem 2016, 85, 631–657. [DOI] [PubMed] [Google Scholar]
- (10).Ju Kim E O-GlcNAc Transferase: Structural Characteristics, Catalytic Mechanism and Small-Molecule Inhibitors. ChemBioChem 2020, 21, 3026–3035. [DOI] [PubMed] [Google Scholar]
- (11).Yang X; Ongusaha PP; Miles PD; Havstad JC; Zhang F; So WV; Kudlow JE; Michell RH; Olefsky JM; Field SJ; Evans RM Phosphoinositide signalling links O-GlcNAc transferase to insulin resistance. Nature 2008, 451, 964–969. [DOI] [PubMed] [Google Scholar]
- (12).Taylor RP; Geisler TS; Chambers JH; McClain DA Up-regulation of O-GlcNAc Transferase with Glucose Deprivation in HepG2 Cells Is Mediated by Decreased Hexosamine Pathway Flux. J. Biol. Chem 2009, 284, 3425–3432. [DOI] [PMC free article] [PubMed] [Google Scholar]
- (13).Zhang Z; Tan EP; VandenHull NJ; Peterson KR; Slawson C O-GlcNAcase Expression is Sensitive to Changes in O-GlcNAc Homeostasis. Front. Endocrinol 2014, 5, 206. [DOI] [PMC free article] [PubMed] [Google Scholar]
- (14).Tan Z-W; Fei G; Paulo JA; Bellaousov S; Martin SES; Duveau DY; Thomas CJ; Gygi SP; Boutz PL; Walker S O-GlcNAc regulates gene expression by controlling detained intron splicing. Nucleic Acids Res. 2020, 48, 5656–5669. [DOI] [PMC free article] [PubMed] [Google Scholar]
- (15).Marshall S; Nadeau O; Yamasaki K Dynamic Actions of Glucose and Glucosamine on Hexosamine Biosynthesis in Isolated Adipocytes: Differential Effects on Glucosaomine 6-Phosphate, UDP-N-Acetylglucosamine, and ATP Levels. J. Biol. Chem 2004, 279, 35313–35319. [DOI] [PubMed] [Google Scholar]
- (16).Champattanachai V; Marchase RB; Chatham JC Glucosamine protects neonatal cardiomyocytes from ischemia-reperfusion injury via increased protein-associated O-GlcNAc. Am. J. Physiol.: Cell Physiol 2007, 292, C178–C187. [DOI] [PubMed] [Google Scholar]
- (17).Song M; Kim H-S; Park J-M; Kim S-H; Kim I-H; Ryu SH; Suh P-G O-GlcNAc transferase is activated by CaMKIV-dependent phosphorylation under potassium chloride-induced depolarization in NG-108-15 cells. Cell. Signalling 2008, 20, 94–104. [DOI] [PubMed] [Google Scholar]
- (18).Dias WB; Cheung WD; Wang Z; Hart GW Regulation of Calcium/Calmodulin-dependent Kinase IV by O-GlcNAc Modification. J. Biol. Chem 2009, 284, 21327–21337. [DOI] [PMC free article] [PubMed] [Google Scholar]
- (19).Joeh E; O’Leary T; Li W; Hawkins R; Hung JR; Parker CG; Huang ML Mapping glycan-mediated galectin-3 interactions by live cell proximity labeling. Proc. Natl. Acad. Sci. U.S.A 2020, 117, 27329–27338. [DOI] [PMC free article] [PubMed] [Google Scholar]
- (20).Groves JA; Maduka AO; O’Meally RN; Cole RN; Zachara NE Fatty acid synthase inhibits the O-GlcNAcase during oxidative stress. J. Biol. Chem 2017, 292, 6493–6511. [DOI] [PMC free article] [PubMed] [Google Scholar]
- (21).Stephen HM; Praissman JL; Wells L Generation of an Interactome for the Tetratricopeptide Repeat Domain of O-GlcNAc Transferase Indicates a Role for the Enzyme in Intellectual Disability. J. Proteome Res 2021, 20, 1229–1242. [DOI] [PMC free article] [PubMed] [Google Scholar]
- (22).Yang X; Qian K Protein O-GlcNAcylation: emerging mechanisms and functions. Nat. Rev. Mol. Cell Biol 2017, 18, 452. [DOI] [PMC free article] [PubMed] [Google Scholar]
- (23).Gorelik A; van Aalten DMF Tools for functional dissection of site-specific O-GlcNAcylation. RSC Chem. Biol 2020, 1, 98–109. [DOI] [PMC free article] [PubMed] [Google Scholar]
- (24).Branon TC; Bosch JA; Sanchez AD; Udeshi ND; Svinkina T; Carr SA; Feldman JL; Perrimon N; Ting AY Efficient proximity labeling in living cells and organisms with TurboID. Nat. Biotechnol 2018, 36, 880–887. [DOI] [PMC free article] [PubMed] [Google Scholar]
- (25).Saarela S; Westerlund-Wikström B; Rhen M; Korhonen TK The GafD protein of the G (F17) fimbrial complex confers adhesiveness of Escherichia coli to laminin. Infect. Immun 1996, 64, 2857–2860. [DOI] [PMC free article] [PubMed] [Google Scholar]
- (26).Carrillo LD; Froemming JA; Mahal LK Targeted in vivo O-GlcNAc sensors reveal discrete compartment-specific dynamics during signal transduction. J. Biol. Chem 2011, 286, 6650–6658. [DOI] [PMC free article] [PubMed] [Google Scholar]
- (27).Saarela S; Taira S; Nurmiaho-Lassila EL; Makkonen A; Rhen M The Escherichia coli G-fimbrial lectin protein participates both in fimbrial biogenesis and in recognition of the receptor N-acetyl-D-glucosamine. J. Bacteriol 1995, 177, 1477–1484. [DOI] [PMC free article] [PubMed] [Google Scholar]
- (28).Xu Y; Beckett D Kinetics of biotinyl-5’-adenylate synthesis catalyzed by the Escherichia coli repressor of biotin biosynthesis and the stability of the enzyme-product complex. Biochemistry 1994, 33, 7354–7360. [DOI] [PubMed] [Google Scholar]
- (29).Hsu K-L; Gildersleeve JC; Mahal LK A simple strategy for the creation of a recombinant lectin microarray. Mol. BioSyst 2008, 4, 654–662. [DOI] [PMC free article] [PubMed] [Google Scholar]
- (30).Carrillo LD; Krishnamoorthy L; Mahal LK A Cellular FRET-Based Sensor for β-O-GlcNAc, A Dynamic Carbohydrate Modification Involved in Signaling. J. Am. Chem. Soc 2006, 128, 14768–14769. [DOI] [PubMed] [Google Scholar]
- (31).Merckel MC; Tanskanen J; Edelman S; Westerlund-Wikström B; Korhonen TK; Goldman A The structural basis of receptor-binding by Escherichia coli associated with diarrhea and septicemia. J. Mol. Biol 2003, 331, 897–905. [DOI] [PubMed] [Google Scholar]
- (32).Duckworth BP; Geders TW; Tiwari D; Boshoff HI; Sibbald PA; Barry CE; Schnappinger D; Finzel BC; Aldrich CC Bisubstrate Adenylation Inhibitors of Biotin Protein Ligase from Mycobacterium tuberculosis. Chem. Biol 2011, 18, 1432–1441. [DOI] [PMC free article] [PubMed] [Google Scholar]
- (33).Wulff-Fuentes E; Berendt RR; Massman L; Danner L; Malard F; Vora J; Kahsay R; Olivier-Van Stichelen S The human O-GlcNAcome database and meta-analysis. Sci. Data 2021, 8, 25. [DOI] [PMC free article] [PubMed] [Google Scholar]
- (34).Olivier-Van Stichelen S; Wang P; Comly M; Love DC; Hanover JA Nutrient-driven O-linked N-acetylglucosamine (O-GlcNAc) cycling impacts neurodevelopmental timing and metabolism. J. Biol. Chem 2017, 292, 6076–6085. [DOI] [PMC free article] [PubMed] [Google Scholar]
- (35).Nagy T; Fisi V; Frank D; Kátai E; Nagy Z; Miseta A Hyperglycemia-Induced Aberrant Cell Proliferation; A Metabolic Challenge Mediated by Protein O-GlcNAc Modification. Cells 2019, 8, 999. [DOI] [PMC free article] [PubMed] [Google Scholar]
- (36).Baumann D; Wong A; Akhaphong B; Jo S; Pritchard S; Mohan R; Chung G; Zhang Y; Alejandro EU Role of nutrient-driven O-GlcNAc-post-translational modification in pancreatic exocrine and endocrine islet development. Development 2020, 147, dev186643. [DOI] [PMC free article] [PubMed] [Google Scholar]
- (37).Park S-K; Zhou X; Pendleton KE; Hunter OV; Kohler JJ; O’Donnell KA; Conrad NK A Conserved Splicing Silencer Dynamically Regulates O-GlcNAc Transferase Intron Retention and O-GlcNAc Homeostasis. Cell Rep. 2017, 20, 1088–1099. [DOI] [PMC free article] [PubMed] [Google Scholar]
- (38).Samavarchi-Tehrani P; Samson R; Gingras A-C Proximity Dependent Biotinylation: Key Enzymes and Adaptation to Proteomics Approaches. Mol. Cell. Proteomics 2020, 19, 757–773. [DOI] [PMC free article] [PubMed] [Google Scholar]
- (39).Szklarczyk D; Gable AL; Lyon D; Junge A; Wyder S; Huerta-Cepas J; Simonovic M; Doncheva NT; Morris JH; Bork P; Jensen LJ; Mering CV STRING v11: protein-protein association networks with increased coverage, supporting functional discovery in genome-wide experimental datasets. Nucleic Acids Res. 2019, 47, D607–d613. [DOI] [PMC free article] [PubMed] [Google Scholar]
- (40).Ma J; Hou C; Li Y; Chen S; Wu C OGT Protein Interaction Network (OGT-PIN): A Curated Database of Experimentally Identified Interaction Proteins of OGT. Int. J. Mol. Sci 2021, 22, 9620. [DOI] [PMC free article] [PubMed] [Google Scholar]
- (41).Levine ZG; Potter SC; Joiner CM; Fei GQ; Nabet B; Sonnett M; Zachara NE; Gray NS; Paulo JA; Walker S Mammalian cell proliferation requires noncatalytic functions of O-GlcNAc transferase. Proc. Natl. Acad. Sci. U.S.A 2021, 118, No. e2016778118. [DOI] [PMC free article] [PubMed] [Google Scholar]
- (42).Lee J-S; Zhang Z O-linked N-acetylglucosamine transferase (OGT) interacts with the histone chaperone HIRA complex and regulates nucleosome assembly and cellular senescence. Proc. Natl. Acad. Sci. U.S.A 2016, 113, E3213–E3220. [DOI] [PMC free article] [PubMed] [Google Scholar]
- (43).Vella P; Scelfo A; Jammula S; Chiacchiera F; Williams K; Cuomo A; Roberto A; Christensen J; Bonaldi T; Helin K; Pasini D Tet Proteins Connect the O-Linked N-acetylglucosamine Transferase Ogt to Chromatin in Embryonic Stem Cells. Mol. Cell 2013, 49, 645–656. [DOI] [PubMed] [Google Scholar]
- (44).Ozcan S; Andrali SS; Cantrell JE Modulation of transcription factor function by O-GlcNAc modification. Biochim. Biophys. Acta 2010, 1799, 353–364. [DOI] [PMC free article] [PubMed] [Google Scholar]
- (45).Tarbet HJ; Dolat L; Smith TJ; Condon BM; O’Brien ET III; Valdivia RH; Boyce M Site-specific glycosylation regulates the form and function of the intermediate filament cytoskeleton. eLife 2018. 7, No. e31807. [DOI] [PMC free article] [PubMed] [Google Scholar]
- (46).Li X; Zhu Q; Shi X; Cheng Y; Li X; Xu H; Duan X; Hsieh-Wilson LC; Chu J; Pelletier J; Ni M; Zheng Z; Li S; Yi W O-GlcNAcylation of core components of the translation initiation machinery regulates protein synthesis. Proc. Natl. Acad. Sci. U.S.A 2018. 116, 7857–7866. [DOI] [PMC free article] [PubMed] [Google Scholar]
- (47).Perez-Cervera Y; Dehennaut V; Aquino Gil M; Guedri K; Solórzano Mata CJ; Olivier-Van Stichelen S; Michalski JC; Foulquier F; Lefebvre T Insulin signaling controls the expression of O-GlcNAc transferase and its interaction with lipid microdomains. FASEB J. 2013, 27, 3478–3486. [DOI] [PubMed] [Google Scholar]
- (48).Majumdar G; Wright J; Markowitz P; Martinez-Hernandez A; Raghow R; Solomon SS Insulin Stimulates and Diabetes Inhibits O-Linked N-Acetylglucosamine Transferase and O-Glycosylation of Sp1. Diabetes 2004, 53, 3184–3192. [DOI] [PubMed] [Google Scholar]
- (49).Nagarajan A; Petersen MC; Nasiri AR; Butrico G; Fung A; Ruan H-B; Kursawe R; Caprio S; Thibodeau J; Bourgeois-Daigneault M-C; Sun L; Gao G; Bhanot S; Jurczak MJ; Green MR; Shulman GI; Wajapeyee N MARCH1 regulates insulin sensitivity by controlling cell surface insulin receptor levels. Nat. Commun 2016, 7, 12639. [DOI] [PMC free article] [PubMed] [Google Scholar]
- (50).Schwein PA; Woo CM The O-GlcNAc Modification on Kinases. ACS Chem. Biol 2020, 15, 602–617. [DOI] [PMC free article] [PubMed] [Google Scholar]
- (51).Slawson C; Copeland RJ; Hart GW O-GlcNAc signaling: a metabolic link between diabetes and cancer? Trends Biochem. Sci 2010, 35, 547–555. [DOI] [PMC free article] [PubMed] [Google Scholar]
Associated Data
This section collects any data citations, data availability statements, or supplementary materials included in this article.