Abstract
When the number of rRNA (rrn) operons in an Escherichia coli cells is increased by adding an rrn operon on a multicopy plasmid, the rate of rRNA expression per operon is reduced to maintain a constant concentration of rRNA in the cell. We have used electron microscopy to examine rRNA transcription in cells containing a multicopy plasmid carrying rrnB. We found that there were fewer RNA polymerase molecules transcribing the rrn genes, as predicted from previous gene dosage studies. Furthermore, RNA polymerase molecules were arranged in irregularly spaced groups along the operon. No apparent pause or transcription termination sites that would account for the irregular spacing of the groups of polymerase molecules were observed. We also found that the overall transcription elongation rate was unchanged when the rrn gene dosage was increased. Our data suggest that when rrn gene dosage is increased, initiation events, or promoter-proximal elongation events, are interrupted at irregular time intervals.
The synthesis of rRNA is a tightly regulated process (reviewed in references 8 and 14). One approach to studying this regulation has been to increase (18) or decrease (7) the gene dosage of the rrn operons and observe the influence of this imbalance on rrn expression. Jinks-Robertson and coworkers (18) demonstrated that, when the number of rrn operons is increased by addition of rrnB or rrnD on a multicopy plasmid, the rate of rRNA synthesis per cell remains the same. They demonstrated that the maintenance of the same amount of rRNA per cell, despite a greater number of rrn operons, is the result of reduced expression from the individual rrn operons. This reduction in expression from individual operons in the presence of increased rrn gene dosage does not result from limiting RNA polymerase concentration or from the titration of some other protein factor required for rRNA transcription (7, 15, 18, 21, 28). The regulation of expression of the individual rrn operons by an increase in rrn copy number was termed feedback control, and it was proposed that an excess of ribosomes might be the regulating factor. Later experiments suggested that the overall translational capacity of the cell, not ribosome concentration per se, is the effector of feedback control (6).
Gourse and coworkers (13) isolated various DNA fragments containing rrn regulatory regions and fused them to a lacZ reporter gene to show that the P1 promoter is necessary and sufficient as a target for feedback control. These authors proposed that feedback control is the mechanism by which growth rate-dependent control of rRNA transcription is achieved. Growth rate-dependent control is the process by which the rate of synthesis of rRNA per unit amount of protein increases with the square of the growth rate (19).
Reduction of rrn gene dosage has also been studied. Condon and coworkers (7) showed that deleting four of the seven rrn operons led to a 2.3-fold increase in expression from the remaining operons. They showed by electron microscopy that part of the increase in expression was the result of loading more RNA polymerase molecules onto the remaining operons. In addition, they found an increase in the transcription elongation rate and proposed that this increased rate would allow faster promoter clearance, making room for additional initiating RNA polymerase molecules and thus enhancing the increase in initiation (7, 8).
Recently, Gaal and coworkers (11) proposed that the concentration of the initiating nucleoside triphosphate (NTP) might be an effector of growth rate-dependent control. These authors showed that rrn P1 promoters require higher concentrations of the initiating NTP (GTP for rrnD and ATP for the remaining six rrn operons) than typical promoters to stabilize the promoter open complex. They found that ATP and GTP concentrations increased with increasing growth rate and that this increase was correlated with increased synthesis of rRNA. Their model suggests that when the rrn gene dosage is increased, initially the production of excess rRNA leads to increased translational activity and hence increased consumption of ATP and GTP. The drop in ATP and GTP concentrations would then reduce transcription at the rrn promoters, resulting in the observed decrease in expression.
In this study, we have used electron microscopy to compare cells containing the normal number of rrn operon copies with cells harboring an rrnB operon on a multicopy plasmid and thus containing more copies per cell. We show that in the control strain the RNA polymerase molecules were regularly spaced along the operon. In the rrn plasmid-containing strain, polymerase molecules were arranged in groups that were unevenly distributed along the rrn operons with large gaps of DNA lacking polymerases between groups. We termed this phenomenon “gapping.” Gapping did not result from specific pausing or termination sites within the structural genes, nor was it the result of a change in the overall transcription elongation rate. In addition, we confirmed that the number of RNA polymerase molecules on the operons of the strain containing the rrn plasmid was reduced relative to that for the strain containing the normal number of rrn operons (13, 18). We propose that increased rrn gene dosage results in intermittent interruptions of transcription at the promoter-proximal end of the rrn operon, causing the observed gapped arrangement of polymerases on the DNA.
MATERIALS AND METHODS
Strains and plasmids.
All experiments were done in the host strain HB101 (pro leu thi lacY hsdR hsdM endA recA rpsL20 ara-14 galK2 xyl-5 mtl-1 supE44) (2). Plasmid pNO1301 is a pBR322 derivative that contains the entire rrnB operon (18). Plasmid pBR322 was from Pharmacia Biotech, Inc. (Piscataway, N.J.).
Electron microscopy.
Miller chromatin spreads were prepared from strains grown at 37°C to mid-log phase in Luria-Bertani medium with 50 to 60 μg of ampicillin per ml. Growth rates were 1.3 doublings per h for the strain containing pBR322 and 1.2 doublings per h for the strain containing pNO1301. Cells were harvested, lysed, and centrifuged onto carbon-coated electron microscope grids, as described by French and Miller (10). Grids were viewed in a JEOL 100C transmission electron microscope. rRNA operons were identified by their “double Christmas tree” morphology. Measurements of RNA polymerase distributions were made from printed micrographs by using a Numonics Corporation (Montgomeryville, Pa.) 2200 digitizer tablet and Jandel Scientific (San Rafael, Calif.) SigmaScan software. Measurements in centimeters were converted to kilobases by using Ernest F. Fullman, Inc. (Latham, N.Y.), replica gratings (2,160 lines/μm) or by using the lengths of rRNA operons as internal standards. Calculations were based on a value of 2.94 kb/μm for B-form DNA (27) and a compaction ratio of 1.2 to 1.3 times the B-form DNA length for bacterial chromatin (10).
RNA dot blot analysis.
Cultures were grown at 37°C in MOPS (morpholinepropanesulfonic acid) minimal media supplemented with 0.2% glucose, 0.5% Casamino Acids, and 10 μg of thiamine per ml and containing 200 μg of ampicillin per ml. Growth rates were 1.4 doublings per h for the strain containing pBR322 and 1.2 doublings per h for the strain containing pNO1301. Total RNA was isolated from log-phase cultures with an RNeasy kit (Qiagen, Chatsworth, Calif.). RNA (0.5 to 2.0 μg) was deposited on duplicate Zeta-Probe GT nylon membranes (Bio-Rad, Hercules, Calif.) and UV cross-linked. Oligonucleotides complementary to tRNATrp or rpoB RNA were 5′-end labeled with 32P by using T4 kinase (New England Biolabs, Beverly, Mass.) and [γ-32P]ATP. Hybridization and washing procedures were as described by Sambrook et al. (23). Hybridization of probes to the immobilized RNA was measured on a Molecular Dynamics (Sunnyvale, Calif.) PhosphorImager. Values for binding of the tRNATrp probe were normalized by using values obtained with the rpoB probe.
Rate of rrn transcription elongation.
rRNA chain elongation rates were measured by an adaptation of the method of Molin (20). Cells were grown at 37°C in MOPS medium supplemented with 0.2% glucose, 0.5% Casamino Acids, 10 μg of thiamine per ml, and 30 μg of tryptophan per ml and containing 200 μg of ampicillin per ml. When the optical density at 420 nm was 0.15, the cultures were labeled with [14C]adenine (1 μCi/ml, 287 mCi/mmol; Amersham, Arlington Heights, Ill.). After an additional two generations (optical density at 420 nm, 0.6), the cultures were labeled with [3H]adenine (20 μCi/ml, 30 Ci/mmol; ICN, Irvine, Calif.). Rifampin (100 μg/ml; Sigma, St. Louis, Mo.) was added at the same time as the [3H]adenine. One-milliliter samples were taken every 10 s and pipetted into 0.4 ml of boiling lysis buffer (1% sodium dodecyl sulfate, 100 mM NaCl, 8 mM EDTA [pH 8.0]). After 4 min in the lysis buffer, RNA was purified by phenol extraction, DNase treatment, and ethanol precipitation. The RNA was hybridized in duplicate to a Zeta-Probe GT nylon membrane containing 1.6 μg of a 111-bp DNA probe for tRNATrp. The probe was generated by PCR from plasmids containing the rrnC operon and was purified on an agarose gel before being deposited on and cross-linked to the membrane.
RESULTS
Electron microscopy provides a direct means of observing transcriptional activity in cells and can reveal patterns not readily detected by biochemical methods. In this work, we used electron microscopy to study the changes in transcription of the rrn operons under the condition of increased rrn gene dosage. We found changes in both the pattern and number of RNA polymerase molecules on these operons. We also determined that the change in pattern was not caused by an overall change in transcription elongation rate or by transcription arrest at specific sites in the structural genes.
Influence of rrn dosage on the distribution of transcribing RNA polymerases.
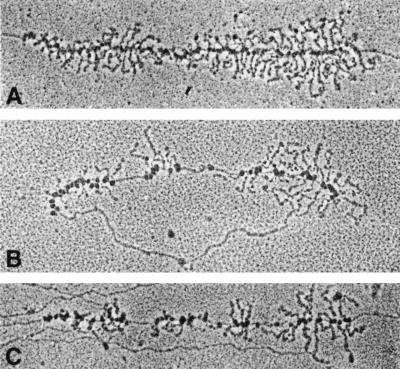
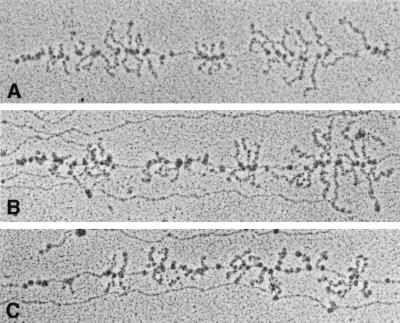
To determine how an increase in rrn gene dosage might influence the transcription pattern of the rrn operons, we prepared chromatin spreads from strains containing either pNO1301, which carries the entire rrnB operon, or pBR322, the control vector. In Miller chromatin spreads, rrn operons can be identified by their distinctive “double Christmas tree” morphology (Fig. 1A). In the strain containing the control vector pBR322, the RNA polymerase molecules were positioned regularly along the rrn operons (Fig. 1A). In the strain containing the rrnB plasmid pNO1301, however, we observed large regions of the rrn DNA that were devoid of RNA polymerases (compare Fig. 1A with B and C; Fig. 2). We termed this phenomenon “gapping.” The gaps were irregularly distributed along the chromosome, separating groups of transcribing RNA polymerases. The lengths of both gaps and groups varied considerably.
FIG. 1.
Electron micrographs of rrn operons from plasmid-containing strains. (A) Chromosomal rrn operon from strain containing pBR322; (B) plasmid rrnB operon from strain containing pNO1301; (C) chromosomal operon from strain containing pNO1301. rrn operons are 5.5 kb in length.
FIG. 2.
Chromosomal rrn operons from the strain containing pNO1301. The identity of several of the rrn operons can be determined by their proximity to certain structural genes with characteristic transcript patterns (10). The operons pictured here are rrnD (A), rrnB (B), and rrnE (C). rrn operons are 5.5 kb in length.
Distribution of RNA polymerase molecules in a strain with pNO1302 (18), a derivative of pNO1301 in which an internal portion of the rrn operon is deleted, was similar to distribution of RNA polymerase molecules in the strain containing pBR322 (data not shown). This result is consistent with the observations that expression of intact rRNA is required for feedback (15, 18) and that gapping results from feedback.
To quantify the observed gapping, we arbitrarily defined a gap as a space that would accommodate three or more RNA polymerase molecules. Sixty-three percent of the rrn operons in the strain containing pNO1301 (373 operons observed) showed gaps, versus only 23% of the rrn operons in the strains containing pBR322 (287 operons observed). Furthermore, there was an average of four gaps on both the chromosomal and plasmid operons in the strain containing pNO1301, compared to less than one gap per operon in the strain containing pBR322.
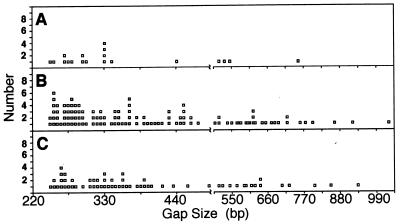
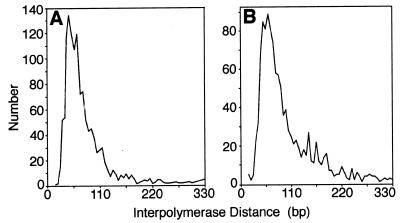
The gap lengths ranged from 250 to 1,000 bp, with most lengths between 250 and 500 bp (Fig. 3). While gap and group lengths were highly dispersed, the interpolymerase distance within groups in the strain containing pNO1301 remained similar to the interpolymerase distance found in the pBR322 strain (approximately 60 bp) (Fig. 4). This result showed that the difference in the number of RNA polymerase molecules per operon (see below) was accounted for by the gaps and not by an average increase in the distance between polymerases.
FIG. 3.
Size gaps observed on the rrn operons. A gap is defined as the space that would be filled by three RNA polymerase molecules, which is about 240 bp measured from the center of the RNA polymerase preceding the gap to the center of the RNA polymerase following the gap. (We used 60 bp, the mode of interpolymerase distance on rrn operons from the strain containing pBR322 [Fig. 4], as the space occupied by one RNA polymerase molecule.) (A) Chromosomal rrn operons in strain containing pBR322 (n = 19 operons measured); (B) chromosomal operons in strain containing pNO1301 (n = 30); (C) plasmid rrnB operons in strain containing pNO1301 (n = 16).
FIG. 4.
Interpolymerase spacing, determined by measuring the distance from polymerase center to polymerase center between adjacent RNA polymerase molecules. (A) pBR322 (n = 19 operons measured); (B) pNO1301 (n = 28).
Distribution of gaps along the DNA.
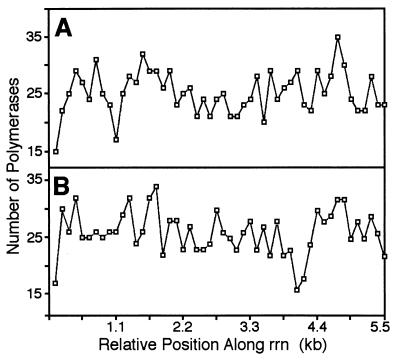
If specific pause or termination sites caused some RNA polymerases to fall off the DNA, creating a gap in the polymerase distribution, we would expect to see the gaps at the same sites on the many rrn operons observed. We found, however, that the gaps did not consistently appear at any particular region along the rrn operons (Fig. 5). This result suggested that neither pausing nor termination at a specific site caused the gapping phenomenon. However, we might not have detected a pause if it occurred in the first few hundred base pairs of the operon.
FIG. 5.
Gaps between groups of RNA polymerase molecules are randomly distributed along the operon and are not correlated with any specific site. The y axis shows the total number of polymerases observed at 110-bp intervals along the rrn operons, assuming an average rrn operon length of 5.5 kb. (A) Strain containing pBR322 (n = 19 chromosomal operons); (B) strain containing pNO1301 (n = 30).
Transcription elongation rate.
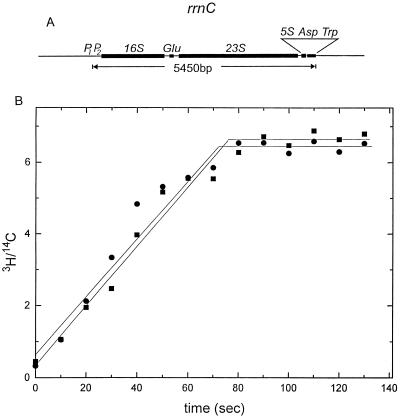
We measured the rate of transcription elongation in both strains to determine if a change in elongation rate in the strain containing pNO1301 could explain the gapping. The rate of appearance of tRNATrp in the strains containing pNO1301 and pBR322 was measured. The gene for tRNATrp is found only once on the Escherichia coli genome, at the 3′ end of rrnC, and it is transcribed as part of the rrnC operon (Fig. 6A). Cell cultures were first uniformly labeled with [14C]adenine. Two generations after the 14C labeling, the cultures were labeled with [3H]adenine and transcription initiation was inhibited by the addition of rifampin. This experiment measured the average elongation rate of the RNA polymerase molecules that are present on the operon at the time of rifampin addition. Only polymerases that were engaged in transcription at the time of the [3H]adenine and rifampin addition could polymerize 3H-labeled RNA. Samples were taken every 10 s, and total cellular RNA was isolated and hybridized to an unlabeled DNA probe for tRNATrp. The 3H signal at successive time points increased until the promoter-proximal polymerase reached the end of rrnC and transcribed tRNATrp. After the promoter-proximal polymerase reaches the end of the operon, no further increase in 3H signal should occur; thus, the time taken to reach the plateau shown in Fig. 6B equals the time necessary to transcribe the entire length of rrnC. We found that rrnC transcription elongation times were identical in the strains containing either pNO1301 or pBR322, both reaching the plateau in 70 s, yielding an elongation rate of 78 nucleotides (nt)/s (Fig. 6B) (see Discussion for calculation of elongation rate). We concluded that the gapping observed by electron microscopy was unrelated to the overall rate of transcription elongation.
FIG. 6.
(A) Schematic of the rrnC operon. Note the unique tRNATrp gene at the 3′ end of the operon. (B) Transcription elongation rates of the rrnC operons in the strains containing either pNO1301 (circles) or pBR322 (squares). Although the steady-state level of tRNATrp in the strain containing pNO1301 was about 30% lower than that in the strain containing pBR322, the plateaus are at the same value in this plot because both the 3H and 14C values are measurements of the tRNATrp levels; the 3H/14C corrected value cancels out the difference between the two strains. The uncorrected plots for 3H and for 14C both showed a 0.7-fold difference in the level of tRNATrp (data not shown), suggesting that rRNA stability did not differ between the two strains.
Influence of rrn gene dosage on number of RNA polymerases per operon.
From the electron micrographs used to measure RNA polymerase gapping, we counted the number of RNA polymerase molecules per ribosomal operon. The number (mean ± standard deviation) of RNA polymerase molecules on the operons in the strain containing pNO1301 was 46 ± 9, compared to an average of 70 ± 11 RNA polymerase molecules on the operons in the strain containing pBR322. Thus, as measured by electron microscopy, the number of RNA polymerase molecules per rrn operon resulting from the increased gene dosage was 66% of that observed for a strain not subject to increased gene dosage.
Using RNA dot blot analysis of rRNA synthesis, we found that the reduced number of RNA polymerases per operon was proportional to the reduction of rRNA produced per operon in the strain containing pNO1301. Total cellular RNA was probed with a 32P-labeled oligonucleotide complementary to tRNATrp. Because the unique copy of the tRNATrp gene is in rrnC, the level of tRNATrp expression reflected the level of expression of the rrnC operon. We found that the level of expression of rrnC in the strain containing pNO1301 was 69% ± 7% of that in the strain containing pBR322. This relative decrease in rrnC expression in the strain containing the rrn plasmid, as measured by RNA dot blot analysis, was in excellent agreement with the ratio of the number of RNA polymerase molecules in the strain containing pNO1301 to that in the strain containing pBR322, as described above, and is consistent with earlier measurements (12, 13, 18).
DISCUSSION
In this study, we have provided a picture of the rrn transcription process while the operons are being down-regulated by feedback control. The major features of this picture are as follows. (i) RNA polymerases were distributed along the DNA in groups that were separated by gaps. (ii) Polymerase groups and gaps were unevenly distributed on the DNA with no indication of postinitiation pause or termination sites. (iii) The polymerases moved at the same transcription elongation rate in the presence of feedback control as in its absence. (iv) Finally, feedback-controlled rrn operons had decreased numbers of polymerases on their DNA. Although this picture does not identify the mechanism underlying feedback control, it does eliminate pausing and termination within the structural genes as possible causes. Our results are most consistent with a model in which intermittent initiation or clearance of the promoter-proximal region leads to a pattern of RNA polymerase gapping and grouping, fewer polymerases per operon, and, consequently, reduced transcription per operon.
Polymerase gapping as a promoter-proximal event.
Our failure to observe unique sites where polymerases either are backed up (pause sites) or fall off (termination sites) has ruled out the possibility of elongation control features over most of the operon. This includes antitermination, since a defect in this system results in a clear polarity of expression of the 16S and 23S genes (1, 17, 22). We did not observe recurring gaps at any specific sites in the 373 operons examined, and there was no progressive 5′-3′ decrease in numbers of polymerases that would be indicative of polarity (Fig. 5). In addition, the fact that we found no change in the transcription rate during feedback control also argues against regulation via the antitermination system. The BoxA motif of the antitermination system increases the overall transcription elongation rate of RNA polymerase (25). We therefore would have expected that down-regulation of antitermination would have reduced the rate of transcription.
Within groups of polymerases in feedback-controlled cells, we found that the average interpolymerase distance was identical to the interpolymerase distance in non-feedback-controlled cells (60 nt). We have previously noted that interpolymerase distances can be shorter than we observed here, as demonstrated by a strain in which four of the seven rrn operons are deleted (7), suggesting that different control mechanisms may be involved when rrn operons are in excess as opposed to deficit. The unaltered interpolymerase distance and the unaltered overall rate of transcription further suggest that the elongation process is not influenced by the mechanism that causes gapping.
The cultures examined in this work were grown in rich media. The feedback response has been observed in cultures grown in minimal media (13, 18). However, when a strain without an rrn-containing plasmid was cultured in minimal medium, RNA polymerase molecules appeared more widely spaced on the DNA and gaps were not readily apparent (9). One interpretation of these data is that nutrient limitation reduces the number of RNA polymerases per operon by a different mechanism than does an increase in rrn gene dosage. Another interpretation is that the gapping phenomenon occurs only within a limited range of rRNA transcription initiation frequencies and that during nutrient limitation the additive effects of negative feedback and lower growth rate put the rRNA initiation frequency outside of the limited range in which gapping can occur.
Our results are consistent with the location of the feedback control mechanism at some promoter-proximal feature, e.g., the P1 promoter, and are inconsistent with control via blockages to elongation that occur beyond the control region. Feedback-controlled cells load polymerases onto the DNA in groups of several polymerases at a time separated by gaps during which no loading occurs. The rate at which individual polymerases traverse the entire rrn operon and the interpolymerase distance within groupings are identical in both feedback-controlled and non-feedback-controlled cells. The same molecular event that inhibits transcription initiation at the P1 promoter and therefore accounts for the reduced number of RNA polymerase molecules per operon observed in feedback-controlled cells could lead to the gapping observed here. It is also possible that gaps occur because promoter-proximal elongation events are affected by the reduction in transcription initiation.
Possible effectors of the gapping phenomenon.
We propose that gapping is caused by events at or near the 5′ end of the rrn operon, such as promoter-proximal elongation blockage or fluctuating concentrations of an effector molecule that influences initiation. Recent evidence (11) suggests that the concentrations of ATP and GTP, which change with the growth rate, may play an important role in regulation of the rrn operons and could explain feedback control. If feedback control results from this “NTP-sensing” mechanism, the gaps that we observed in the presence of increased rrn gene dosage could reflect fluctuations in the concentration of NTPs available for initiation. However, it has not yet been established that feedback inhibition results from regulation by the concentration of the initiating NTP (26). Therefore, other effectors and processes could be involved, directly or indirectly, in the gapping process, e.g., including, ppGpp, which has been implicated in many rrn control schemes (5), or promoter opening and closing, which might be controlled by a cooperative mechanism in which the first polymerase initiates with difficulty (low probability) and subsequent polymerases initiate more easily (16).
Estimating the gap time between bursts of transcription.
Under feedback control conditions, we found that transcription of rRNA is intermittently turned on and off, as demonstrated by the gaps along the DNA between groups of RNA polymerase molecules. For the purpose of modeling, we use the term “initiation” to refer to events that occur within the first 120 bp of the operon. We have calculated the average frequency of initiation and then estimated the time between grouped initiation events. The average initiation frequency was calculated as the number of polymerases on the operon (electron microscopy data) divided by the time it takes one polymerase to transcribe the operon (transcription rate data). Thus, for the strain containing pNO1301, the frequency of initiation was about 46 polymerases/70 s, or 0.66 initiation/s, compared to 70 polymerases/70 s (1.0 initiation/s) for the strain containing pBR322. The rrnC initiation rate for the strain containing pBR322 is close to that found by Condon et al. (7) in a different wild-type strain that did not carry a plasmid (0.88 initiation/s).
The time between grouped initiations that results in the gaps between RNA polymerase molecules can then be estimated. The rrnC operon is 5,450 bp long. Thus, the rate of transcription elongation by RNA polymerase was 5,450 nt/70 s (78 nt/s), within the range of values determined by other workers (70 to 90 nt/s) (3, 7, 20, 24). At an elongation rate of 78 nt/s and a gap length range of 250 to 1,000 bp, the time between groups of initiation events, i.e., the gap time, was 3 to 13 s. Such remarkably slow recovery times are consistent with the control of the initiation process by polymerase cooperativity as mentioned above (16). Such a control mechanism has been simulated by Bremer and Ehrenberg and matches our observed gapping well when a low probability of initiation is used for the first polymerase and subsequent polymerases are initiated with a higher probability (4).
Summary.
We have shown here that in the presence of an rrn-containing plasmid, both the number and distribution of RNA polymerase molecules transcribing the rrn operons change relative to that observed in a wild-type cell. We showed that the gapped distribution of the RNA polymerase molecules in the strain with increased rrn gene dosage is not related to specific pause or termination sites or to a change in the overall elongation rate. Our data suggest that the timing between the groups of RNA polymerases is determined at the early stages of transcription (initiation or immediate promoter-proximal events) of the rrn operons.
ACKNOWLEDGMENTS
We thank H. Bremer for communicating his computer simulations of cooperative RNA polymerase initiation and M. Gottesman for generously hosting J.V. in his laboratory.
This work was supported by National Institutes of Health grants GM24751 to C.L.S. and GM37048 to R.L.G.
REFERENCES
- 1.Aksoy S, Squires C L, Squires C. Evidence for antitermination in Escherichia coli rRNA transcription. J Bacteriol. 1984;159:260–264. doi: 10.1128/jb.159.1.260-264.1984. [DOI] [PMC free article] [PubMed] [Google Scholar]
- 2.Bolivar F, Backman K. Plasmids of Escherichia coli as cloning vectors. Methods Enzymol. 1979;68:245–267. doi: 10.1016/0076-6879(79)68018-7. [DOI] [PubMed] [Google Scholar]
- 3.Bremer H, Dennis P P. Modulation of chemical composition and other parameters of the cell by growth rate. In: Neidhardt F C, Curtiss III R, Ingraham J L, Lin E C C, Low K B, Magasanik B, Reznikoff W S, Riley M, Schaechter M, Umbarger H E, editors. Escherichia coli and Salmonella: cellular and molecular biology. 2nd ed. Vol. 2. Washington, D.C: American Society for Microbiology; 1996. pp. 1553–1569. [Google Scholar]
- 4.Bremer H, Ehrenberg M. Guanosine tetraphosphate as a global regulator of bacterial RNA synthesis: a model involving RNA polymerase pausing and queuing. Biochim Biophys Acta. 1995;1262:15–36. doi: 10.1016/0167-4781(95)00042-f. [DOI] [PubMed] [Google Scholar]
- 5.Cashel M, Gentry D R, Hernandez V J, Vinella D. The stringent response. In: Neidhardt F C, Curtiss III R, Ingraham J L, Lin E C C, Low K B, Magasanik B, Reznikoff W S, Riley M, Schaechter M, Umbarger H E, editors. Escherichia coli and Salmonella: cellular and molecular biology. 2nd ed. Vol. 1. Washington, D.C: American Society for Microbiology; 1996. pp. 1458–1496. [Google Scholar]
- 6.Cole J R, Olsson C L, Hershey J W B, Grunberg-Manago M, Nomura M. Feedback regulation of rRNA synthesis in Escherichia coli: requirement for initiation factor IF2. J Mol Biol. 1987;198:383–392. doi: 10.1016/0022-2836(87)90288-9. [DOI] [PubMed] [Google Scholar]
- 7.Condon C, French S, Squires C, Squires C L. Depletion of functional ribosomal RNA operons in Escherichia coli causes increased expression of the remaining intact copies. EMBO J. 1993;12:4305–4315. doi: 10.1002/j.1460-2075.1993.tb06115.x. [DOI] [PMC free article] [PubMed] [Google Scholar]
- 8.Condon C, Squires C, Squires C L. Control of rRNA transcription in Escherichia coli. Microbiol Rev. 1995;59:623–645. doi: 10.1128/mr.59.4.623-645.1995. [DOI] [PMC free article] [PubMed] [Google Scholar]
- 9.French, S. L. Unpublished results.
- 10.French S L, Miller O L., Jr Transcription mapping of the Escherichia coli chromosome by electron microscopy. J Bacteriol. 1989;171:4207–4216. doi: 10.1128/jb.171.8.4207-4216.1989. [DOI] [PMC free article] [PubMed] [Google Scholar]
- 11.Gaal T, Bartlett M S, Ross W, Turnbough C L, Jr, Gourse R L. Transcription regulation by initiating NTP concentration: rRNA synthesis in bacteria. Science. 1997;278:2092–2097. doi: 10.1126/science.278.5346.2092. [DOI] [PubMed] [Google Scholar]
- 12.Gaal T, Gourse R L. Guanosine 3′-diphosphate 5′-diphosphate is not required for growth rate-dependent control of rRNA synthesis in Escherichia coli. Proc Natl Acad Sci USA. 1990;87:5533–5537. doi: 10.1073/pnas.87.14.5533. [DOI] [PMC free article] [PubMed] [Google Scholar]
- 13.Gourse R L, de Boer H A, Nomura M. DNA determinants of rRNA synthesis in E. coli: growth rate dependent regulation, feedback inhibition, upstream activation, antitermination. Cell. 1986;44:197–205. doi: 10.1016/0092-8674(86)90498-8. [DOI] [PubMed] [Google Scholar]
- 14.Gourse R L, Gaal T, Bartlett M S, Appleman J A, Ross W. rRNA transcription and growth rate-dependent regulation of ribosome synthesis in Escherichia coli. Annu Rev Microbiol. 1996;50:645–677. doi: 10.1146/annurev.micro.50.1.645. [DOI] [PubMed] [Google Scholar]
- 15.Gourse R L, Takebe Y, Sharrock R A, Nomura M. Feedback regulation of rRNA and tRNA synthesis and accumulation of free ribosomes after conditional expression of rRNA genes. Proc Natl Acad Sci USA. 1985;82:1069–1073. doi: 10.1073/pnas.82.4.1069. [DOI] [PMC free article] [PubMed] [Google Scholar]
- 16.Guptasarma P. Cooperative relaxation of supercoils and periodic transcriptional initiation within polymerase batteries. Bioessays. 1996;18:325–332. doi: 10.1002/bies.950180411. [DOI] [PubMed] [Google Scholar]
- 17.Heinrich T, Condon C, Pfeiffer T, Hartmann R K. Point mutations in the leader boxA of a plasmid-encoded Escherichia coli rrnB operon cause defective antitermination in vivo. J Bacteriol. 1995;177:3793–3800. doi: 10.1128/jb.177.13.3793-3800.1995. [DOI] [PMC free article] [PubMed] [Google Scholar]
- 18.Jinks-Robertson S, Gourse R L, Nomura M. Expression of rRNA and tRNA genes in Escherichia coli: evidence for feedback regulation by products of rRNA operons. Cell. 1983;33:865–876. doi: 10.1016/0092-8674(83)90029-6. [DOI] [PubMed] [Google Scholar]
- 19.Maaloe O, Kjeldgaard N O. Control of macromolecular synthesis: a study of DNA, RNA, and protein synthesis in bacteria. New York, N.Y: Benjamin; 1966. [Google Scholar]
- 20.Molin S. Ribosomal RNA chain elongation rates in Escherichia coli. In: Kjeldgaard N, Maaloe O, editors. Control of ribosome synthesis (Alfred Benzon Symposium IX). New York, N.Y: Academic Press; 1976. pp. 333–339. [Google Scholar]
- 21.Nomura M, Bedwell D M, Yamagishi M, Cole J R, Kolb J M. RNA polymerase and regulation of RNA synthesis in Escherichia coli: RNA polymerase concentration, stringent control, and ribosome feedback regulation. In: Reznikoff W S, Burgess R R, Dahlberg J E, Gross C A, Record M T Jr, Wickens M P, editors. RNA polymerase and the regulation of transcription. New York, N.Y: Elsevier; 1987. pp. 137–149. [Google Scholar]
- 22.Pfeiffer T, Hartmann R K. Role of the spacer BoxA of Escherichia coli ribosomal RNA operons in efficient 23 S rRNA synthesis in vivo. J Mol Biol. 1997;265:385–393. doi: 10.1006/jmbi.1996.0744. [DOI] [PubMed] [Google Scholar]
- 23.Sambrook J, Fritsch E F, Maniatis T. Molecular cloning: a laboratory manual. 2nd ed. Cold Spring Harbor, N.Y: Cold Spring Harbor Laboratory; 1989. pp. 754–755. [Google Scholar]
- 24.Vogel U, Jensen K F. The RNA chain elongation rate in Escherichia coli depends on the growth rate. J Bacteriol. 1994;176:2807–2813. doi: 10.1128/jb.176.10.2807-2813.1994. [DOI] [PMC free article] [PubMed] [Google Scholar]
- 25.Vogel U, Jensen K F. Effects of the antiterminator Box A on transcription elongation kinetics and ppGpp inhibition of transcription elongation in Escherichia coli. J Biol Chem. 1995;270:18335–18340. doi: 10.1074/jbc.270.31.18335. [DOI] [PubMed] [Google Scholar]
- 26.Voulgaris, J., et al. Unpublished results.
- 27.Watson J D, Crick F H C. The structure of DNA. Cold Spring Harbor Symp Quant Biol. 1953;18:123–130. doi: 10.1101/sqb.1953.018.01.020. [DOI] [PubMed] [Google Scholar]
- 28.Yamagishi M, de Boer H A, Nomura M. Feedback regulation of rRNA synthesis: a mutational alteration in the anti-Shine-Dalgarno region of the 16 S rRNA gene abolishes regulation. J Mol Biol. 1987;198:547–550. doi: 10.1016/0022-2836(87)90299-3. [DOI] [PubMed] [Google Scholar]


