Abstract
Currently, Alzheimer's disease (AD) and type 2 diabetes mellitus (T2DM) are widely prevalent in the elderly population, and accumulating evidence implies a strong link between them. For example, patients with T2DM have a higher risk of developing neurocognitive disorders, including AD, but the exact mechanisms are still unclear. This time, by combining bioinformatics analysis and in vivo experimental validation, we attempted to find a common biological link between AD and T2DM. We firstly downloaded the gene expression profiling (AD: GSE122063; T2DM: GSE161355) derived from the temporal cortex. To find the associations, differentially expressed genes (DEGs) of the two datasets were filtered and intersected. Based on them, enrichment analysis was carried out, and the least absolute shrinkage and selection operator (LASSO) logistic regression and support vector machine-recursive feature elimination (SVM-RFE) algorithms were used to identify the specific genes. After verifying in the external dataset and in the samples from the AD and type 2 diabetes animals, the shared targets of the two diseases were finally determined. Based on them, the ceRNA networks were constructed. Besides, the logistic regression and single-sample gene set enrichment analysis (ssGSEA) were performed. As a result, 62 DEGs were totally identified between AD and T2DM, and the enrichment analysis indicated that they were much related to the function of synaptic vesicle and MAPK signaling pathway. Based on the evidence from external dataset and RT-qPCR, CARTPT, EPHA5, and SERPINA3 were identified as the marker genes in both diseases, and their clinical significance and biological functions were further analyzed. In conclusion, discovering and exploring the marker genes that are dysregulated in both 2 diseases could help us better comprehend the intrinsic relationship between T2DM and AD, which may inspire us to develop new strategies for facing the dilemmas of clinical or basic research in cognitive dysfunction.
1. Introduction
Alzheimer's disease (AD), the leading cause of dementia, is emerging as a major global health challenge. Clinically, patients show a cognitive decline, accompanied by significant psychobehavioral abnormalities and impaired social life [1]. However, the molecular mechanism that can effectively explain this abnormal alteration is not yet clear. Usually, several nonspecific factors, such as age, vascular disease, infection, and environmental changes, are thought to play a role [2]. Currently available drugs developed to target these factors only slow the progression of the disease, not cure or prevent it. The realistic quandary forces us to expand theoretical hypotheses. Now, dysglycaemia involving the central nervous system (CNS) appears to be the next frontier in AD research [3].
Approximately 6% of the global population is affected by type 2 diabetes mellitus, and the prevalence of this chronic endocrine disease is rising [4, 5]. In-depth research on glucose metabolism brings new insights into our understanding of AD-related mechanisms. At present, a close association between AD and T2DM has been found. Epidemiological evidence shows much greater impairments in executive function, processing speed, and verbal memory plague adults with T2DM [6], and they have a higher incidence of cognitive dysfunction compared with the general population [7, 8]. Insulin is a major polypeptide hormone that plays crucial roles in the brain, including the release or reuptake of neurotransmitters, the improvement of learning and memory abilities, and the activation of signal transduction cascades leading to long-term memory consolidation [9]. Besides, research shows the involvement of insulin in the activation of glycogen synthase kinase 3β, which leads to the phosphorylation of tau and the formation of neurofibrillary tangles [10]. It can be seen that the disorder of blood glucose metabolism in the brain may be closely involved in the pathological changes of Alzheimer's disease. So some people refer to Alzheimer's disease as “brain diabetes” [11]. On this basis, studies on specific brain regions are still preliminary.
Studies have demonstrated that impairment of executive ability and memory is associated with the reduced gray matter density and glucose metabolism in the temporal cortex (middle gyrus, parahippocampus, and uncinate lobe) [12]. Diabetics are at risk for brain structural changes [13], and the medial temporal structures are vulnerable to being involved, causing abnormal atrophy of the hippocampus and amygdala [14]. This has some similarities with Alzheimer's disease and maybe one of the neural mechanisms of type 2 diabetes patients' easy transformation to dementia. These suggest that temporal lobe abnormalities play an important role in type 2 diabetes-related cognitive impairment [15].
To figure out the association between Alzheimer's disease and type 2 diabetes as precisely as possible and determine the mechanisms and targets that potentially regulate their interrelationships in the temporal lobe, an exploratory method that combines high-throughput gene expression detection technology with bioinformatics was mainly employed to discover the molecular markers and quest their subtle physiological functions in this research. Based on the Gene Expression Omnibus (GEO) database (https://www.ncbi.nlm.nih.gov/geo/), we firstly identified the codysregulated genes in the temporal cortex, respectively, obtained from the patients of type 2 diabetes and AD to try to find a genetic bridge. The protein-protein interaction (PPI) and enrichment analysis were then performed. Besides, the machine learning algorithms were introduced to further screen the potential markers. With the validation in the external dataset and animal samples, targets were finally confirmed. Their disease-related risks and regulatory factors, such as miRNAs and interacting drugs, were predicted. These findings may provide a deeper insight into the molecular interactions between type 2 diabetes and Alzheimer's disease, assisting us in discovering new regimens for the disease transformation.
2. Materials and Methods
The whole analysis flow of this study is shown in Figure 1.
Figure 1.
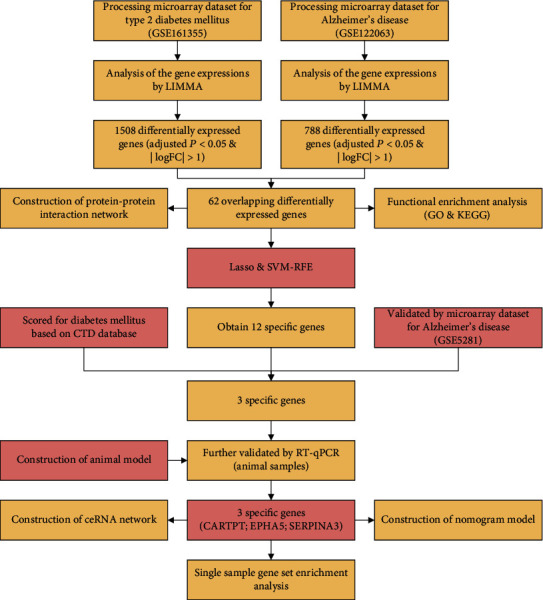
The whole analysis flow for this study.
2.1. Microarray Data
Gene expression profiling in this work was downloaded from the NCBI-GEO database [16]. Specifically, the GSE161355 [17] dataset for the human temporal cortex (T2DM: 6 cases; normal controls: 5 cases) was executed on the GPL570 platform; the GSE122063 [18] (AD: 28 cases; normal controls: 22 cases) and GSE5281 (AD: 16 cases; normal controls: 12 cases) datasets for the human temporal cortex were, respectively, based on the GPL16699 and the GPL570 platforms.
2.2. Data Processing
R software (version 4.0.2) and Bioconductor packages (http://www.bioconductor.org/) [19] were subsequently applied in the data processing.
For the .CEL format files (GSE161355), the “affy” [20] (version 1.66.0), and “affyPLM” [21] (version 1.64.0) packages are used to process the raw data by the RMA (robust multiarray average) function firstly [22]. Then, the probe identification numbers were converted into the official gene symbols according to the GPL570 platform. If multiple probes correspond to one gene, the average value was selected. After processing the missing value of the gene expression profile file by the KNN (k-nearest neighbor) algorithm [23], the “LIMMA” package [24] (version 3.44.3) built-in R was used to identify the differentially expressed genes (DEGs; adjusted P < 0.05 and |logFC| > 1 were set as the cutoff criteria).
For the .txt format files (GSE122063 and GSE5281), the probe identification numbers were converted into the official gene symbols according to the GPL16699 and GPL570 platforms. The average expression was taken when multiple probes corresponded to the one. After log2 transformation and normalization, the “LIMMA” package (version 3.44.3) was used to identify the DEGs (adjusted P < 0.05 and |logFC| > 1 were set as the cutoff criteria). The GSE5281 dataset served as the validation set in this research.
2.3. Gene Ontology and Pathway Enrichment Analysis
Gene Ontology (GO) and Kyoto Encyclopedia of Genes and Genomes (KEGG) pathway enrichment analyses [25] were executed by using clusterProfiler package [26] (version 3.16.0) in R software (version 4.0.2) for function annotating and pathway predicting. When the results met the cutoff criterion (P < 0.05), it was considered statistically significant.
2.4. Construction of Protein-Protein Interaction (PPI) Network and Module Analysis
STRING (Search Tool for the Retrieval of Interacting Genes/Proteins; https://www.string-db.org/) [27] integrating multiple databases that provide information on candidate genes was employed for predicting the potential PPI network and detecting the possible associations (confidence score 0.4). Furthermore, the MCODE (version 1.6.1) and cytoHubba (version 0.1) plugin [28] built in the Cytoscape software (http://cytoscape.org/; version 3.7.2) were, respectively, used to identify the significant module and hub genes in the constructed network.
2.5. Screening and Validation of the Specific Genes in the Disease
The least absolute shrinkage and selection operator (LASSO) logistic regression [29] with the “glmnet” package (version 4.1-1) and the support vector machine-recursive feature elimination (SVM-RFE) [30] with the “e1071” package (version 1.7-6) were applied to screen the specific genes. The obtained results of the two algorithms were intersected and displayed in a Venn diagram, and all of them were further screened through the combination of Comparative Toxicogenomics Database (CTD; http://ctdbase.org/) [31] and the GSE5281 dataset. Besides, we used the pROC package (version 1.18.0) [32] of R to analyze the receiver operating characteristic (ROC) curve to evaluate their performance.
2.6. Experimental Animals
Adult C57BL/6 mice (male; 4-week-old; n = 10) were purchased for type 2 diabetes model construction, and they were randomly divided into the control (n = 5) and the diabetic group (n = 5). The newly purchased animals were fed with regular chow diet for one week. In the following 4 weeks, the control mice were continued to be regular fed, while the model mice were given high-fat diet [33]. Eight-month-old APP/PS1 mice (male; n = 5) were used as AD model in vivo, and age-matched C57BL/6 mice were the controls (male; n = 5). All animals were housed in standard polypropylene cages. During the period, they were allowed to free diet under a stable condition (lights on: 08 : 00 am; lights off: 20 : 00 pm; optimum temperature: 23 ± 2°C; suitable humidity: 55 ± 5%). All the animal experiments were approved by the Institutional Animal Care and Use Committee of Jinan University.
2.7. Type 2 Diabetes Model
Before the start of the experiment, another week of environmental adaptation was carried out. For the diabetic group, 45 mg/kg streptozocin (STZ; Solarbio Beijing) was intraperitoneally injected for one week, while the same volume of saline was injected into the controls. During the week of drug injection, we trained the mice on the Y maze for the first six days and performed the final behavioral test on the seventh day. The blood glucose in caudal venous was detected every two days. When random blood glucose > 16.7 mmol/L [34], they were considered diabetic.
2.8. Behavioral Test
The Y maze was applied to detect the memory ability of mice. The maze consists of three arms divided into 1 start arm and 2 nonstart arms. Each arm was 30 cm long, 15 cm high, and 10 cm wide with an angle of 120 degrees. Markers were set around the maze. The first six days are the training period. Each mouse was placed at the end of one start arm and allowed to freely move through the maze for adaptation over the course of 5 minutes. One (target arm) was randomly selected in the two nonstart arms, with food placed on the end and well marked, and the another (nontarget arm) was left untreated. After the adaptation, put the animal back into the end of the start arm, timing was initiated, and the latency and times for the animal to correctly enter the food arm were recorded. Each animal repeated 6 times daily. On the seventh day, the mark of the target arm was changed, and no food was put in. After the animal was put into the start arm, the duration and times of the animal entering the target arm were recorded. The test period of each mice was 5 minutes. The maximum number of arm alternations was defined as the number of occurrences in all arms minus 2, and the percentage of arm alternations was (number of occurrences in the target arm/maximum number of alternations) × 100 [35].
2.9. Sample Collection
After completing all tests, the experimental mice were decapitated. The mice were anesthetized with 15% pentobarbital sodium solution (intraperitoneal injection; 0.4 ml/100 g). Then, cardiac perfusion was performed by irrigation with 0.9% sodium chloride solution [36]. The temporal cortex was collected and stored at −80°C until molecule experiments.
2.10. Reverse Transcription Quantitative Real-Time Polymerase Chain Reaction (RT-qPCR)
RNAs were extracted from the temporal cortex of mice using TRIzol reagent (Invitrogen, CA, USA), and the concentration and purity were detected by Nanodrop. According to the manufacturer's instructions, we reverse-transcribed the RNAs into cDNAs with the PrimerScript RT Reagent Kit (Takara). With the SYBR Premix Ex Taq (Takara), RT-qPCR proceeded in the Bio-Rad CFX96 TouchTM system. The primer of different genes needed in our research is shown in the Supplementary Table 1. Target genes were normalized to GAPDH using the comparative CT method.
2.11. ceRNA Network Construction
The miRNAs interacting with the DEGs were predicted by the StarBase (http://starbase.sysu.edu.cn) database [37] or miRSystem (http://mirsystem.cgm.ntu.edu.tw/) database [38]. StarBase integrates seven well known miRNA target gene prediction programs: PITA, RNA22, miRmap, microT, miRanda, PicTar, and TargetScan, while miRSystem integrates DIANA, miRanda, miRBridge, PicTar, PITA, RNA22, and TargetScan. After comprehensive evaluation, the miRNAs hitting the most programs will be included in our research. The interaction between miRNA and lncRNAs/circRNAs was also predicted by using the StarBase. During the operation, we refer to the ClipExpNum to remove the weak interactions with miRNAs for net simplifying.
2.12. Nomogram Model
A nomogram model (“rms” package; version 6.2-0) [39] was built to predict the risk of AD. Using the calibration curve, the predictive ability of nomogram model was evaluated. In addition, decision curve analysis and clinical impact curve were used to assess the clinical value of the model.
2.13. The Gene-Drug Interaction Analysis
The Drug Gene Interaction Database (DGIdb) [40] (https://www.dgidb.org) provides information about the association of genes with their known or potential drugs. We searched the specific genes in it to explore their possible drugs and their directions.
2.14. Assessment of Hallmark Gene Sets and Immune Cell Infiltration
The relative levels of the 50 hallmark gene sets and the 28 immune cells in the GSE122063 dataset (AD) were quantified using ssGSEA algorithm [41]. Plots were generated to present the differential expression levels between the controls and AD. In addition, Spearman's correlations for the 50 hallmark gene sets and the 28 immune cells with the specific genes were calculated, which were visualized by using the “ggplot2” package [42] (version 3.3.2).
2.15. Statistical Analysis
Statistical analyses were executed using SPSS 23.0 (Chicago, USA). The results for the behavior test and molecular experiments are presented as mean ± SEM. For data examination, the parametric Student's t-test was employed. All tests were two-tailed. When P < 0.05, it was considered statistically significant.
3. Results
3.1. DEG Identification
The analysis of differentially expressed genes (GSE161355 or GSE122063) was executed by the “LIMMA” package (version 3.44.3) with the criteria of the |log2 FC| > 1 and adjusted P value < 0.05. In general, a total of 1508 DEGs (Supplementary file 1) were screened in human diabetes-associated temporal cortex, including 1473 downregulated genes and 35 upregulated genes, which were intuitively presented in a volcano map (Figure 2(a)). On the other side, 788 DEGs (Supplementary file 2) were identified in AD temporal cortex when compared to controls, including 475 downregulated genes and 313 upregulated genes, which were also exhibited in a volcano map (Figure 2(b)). Among the two sets of DEGs, there were 62 overlapping items (Figure 2(c)). Here, we used the overlapping for subsequent studies to explore the mechanisms linking diabetes to AD. Supplementary Figure 1 visualizes the expression level of these 62 genes in GSE122063 (AD) in the form of a heatmap.
Figure 2.
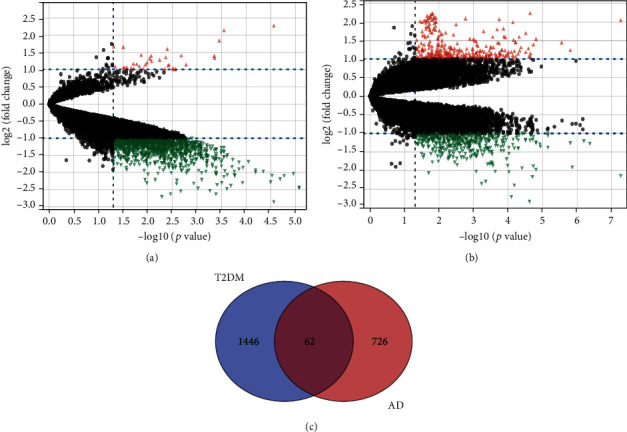
Volcano plot of differently expressed genes. (a) GSE161355 (T2DM), (b) GSE122063 (AD), and (c) the intersection of the two sets of DEGs: 62 genes.
3.2. Enrichment Analysis for the 62 Overlapping DEGs
The terms of GO mainly consist of biological process (BP), cellular component (CC), and molecular function (MF). As shown in Figure 3(a), synaptic vesicle cycle (GO:0099504), synaptic vesicle endocytosis (GO:0048488), and presynaptic endocytosis (GO:0140238) were the most remarkable annotations in BP. For the CC (Figure 3(b)), most of the overlapping genes were enriched in synaptic vesicle (GO:0008021), transport vesicle (GO:0030133), and exocytic vesicle (GO:0070382). Among the significant MF enrichments (Figure 3(c)), hormone activity (GO:0005179), bicarbonate transmembrane transporter activity (GO:0015106), and syntaxin-1 binding (GO:0017075) were dominant. On the other hand, the MAPK signaling pathway (hsa04010) is highlighted in the KEGG pathway enrichments (Figure 3(d)).
Figure 3.
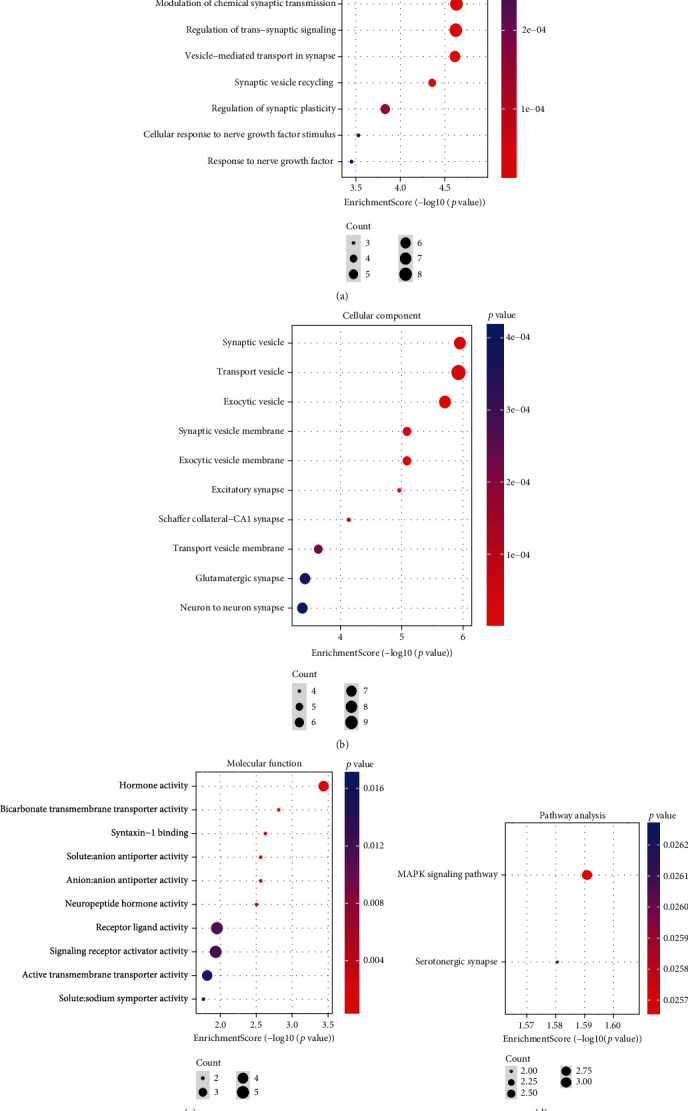
Bubble diagram displays the significant enrichment terms for the 62 DEGs. (a) BP terms, (b) CC terms, (c) MF terms, and (d) KEGG terms.
3.3. PPI Network
All the 62 overlapping DEGs were then imported into the STRING for the PPI network construction, which were finally visualized by the Cytoscape (http://cytoscape.org/;version 3.7.2). This resulting network contained 24 nodes and 39 edges (Figure 4(a)) with a most significant module (Figure 4(b); score: 2.7) obtained by using the MCODE plugin (version 1.6.1) of the Cytoscape. Relying on the same software, we further captured the top 5 hub genes in the network through the MCC algorithm with the cytoHubba plugin (version 0.1) (Figure 4(c)).
Figure 4.
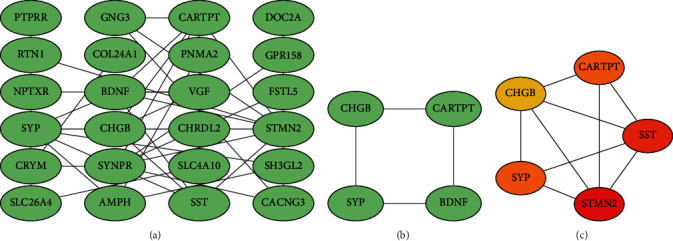
(a) PPI network constructed by the 62 DEGs (the disconnected nodes were hidden), (b) the most significant module in the network (score: 2.7), and (c) top 5 genes computed by the MCC algorithm (the darker the color, the higher the score).
3.4. Identification of the Specific Genes in Disease
We believe that these 62 overlapping genes are differentially altered in AD patients and susceptible to glycemic disturbances. Therefore, we extracted their expression values in the AD dataset for further study. Base on the gene expression matrix from the GSE122063 dataset, we identified 13 specific genes (IGLL5, COL24A1, C20orf195, LOC283737, SERPINA3, LPP-AS2, ZCCHC12, OSR1, CHRDL2, LY96, LOC100507165, EPHA5, and CARTPT) from the 62 overlapping DEGs with the LASSO logistic regression algorithm (Figure 5(a)). Furthermore, 40 specific genes (CARTPT, LOC283737, SERPINA3, RNF165, LOC100507165, COL24A1, TSPAN7, CHRDL2, C5orf55, DGKI, VGF, IGLL5, LY96, LOC100129973, KDM4D, SLC26A4, OSR1, C20orf195, SLC5A11, NPTXR, WDR54, MYOT, SST, LPP-AS2, ABCC12, BDNF, LY86-AS1, SYNPR, FSTL5, AMPH, ZWILCH, NRSN1, CHGB, CACNG3, PTPRR, COPG2IT1, CASQ1, NLGN4Y, C2orf80 and EPHA5) were also filtered using the SVM-RFE algorithm (Figure 5(b)). Subsequently, 12 genes (SERPINA3, CARTPT, LY96, EPHA5, COL24A1, OSR1, CHRDL2, IGLL5, LPP-AS2, C20orf195, LOC283737, and LOC100507165) were determined by the combination of the two algorithms (Figure 5(c)). We ranked these 12 genes according to their reference score involving diabetes in the CTD and chose the top five ranked genes (Figure 5(d)) for expression validation.
Figure 5.
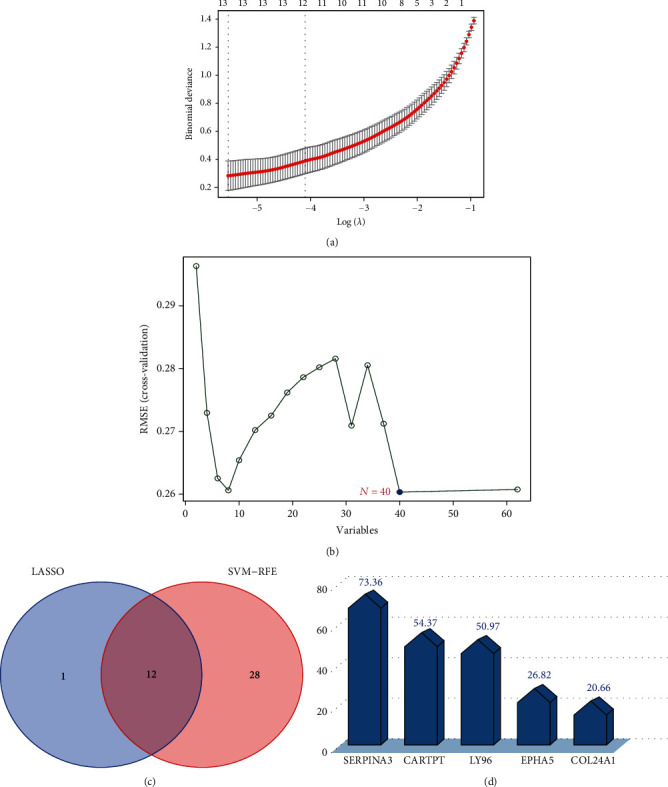
Machine learning algorithms for finding characteristic genes. (a) The LASSO logistic regression algorithm (13 genes). (b) The SVM-RFE algorithm (40 genes). (c) The intersection of the two algorithms (12 genes). (d) The inference score of T2DM based on the CTD database (of these overlapping 12 genes, the top 5 ranked were visualized).
3.5. Verification of the Specific Genes in Datasets
We validated the expression value of the five specific genes in the GSE5281 dataset (AD; the validation set; P < 0.05 was considered significant), and the results presented that CARTPT, EPHA5, and SERPINA3 met the criteria (Figures 6(a)–6(c)). Because the P value of COL24A1 (Supplementary Figure 2) and LY96 (Supplementary Figure 3) was 0.37 and 0.7, respectively, they were not available for the subsequent analysis. In addition, the expression value of CARTPT, EPHA5, and SERPINA3 in the GSE122063 (AD; the training set; Figures 6(d)–6(f)) and GSE161355 (T2DM; Figures 6(g)–6(i)) datasets was also calculated. The trend of the dysregulated expression for the three genes was consistent in the three different datasets.
Figure 6.
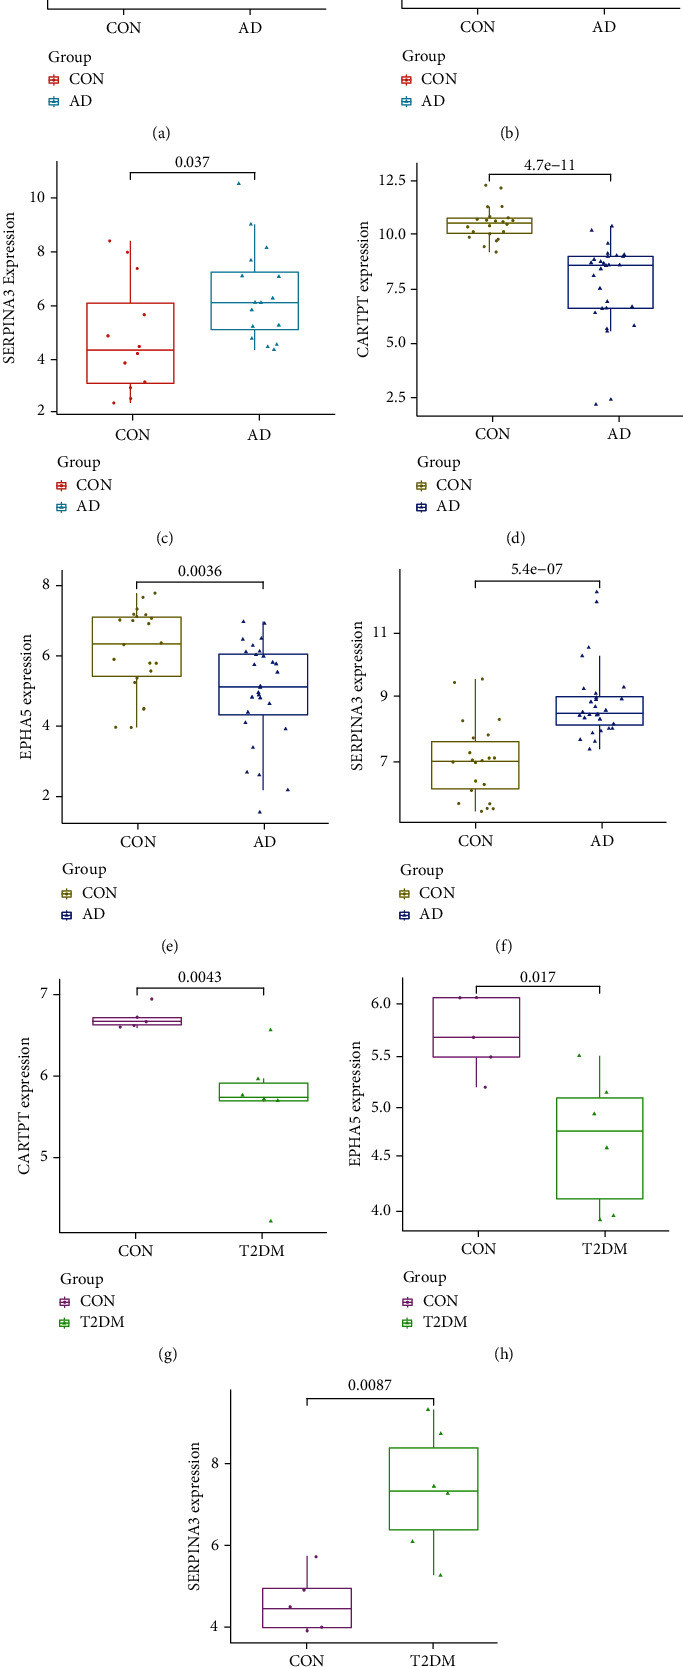
The expression value of CARTPT, EPHA5, and SERPINA3. (a) Validated in the GSE5281 (AD, P < 0.05), (b) expression value calculated based on the GSE122063 (AD, P < 0.05), and (c) expression value calculated based on the GSE161355 (T2DM, P < 0.05).
Consequently, we drew receiver operating characteristic (ROC) curve to further test their efficacy in the GSE122063 dataset (AD; the training set). For CARTPT, the area under the curve (AUC) was 0.969 and 95% CI: 0.919−1.000 (Figure 7(a)). For EPHA5, the area under the curve (AUC) was 0.739 and 95% CI: 0.588−0.865 (Figure 7(b)). For SERPINA3, the area under the curve (AUC) was 0.886 and 95% CI: 0.760−0.981 (Figure 7(c)). We also evaluated them in the GSE161355 dataset (T2DM). For CARTPT, the area under the curve (AUC) was 1.000 and 95% CI: 1.000−1.000 (Figure 7(d)); for EPHA5, the area under the curve (AUC) was 0.933 and 95% CI: 0.733−1.000 (Figure 7(e)); for SERPINA3, the area under the curve (AUC) was 0.967 and 95% CI: 0.800−1.000 (Figure 7(f)). All results indicated that CARTPT, EPHA5, and SERPINA3 had high diagnostic values in both AD and T2DM.
Figure 7.
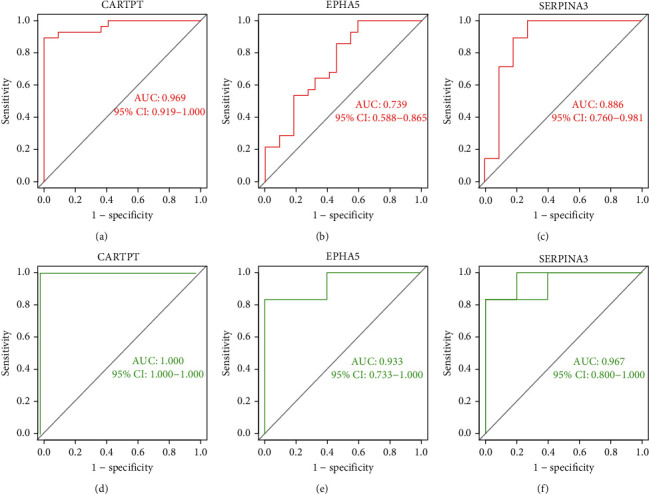
Diagnostic performance of CARTPT, EPHA5, and SERPINA3. (a–c) The ROC curves based on the GSE122063 (AD) and (d–f) the ROC curves based on GSE161355 (T2DM).
3.6. Animal Model Evaluation
The flow of the animal experiment is shown in Figure 8(a). After STZ injection within 1 week, the level of random blood glucose in C57BL/6 mice was significantly increased (Figure 8(b); >16.7 mmol/L; P < 0.05) when compared with the controls (normal saline injection), indicating that STZ treatment successively induced diabetic model. Besides, the percentage of correct alternation arm was significantly decreased in the diabetic and APP/PS1 mice when compared with the controls (P <0.05, Figure 8(c)), signifying that diabetic and 8-month-old APP/PS1 mice had already developed memory impairment.
Figure 8.
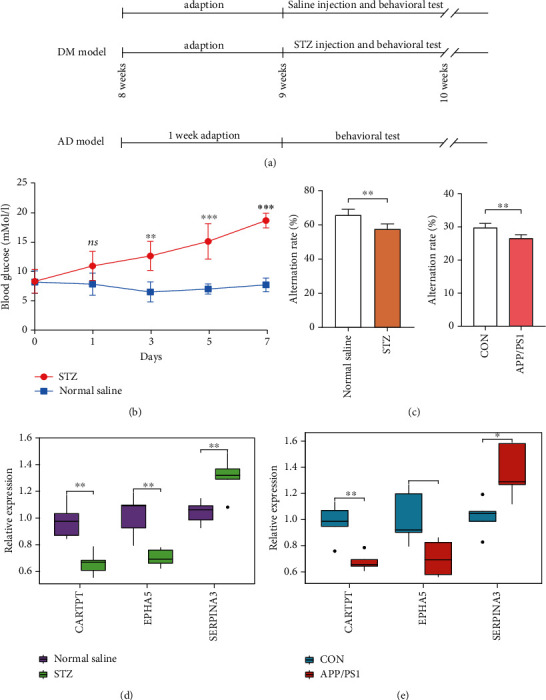
Temporal cortex tissue for external validation: (a) time-flow diagram; (b) changes in blood glucose; (c) results of behavioral test (Y maze); (d) RT-qPCR for CARTPT, EPHA5, and SERPINA3 (n = 5 in the control mice; n = 5 in the T2DM mice); and (e) RT-qPCR for CARTPT, EPHA5, and SERPINA3 (n = 5 in the control mice; n = 5 in the APP/PS1 mice). The significance of differences indicated in figures: ∗P < 0.05, ∗∗P < 0.01, and ∗∗∗P < .001.
3.7. RT-qPCR
Following our successfully constructed animal models, RT-qPCR was conducted to finally verify the specific genes in the mice temporal cortex of T2DM and AD. In Figure 8(d), CARTPT and EPHA5 showed a significant decrease (P < 0.05), while the expression of SERPINA3 statistically increased (P < 0.05) in STZ group when compared with the control. In the aspect of AD model (Figure 8(e)), CARTPT and EPHA5 decreased significantly (P < 0.05), while the expression of SERPINA3 was significantly enhanced (P < 0.05). Based on these data, we judge that the previous speculations are reliable.
3.8. ceRNA Network
In miRSystem database, hsa-miR-377-3p was predicted to interact with CARTPT by 3 programs. In StarBase database, hsa-miR-20a-5p, hsa-miR-93-5p, hsa-miR-106a-5p, and hsa-miR-106b-5p were, respectively, predicted to interact with EPHA5 by 6 programs; hsa-miR-137 was predicted to interact with SERPINA3 by 4 programs. To better comprehend the regulation, we further constructed 2 ceRNA networks based on the StarBase database. The simplified lncRNA-miRNA-mRNA network and circRNA-miRNA-mRNA network are, respectively, exhibited in Figures 9(a) and 9(b).
Figure 9.
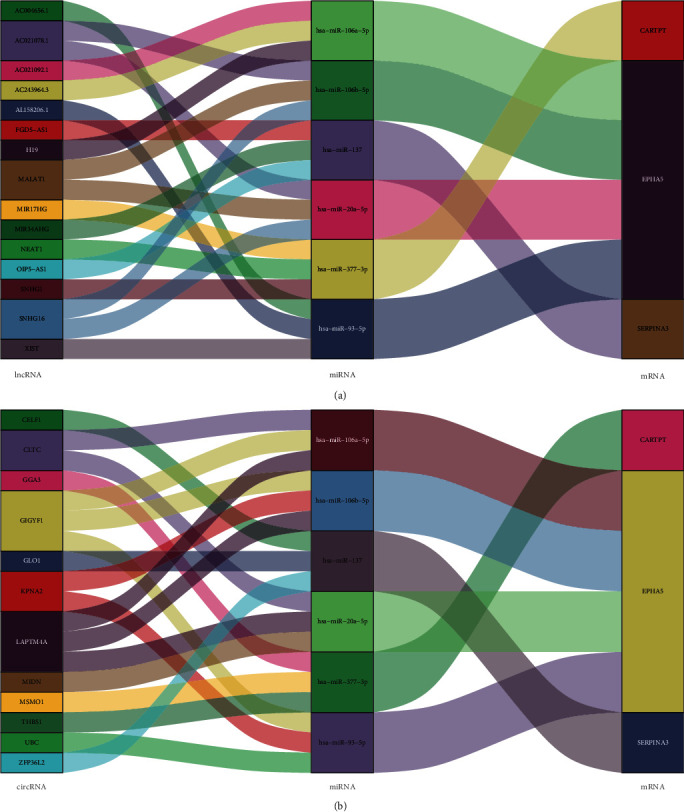
Sankey diagram for the ceRNA network of CARTPT, EPHA5, and SERPINA3. (a) lncRNA-miRNA-mRNA network and (b) circRNA-miRNA-mRNA network.
3.9. Prediction of the Potential Drugs
DGIdb was utilized to quest the possible pharmaceutical compounds. Briefly, 4 compounds (amphetamine, insulin, dexamethasone, and progesterone) were recognized to interplay with CARTPT; the potential agents of EPHA5 may include vandetanib, hesperadin, and paclitaxel. Unfortunately, no drugs for SERPINA3 have been predicted. More details are shown in Table 1.
Table 1.
The potential drugs targeting the specific genes based on the DGIdb.
| Gene | Drug | Sources | PMIDs | Query score | Interaction score |
|---|---|---|---|---|---|
| CARTPT | AMPHETAMINE | TdgClinicalTrial | 15597110, 15661821, 15680473, 16713658, 15644956, and 15680478 | 2.04 | 7.43 |
| INSULIN | NCI | 12883265 | 0.17 | 0.62 | |
| DEXAMETHASONE | NCI | 12591118 | 0.12 | 0.44 | |
| PROGESTERONE | NCI | 18598674 | 0.1 | 0.38 | |
| EPHA5 | VANDETANIB | ChemblInteractions | / | 0.23 | 1.09 |
| HESPERADIN | DTC | 19035792 | 0.11 | 0.53 | |
| PACLITAXEL | PharmGKB | 26133776, 22843789, 26763541, and 26133777 | 0.08 | 0.39 | |
| SERPINA3 | / | / | / | / | / |
3.10. Construction of the Nomogram Model
Using the “rms” package (version 6.2-0) in R (version 4.0.2), a nomogram model based on the 3 specific genes (CARTPT, EPHA5, and SERPINA3) was constructed to predict the risk of Alzheimer's disease (Figure 10(a); GSE122063). As shown in Figure 10(b), the calibration curve suggested a high predictive accuracy of the nomogram model. From 0 to 1 on the abscissa (Figure 10(c)), the red line in the DCA curve is far from and consistently above the gray and black lines, manifesting that decision-making based on the nomogram model may benefit AD patients. At last, we evaluated the clinical impact of the nomogram model through a clinical impact curve (Figure 10(d)).
Figure 10.
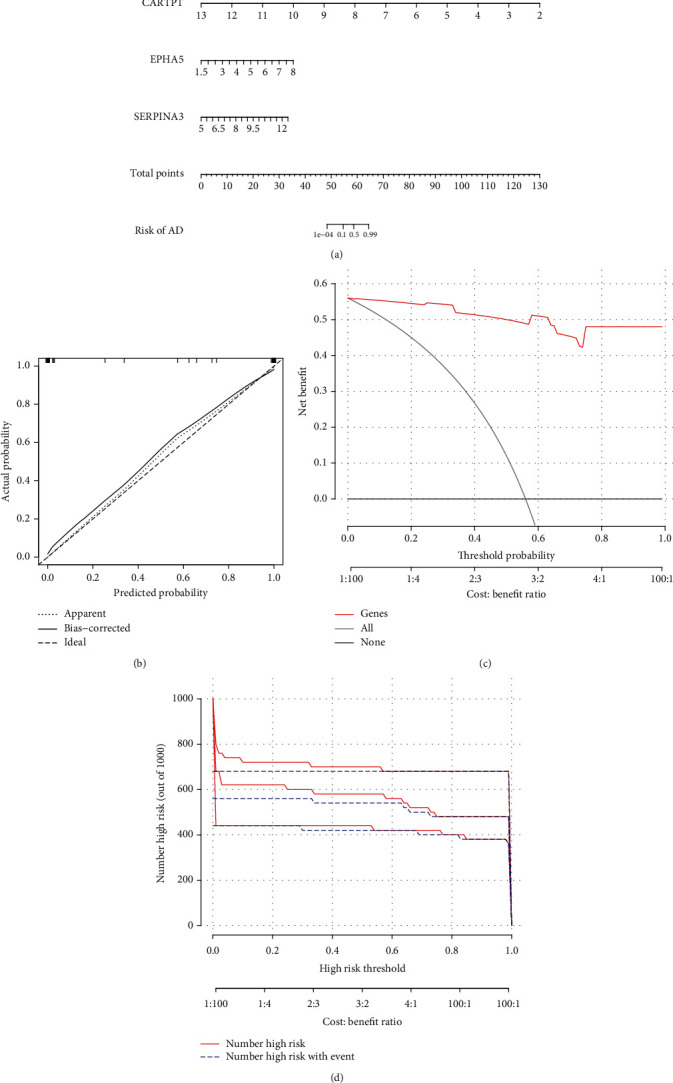
The nomogram model based on the gene expression in GSE122063 (AD). (a) The nomogram, (b) the calibration curve, (c) the DCA curve, and (d) the clinical impact curve.
3.11. Hallmark Gene Sets and Immune Cell Infiltration
To further assess the differences in the hallmark gene sets and the immune cell infiltration between controls and AD, the ssGSEA algorithm was employed. The detailed distribution of the 50 hallmark gene sets between AD and control (GSE122063) was illuminated in Figure 11(a) (the significance in the figure as follows: nsP < 1, #P < 0.2, ∗P < 0.05, ∗∗P < 0.01, and ∗∗∗P < .001). In addition, the infiltration of 28 immune cells between the two groups is shown in Figures 12(a) and 12(b). Briefly, we can find that there are 14 differentially infiltrating immune cells between AD and control groups; they are activated dendritic cell, immature B cell, immature dendritic cell, MDSC, macrophage, natural killer T cell, natural killer cell, neutrophil, plasmacytoid dendritic cell, regulatory T cell, type 1 T helper cell, type 17 T helper cell, central memory CD8 T cell, and effector memory CD8 T cell. Figure 11(b) shows the correlation of the hallmark gene sets with the specific genes (CARTPT, EPHA5, and SERPINA3), and Figure 12(c) shows the details of their related immune cells. P < 0.05 was considered statistically significant. We can find that CARTPT and EPHA5 are generally consistent, while SERPINA3 has the opposite. For instance, both CARTPT and EPHA5 are negatively correlated with the HALLMARK_APICAL_JUNCTION, but SERPINA3 is positively correlated with that; both CARTPT and EPHA5 are negatively correlated with the natural killer T cell, but SERPINA3 is positively correlated with that. These data will help us further appreciate the critical role of the specific genes.
Figure 11.
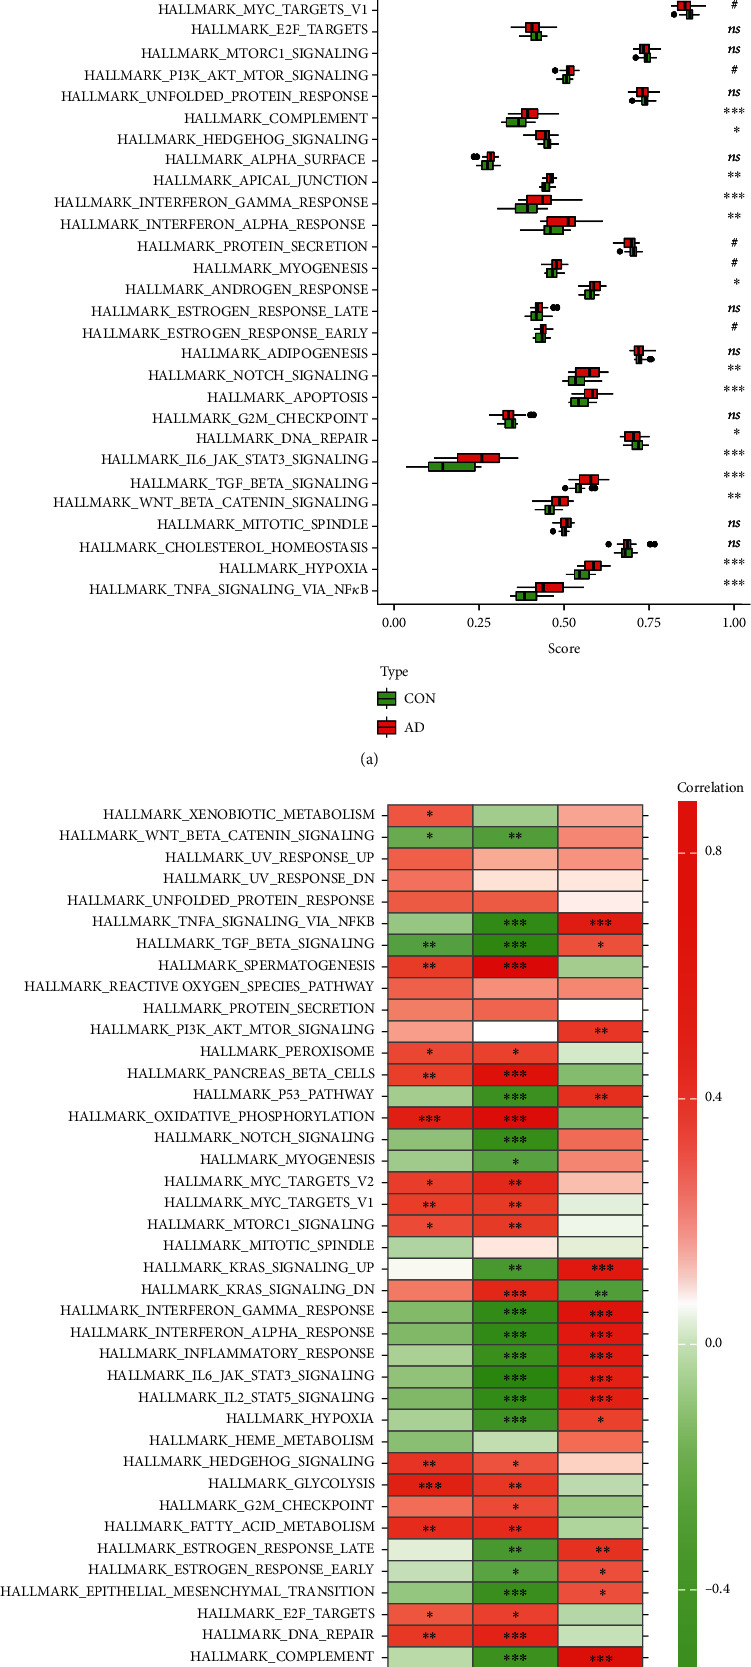
Analysis of hallmark gene sets associated with AD (GSE122063): (a) the specific distribution of the 50 hallmark gene sets in AD and (b) the correlation analysis of the 50 hallmark gene sets with CARTPT, EPHA5, and SERPINA3.
Figure 12.
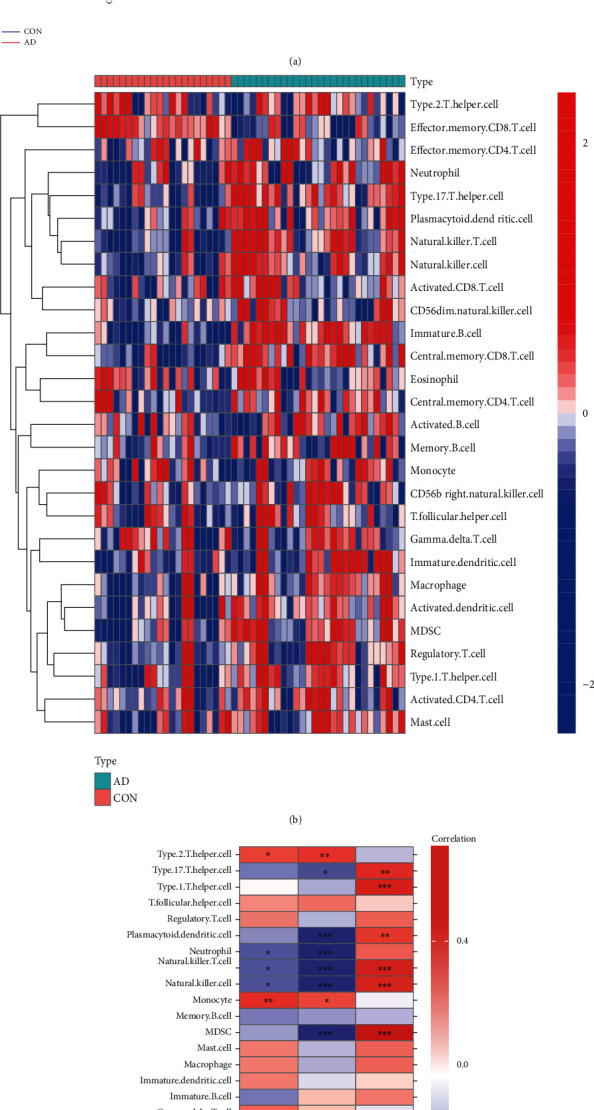
Analysis of immune landscape associated with AD (GSE122063) (a) violin plot: 14 types of immune cells were differently distributed between healthy control and AD (b) heatmap; (c) the relationship between 3 genes (CARTPT, EPHA5, and SERPINA3) and immune cell infiltration.
4. Discussion
Alzheimer's disease is a neurodegenerative disease with insidious progression [43]. Despite nearly 100 years of research on it, the etiology, pathogenesis, and risk factors are far from being elucidated, which has also led to repeated setbacks in AD drug development. Therefore, finding the risk factors affecting AD, identifying AD high-risk populations, and intervening in novel therapeutic targets have become hot spots in AD research. Recent studies have shown that diabetes can accelerate the decline of executive function in patients [44, 45]. This impairment is significantly related to the time of suffering from diabetes and the level of aging glycosylated hemoglobin in the blood [46]. Due to the lack of a complete cure, it is urgent to reduce the risk of dementia. Understanding how diabetes affects cognition through which targets, and taking early interventions to delay its progression, is of great help to current research.
This time, our GEO-based research discovered 62 DEGs overlapping in the dataset of GSE122063 (AD) and GSE161355 (T2DM) by integrated bioinformatics. The resulting GO enrichments indicated that these genes were closely related to the synaptic function. Synapses are important mediators for maintaining connections between neurons, and their function and structure can change with the activity of neurons, that is, synaptic plasticity [47]. The loss of neurons and the destruction of synaptic plasticity in the brain are the key to cognitive defects. Studies have reported that the volume of the hippocampal CA1 region was significantly reduced in the streptozotocin-induced diabetic rats [48], accompanied by a decrease in the number of spinophilin-/neurabin II-positive cells; in addition, ultrastructural observations revealed widening of the synaptic cleft and reduction of vesicles, along with atrophy, cristae rupture, and ruffling of mitochondrial chromatin and nuclei [49]. Therefore, targeted regulation of synaptic plasticity may be an important mechanism of diabetes-related cognitive impairment [50].
As we all know, insulin can enter the CNS through the blood-cerebrospinal fluid barrier, regulating brain glucose metabolism and the brain structural plasticity to improve memory [51]. To exert this function, insulin mainly activates the mitogen-activated protein kinase (MAPK) [52] and phosphatidylinositol 3-kinase (PI3-K)/Akt [53] signaling pathways. In our pathway enrichment analysis, MAPK signaling (hsa04010) ranked at the top. MAPKs are a group of serine-threonine protein kinases that can be activated by diverse extracellular stimuli. Insulin resistance (IR) can cause strong MAPK immunoreactivity, leading to tau hyperphosphorylation, and a positive correlation between the number of MAPKs and tau protein accumulations was found in transgenic mice accompanied by hyperphosphorylated tau [54]. All this evidence points to the unique role of MAPK signaling in diabetes-related cognitive impairment, and the involved genes are equally worthy of our attention.
Among the overlapping 62 dysregulated genes, we finally identified 3 targets by the machine learning algorithm; they are CARTPT, EPHA5, and SERPINA3. To be specific, we found that CARTPT (logFC: -2.84) and EPHA5 (logFC: -1.18) were significantly downregulated in AD (GSE122063), and they had a good performance as a marker of the disease (GSE122063; the AUC of CARTPT was 0.969; the AUC of EPHA5 was 0.739). On the other side, the expression of SERPINA3 (logFC: 1.82) in samples from AD individuals was higher than that of controls (GSE122063). Likewise, its ROC curve performed well (the AUC of SERPINA3 was 0.886). After further calculation of the AD validation set (GSE5281), we spotted the same trend in the expression of these genes. Similarly, CARTPT (logFC: -1.09) and EPHA5 (logFC: -1.02) were downregulated in T2DM (GSE161355); the AUC of them was 1.00 and 0.933, respectively. As for SERPINA3, the expression of it (logFC: 2.76; GSE161355) in T2DM samples was also higher than the controls (the AUC of its ROC curve was 0.967). We further successfully constructed diabetic and AD animal models, after which brain tissue samples were collected and RT-qPCR was performed to verify our bioinformatics-based predictions. The experimental results (the mRNA level of CARTPT and EPHA5 was significantly decreased, while SERPINA3 increased; P < 0.05) were consistent with the previous analyses. Therefore, we concluded that CARTPT, EPHA5, and SERPINA3 might constitute a molecular bridge between T2DM and AD.
According to the ROC curve of the three genes (Figure 7), it is not difficult to recognize that CARTPT has the highest diagnostic efficacy, whether in diabetes or AD (the AUC of CARTPT was 0.969 and 1.00, respectively, in GSE122063 and GSE161355). More than this, CARTPT is also the core gene of the constructed PPI network (Figures 4(b) and 4(c)). We speculate that the role of the CARTPT in the transformation of diseases may be relatively more significant. Also as a metabolic disorder, middle-aged obesity may increase the risk of AD, and CARTPT was now identified as a target for antiobesity drugs, having a high value in connecting obesity and AD [55]. This provides a reference for us to study the relationship between diabetes and AD. CARTPT is capable of encoding the CART protein [56]. CART, fully known as the cocaine- and amphetamine-regulated transcript, is an endogenous neuropeptide, broadly expressed in the CNS [57]. It has also been documented that the expression of CART is decreased in the CSF of AD patients, and the treatment of exogenous CART can partially ameliorate the deficits of learning and memory in mice [58] by improving the synaptic ultrastructure [59]. This evidence fits well with our enrichment analysis and experimental results. Therefore, we believe that CARTPT has the potential to be a target for metabolic-related neurodegenerative changes.
Eph family proteins include Eph receptors with ephrin ligands and are mainly expressed in the CNS [60]. They bidirectionally regulate synaptic signal transmission with neuronal morphogenesis and participate in neural functions such as learning and memory [61]. EphA5 is mainly involved in the formation of dendritic spines, and EphA5 knockout mice exhibit abnormal dendritic spine morphology and neuronal aggregation in the cerebral cortex [62]. The experiments found that the use of EphA5 receptor agonists was able to improve spatial memory in mice [63]. As an acute phase response protein, SERPINA is thought to be a major component of neuritic plaques in the brain, which promotes the assembly of amyloid and its deposition, affecting individual cognition [64]. Their phenotype in the cognitive impairment is consistent with our findings. Nevertheless, the specific relationship between the 2 specific genes and glucose metabolism is also not clear so far. Therefore, EPHA5 and SERPINA3 were equally valuable in subsequent studies.
The relatively small sample size used for bioinformatics analysis and experimental validation in this study may limit our final conclusions to a certain extent. Consequently, the potential mechanisms for glucose metabolism in AD etiology deserve future investigation.
5. Conclusion
Gene expression data involving AD and type 2 diabetes were downloaded from the public GEO database platform and subjected to a comprehensive bioinformatics analysis with machine learning algorithms in our study, presenting us with the DEGs linking AD and T2DM. The subsequent enrichment and network analysis about these genes conveyed us their biological functions. Through external dataset validation, as well as construction of animal models, collection of brain tissues, and further verification by RT-qPCR, we located and captured the crucial targets among the DEGs. They are, respectively, CARTPT, EPHA5, and SERPINA3, which are perhaps of great value in studying the molecular regulatory mechanisms shared by type 2 diabetes and Alzheimer's disease. The key factors regulating them, such as miRNA and drugs, as well as the clinical prediction and diagnostic value in type 2 diabetes and Alzheimer's disease, were further analyzed. Our finding may shed new light on the treatment of Alzheimer's disease or diabetic cognitive impairment, but follow-up studies still need to be unfolded.
Acknowledgments
This work was supported by the National Natural Science Foundation of China (Grant No. 81971079).
Abbreviations
- AD:
Alzheimer's disease
- T2DM:
Type 2 diabetes mellitus
- CNS:
Central nervous system
- GEO:
Gene Expression Omnibus
- DEGs:
Differentially expressed genes
- GO:
Gene Ontology
- MF:
Molecular function
- BP:
Biological process
- CC:
Cellular component
- KEGG:
Kyoto Encyclopedia of Genes and Genomes
- PPI:
Protein-protein interaction
- STRING:
Search Tool for the Retrieval of Interacting Genes
- LASSO:
Least absolute shrinkage and selection operator
- SVM-RFE:
Support vector machine-recursive feature elimination
- CTD:
Comparative Toxicogenomics database
- ROC:
Receiver operating characteristic
- STZ:
Streptozocin.
Data Availability
The public gene data (GSE161355, GSE122063, and GSE5281) analyzed in this article were downloaded from the NCBI-GEO database (https://www.ncbi.nlm.nih.gov/geo/).
Ethical Approval
All experimental procedures and animal care were approved by the Jinan University Laboratory Animal Ethics Committee.
Conflicts of Interest
The authors declared no potential conflicts of interest with respect to the research, authorship, and/or publication of this article.
Authors' Contributions
Cheng Huang and Keshen Li designed the study. Cheng Huang and Xueyi Wen collected and analyzed the data. Xueyi Wen conducted the experiments. Cheng Huang wrote the initial draft of the manuscript. Hesong Xie and Di Hu contributed to find references. Keshen Li reviewed and edited the manuscript. All authors read and approved the manuscript. Cheng Huang and Xueyi Wen contributed equally to this work.
Supplementary Materials
Supplementary Table 1: primer pairs for RT-qPCR in mice temporal cortex.
Supplementary file 1: the DEGs identified in patients with T2DM compared with controls (GSE161355; a total of 1508 DEGs; including 1473 downregulated genes and 35 upregulated genes).
Supplementary file 2: the DEGs identified in patients with AD compared with controls (GSE122063; a total of 788 DEGs; including 475 downregulated genes and 313 upregulated genes).
Supplementary Figure 1: the heatmap for the expression level of 62 overlapping genes in GSE122063.
Supplementary Figure 2: the expression value of COL24A1 validated in the GSE5281 (no significance).
Supplementary Figure 3: the expression value of LY96 validated in the GSE5281 (no significance).
References
- 1.Feldman H., Woodward M. The staging and assessment of moderate to severe Alzheimer disease. Neurology . 2005;65(6) Supplement 3:S10–S17. doi: 10.1212/WNL.65.6_suppl_3.S10. [DOI] [Google Scholar]
- 2.Breijyeh Z., Karaman R. Comprehensive review on Alzheimer's disease: causes and treatment. Molecules (Basel, Switzerland) . 2020;25(24) doi: 10.3390/molecules25245789. [DOI] [PMC free article] [PubMed] [Google Scholar]
- 3.Xu W., Qiu C., Winblad B., Fratiglioni L. The effect of borderline diabetes on the risk of dementia and Alzheimer’s disease. Diabetes . 2007;56(1):211–216. doi: 10.2337/db06-0879. [DOI] [PubMed] [Google Scholar]
- 4.Adeghate E., Schattner P., Dunn E. An update on the etiology and epidemiology of diabetes mellitus. Annals of the New York Academy of Sciences . 2006;1084(1):1–29. doi: 10.1196/annals.1372.029. [DOI] [PubMed] [Google Scholar]
- 5.Eberle C., Stichling S. Clinical improvements by telemedicine interventions managing type 1 and type 2 diabetes: systematic meta-review. Journal of Medical Internet Research . 2021;23(2, article e23244) doi: 10.2196/23244. [DOI] [PMC free article] [PubMed] [Google Scholar]
- 6.Zilliox L., Chadrasekaran K., Kwan J., Russell J. Diabetes and cognitive impairment. Current Diabetes Reports . 2016;16(9):p. 87. doi: 10.1007/s11892-016-0775-x. [DOI] [PMC free article] [PubMed] [Google Scholar]
- 7.Brady C., Vannest J., Dolan L., et al. Obese adolescents with type 2 diabetes perform worse than controls on cognitive and behavioral assessments. Pediatric Diabetes . 2017;18(4):297–303. doi: 10.1111/pedi.12383. [DOI] [PubMed] [Google Scholar]
- 8.Xue M., Xu W., Ou Y., et al. Diabetes mellitus and risks of cognitive impairment and dementia: a systematic review and meta-analysis of 144 prospective studies. Ageing Research Reviews . 2019;55, article 100944 doi: 10.1016/j.arr.2019.100944. [DOI] [PubMed] [Google Scholar]
- 9.Li L., Hölscher C. Common pathological processes in Alzheimer disease and type 2 diabetes: a review. Brain Research Reviews . 2007;56(2):384–402. doi: 10.1016/j.brainresrev.2007.09.001. [DOI] [PubMed] [Google Scholar]
- 10.Kandimalla R., Thirumala V., Reddy P. Is Alzheimer's disease a type 3 diabetes? A critical appraisal. Molecular Basis Of Disease . 2017;1863(5):1078–1089. doi: 10.1016/j.bbadis.2016.08.018. [DOI] [PMC free article] [PubMed] [Google Scholar]
- 11.Stanciu G., Bild V., Ababei D., et al. Link between diabetes and Alzheimer's disease due to the shared amyloid aggregation and deposition involving both neurodegenerative changes and neurovascular damages. Journal Of Clinical Medicine . 2020;9(6):p. 1713. doi: 10.3390/jcm9061713. [DOI] [PMC free article] [PubMed] [Google Scholar]
- 12.Garcia-Casares N., Jorge R. E., Garcia-Arnes J. A., et al. Cognitive dysfunctions in middle-aged type 2 diabetic patients and neuroimaging correlations: a cross-sectional study. Journal of Alzheimer's Disease . 2014;42(4):1337–1346. doi: 10.3233/JAD-140702. [DOI] [PubMed] [Google Scholar]
- 13.Moheet A., Mangia S., Seaquist E. Impact of diabetes on cognitive function and brain structure. Annals of the New York Academy of Sciences . 2015;1353(1):60–71. doi: 10.1111/nyas.12807. [DOI] [PMC free article] [PubMed] [Google Scholar]
- 14.Moran C., Phan T. G., Chen J., et al. Brain atrophy in type 2 diabetes: regional distribution and influence on cognition. Diabetes Care . 2013;36(12):4036–4042. doi: 10.2337/dc13-0143. [DOI] [PMC free article] [PubMed] [Google Scholar]
- 15.Cui Y., Tang T.-Y., Lu C.-Q., Ju S. Insulin resistance and cognitive impairment: evidence from neuroimaging. Journal of Magnetic Resonance Imaging: JMRI . 2022 doi: 10.1002/jmri.28358. [DOI] [PubMed] [Google Scholar]
- 16.Barrett T., Suzek T. O., Troup D. B., et al. NCBI GEO: mining millions of expression profiles—database and tools. Nucleic Acids Research . 2004;33(supplement 1):D562–D566. doi: 10.1093/nar/gki022. [DOI] [PMC free article] [PubMed] [Google Scholar]
- 17.Bury J. J., Chambers A., Heath P. R., et al. Type 2 diabetes mellitus-associated transcriptome alterations in cortical neurones and associated neurovascular unit cells in the ageing brain. Acta Neuropathologica Communications . 2021;9(1):1–16. doi: 10.1186/s40478-020-01109-y. [DOI] [PMC free article] [PubMed] [Google Scholar]
- 18.McKay E. C., Beck J. S., Khoo S. K., et al. Peri-infarct upregulation of the oxytocin receptor in vascular dementia. Journal of Neuropathology & Experimental Neurology . 2019;78(5):436–452. doi: 10.1093/jnen/nlz023. [DOI] [PMC free article] [PubMed] [Google Scholar]
- 19.Sepulveda J. L. Using R and bioconductor in clinical genomics and transcriptomics. The Journal of Molecular Diagnostics . 2020;22(1):3–20. doi: 10.1016/j.jmoldx.2019.08.006. [DOI] [PubMed] [Google Scholar]
- 20.Zhan Z., Chen Y., Duan Y., et al. Identification of key genes, pathways and potential therapeutic agents for liver fibrosis using an integrated bioinformatics analysis. PeerJ . 2019;7, article e6645 doi: 10.7717/peerj.6645. [DOI] [PMC free article] [PubMed] [Google Scholar]
- 21.Ge W. H., Lin Y., Li S., Zong X., Ge Z. C. Identification of biomarkers for early diagnosis of acute myocardial infarction. Journal of Cellular Biochemistry . 2018;119(1):650–658. doi: 10.1002/jcb.26226. [DOI] [PubMed] [Google Scholar]
- 22.Huang C., Luo J., Wen X., Li K. Linking Diabetes Mellitus with Alzheimer's Disease: Bioinformatics Analysis for the Potential Pathways and Characteristic Genes. Biochemical Genetics . 2021;60:1–27. doi: 10.1007/s10528-021-10154-8. [DOI] [PubMed] [Google Scholar]
- 23.Lee J. Y., Styczynski M. P. NS-kNN: a modified k-nearest neighbors approach for imputing metabolomics data. Metabolomics . 2018;14(12):1–12. doi: 10.1007/s11306-018-1451-8. [DOI] [PMC free article] [PubMed] [Google Scholar]
- 24.Ritchie M. E., Phipson B., Wu D., et al. limma powers differential expression analyses for RNA-sequencing and microarray studies. Nucleic Acids Research . 2015;43(7):e47–e47. doi: 10.1093/nar/gkv007. [DOI] [PMC free article] [PubMed] [Google Scholar]
- 25.Liang W., Sun F., Zhao Y., Shan L., Lou H. Identification of susceptibility modules and genes for cardiovascular disease in diabetic patients using WGCNA analysis. Journal of Diabetes Research . 2020;2020:11. doi: 10.1155/2020/4178639. [DOI] [PMC free article] [PubMed] [Google Scholar]
- 26.Zhang M., Zhu K., Pu H., et al. An immune-related signature predicts survival in patients with lung adenocarcinoma. Frontiers in Oncology . 2019;9:p. 1314. doi: 10.3389/fonc.2019.01314. [DOI] [PMC free article] [PubMed] [Google Scholar]
- 27.Lan Z., Yao X., Sun K., Li A., Liu S., Wang X. The interaction between lncRNA SNHG6 and hnRNPA1 contributes to the growth of colorectal cancer by enhancing aerobic glycolysis through the regulation of alternative splicing of PKM. Frontiers in Oncology . 2020;10:p. 363. doi: 10.3389/fonc.2020.00363. [DOI] [PMC free article] [PubMed] [Google Scholar]
- 28.Nangraj A. S., Selvaraj G., Kaliamurthi S., Kaushik A. C., Cho W. C., Wei D. Q. Integrated PPI-and WGCNA-retrieval of hub gene signatures shared between Barrett's esophagus and esophageal adenocarcinoma. Frontiers in Pharmacology . 2020;11:p. 881. doi: 10.3389/fphar.2020.00881. [DOI] [PMC free article] [PubMed] [Google Scholar]
- 29.Xv Y., Lv F., Guo H., et al. Machine learning-based CT radiomics approach for predicting WHO/ISUP nuclear grade of clear cell renal cell carcinoma: an exploratory and comparative study. Insights Into Imaging . 2021;12(1):1–14. doi: 10.1186/s13244-021-01107-1. [DOI] [PMC free article] [PubMed] [Google Scholar]
- 30.Liu Y., Cui S., Sun J., Yan X., Han D. Identification of potential biomarkers for psoriasis by DNA methylation and gene expression datasets. Frontiers In Genetics . 2021;12 doi: 10.3389/fgene.2021.722803. [DOI] [PMC free article] [PubMed] [Google Scholar]
- 31.Davis A. P., Grondin C. J., Johnson R. J., et al. The comparative toxicogenomics database: update 2019. Nucleic Acids Research . 2019;47(D1):D948–D954. doi: 10.1093/nar/gky868. [DOI] [PMC free article] [PubMed] [Google Scholar]
- 32.Robin X., Turck N., Hainard A., et al. pROC: an open-source package for R and S+ to analyze and compare ROC curves. BMC Bioinformatics . 2011;12(1):1–8. doi: 10.1186/1471-2105-12-77. [DOI] [PMC free article] [PubMed] [Google Scholar]
- 33.Guan Z.-F., Zhou X.-L., Zhang X.-M., et al. Beclin-1- mediated autophagy may be involved in the elderly cognitive and affective disorders in streptozotocin-induced diabetic mice. Translational Neurodegeneration . 2016;5(1):1–10. doi: 10.1186/s40035-016-0070-4. [DOI] [PMC free article] [PubMed] [Google Scholar]
- 34.Qin Y., He Y.-H., Hou N., et al. Sonic hedgehog improves ischemia-induced neovascularization by enhancing endothelial progenitor cell function in type 1 diabetes. Molecular and Cellular Endocrinology . 2016;423:30–39. doi: 10.1016/j.mce.2016.01.005. [DOI] [PubMed] [Google Scholar]
- 35.Dellu F., Contarino A., Simon H., Koob G., Gold L. Genetic differences in response to novelty and spatial memory using a two- trial recognition task in mice. Neurobiology of Learning and Memory . 2000;73(1):31–48. doi: 10.1006/nlme.1999.3919. [DOI] [PubMed] [Google Scholar]
- 36.Zhou C.-n., Chao F.-l., Zhang Y., et al. Sex differences in the white matter and myelinated fibers of APP/PS1 mice and the effects of running exercise on the sex differences of AD mice. Frontiers in Aging Neuroscience . 2018;10:p. 243. doi: 10.3389/fnagi.2018.00243. [DOI] [PMC free article] [PubMed] [Google Scholar]
- 37.Xu J., Shen X., Wei X., et al. Identification of blood-based key biomarker and immune infiltration in immunoglobulin A nephropathy by comprehensive bioinformatics analysis and a cohort validation. Journal of Translational Medicine . 2022;20(1):1–16. doi: 10.1186/s12967-022-03330-w. [DOI] [PMC free article] [PubMed] [Google Scholar]
- 38.Rau C.-S., Wu S.-C., Lu T.-H., et al. Effect of low-fat diet in obese mice lacking toll-like receptors. Nutrients . 2018;10(10):p. 1464. doi: 10.3390/nu10101464. [DOI] [PMC free article] [PubMed] [Google Scholar]
- 39.Pan X., Jin X., Wang J., Hu Q., Dai B. Placenta inflammation is closely associated with gestational diabetes mellitus. American Journal of Translational Research . 2021;13(5):4068–4079. [PMC free article] [PubMed] [Google Scholar]
- 40.Cotto K. C., Wagner A. H., Feng Y.-Y., et al. DGIdb 3.0: a redesign and expansion of the drug–gene interaction database. Nucleic Acids Research . 2018;46(D1):D1068–D1073. doi: 10.1093/nar/gkx1143. [DOI] [PMC free article] [PubMed] [Google Scholar]
- 41.Chong W., Shang L., Liu J., et al. m6A regulator-based methylation modification patterns characterized by distinct tumor microenvironment immune profiles in colon cancer. Theranostics . 2021;11(5):2201–2217. doi: 10.7150/thno.52717. [DOI] [PMC free article] [PubMed] [Google Scholar]
- 42.Villanueva R. A. M., Chen Z. J. ggplot2: Elegant Graphics for Data Analysis . Vol. 17. Taylor & Francis; 2019. [DOI] [Google Scholar]
- 43.Lin L., Zheng L. J., Zhang L. J. Neuroinflammation, gut microbiome, and Alzheimer’s disease. Molecular Neurobiology . 2018;55(11):8243–8250. doi: 10.1007/s12035-018-0983-2. [DOI] [PubMed] [Google Scholar]
- 44.Lu F.-P., Lin K.-P., Kuo H.-K. Diabetes and the risk of multi-system aging phenotypes: a systematic review and meta-analysis. PLoS One . 2009;4(1, article e4144) doi: 10.1371/journal.pone.0004144. [DOI] [PMC free article] [PubMed] [Google Scholar]
- 45.Palta P., Carlson M., Crum R., et al. Diabetes and cognitive decline in older adults: the Ginkgo evaluation of memory study. The Journals of Gerontology Series A, Biological Sciences and Medical Sciences . 2018;73(1):123–130. doi: 10.1093/gerona/glx076. [DOI] [PMC free article] [PubMed] [Google Scholar]
- 46.Goldwaser E. L., Acharya N. K., Sarkar A., Godsey G., Nagele R. G. Breakdown of the cerebrovasculature and blood-brain barrier: a mechanistic link between diabetes mellitus and Alzheimer’s disease. Journal of Alzheimer's Disease . 2016;54(2):445–456. doi: 10.3233/JAD-160284. [DOI] [PubMed] [Google Scholar]
- 47.Wu Y., Dissing-Olesen L., MacVicar B. A., Stevens B. Microglia: dynamic mediators of synapse development and plasticity. Trends in Immunology . 2015;36(10):605–613. doi: 10.1016/j.it.2015.08.008. [DOI] [PMC free article] [PubMed] [Google Scholar]
- 48.Chandrasekaran K., Choi J., Arvas M., et al. Nicotinamide mononucleotide administration prevents experimental diabetes-induced cognitive impairment and loss of hippocampal neurons. International Journal of Molecular Sciences . 2020;21(11) doi: 10.3390/ijms21113756. [DOI] [PMC free article] [PubMed] [Google Scholar]
- 49.Zhao F., Li J., Mo L., et al. Changes in neurons and synapses in hippocampus of streptozotocin-induced type 1 diabetes rats: a stereological investigation. The Anatomical Record . 2016;299(9):1174–1183. doi: 10.1002/ar.23344. [DOI] [PubMed] [Google Scholar]
- 50.Pu K., Wu M., Jiang T., et al. Involvement of paired immunoglobulin-like receptor B in diabetes-associated cognitive dysfunction through modulation of axon outgrowth and dendritic remodeling. Molecular Neurobiology . 2022;59(4):2563–2579. doi: 10.1007/s12035-021-02679-1. [DOI] [PubMed] [Google Scholar]
- 51.Freiherr J., Hallschmid M., William I. I., Brünner Y. Intranasal insulin as a treatment for Alzheimer's disease: a review of basic research and clinical evidence. Drugs . 2013;27(7):505–514. doi: 10.1007/s40263-013-0076-8. [DOI] [PMC free article] [PubMed] [Google Scholar]
- 52.Sdzikowska A., Szablewski L. Insulin and insulin resistance in Alzheimer's disease. International Journal of Molecular Sciences . 2021;22(18):p. 9987. doi: 10.3390/ijms22189987. [DOI] [PMC free article] [PubMed] [Google Scholar]
- 53.Yang Y., Song W. Molecular links between Alzheimer's disease and diabetes mellitus. Neuroscience . 2013;250:140–150. doi: 10.1016/j.neuroscience.2013.07.009. [DOI] [PubMed] [Google Scholar]
- 54.Correia S. C., Santos R. X., Carvalho C., et al. Insulin signaling, glucose metabolism and mitochondria: major players in Alzheimer's disease and diabetes interrelation. Brain Research . 2012;1441:64–78. doi: 10.1016/j.brainres.2011.12.063. [DOI] [PubMed] [Google Scholar]
- 55.Zhuang Q.-S., Meng L., Wang Z., Shen L., Ji H.-F. Associations between obesity and Alzheimer’s disease: multiple bioinformatic analyses. Journal of Alzheimer's Disease . 2021;80(1):271–281. doi: 10.3233/JAD-201235. [DOI] [PubMed] [Google Scholar]
- 56.Kristensen P., Judge M. E., Thim L., Ribel U., Hastrup S. Hypothalamic CART is a new anorectic peptide regulated by leptin. Nature . 1998;393(6680):72–76. doi: 10.1038/29993. [DOI] [PubMed] [Google Scholar]
- 57.Couceyro P. R., Koylu E. O., Kuhar M. J. Further studies on the anatomical distribution of CART by in situ hybridization. Journal of Chemical Neuroanatomy . 1997;12(4):229–241. doi: 10.1016/S0891-0618(97)00212-3. [DOI] [PubMed] [Google Scholar]
- 58.Schultz K., Wiehager S., Nilsson K., Nielsen J. E., Petersén A. Reduced CSF CART in dementia with Lewy bodies. Neuroence Letters . 2009;453(2):104–106. doi: 10.1016/j.neulet.2009.02.008. [DOI] [PubMed] [Google Scholar]
- 59.Jin J. L., Liou A. K. F., Shi Y., et al. CART treatment improves memory and synaptic structure in APP/PS1 mice. Scientific Reports . 2015;5:p. 10224. doi: 10.1038/srep10224. [DOI] [PMC free article] [PubMed] [Google Scholar]
- 60.Yamaguchi Y., Pasquale E. B. Eph receptors in the adult brain. Current Opinion in Neurobiology . 2004;14(3):288–296. doi: 10.1016/j.conb.2004.04.003. [DOI] [PubMed] [Google Scholar]
- 61.Nikolov D. B., Xu K., Himanen J. P. Eph/ephrin recognition and the role of Eph/ephrin clusters in signaling initiation. Biochimica et Biophysica Acta (BBA)-Proteins and Proteomics . 2013;1834(10):2160–2165. doi: 10.1016/j.bbapap.2013.04.020. [DOI] [PMC free article] [PubMed] [Google Scholar]
- 62.Das G., Yu Q., Hui R., Reuhl K., Gale N. W., Zhou R. EphA5 and EphA6: regulation of neuronal and spine morphology. Cell & Bioscience . 2016;6(1):1–12. doi: 10.1186/s13578-016-0115-5. [DOI] [PMC free article] [PubMed] [Google Scholar]
- 63.Gerlai R., Shinsky N., Shih A., et al. Regulation of learning by EphA receptors: a protein targeting study. Journal of Neuroscience . 1999;19(21):9538–9549. doi: 10.1523/JNEUROSCI.19-21-09538.1999. [DOI] [PMC free article] [PubMed] [Google Scholar]
- 64.Kamboh M. I., Minster R. L., Kenney M., et al. Alpha-1-antichymotrypsin (ACT or SERPINA3) polymorphism may affect age-at- onset and disease duration of Alzheimer's disease. Neurobiology of Aging . 2006;27(10):1435–1439. doi: 10.1016/j.neurobiolaging.2005.07.015. [DOI] [PMC free article] [PubMed] [Google Scholar]
Associated Data
This section collects any data citations, data availability statements, or supplementary materials included in this article.
Supplementary Materials
Supplementary Table 1: primer pairs for RT-qPCR in mice temporal cortex.
Supplementary file 1: the DEGs identified in patients with T2DM compared with controls (GSE161355; a total of 1508 DEGs; including 1473 downregulated genes and 35 upregulated genes).
Supplementary file 2: the DEGs identified in patients with AD compared with controls (GSE122063; a total of 788 DEGs; including 475 downregulated genes and 313 upregulated genes).
Supplementary Figure 1: the heatmap for the expression level of 62 overlapping genes in GSE122063.
Supplementary Figure 2: the expression value of COL24A1 validated in the GSE5281 (no significance).
Supplementary Figure 3: the expression value of LY96 validated in the GSE5281 (no significance).
Data Availability Statement
The public gene data (GSE161355, GSE122063, and GSE5281) analyzed in this article were downloaded from the NCBI-GEO database (https://www.ncbi.nlm.nih.gov/geo/).


