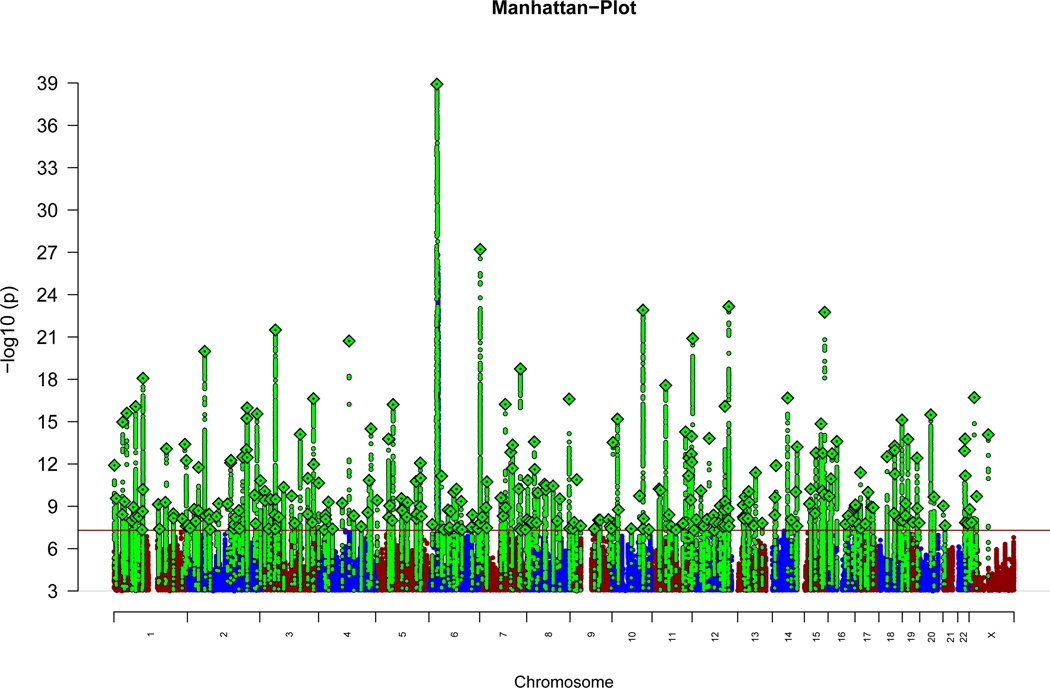
Extended Data Figure 1: Primary GWAS Manhattan plot.
The x-axis indicates chromosomal position and the y-axis is the significance of association (−log10(P)). The red line represents genome-wide significance level (5×10⁻⁸). SNPs in green are in linkage disequilibrium (LD; R2 >0.1) with index SNPs (diamonds) which represent LD independent genome-wide significant associations.

