Abstract
Variations in COVID-19 lesions such as glass ground opacities (GGO), consolidations, and crazy paving can compromise the ability of solo-deep learning (SDL) or hybrid-deep learning (HDL) artificial intelligence (AI) models in predicting automated COVID-19 lung segmentation in Computed Tomography (CT) from unseen data leading to poor clinical manifestations. As the first study of its kind, “COVLIAS 1.0-Unseen” proves two hypotheses, (i) contrast adjustment is vital for AI, and (ii) HDL is superior to SDL. In a multicenter study, 10,000 CT slices were collected from 72 Italian (ITA) patients with low-GGO, and 80 Croatian (CRO) patients with high-GGO. Hounsfield Units (HU) were automatically adjusted to train the AI models and predict from test data, leading to four combinations—two Unseen sets: (i) train-CRO:test-ITA, (ii) train-ITA:test-CRO, and two Seen sets: (iii) train-CRO:test-CRO, (iv) train-ITA:test-ITA. COVILAS used three SDL models: PSPNet, SegNet, UNet and six HDL models: VGG-PSPNet, VGG-SegNet, VGG-UNet, ResNet-PSPNet, ResNet-SegNet, and ResNet-UNet. Two trained, blinded senior radiologists conducted ground truth annotations. Five types of performance metrics were used to validate COVLIAS 1.0-Unseen which was further benchmarked against MedSeg, an open-source web-based system. After HU adjustment for DS and JI, HDL (Unseen AI) > SDL (Unseen AI) by 4% and 5%, respectively. For CC, HDL (Unseen AI) > SDL (Unseen AI) by 6%. The COVLIAS-MedSeg difference was < 5%, meeting regulatory guidelines.Unseen AI was successfully demonstrated using automated HU adjustment. HDL was found to be superior to SDL.
Supplementary Information
The online version contains supplementary material available at 10.1007/s10916-022-01850-y.
Keywords: COVID-19, Lung CT, Glass ground opacities, Segmentation, Hounsfield units, Solo deep learning, Hybrid deep learning, And AI
Introduction
Severe acute respiratory syndrome coronavirus 2 (SARS-CoV-2) is an infectious disease that has infected 385 million individuals and has killed 5.7 million people globally as of 3rd February 2022 [1]. On March 11th, 2020, the World Health Organization (WHO) declared COVID-19 a global pandemic (the novel coronavirus) [2]. COVID-19 [3, 4] has proven to be worse in individuals with comorbidities such as coronary artery disease [3, 5], diabetes [6], atherosclerosis [7], fetal [8], etc. [9–11]. It has also caused architectural distortion with the interactions between alveolar and vascular changes [12] and affected relationships with daily usage such as nutrition [13]. Pathology has shown that even after vaccine immunization (ChAdOx1 nCoV-19), vaccine-induced immune thrombotic thrombocytopenia (VITT) was triggered [14]. It was also observed that adults who are born small, so-called intrauterine growth restriction (IUGR), are also likely to get affected by COVID-19 [8].
One of the gold standards for COVID-19 detection is the "reverse transcription-polymerase chain reaction" commonly known as the RT-PCR test. Nonetheless, the RT-PCR test takes time and has low sensitivity [15–17]. This is where we use the image-based analysis for COVID-19 patients by using Chest radiographs and Computed Tomography (CT) [18–20] to diagnose the disease and work as a reliable complement to RT-PCR [21]. In the general diagnosis of COVID-19 and body imaging, CT has shown high sensitivity and reproducibility [20–, 22–24]. The primary benefit of CT [25, 26] is the imaging capacity to identify anomalies/opacities such as ground-glass opacity (GGO), consolidation, and other opacities [27–29] seen in COVID-19 patients [30–, 31–35].
DL is a branch of AI that employs deep layers to provide fully automatic feature extraction, classification, and segmentation of the input data [36, 37]. Our team has developed the COVLIAS system, which has used deep learning models for lung segmentation [38–40]. In these previous studies, only one cohort was used when applying cross-validation, leading to bias in the performance since both the training and testing data were taken from the same CT machine, same hospital settings, and same geographical region [41–43]. To overcome this weakness, we introduce a multicentre study where training is conducted on one set of data coming from Croatia and testing was conducted using another data set taken from another source. This source was from Italy, the so-called “Unseen AI” (or vice-versa), which is one of the innovations of the proposed study. Just recently, there has been more visibility on “Unseen AI” [38, 44].
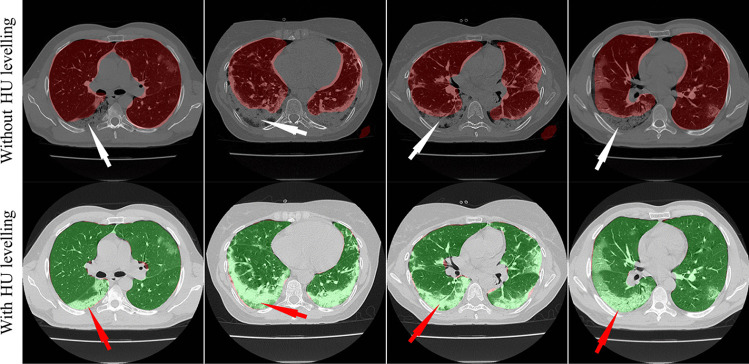
Due to variations in COVID-19 lesions such as GGO, Consolidations, and Crazy Paving, the ability of AI models to predict the automated COVID-19 lung segmentation in CT Unseen data has led to poor clinical manifestations (see Fig. 1). This happens when the Hounsfield Units (HU) [45] of CT images are not consistent between the training and testing paradigms, which leads to over-and under-estimation of the prediction region. This can be prevented via normalization right before AI deployment [46, 47]. We embed such normalization in our AI framework automatically, which is another innovation besides the Unseen AI model design.
Fig. 1.
Overlay of segmentation results (red) from the ResNet-SegNet HDL models trained without adjusting the HU level. The white arrow represents the region where the ResNet-SegNet HDL model under-estimates the lung region
Recent advances in deep learning, such as hybrid deep learning (HDL) have shown promising results [38–40–, 48–52]. Using this premise, we hypothesize that HDL models are superior to solo DL (SDL) models for segmentation. In this study, we have designed nine SDL and HDL models that are trained and tested for COVID-19-based lung segmentation on multicentre databases. We further offer insight into how 9 models of AI reciprocate to COVID-19 data sets, which is another unique contribution of the proposed study. The analysis includes attributes such as (i) the size of the model, (ii) the number of layers in AI architecture, (iii) the segmentation model utilizes, and (iv) the encoder part of the AI model. These can be used for a comparison between the nine AI models. Lastly, to prove the effectiveness of the AI models, we present performance evaluation using (i) Dice Similarity (DS), (ii) Jaccard Index (JI) [53], (iii) Bland–Altman plots (BA) [54, 55], (iv) Correlation coefficient (CC) plot [56, 57], and (v) Figure of Merit. Finally, as part of scientific validation, we compare the performance of COVLIAS 1.0-Unseen against MedSeg [58], a web-based lung segmentation tool.
Literature Survey
Artificial intelligence (AI) has been in existence for a while especially in the field of medical imaging [59, 60]. AI can play a vital role in the investigation of CT and X-ray images, assisting in the detection of COVID-19 type and overcoming the shortage of expert workers. It started with the role of machine learning moving into different application of point-based models such as diabetes [61, 62], neonatal and infant mortality [63], gene analysis [64] and image-based machine learning models such as carotid plaque classification [65–69], thyroid [70], liver [71], stroke [24], coronary [72], ovarian [73], prostate [74], skin cancer [75, 76], Wilson disease [77], ophthalmology [78], etc. The major challenge with these models is the feature extraction process which is ad-hoc in nature and, therefore, very time taking [79]. It has been recently shown that this weakness is being overcome by the deep learning (DL) models [59, 60].
Paluru et al. [80] proposed AnamNet, a hybrid of UNet and ENet to segment COVID-19-based lesions using 4,300 images (using 69 patients with 5122 resolution size) [81]. The authors compared the models against ENet [82], UNet + + [83], SegNet, and LEDNet [84]. The DSC for the lesion detection turned out to be 0.77. Saood et al. [85] used a set of 100 images downscaled to 2562 to compare the results between the two models, namely UNet and SegNet, and showed the DS score of 0.73 and 0.74, respectively. Cai et al. [86] established a tenfold CV protocol on 250 images using 99 patients and adopted the UNet model with a DS of 0.77. They also suggested a method for predicting the duration of an intensive care unit (ICU) stay. Suri et al. [40] benchmarked NIH [87] (a conventional model) against the three AI models, namely, SegNet, VGG-SegNet, and ResNet-SegNet using nearly 5000 CT scans using 72 patients in an image resolution of 7682. Concluding that ResNet-SegNet was the best performing model. In an inter-variability study by Suri et al. [39], three models, namely, PSPNet, VGG-SegNet, ResNet-SegNet were used. The authors showed HDL models outperformed SDL models, by ~ 5% for all the performance evaluation metrics using 5000 CT slices (taken from 72 patients), in an image resolution of 7682. A recent study by the same authors [38] presented VGG-SegNet, and ResNet-SegNet compared to their COVLIAS 1.0 system against MedSeg. This study used HDL models and demonstrated standard Mann–Whitney, Paired t-Test, and Wilcoxon tests to prove the system's stability.
Method and Methodology
Demographics and Data Acquisition
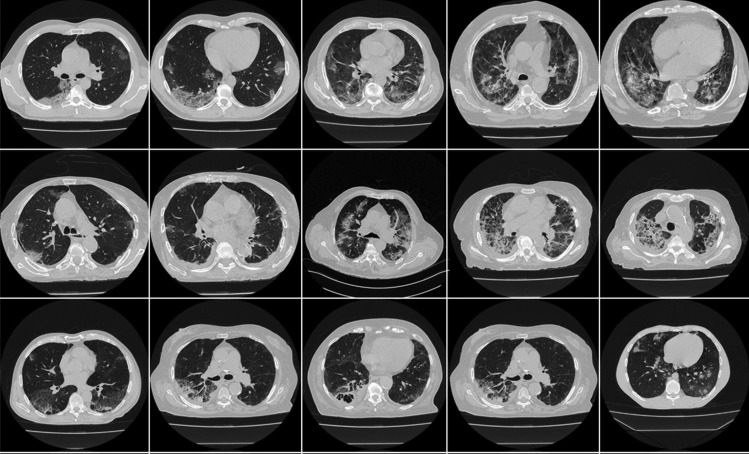
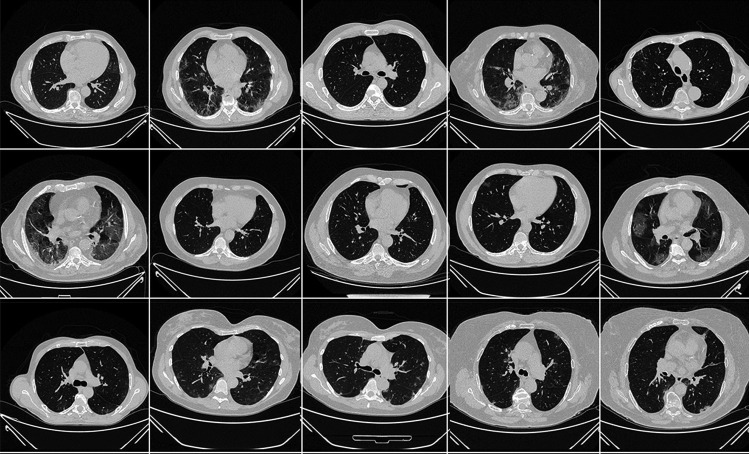
The proposed study utilizes two different cohorts from different countries. The first dataset contains 72 adult Italian patients (approximately 5000 images, Fig. 2), 46 males, and the remainder were female. A total of 60 people tested positive for RT-PCR in which broncho-alveolar lavage [88] was used with 12 individuals. This Italian cohort had an average GGO of 2.1 which was considered low. The second cohort consisted of 80 Croatian patients (approximately 5000 images, Fig. 3), of which 57 were male and the rest female patients. This cohort had a mean age of 66 and an average GGO of 4.1, which was considered high.
Fig. 2.
Sample CT scans taken from raw CRO data sets
Fig. 3.
Sample CT scans taken from raw ITA data sets
For the patients in the Italian cohort, CT data were acquired using Philips' automatic tube current modulation – Z-DOM), while Croatia's CT volumes were acquired using the FCT Speedia HD 64-detector MDCT scanner (Fujifilm Corporation, Tokyo, Japan, 2017). The exclusion criteria consisted of patients having metallic items or poor image quality without artifacts or blurriness induced by patient movement during scan execution [38].
AI Architectures Adapted
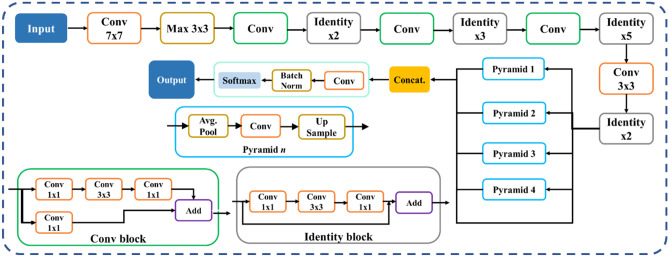
The proposed study uses a total of nine AI models, of which (i) PSPNet (see Supplemental A.1), (ii) SegNet, and (iii) UNet are SDL models and (iv) VGG-PSPNet (Fig. 4), (v) ResNet-PSPNet (Fig. 5), (vi) VGG-SegNet (see Supplemental A.2), (vii) ResNet-SegNet (see Supplemental A.3), (viii)VGG-UNet (Fig. 6), and (ix) ResNet-UNet (Fig. 7) are the HDL models. The difference between the SDL and HDL is that the traditional backbone or encoder part of the SDL model is replaced with a new model like VGG and ResNet. Suri et al. [39, 40, 48, 49, 89] Recent findings show that employing HDL models over SDL models in the medical sector helps learn complicated imaging features rapidly and reliably. Using this knowledge of the performance of HDL > SDL, we here introduce four new HDL models, namely, VGG-PSPNet, ResNet-PSPNet, VGG-UNet, and ResNet-UNet for lung segmentation of COVID-19-based CT images.
Fig. 4.
VGG-PSPNet architecture
Fig. 5.
ResNet-PSPNet architecture
Fig. 6.
VGG-UNet architecture
Fig. 7.
ResNet-UNet architecture
UNet [90] was the first medical segmentation model that consisted of mainly two sections (i) encoder, where the model tries to learn the features in the images, and (ii) decoder, the part of the model that up-samples the image to produce the desired output like a segmented binary lung mask in this study. Another model used in this paper is SegNet [91], which transfers only the pooling indices from the compression (encoder) path to the expansion (decoder) path, thereby using low memory. The Pyramid Scene Parsing Network (PSPNet) [92] is a semantic segmentation network that considers the full context of an image using its pyramid pooling module. PSPNet extracts the feature map from an input image using a pretrained CNN and the dilated network technique. The size of the resulting feature map is 1/8 that of the input image. Finally, the collection of these features is used to generate the output binary mask.
Residual networks (ResNet) [93] use a sequential technique of "skip connections" and "batch normalization" to train deep layers without sacrificing efficiency, permitting gradients to bypass a set number of levels. This solves the vanishing gradient problem which is not present in VGGNet [94]. The primary attributes of the AI models such as the backbone used in the architecture, the number of layers in the training models, the total number of parameters in the architecture, and the final size of the trained models are further discussed and compared in the discussion section.
Experimental Protocol
This study involves two datasets from different centers, each of ~ 5000 lung CT images for COVID-19 patients. We have utilized a fivefold cross-validation [95, 96] technique for the training of AI models without overlap. The training and testing performance was determined by the accuracy score of the binary output of the trained AI model and gold standard [39, 40], respectively.
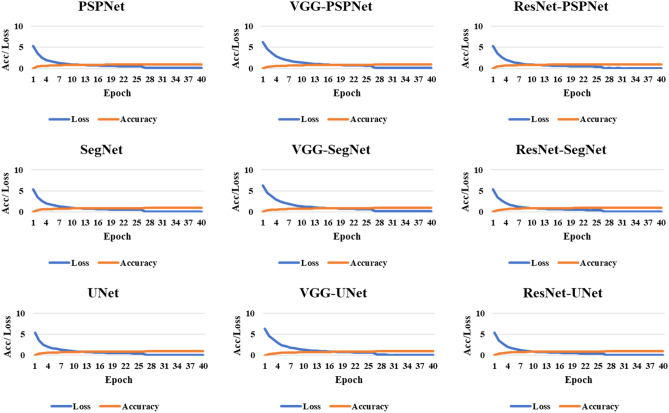
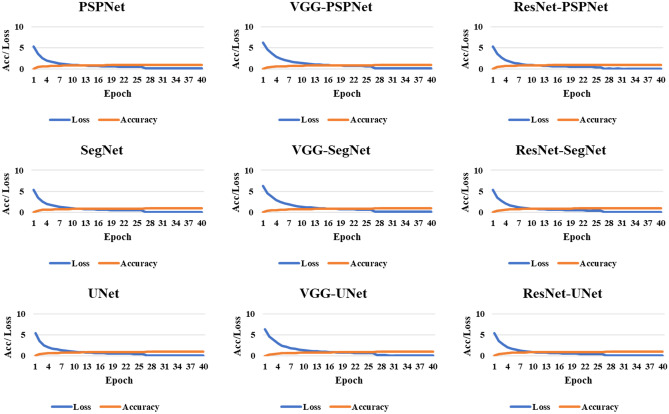
The accuracy of the system was computed using standardized protocol given the true positive, true negative, false negative, and false positive. Finally, to assess the model's training during the backpropagation, the cross-entropy loss function was employed. The plots of the accuracy and loss function can be seen in Figs. 8 and 9.
Fig. 8.
Accuracy and loss plot for the nine AI models for the training on the CRO dataset
Fig. 9.
Accuracy and loss plot for the nine AI models for the training on the ITA dataset
Results and Performance Evaluations
Results
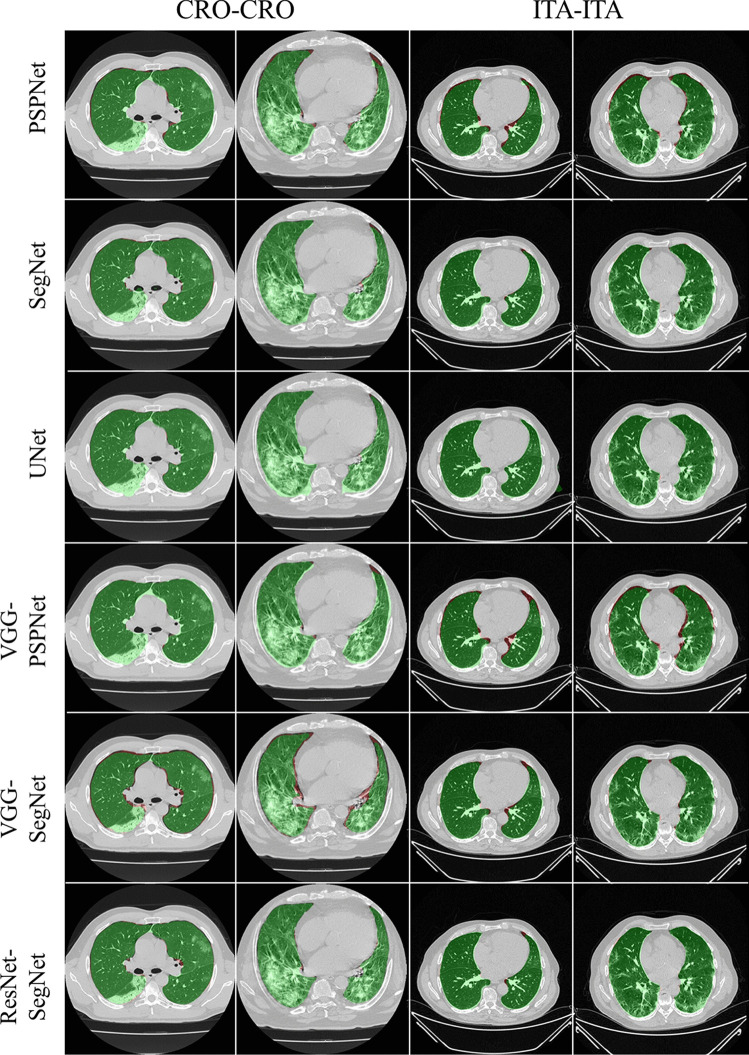
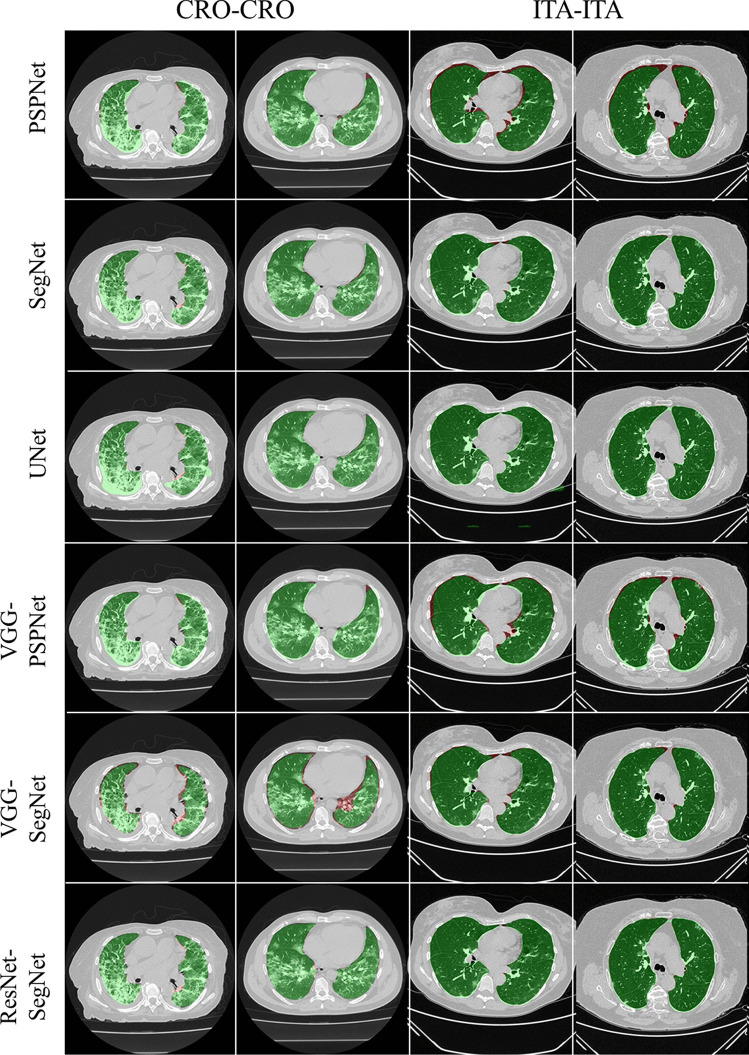
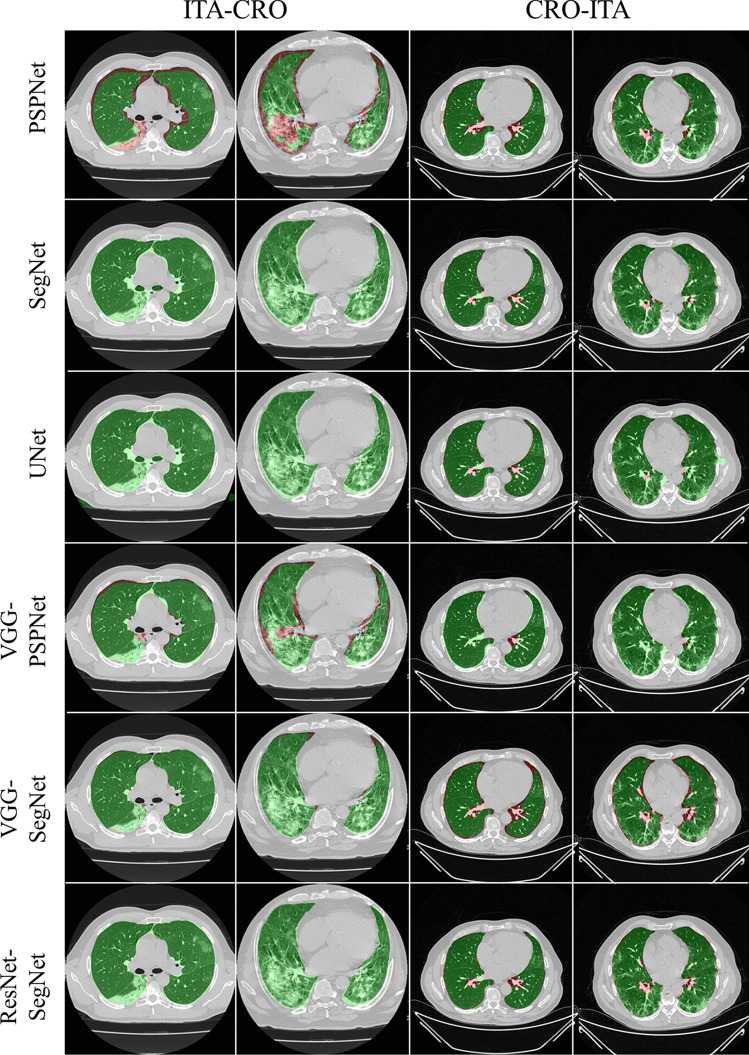
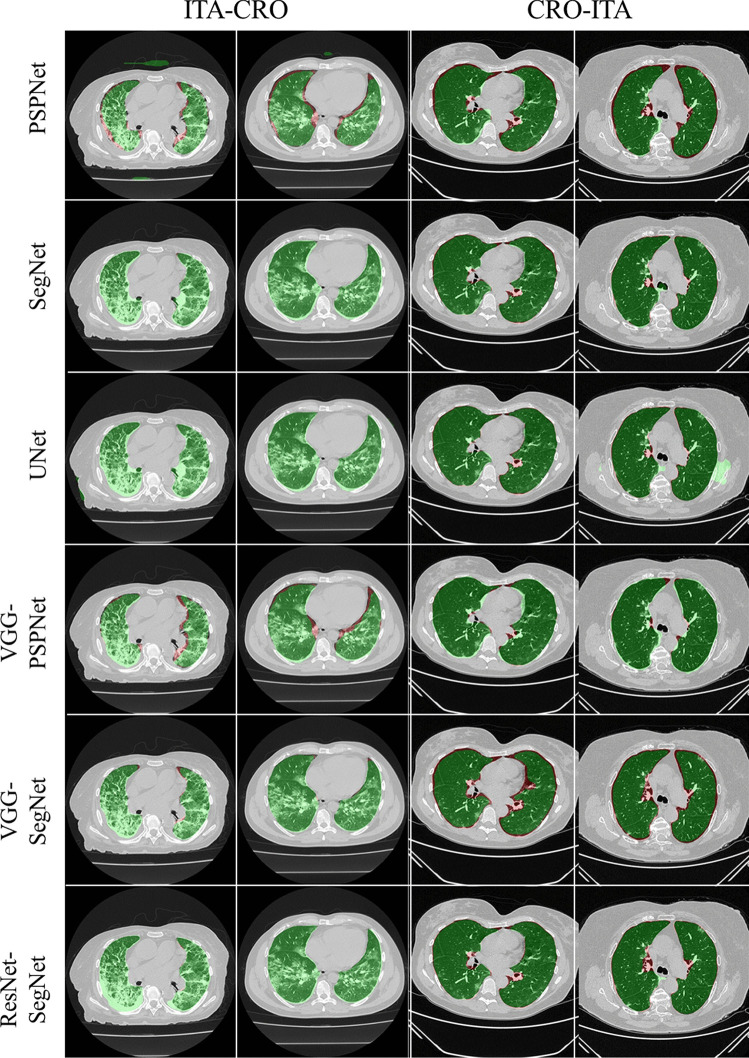
To prove our hypothesis that the performance of the HDL > SDL models in the proposed study, we present a comparison between (i) SDL and HDL models and (ii) the difference in training the models using high-GGO and low-GGO lung CT images. The accuracy and loss plots for the nine AI model for CRO and ITA dataset is presented in Figs. 8 and 9. Using overlays (Figs. 10, 11, 12 and 13), we present a visual representation of the results from the AI models by comparing against four different scenarios, namely, seen analysis using (i) train on Croatia data (CRO) and test on CRO, (ii) train on Italy data (ITA) and test on ITA. Similarly for Unseen analysis, (iii) train on CRO and test on ITA, and finally (iv) train on ITA and test on CRO. This study makes use of two different datasets (i) CRO with ~ 5000 CT images of COVID-19 patients who are considered as patients with high-GGO and (ii) ITA with ~ 5000 COVID-19 CT images regarded as low-GGO patients.
Fig. 10.
Visual overlays (set 1) showing the AI (green) output against the GT (red) for Seen analysis
Fig. 11.
Visual overlays (set 2) showing the AI (green) output against the GT (red) for Seen analysis
Fig. 12.
Visual overlays (set 1) showing the AI (green) output against the GT (red) for Unseen analysis
Fig. 13.
Visual overlays (set 2) showing the AI (green) output against the GT (red) for Unseen analysis
Performance Evaluation
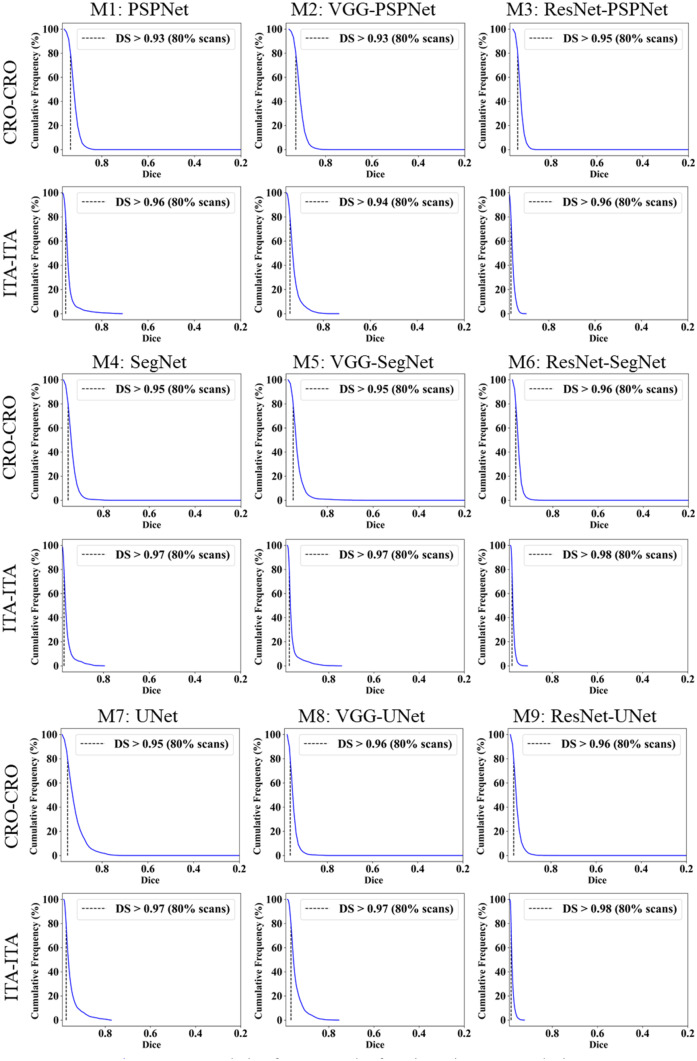
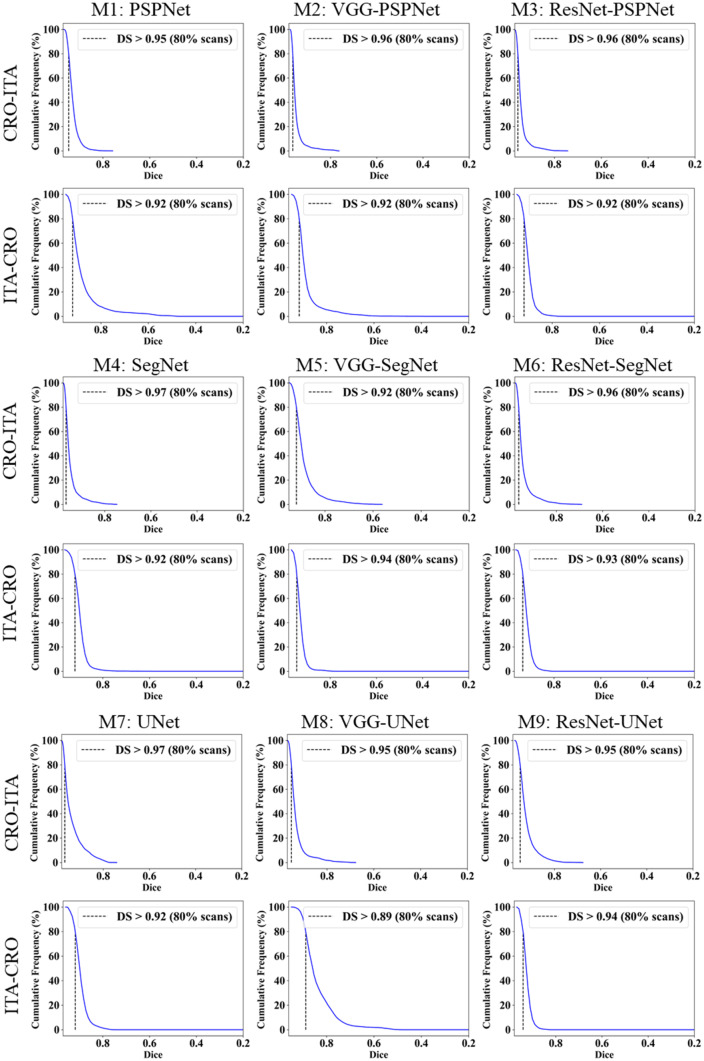
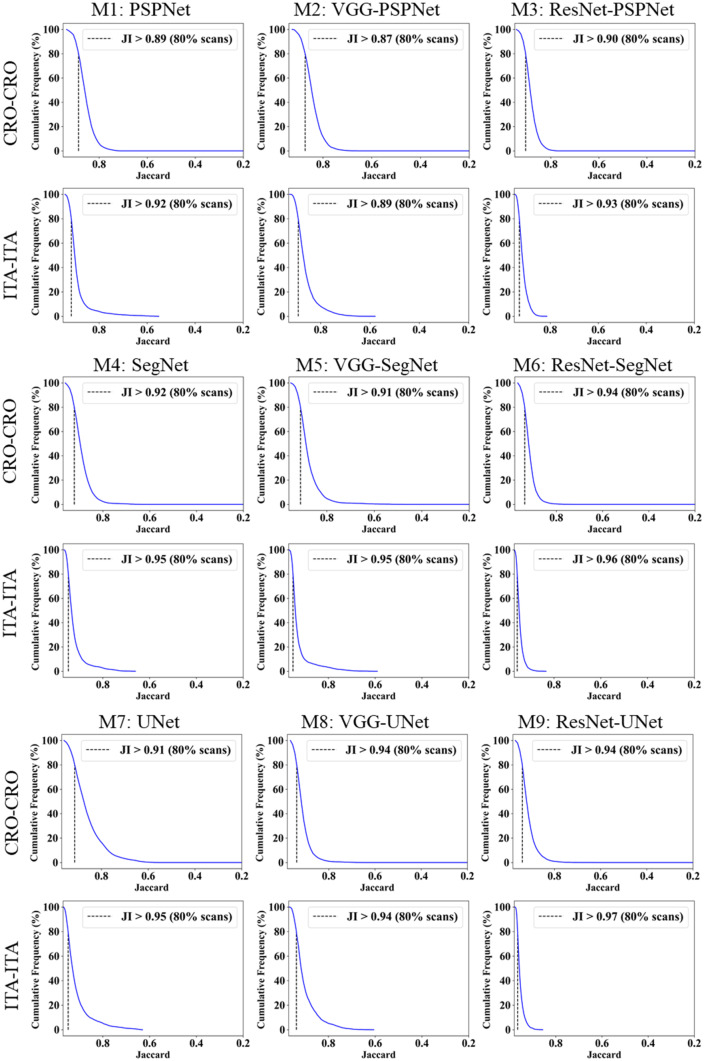
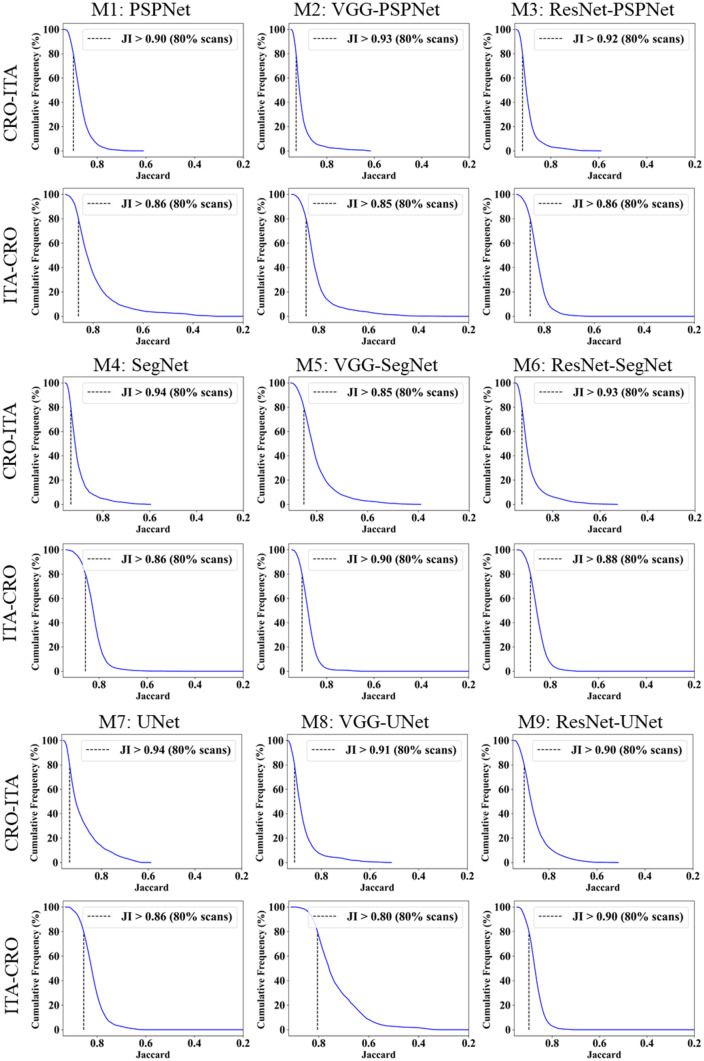
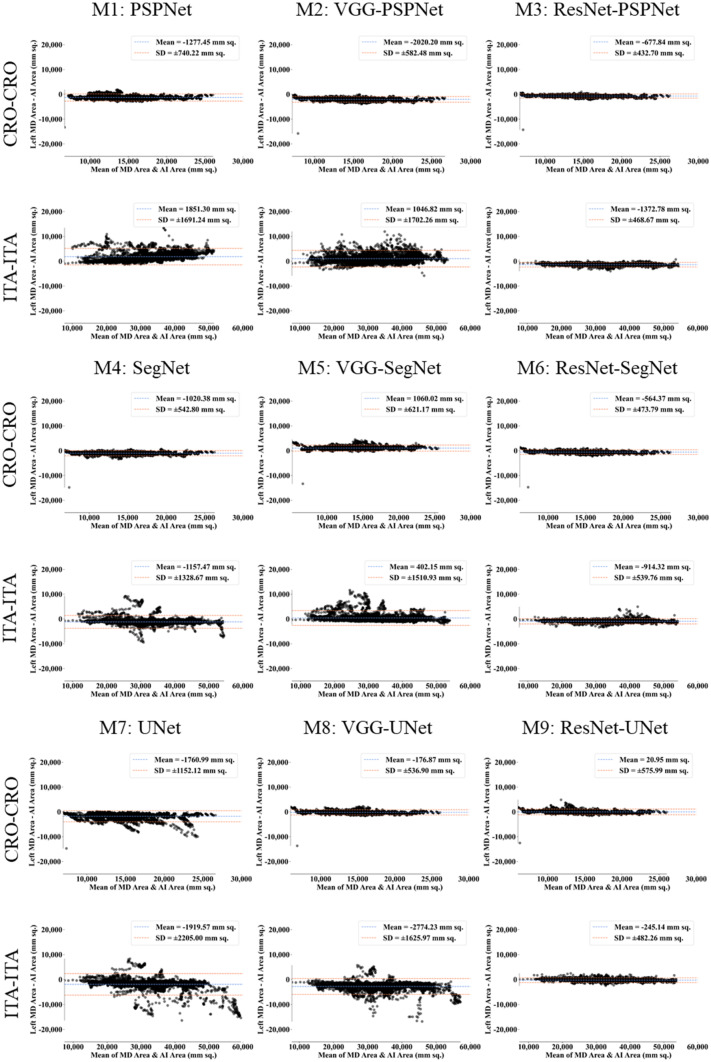
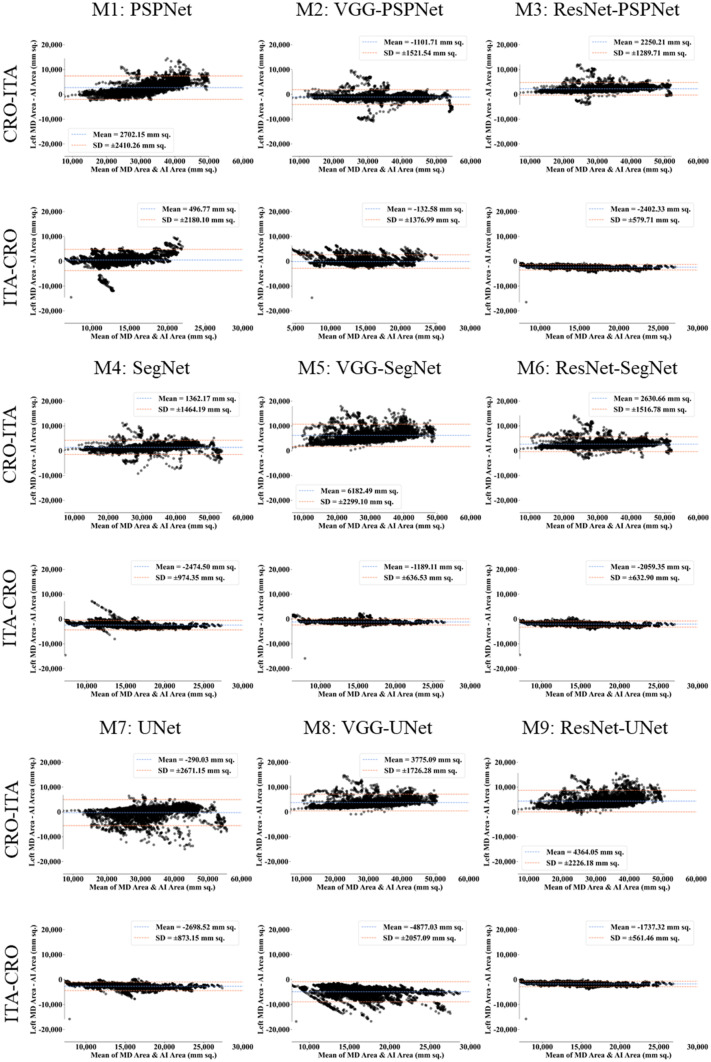
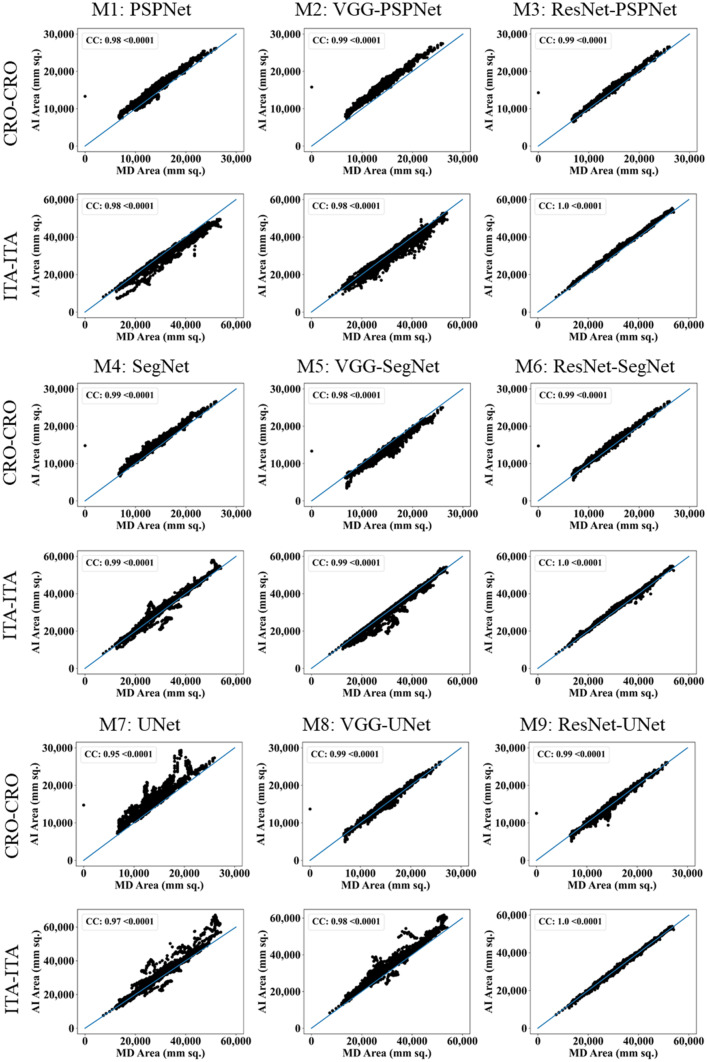
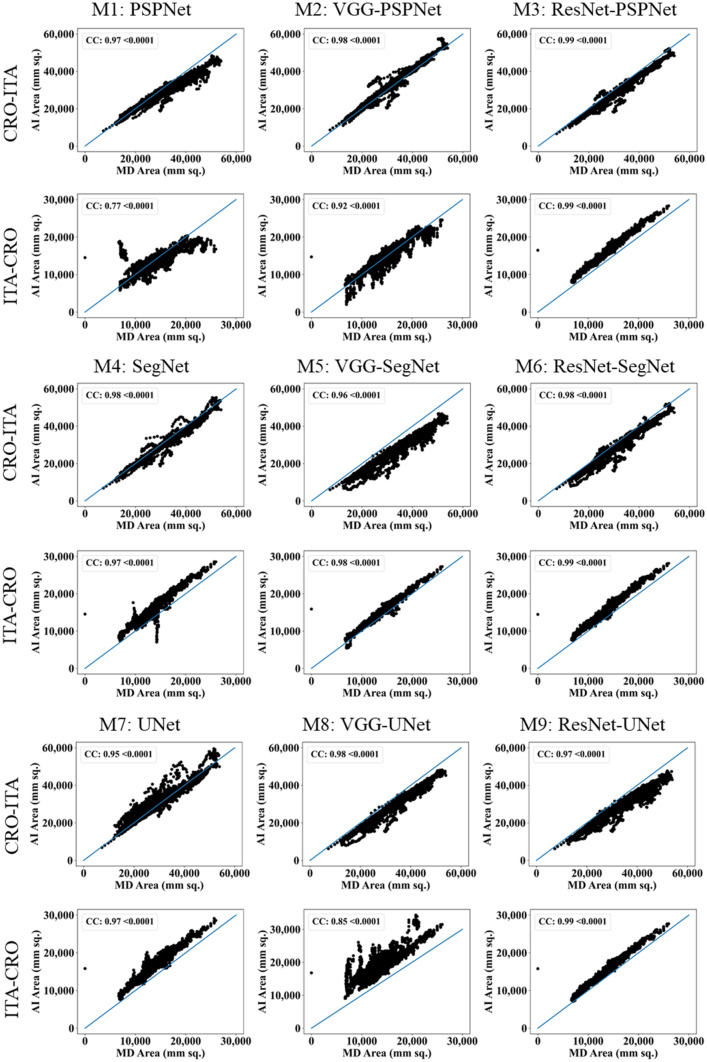
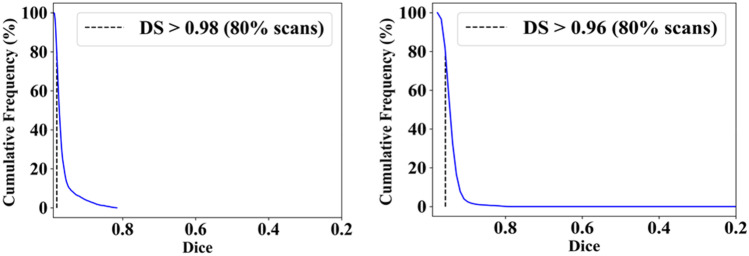
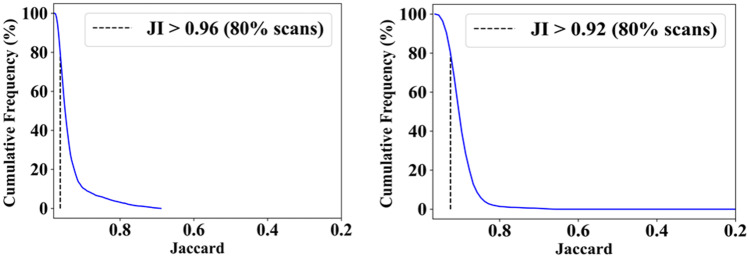
This study presents (i) DS, (ii) JI, (iii) BA, (iv) CC plots, and (v) Figure of Merit (FoM) as part of performance evaluation for nine AI models under Seen and Unseen settings. The cumulative frequency distribution (CFD) plot for DS and JI is presented in Figs. 14, 15, 16 and 17 at a threshold cutoff of 80%. Figures 16, 17, 18 and 19 show the BA plot with mean and standard deviation (SD) line for the estimated lung area against the AI models and ground truth tracings. Similarly, CC plots with a cutoff of 80% are displayed in Figs. 18, 19, 20 and 21. We present a summary, mean, SD, and percentage improvement for all six AI models for DS, JI, and CC values in Tables 1, 2 and 3. When comparing four scenarios for Seen and Unseen settings against SDL and HDL, the DS score is better by 1%, 3%, 1%, and 1%, the JI score is better by 3%, 5%, 3%, and 2%, and finally, for CC, the performance is better by 2%, 1%, 1%, and 6%, thus proving the hypothesis for COVID-19 lungs that performance of HDL > SDL. The standard deviation for all the AI models lies in the range of 0.01 to 0.06, which is considered stable because of the values being in the second decimal place.
Fig. 14.
Cumulative frequency plot for Dice using Seen analysis
Fig. 15.
Cumulative frequency plot for Dice using Unseen analysis
Fig. 16.
Cumulative frequency plot for Jaccard using Seen analysis
Fig. 17.
Cumulative frequency plot for Jaccard using Unseen analysis
Fig. 18.
BA plot for Seen analysis
Fig. 19.
BA plot for Unseen analysis
Fig. 20.
CC plot for Seen analysis
Fig. 21.
CC plot for Unseen analysis
Table 1.
Dice Similarity table for the nine AI models
| Dice Similarity: Solo Deep Learning | ||||
| Seen-AI | Unseen-AI | |||
| Model | CRO-CRO | ITA-ITA | CRO-ITA | ITA-CRO |
| PSPNet | 0.93 | 0.93 | 0.93 | 0.88 |
| SegNet | 0.95 | 0.96 | 0.89 | 0.91 |
| UNet | 0.93 | 0.95 | 0.92 | 0.9 |
| µ | 0.94 | 0.95 | 0.91 | 0.90 |
| σ | 0.01 | 0.02 | 0.02 | 0.02 |
| Dice Similarity: Hybrid Deep Learning | ||||
| Seen-AI | Unseen-AI | |||
| Model | CRO-CRO | ITA-ITA | CRO-ITA | ITA-CRO |
| VGG-PSPNet | 0.93 | 0.94 | 0.94 | 0.9 |
| VGG-SegNet | 0.94 | 0.96 | 0.95 | 0.92 |
| VGG-UNet | 0.96 | 0.95 | 0.93 | 0.84 |
| ResNet-PSPNet | 0.95 | 0.95 | 0.95 | 0.91 |
| ResNet-SegNet | 0.96 | 0.97 | 0.95 | 0.94 |
| ResNet-UNet | 0.96 | 0.97 | 0.94 | 0.93 |
| µ | 0.95 | 0.96 | 0.94 | 0.91 |
| σ | 0.01 | 0.01 | 0.01 | 0.04 |
| % Improvement | 1% | 1% | 3% | 1% |
Table 2.
Jaccard Index table for the nine AI models
| Jaccard Index: Solo Deep Learning | ||||
| Seen-AI | Unseen-AI | |||
| Model | CRO-CRO | ITA-ITA | CRO-ITA | ITA-CRO |
| PSPNet | 0.86 | 0.87 | 0.87 | 0.8 |
| SegNet | 0.9 | 0.93 | 0.8 | 0.83 |
| UNet | 0.87 | 0.92 | 0.87 | 0.83 |
| µ | 0.88 | 0.91 | 0.85 | 0.82 |
| σ | 0.02 | 0.03 | 0.04 | 0.02 |
| Jaccard Index: Hybrid Deep Learning | ||||
| Seen-AI | Unseen-AI | |||
| Model | CRO-CRO | ITA-ITA | CRO-ITA | ITA-CRO |
| VGG-PSPNet | 0.85 | 0.95 | 0.9 | 0.81 |
| VGG-SegNet | 0.89 | 0.93 | 0.85 | 0.86 |
| VGG-UNet | 0.92 | 0.9 | 0.88 | 0.74 |
| ResNet-PSPNet | 0.89 | 0.91 | 0.9 | 0.83 |
| ResNet-SegNet | 0.93 | 0.94 | 0.91 | 0.88 |
| ResNet-UNet | 0.93 | 0.95 | 0.89 | 0.88 |
| µ | 0.90 | 0.93 | 0.89 | 0.83 |
| σ | 0.03 | 0.02 | 0.02 | 0.05 |
| % Improvement | 3% | 3% | 5% | 2% |
Table 3.
Correlation Coefficient (P < 0.0001) for the nine AI models
| CC: Solo Deep Learning | ||||
| Seen-AI | Unseen-AI | |||
| Models | CRO-CRO | ITA-ITA | CRO-ITA | ITA-CRO |
| PSPNet | 0.98 | 0.98 | 0.97 | 0.77 |
| SegNet | 0.99 | 0.99 | 0.98 | 0.97 |
| UNet | 0.95 | 0.97 | 0.95 | 0.97 |
| µ | 0.97 | 0.98 | 0.97 | 0.90 |
| σ | 0.02 | 0.01 | 0.02 | 0.12 |
| CC: Hybrid Deep Learning | ||||
| Seen-AI | Unseen-AI | |||
| Models | CRO-CRO | ITA-ITA | CRO-ITA | ITA-CRO |
| VGG-PSPNet | 0.99 | 0.98 | 0.98 | 0.92 |
| VGG-SegNet | 0.98 | 0.99 | 0.96 | 0.98 |
| VGG-UNet | 0.99 | 0.98 | 0.98 | 0.85 |
| ResNet-PSPNet | 0.99 | 1 | 0.99 | 0.99 |
| ResNet-SegNet | 0.99 | 1 | 0.98 | 0.99 |
| ResNet-UNet | 0.99 | 1 | 0.97 | 0.99 |
| µ | 0.99 | 0.99 | 0.98 | 0.95 |
| σ | 0.00 | 0.01 | 0.01 | 0.06 |
| % Improvement | 2% | 1% | 1% | 6% |
Scientific Validation
The results from the MedSeg tool were compared against gold standard tracings of the two datasets used in the study. Figure 22 shows a cumulative frequency plot of DS for the segmented lungs using the MedSeg tool for Italian and Croatian datasets using COVLIAS. Similarly, Figs. 23 and 24 show the JI and CC plot of the results from the MedSeg compared to the ground truth tracings of the two datasets, with ITA on the left and CRO on the right. The percentage difference between the DS, JI, and CC score of the COVLIAS AI models in comparison to MedSeg is < 5%, thus proving the applicability of the proposed AI models in the clinical domain. Finally, the mean and standard deviation of the lung area error is presented in Fig. 25 using the BA plot and is used in the same notion with ITA on the left and CRO on the right. For the determination of the system’s error, Table 4 presents Figure of Merit for the nine AI models of Seen and Unseen analysis. Finally, to prove the reliability of the AI-based segmentation system COVLIAS, statistical test such as Mann–Whitney, Paired t-Test, and Wilcoxon test is presented for Seen (Table 5) and Unseen (Table 6) analysis. MedCalc software (Osteen, Belgium) was used to carry out all the tests.
Fig. 22.
Cumulative frequency plot of DS for MedSeg for ITA (left) and CRO (right) data sets
Fig. 23.
Cumulative frequency plot of JI for MedSeg for ITA data (left) and CRO data (right)
Fig. 24.
CC plot for MedSeg vs. GT for ITA (left) and CRO (right)
Fig. 25.
BA plot for MedSeg vs. GT for ITA (left) and CRO (right)
Table 4.
The Figure of Merit for the nine AI models for Seen-AI vs. Unseen-AI
| Seen-AI | Unseen-AI | |||
|---|---|---|---|---|
| Models | CRO-CRO | ITA-ITA | CRO-ITA | ITA-CRO |
| PSPNet | 90.93 | 94.41 | 91.84 | 96.47 |
| SegNet | 92.76 | 96.51 | 95.89 | 82.25 |
| UNet | 87.51 | 94.21 | 99.12 | 80.85 |
| VGG-PSPNet | 85.67 | 96.84 | 96.68 | 99.06 |
| VGG-SegNet | 92.48 | 98.79 | 81.33 | 91.56 |
| VGG-UNet | 98.74 | 91.63 | 88.60 | 72.49 |
| ResNet-PSPNet | 95.19 | 95.86 | 93.21 | 82.96 |
| ResNet-SegNet | 95.99 | 97.24 | 92.06 | 85.38 |
| ResNet-UNet | 99.85 | 99.26 | 86.83 | 94.77 |
Table 5.
Statistical tests for Seen-AI analysis on nine AI models
| CRO-CRO | ITA-ITA | |||||
|---|---|---|---|---|---|---|
| Models | Paired t-Test | Mann–Whitney | Wilcoxon | Paired t-Test | Mann–Whitney | Wilcoxon |
| PSPNet | P < 0.0001 | P < 0.0001 | P < 0.0001 | P < 0.0001 | P < 0.0001 | P < 0.0001 |
| SegNet | P < 0.0001 | P < 0.0001 | P < 0.0001 | P < 0.0001 | P < 0.0001 | P < 0.0001 |
| UNet | P < 0.0001 | P < 0.0001 | P < 0.0001 | P < 0.0001 | P < 0.0001 | P < 0.0001 |
| VGG-PSPNet | P < 0.0001 | P < 0.0001 | P < 0.0001 | P < 0.0001 | P < 0.0001 | P < 0.0001 |
| VGG-SegNet | P < 0.0001 | P < 0.0001 | P < 0.0001 | P < 0.0001 | P < 0.0001 | P < 0.0001 |
| VGG-UNet | P < 0.0001 | P < 0.0001 | P < 0.0001 | P < 0.0001 | P < 0.0001 | P < 0.0001 |
| ResNet-PSPNet | P < 0.0001 | P < 0.0001 | P < 0.0001 | P < 0.0001 | P < 0.0001 | P < 0.0001 |
| ResNet-SegNet | P < 0.0001 | P < 0.0001 | P < 0.0001 | P < 0.0001 | P < 0.0001 | P < 0.0001 |
| ResNet-UNet | P < 0.0001 | P < 0.0001 | P < 0.0001 | P < 0.0001 | P < 0.0001 | P < 0.0001 |
Table 6.
Statistical tests for Unseen-AI analysis on nine AI models
| CRO-ITA | ITA-CRO | |||||
|---|---|---|---|---|---|---|
| Models | Paired t-Test | Mann–Whitney | Wilcoxon | Paired t-Test | Mann–Whitney | Wilcoxon |
| PSPNet | P < 0.0001 | P < 0.0001 | P < 0.0001 | P < 0.0001 | P < 0.0001 | P < 0.0001 |
| SegNet | P < 0.0001 | P < 0.0001 | P < 0.0001 | P < 0.0001 | P < 0.0001 | P < 0.0001 |
| UNet | P < 0.0001 | P < 0.0001 | P < 0.0001 | P < 0.0001 | P < 0.0001 | P < 0.0001 |
| VGG-PSPNet | P < 0.0001 | P < 0.0001 | P < 0.0001 | P < 0.0001 | P < 0.0001 | P < 0.0001 |
| VGG-SegNet | P < 0.0001 | P < 0.0001 | P < 0.0001 | P < 0.0001 | P < 0.0001 | P < 0.0001 |
| VGG-UNet | P < 0.0001 | P < 0.0001 | P < 0.0001 | P < 0.0001 | P < 0.0001 | P < 0.0001 |
| ResNet-PSPNet | P < 0.0001 | P < 0.0001 | P < 0.0001 | P < 0.0001 | P < 0.0001 | P < 0.0001 |
| ResNet-SegNet | P < 0.0001 | P < 0.0001 | P < 0.0001 | P < 0.0001 | P < 0.0001 | P < 0.0001 |
| ResNet-UNet | P < 0.0001 | P < 0.0001 | P < 0.0001 | P < 0.0001 | P < 0.0001 | P < 0.0001 |
Discussion
This proposed study presented nine automated CT lung segmentation techniques in AI framework using three SDL, namely, (i) PSPNet, (ii) SegNet, (iii) UNet and six HDL models, namely, (iv) VGG-PSPNet, (v) VGG-SegNet, (vi) VGG-UNet, (vii) ResNet-PSPNet, (viii) ResNet-SegNet, (ix) ResNet-UNet. To prove our hypothesis, we use automated HU adjustment to optimize values of (1600, -400) and train our AI models to predict on test data (Fig. 26). After HU adjustment for DS, JI, and CC, the percentage improvement for Seen AI is 1%, 3%, and 6%, and for the Unseen AI is ~ 4%, ~ 5%, and 6%, respectively. We concluded that Unseen AI is possible using automated HU adjustment. Further, HDL was found to be superior to SDL (Table 1, 2 and 3).
Fig. 26.
Overlay of segmentation results from the ResNet-SegNet model trained without adjusting the HU level (red) and after adjusting the HU level (green). The white arrow represents the under-estimated region and the red arrows represent the same region estimated accurately by the ResNet-SegNet model
Comparison and Contrast of the Nine AI Models
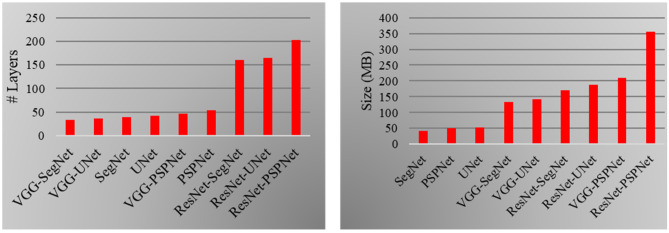
The proposed study uses a total of nine AI architectures with three SDL (PSPNet, SegNet and UNet) and six HDL models (VGG-PSPNet, VGG-SegNet, VGG-UNet, ResNet-PSPNet, ResNet-SegNet, and ResNet-UNet). ResNet-PSPNet was the AI model with the highest # of NN layers and model size, equally. The training for all the AI models was implemented on NVIDIA DGX V100 using python [97] and adapting multiple GPUs to speed up the training time (Table 7 and Fig. 27).
Table 7.
Nine AI architectures and their comparison
| 3 SDL Models | 6 HDL Models | |||||||||
|---|---|---|---|---|---|---|---|---|---|---|
| SN | Attributes | PSPNet | SegNet | UNet | VGG-PSPNet | VGG-SegNet | VGG-UNet | ResNet-PSPNet | ResNet-SegNet | ResNet-UNet |
| 1 | Backbone | NA | VGG-19 | VGG-19 | VGG-16 | VGG-16 | VGG-16 | Res-50 | Res-50 | Res-50 |
| 2 | Loss Function | CE | CE | CE | CE | CE | CE | CE | CE | CE |
| 3 | # Parameters | ~ 4.4 M | ~ 3.8 M | ~ 4.6 M | ~ 18.2 M | ~ 11.6 M | ~ 12.4 M | ~ 31 M | ~ 15 M | ~ 16.5 M |
| 4 | # NN Layers | 54 | 39 | 42 | 47 | 33 | 36 | 202 | 160 | 165 |
| 5 | Size (MB) | 50 | 43 | 52 | 209 | 133 | 142 | 355 | 171 | 188 |
| 6 | # Epoch | 50 | 50 | 50 | 50 | 50 | 50 | 50 | 50 | 50 |
| 7 | Batch Size | 8 | 8 | 8 | 2 | 4 | 4 | 2 | 4 | 4 |
| 8 | Training Time* | ~ 17 | ~ 15 | ~ 16 | ~ 60 | ~ 50 | ~ 50 | ~ 70 | ~ 60 | ~ 60 |
| 9 | Prediction Time | < 2 s | < 2 s | < 2 s | < 2 s | < 2 s | < 2 s | < 2 s | < 2 s | < 2 s |
MB MegaBytes, M Million, NN Neural Network
*in minutes
Fig. 27.
Left: Number of NN layers. Right: Size of the final AI models used in COVLIAS 1.0
Benchmarking
Table 8 shows the benchmarking table using CT imaging. Our proposed study (row #7) took 10,000 CT scans of 152 patients and implemented 9 different models that consisted of three SDL, namely, PSPNet, SegNet, UNet, and six HDL models, namely, VGG-PSPNet, VGG-SegNet, VGG-UNet, ResNet-PSPNet, ResNet-SegNet, ResNet-UNet. The four scenarios (CRO-CRO, ITA-ITA, CRO-ITA, and ITA-CRO) correspond to SDL and HDL.
Table 8.
Benchmarking table
| - | C1 | C2 | C3 | C4 | C5 | C6 | C7 | C8 | C9 | C10 | C11 | C12 | C13 |
|---|---|---|---|---|---|---|---|---|---|---|---|---|---|
| R# | Author | # Patients | # Images | Image Dim | #M | Model Types | Solo vs. HDL | Dim | AE | DS | JI | BA | ACC |
| R1 | Paluru et al. [80] | 69 | ~ 4339 | 5122 | 1 | AnamNet | Solo | 2D | ✖ | ✔ | ✖ | ✖ | ✔ |
| R2 | Saood and Hatem [85] | - | ~ 100 | 2562 | 2 | UNet, SegNet | Solo | 2D | ✖ | ✔ | ✖ | ✖ | ✔ |
| R3 | Cai et al. [86] | 99 | ~ 250 | - | 1 | UNet | Solo | 2D | ✖ | ✔ | ✔ | ✖ | ✖ |
| R4 | Suri et al. [40] | 72 | ~ 5000 | 7682 | 4 |
NIH, SegNet, VGG-SegNet, ResNet-SegNet |
Both | 2D | ✔ | ✔ | ✔ | ✔ | ✔ |
| R5 | Suri et al. [39] | 72 | ~ 5000 | 7682 | 3 |
PSPNet, VGG-SegNet, ResNet-SegNet |
Both | 2D | ✔ | ✔ | ✔ | ✔ | ✔ |
| R6 | Suri et al. [38] | 79 | ~ 5500 | 7682 | 2 |
VGG-SegNet, ResNet-SegNet |
HDL | 2D | ✔ | ✔ | ✔ | ✔ | ✔ |
| R7 | Suri et al. (Proposed) | 152 | > 10,000 | 5122 | 9 |
PSPNet, SegNet, UNet, VGG-PSPNet, VGG-SegNet, VGG-UNet, ResNet-PSPNet, ResNet-SegNet, ResNet-UNet |
Both | 2D | ✔ | ✔ | ✔ | ✔ | ✔ |
# number, HDL Hybrid Deep Learning, AE Area Error, DS Dice Similarity, JI Jaccard Index, BA Bland–Altman, ACC Accuracy, Dim Dimension (2D vs. 3D), R# Row number, #M number of AI models
A Special note on Tissue Characterization
Lung segmentation can be considered as a tissue characterization (TC) process and was tried before using ML such as in plaque TC [66, 98], lung TC [99], coronary artery disease characterization [100], liver TC [101], or in cancer application such as skin cancer [102], ovarian cancer [103]. Other types of advanced TC can be using hybrid models such as [24, 36, 51].
Strength, Weakness, and Extensions
This proposed study, COVLIAS 1.0-Unseen proves our two hypotheses, (i) contrast adjustment is vital for AI, and (ii) HDL is superior to SDL using nine models considering 5,000 CT scans. The system was validated against MedSeg and tested for reliability and stability.
It can also be noted that while training the AI model for COVID-19 infected lungs, it is necessary to adjust the HU levels to get the results of the segmentation accurately. Even though we used HU adjustments (i) it can be extended by adjusting the contrast, removing noise, and adjusting the window level [104]. (ii) Multimodality cross-validation such as ultrasound [105]. (iii) More advanced image processing tools such as level sets [106], stochastic segmentation [107], and computer-aided diagnostic tools [108, 109] can be integrated with AI models for lung segmentation. (iv) Recently, there have been studies to compute the bias in AI and it would be interesting to evaluate the bias models using AP(ai)Bias (AtheroPoint, Roseville, CA, USA) and other competitive models [42]. (v) CVD assessment of patients during the CT imaging [110].
Conclusions
The proposed research compares three SDL models, namely, PSPNet, SegNet, UNet, and six HDL models, namely, VGG-PSPNet, VGG-SegNet, VGG-UNet, ResNet-PSPNet, ResNet-SegNet, and ResNet-UNet against MedSeg for CT lung segmentation. It also performed the benchmarking of three SDL and 6 HDL models against MedSeg. The multicentre CT data was collected from Italy (ITA) with low-GGO, and Croatia (CRO with high-GGO hospitals, each with ~ 5000 COVID-19 images. These CT images were annotated by two trained, blinded senior radiologists, thus creating an inter-variable multicentre dataset. To prove our hypothesis, we use an automated Hounsfield Units (HU) adjustment methodology to train the AI models, leading to four combinations of two Unseen sets: train-CRO:test-ITA, train-ITA:test-CRO, and two Seen sets: train-CRO:test-CRO, train-ITA:test-ITA. To keep the test set unique for each fold, we adapted a five-fold cross-validation technique. Five types of performance metrics, namely, (i) DS, (ii) JI, (iii) BA plots, (iv) CC plots, and (v) Figure-of-Merit. For DS and JI, HDL (Unseen AI) > SDL (Unseen AI) by 4% and 5%, respectively. For CC, HDL (Unseen AI) > SDL (Unseen AI) by 6%. The COVLIAS-MedSeg difference was < 5%, thus proving the hypothesis and making it fit in clinical settings. Statistical tests such as Paired t-Test, Mann–Whitney, and Wilcoxon were used to demonstrate the stability and reliability of the AI system.
Supplementary Information
Below is the link to the electronic supplementary material.
Acronym & Symbol Table
- ACC
Accuracy
- AI
Artificial Intelligence
- ARDS
Acute Respiratory Distress Syndrome
- BA
Bland-Altman
- CC
Correlation Coefficient
- CE
Cross-Entropy
- COVID
Coronavirus disease
- COVLIAS
COVID Lung Image Analysis System
- CRO
Croatian dataset
- CT
Computed Tomography
- DL
Deep Learning
- DS
Dice Similarity
- FoM
Figure of merit
- GGO
Glass Ground Opacities
- GT
Ground Truth
- HDL
Hybrid Deep Learning
- HU
Hounsfield Units
- ITA
Italian dataset
- JI
Jaccard Index
- NIH
National Institute of Health
- RT-PCR
Reverse Transcription-Polymerase Chain Reaction
- SDL
Solo Deep Learning
- VGG
Visual Geometric Group
- WHO
World Health Organization
- µ
Mean
- σ
Standard Deviation
Declarations
For Italian Dataset:
IRB for the retrospective analysis of CT lung in patients affected by COVID19 granted by the Hospital of Novara to Professor Alessandro Carriero, Co-author of the research you are designing in the artificial intelligence application in the detection and risk stratification of COVID patients.
Ethic Committee Name
Assessment of diagnostic performance of Computed Tomography in patients affected by SARS COVID 19 Infection.
Approval Code
131/20.
Approval
authorized by the Azienda Ospedaliero Universitaria Maggiore della Carità di Novara on June 25th, 2020.
Informed Consent
Consent was waived.
For Crotian Dataset:
IRB for the retrospective analysis of CT lung in patients affected by COVID19 granted by the Hospital of Novara to Professor Alessandro Carriero, Co-author of the research you are designing in the artificial intelligence application in the detection and risk stratification of COVID patients.
Ethic Committee Name
The use of artificial intelligence for multislice computer tomography (MSCT) images in patients with adult respiratory diseases syndrome and COVID-19 pneumonia.
Approval Code
01–2239-1–2020.
Approval
Authorized by the University Hospital for Infectious Diseases “Dr. Fran Mihaljevic”, Zegreb, Mirogojska 8. On November 9th, 2020. Approved to Klaudija Viskovic, MD, PhD.
Informed Consent
Consent was waived.
Conflict of Interest
There are no Conflict of Interest.
Footnotes
This article is part of the Topical Collection on Image & Signal Processing
Dr. Jasjit S. Suri, PhD., MBA, FIEEEp, FAIMBEq, FAIUMr, FSVMs, FAPVSt
pFellow, Institute of Electrical and Electronics Engineers
qFellow, American Institute of Medical and Biological Engineering
rFellow, American Institute of Ultrasound in Medicine
sFellow, Society of Vascular Medicine
tFellow, Asia Pacific Vascular Society
Publisher's Note
Springer Nature remains neutral with regard to jurisdictional claims in published maps and institutional affiliations.
References
- 1.WHO Coronavirus (COVID-19) Dashboard. Available online: https://covid19.who.int/ (accessed on 24 Jan 2022).
- 2.Cucinotta D, Vanelli M. WHO Declares COVID-19 a Pandemic. Acta Biomed. 2020;91:157–160. doi: 10.23750/abm.v91i1.9397. [DOI] [PMC free article] [PubMed] [Google Scholar]
- 3.Saba L, Gerosa C, Fanni D, Marongiu F, La Nasa G, Caocci G, Barcellona D, Balestrieri A, Coghe F, Orru G, et al. Molecular pathways triggered by COVID-19 in different organs: ACE2 receptor-expressing cells under attack? A review. Eur Rev Med Pharmacol Sci. 2020;24:12609–12622. doi: 10.26355/eurrev_202012_24058. [DOI] [PubMed] [Google Scholar]
- 4.Suri JS, Puvvula A, Biswas M, Majhail M, Saba L, Faa G, Singh IM, Oberleitner R, Turk M, Chadha PS, et al. COVID-19 pathways for brain and heart injury in comorbidity patients: A role of medical imaging and artificial intelligence-based COVID severity classification: A review. Comput Biol Med. 2020;124:103960. doi: 10.1016/j.compbiomed.2020.103960. [DOI] [PMC free article] [PubMed] [Google Scholar]
- 5.Cau R, Bassareo PP, Mannelli L, Suri JS, Saba L. Imaging in COVID-19-related myocardial injury. Int J Cardiovasc Imaging. 2021;37:1349–1360. doi: 10.1007/s10554-020-02089-9. [DOI] [PMC free article] [PubMed] [Google Scholar]
- 6.Viswanathan V, Puvvula A, Jamthikar AD, Saba L, Johri AM, Kotsis V, Khanna NN, Dhanjil SK, Majhail M, Misra DP. Bidirectional link between diabetes mellitus and coronavirus disease 2019 leading to cardiovascular disease: A narrative review. World journal of diabetes. 2021;12:215. doi: 10.4239/wjd.v12.i3.215. [DOI] [PMC free article] [PubMed] [Google Scholar]
- 7.Fanni D, Saba L, Demontis R, Gerosa C, Chighine A, Nioi M, Suri JS, Ravarino A, Cau F, Barcellona D, et al. Vaccine-induced severe thrombotic thrombocytopenia following COVID-19 vaccination: a report of an autoptic case and review of the literature. Eur Rev Med Pharmacol Sci. 2021;25:5063–5069. doi: 10.26355/eurrev_202108_26464. [DOI] [PubMed] [Google Scholar]
- 8.Gerosa C, Faa G, Fanni D, Manchia M, Suri J, Ravarino A, Barcellona D, Pichiri G, Coni P, Congiu T. Fetal programming of COVID-19: may the barker hypothesis explain the susceptibility of a subset of young adults to develop severe disease? European Review for Medical Pharmacological Sciences. 2021;25:5876–5884. doi: 10.26355/eurrev_202109_26810. [DOI] [PubMed] [Google Scholar]
- 9.Cau R, Pacielli A, Fatemeh H, Vaudano P, Arru C, Crivelli P, Stranieri G, Suri JS, Mannelli L, Conti M, et al. Complications in COVID-19 patients: Characteristics of pulmonary embolism. Clin Imaging. 2021;77:244–249. doi: 10.1016/j.clinimag.2021.05.016. [DOI] [PMC free article] [PubMed] [Google Scholar]
- 10.Kampfer NA, Naldi A, Bragazzi NL, Fassbender K, Lesmeister M, Lochner P. Reorganizing stroke and neurological intensive care during the COVID-19 pandemic in Germany. Acta Biomed. 2021;92:e2021266. doi: 10.23750/abm.v92i5.10418. [DOI] [PMC free article] [PubMed] [Google Scholar]
- 11.Congiu T, Demontis R, Cau F, Piras M, Fanni D, Gerosa C, Botta C, Scano A, Chighine A, Faedda E. Scanning electron microscopy of lung disease due to COVID-19-a case report and a review of the literature. European review for medical and pharmacological sciences. 2021;25:7997–8003. doi: 10.26355/eurrev_202112_27650. [DOI] [PubMed] [Google Scholar]
- 12.Faa G, Gerosa C, Fanni D, Barcellona D, Cerrone G, Orrù G, Scano A, Marongiu F, Suri J, Demontis R. Aortic vulnerability to COVID-19: is the microvasculature of vasa vasorum a key factor? A case report and a review of the literature. European review for medical and pharmacological sciences. 2021;25:6439–6442. doi: 10.26355/eurrev_202110_27018. [DOI] [PubMed] [Google Scholar]
- 13.Munjral S, Ahluwalia P, Jamthikar AD, Puvvula A, Saba L, Faa G, Singh IM, Chadha PS, Turk M, Johri AM. Nutrition, atherosclerosis, arterial imaging, cardiovascular risk stratification, and manifestations in COVID-19 framework: a narrative review. Frontiers in bioscience (Landmark edition) 2021;26:1312–1339. doi: 10.52586/5026. [DOI] [PubMed] [Google Scholar]
- 14.Congiu T, Fanni D, Piras M, Gerosa C, Cau F, Barcellona D, D'Aloja E, Demontis R, Chighine F, Nioi M. Ultrastructural findings of lung injury due to Vaccine-induced Immune Thrombotic Thrombo-cytopenia (VITT) following COVID-19 vaccination: a scanning electron microscopic study. European review for medical and pharmacological sciences. 2022;26:270–277. doi: 10.26355/eurrev_202201_27777. [DOI] [PubMed] [Google Scholar]
- 15.Fang Y, Zhang H, Xie J, Lin M, Ying L, Pang P, Ji W. Sensitivity of Chest CT for COVID-19: Comparison to RT-PCR. Radiology. 2020;296:E115–E117. doi: 10.1148/radiol.2020200432. [DOI] [PMC free article] [PubMed] [Google Scholar]
- 16.Dramé, M.; Teguo, M.T.; Proye, E.; Hequet, F.; Hentzien, M.; Kanagaratnam, L.; Godaert, L. Should RT‐PCR be considered a gold standard in the diagnosis of Covid‐19? Journal of medical virology2020. [DOI] [PMC free article] [PubMed]
- 17.Xiao, A.T.; Tong, Y.X.; Zhang, S. False‐negative of RT‐PCR and prolonged nucleic acid conversion in COVID‐19: rather than recurrence. Journal of medical virology2020. [DOI] [PMC free article] [PubMed]
- 18.Wu X, Hui H, Niu M, Li L, Wang L, He B, Yang X, Li L, Li H, Tian J. Deep learning-based multi-view fusion model for screening 2019 novel coronavirus pneumonia: A multicentre study. European Journal of Radiology. 2020;128:109041. doi: 10.1016/j.ejrad.2020.109041. [DOI] [PMC free article] [PubMed] [Google Scholar]
- 19.Pathak, Y.; Shukla, P.K.; Tiwari, A.; Stalin, S.; Singh, S. Deep transfer learning based classification model for COVID-19 disease. Irbm2020. [DOI] [PMC free article] [PubMed]
- 20.Saba, L.; Suri, J.S. Multi-Detector CT imaging: principles, head, neck, and vascular systems; CRC Press: Boca Raton, 2013; Volume 1.
- 21.Fu F, Lou J, Xi D, Bai Y, Ma G, Zhao B, Liu D, Bao G, Lei Z, Wang M. Chest computed tomography findings of coronavirus disease 2019 (COVID-19) pneumonia. European radiology. 2020;30:5489–5498. doi: 10.1007/s00330-020-06920-8. [DOI] [PMC free article] [PubMed] [Google Scholar]
- 22.Murgia A, Erta M, Suri JS, Gupta A, Wintermark M, Saba L. CT imaging features of carotid artery plaque vulnerability. Ann Transl Med. 2020;8:1261. doi: 10.21037/atm-2020-cass-13. [DOI] [PMC free article] [PubMed] [Google Scholar]
- 23.Saba L, di Martino M, Siotto P, Anzidei M, Argiolas GM, Porcu M, Suri JS, Wintermark M. Radiation dose and image quality of computed tomography of the supra-aortic arteries: A comparison between single-source and dual-source CT Scanners. Journal of Neuroradiology. 2018;45:136–141. doi: 10.1016/j.neurad.2017.09.007. [DOI] [PubMed] [Google Scholar]
- 24.Saba L, Sanagala SS, Gupta SK, Koppula VK, Johri AM, Khanna NN, Mavrogeni S, Laird JR, Pareek G, Miner M, et al. Multimodality carotid plaque tissue characterization and classification in the artificial intelligence paradigm: a narrative review for stroke application. Ann Transl Med. 2021;9:1206. doi: 10.21037/atm-20-7676. [DOI] [PMC free article] [PubMed] [Google Scholar]
- 25.Bayraktaroglu S, Cinkooglu A, Ceylan N, Savas R. The novel coronavirus pneumonia (COVID-19): a pictorial review of chest CT features. Diagn Interv Radiol. 2021;27:188–194. doi: 10.5152/dir.2020.20304. [DOI] [PMC free article] [PubMed] [Google Scholar]
- 26.Verschakelen, J.A.; De Wever, W. Computed tomography of the lung; Springer: 2007.
- 27.Wu J, Pan J, Teng D, Xu X, Feng J, Chen YC. Interpretation of CT signs of 2019 novel coronavirus (COVID-19) pneumonia. Eur Radiol. 2020;30:5455–5462. doi: 10.1007/s00330-020-06915-5. [DOI] [PMC free article] [PubMed] [Google Scholar]
- 28.De Wever W, Meersschaert J, Coolen J, Verbeken E, Verschakelen JA. The crazy-paving pattern: a radiological-pathological correlation. Insights Imaging. 2011;2:117–132. doi: 10.1007/s13244-010-0060-5. [DOI] [PMC free article] [PubMed] [Google Scholar]
- 29.Niu R, Ye S, Li Y, Ma H, Xie X, Hu S, Huang X, Ou Y, Chen J. Chest CT features associated with the clinical characteristics of patients with COVID-19 pneumonia. Ann Med. 2021;53:169–180. doi: 10.1080/07853890.2020.1851044. [DOI] [PMC free article] [PubMed] [Google Scholar]
- 30.Salehi S, Abedi A, Balakrishnan S, Gholamrezanezhad A. Coronavirus Disease 2019 (COVID-19): A Systematic Review of Imaging Findings in 919 Patients. AJR Am J Roentgenol. 2020;215:87–93. doi: 10.2214/AJR.20.23034. [DOI] [PubMed] [Google Scholar]
- 31.Xie X, Zhong Z, Zhao W, Zheng C, Wang F, Liu J. Chest CT for Typical Coronavirus Disease 2019 (COVID-19) Pneumonia: Relationship to Negative RT-PCR Testing. Radiology. 2020;296:E41–E45. doi: 10.1148/radiol.2020200343. [DOI] [PMC free article] [PubMed] [Google Scholar]
- 32.Gozes, O.; Frid-Adar, M.; Greenspan, H.; Browning, P.D.; Zhang, H.; Ji, W.; Bernheim, A.; Siegel, E. Rapid ai development cycle for the coronavirus (covid-19) pandemic: Initial results for automated detection & patient monitoring using deep learning ct image analysis. arXiv preprint arXiv:.050372020.
- 33.Shalbaf A, Vafaeezadeh M. Automated detection of COVID-19 using ensemble of transfer learning with deep convolutional neural network based on CT scans. International journal of computer assisted radiology surgery. 2021;16:115–123. doi: 10.1007/s11548-020-02286-w. [DOI] [PMC free article] [PubMed] [Google Scholar]
- 34.Yang, X.; He, X.; Zhao, J.; Zhang, Y.; Zhang, S.; Xie, P. COVID-CT-dataset: a CT scan dataset about COVID-19. arXiv preprint arXiv:.138652020.
- 35.Cau, R.; Falaschi, Z.; Pasche, A.; Danna, P.; Arioli, R.; Arru, C.D.; Zagaria, D.; Tricca, S.; Suri, J.S.; Karla, M.K.; et al. Computed tomography findings of COVID-19 pneumonia in Intensive Care Unit-patients. J Public Health Res2021, 10, 10.4081/jphr.2021.2270. [DOI] [PMC free article] [PubMed]
- 36.Saba L, Agarwal M, Patrick A, Puvvula A, Gupta SK, Carriero A, Laird JR, Kitas GD, Johri AM, Balestrieri A, et al. Six artificial intelligence paradigms for tissue characterisation and classification of non-COVID-19 pneumonia against COVID-19 pneumonia in computed tomography lungs. Int J Comput Assist Radiol Surg. 2021;16:423–434. doi: 10.1007/s11548-021-02317-0. [DOI] [PMC free article] [PubMed] [Google Scholar]
- 37.Agarwal M, Saba L, Gupta SK, Carriero A, Falaschi Z, Paschè A, Danna P, El-Baz A, Naidu S, Suri JS. A novel block imaging technique using nine artificial intelligence models for COVID-19 disease classification, characterization and severity measurement in lung computed tomography scans on an Italian cohort. Journal of Medical Systems. 2021;45:1–30. doi: 10.1007/s10916-021-01707-w. [DOI] [PMC free article] [PubMed] [Google Scholar]
- 38.Suri, J.S.; Agarwal, S.; Carriero, A.; Pasche, A.; Danna, P.S.C.; Columbu, M.; Saba, L.; Viskovic, K.; Mehmedovic, A.; Agarwal, S.; et al. COVLIAS 1.0 vs. MedSeg: Artificial Intelligence-Based Comparative Study for Automated COVID-19 Computed Tomography Lung Segmentation in Italian and Croatian Cohorts. Diagnostics (Basel)2021, 11, 2367, 10.3390/diagnostics11122367. [DOI] [PMC free article] [PubMed]
- 39.Suri, J.S.; Agarwal, S.; Elavarthi, P.; Pathak, R.; Ketireddy, V.; Columbu, M.; Saba, L.; Gupta, S.K.; Faa, G.; Singh, I.M.; et al. Inter-Variability Study of COVLIAS 1.0: Hybrid Deep Learning Models for COVID-19 Lung Segmentation in Computed Tomography. Diagnostics (Basel)2021, 11, 2025, 10.3390/diagnostics11112025. [DOI] [PMC free article] [PubMed]
- 40.Suri, J.S.; Agarwal, S.; Pathak, R.; Ketireddy, V.; Columbu, M.; Saba, L.; Gupta, S.K.; Faa, G.; Singh, I.M.; Turk, M. COVLIAS 1.0: Lung Segmentation in COVID-19 Computed Tomography Scans Using Hybrid Deep Learning Artificial Intelligence Models. Diagnostics2021, 11, 1405. [DOI] [PMC free article] [PubMed]
- 41.Paul S, Maindarkar M, Saxena S, Saba L, Turk M, Kalra M, Krishnan PR, Suri JS. Bias Investigation in Artificial Intelligence Systems for Early Detection of Parkinson’s Disease: A Narrative Review. Diagnostics. 2022;12:166. doi: 10.3390/diagnostics12010166. [DOI] [PMC free article] [PubMed] [Google Scholar]
- 42.Suri JS, Agarwal S, Gupta S, Puvvula A, Viskovic K, Suri N, Alizad A, El-Baz A, Saba L, Fatemi M, et al. Systematic Review of Artificial Intelligence in Acute Respiratory Distress Syndrome for COVID-19 Lung Patients: A Biomedical Imaging Perspective. IEEE J Biomed Health Inform. 2021;25:4128–4139. doi: 10.1109/JBHI.2021.3103839. [DOI] [PMC free article] [PubMed] [Google Scholar]
- 43.Suri, J.S.; Bhagawati, M.; Paul, S.; Protogeron, A.; Sfikakis, P.P.; Kitas, G.D.; Khanna, N.N.; Ruzsa, Z.; Sharma, A.M.; Saxena, S. Understanding the bias in machine learning systems for cardiovascular disease risk assessment: The first of its kind review. Computers in Biology and Medicine2022, 105204. [DOI] [PubMed]
- 44.Jain PK, Sharma N, Saba L, Paraskevas KI, Kalra MK, Johri A, Laird JR, Nicolaides AN, Suri JS. Unseen Artificial Intelligence—Deep Learning Paradigm for Segmentation of Low Atherosclerotic Plaque in Carotid Ultrasound: A Multicenter Cardiovascular Study. Diagnostics. 2021;11:2257. doi: 10.3390/diagnostics11122257. [DOI] [PMC free article] [PubMed] [Google Scholar]
- 45.DenOtter, T.D.; Schubert, J. Hounsfield Unit. In StatPearls; StatPearls Publishing Copyright © 2022, StatPearls Publishing LLC.: Treasure Island (FL), 2022.
- 46.Nguyen HS, Soliman HM, Patel M, Li L, Kurpad S, Maiman D. CT Hounsfield units as a predictor for the worsening of traumatic vertebral compression fractures. World Neurosurgery. 2016;93:50–54. doi: 10.1016/j.wneu.2016.05.069. [DOI] [PubMed] [Google Scholar]
- 47.Davis AT, Palmer AL, Pani S, Nisbet A. Assessment of the variation in CT scanner performance (image quality and Hounsfield units) with scan parameters, for image optimisation in radiotherapy treatment planning. Physica Medica. 2018;45:59–64. doi: 10.1016/j.ejmp.2017.11.036. [DOI] [PubMed] [Google Scholar]
- 48.Jain PK, Sharma N, Giannopoulos AA, Saba L, Nicolaides A, Suri JS. Hybrid deep learning segmentation models for atherosclerotic plaque in internal carotid artery B-mode ultrasound. Comput Biol Med. 2021;136:104721. doi: 10.1016/j.compbiomed.2021.104721. [DOI] [PubMed] [Google Scholar]
- 49.Jena B, Saxena S, Nayak GK, Saba L, Sharma N, Suri JS. Artificial intelligence-based hybrid deep learning models for image classification: The first narrative review. Comput Biol Med. 2021;137:104803. doi: 10.1016/j.compbiomed.2021.104803. [DOI] [PubMed] [Google Scholar]
- 50.Jain PK, Sharma N, Saba L, Paraskevas KI, Kalra MK, Johri A, Nicolaides AN, Suri JS. Automated deep learning-based paradigm for high-risk plaque detection in B-mode common carotid ultrasound scans: an asymptomatic Japanese cohort study. Int Angiol. 2022;41:9–23. doi: 10.23736/S0392-9590.21.04771-4. [DOI] [PubMed] [Google Scholar]
- 51.Skandha SS, Nicolaides A, Gupta SK, Koppula VK, Saba L, Johri AM, Kalra MS, Suri JS. A hybrid deep learning paradigm for carotid plaque tissue characterization and its validation in multicenter cohorts using a supercomputer framework. Computers in biology and medicine. 2022;141:105131. doi: 10.1016/j.compbiomed.2021.105131. [DOI] [PubMed] [Google Scholar]
- 52.Gupta, N.; Gupta, S.K.; Pathak, R.K.; Jain, V.; Rashidi, P.; Suri, J.S. Human activity recognition in artificial intelligence framework: a narrative review. Artif Intell Rev2022, 1–54, 10.1007/s10462-021-10116-x. [DOI] [PMC free article] [PubMed]
- 53.Eelbode T, Bertels J, Berman M, Vandermeulen D, Maes F, Bisschops R, Blaschko MB. Optimization for medical image segmentation: Theory and practice when evaluating with dice score or jaccard index. IEEE Transactions on Medical Imaging. 2020;39:3679–3690. doi: 10.1109/TMI.2020.3002417. [DOI] [PubMed] [Google Scholar]
- 54.Giavarina D. Understanding Bland Altman analysis. Biochem Med (Zagreb) 2015;25:141–151. doi: 10.11613/BM.2015.015. [DOI] [PMC free article] [PubMed] [Google Scholar]
- 55.Dewitte, K.; Fierens, C.; Stockl, D.; Thienpont, L.M. Application of the Bland-Altman plot for interpretation of method-comparison studies: a critical investigation of its practice. Clin Chem2002, 48, 799–801; author reply 801–792. [PubMed]
- 56.Asuero AG, Sayago A, Gonzalez A. The correlation coefficient: An overview. Critical reviews in analytical chemistry. 2006;36:41–59. doi: 10.1080/10408340500526766. [DOI] [Google Scholar]
- 57.Taylor R. Interpretation of the correlation coefficient: a basic review. Journal of diagnostic medical sonography. 1990;6:35–39. doi: 10.1177/875647939000600106. [DOI] [Google Scholar]
- 58.MedSeg. Available online: https://htmlsegmentation.s3.eu-north-1.amazonaws.com/index.html (accessed on February 10, 2022).
- 59.Biswas M, Kuppili V, Saba L, Edla DR, Suri HS, Cuadrado-Godia E, Laird JR, Marinhoe RT, Sanches JM, Nicolaides A, et al. State-of-the-art review on deep learning in medical imaging. Front Biosci (Landmark Ed) 2019;24:392–426. doi: 10.2741/4725. [DOI] [PubMed] [Google Scholar]
- 60.Saba L, Biswas M, Kuppili V, Cuadrado Godia E, Suri HS, Edla DR, Omerzu T, Laird JR, Khanna NN, Mavrogeni S, et al. The present and future of deep learning in radiology. Eur J Radiol. 2019;114:14–24. doi: 10.1016/j.ejrad.2019.02.038. [DOI] [PubMed] [Google Scholar]
- 61.Maniruzzaman M, Rahman MJ, Al-MehediHasan M, Suri HS, Abedin MM, El-Baz A, Suri JS. Accurate diabetes risk stratification using machine learning: role of missing value and outliers. Journal of Medical Systems. 2018;42:1–17. doi: 10.1007/s10916-018-0940-7. [DOI] [PMC free article] [PubMed] [Google Scholar]
- 62.Maniruzzaman M, Kumar N, Abedin MM, Islam MS, Suri HS, El-Baz AS, Suri JS. Comparative approaches for classification of diabetes mellitus data: Machine learning paradigm. Computer methods and programs in biomedicine. 2017;152:23–34. doi: 10.1016/j.cmpb.2017.09.004. [DOI] [PubMed] [Google Scholar]
- 63.Maniruzzaman, M.; Suri, H.S.; Kumar, N.; Abedin, M.M.; Rahman, M.J.; El-Baz, A.; Bhoot, M.; Teji, J.S.; Suri, J.S. Risk factors of neonatal mortality and child mortality in Bangladesh. Journal of global health2018, 8. [DOI] [PMC free article] [PubMed]
- 64.Maniruzzaman M, Jahanur Rahman M, Ahammed B, Abedin MM, Suri HS, Biswas M, El-Baz A, Bangeas P, Tsoulfas G, Suri JS. Statistical characterization and classification of colon microarray gene expression data using multiple machine learning paradigms. Comput Methods Programs Biomed. 2019;176:173–193. doi: 10.1016/j.cmpb.2019.04.008. [DOI] [PubMed] [Google Scholar]
- 65.Acharya RU, Faust O, Alvin AP, Sree SV, Molinari F, Saba L, Nicolaides A, Suri JS. Symptomatic vs. asymptomatic plaque classification in carotid ultrasound. J Med Syst. 2012;36:1861–1871. doi: 10.1007/s10916-010-9645-2. [DOI] [PubMed] [Google Scholar]
- 66.Acharya UR, Faust O, Alvin AP, Krishnamurthi G, Seabra JC, Sanches J, Suri JS. Understanding symptomatology of atherosclerotic plaque by image-based tissue characterization. Comput Methods Programs Biomed. 2013;110:66–75. doi: 10.1016/j.cmpb.2012.09.008. [DOI] [PubMed] [Google Scholar]
- 67.Acharya, U.R.; Faust, O.; Sree, S.V.; Alvin, A.P.C.; Krishnamurthi, G.; Sanches, J.; Suri, J.S. Atheromatic™: Symptomatic vs. asymptomatic classification of carotid ultrasound plaque using a combination of HOS, DWT & texture. In Proceedings of the 2011 Annual International Conference of the IEEE Engineering in Medicine and Biology Society, 2011; pp. 4489–4492. [DOI] [PubMed]
- 68.Acharya UR, Mookiah MR, Vinitha Sree S, Afonso D, Sanches J, Shafique S, Nicolaides A, Pedro LM, Fernandes EFJ, Suri JS. Atherosclerotic plaque tissue characterization in 2D ultrasound longitudinal carotid scans for automated classification: a paradigm for stroke risk assessment. Med Biol Eng Comput. 2013;51:513–523. doi: 10.1007/s11517-012-1019-0. [DOI] [PubMed] [Google Scholar]
- 69.Molinari, F.; Liboni, W.; Pavanelli, E.; Giustetto, P.; Badalamenti, S.; Suri, J.S. Accurate and automatic carotid plaque characterization in contrast enhanced 2-D ultrasound images. In Proceedings of the 2007 29th Annual International Conference of the IEEE Engineering in Medicine and Biology Society, 2007; pp. 335–338. [DOI] [PubMed]
- 70.Acharya U, Vinitha Sree S, Mookiah M, Yantri R, Molinari F, Zieleźnik W, Małyszek-Tumidajewicz J, Stępień B, Bardales R, Witkowska A. Diagnosis of Hashimoto’s thyroiditis in ultrasound using tissue characterization and pixel classification. Proceedings of the Institution of Mechanical Engineers, Part H: Journal of Engineering in medicine. 2013;227:788–798. doi: 10.1177/0954411913483637. [DOI] [PubMed] [Google Scholar]
- 71.Biswas M, Kuppili V, Edla DR, Suri HS, Saba L, Marinhoe RT, Sanches JM, Suri JS. Symtosis: A liver ultrasound tissue characterization and risk stratification in optimized deep learning paradigm. Comput Methods Programs Biomed. 2018;155:165–177. doi: 10.1016/j.cmpb.2017.12.016. [DOI] [PubMed] [Google Scholar]
- 72.Banchhor SK, Londhe ND, Araki T, Saba L, Radeva P, Laird JR, Suri JS. Wall-based measurement features provides an improved IVUS coronary artery risk assessment when fused with plaque texture-based features during machine learning paradigm. Computers in biology and medicine. 2017;91:198–212. doi: 10.1016/j.compbiomed.2017.10.019. [DOI] [PubMed] [Google Scholar]
- 73.Acharya, U.R.; Saba, L.; Molinari, F.; Guerriero, S.; Suri, J.S. Ovarian tumor characterization and classification: a class of GyneScan™ systems. In Proceedings of the 2012 Annual International Conference of the IEEE Engineering in Medicine and Biology Society, 2012; pp. 4446–4449. [DOI] [PubMed]
- 74.Pareek G, Acharya UR, Sree SV, Swapna G, Yantri R, Martis RJ, Saba L, Krishnamurthi G, Mallarini G, El-Baz A. Prostate tissue characterization/classification in 144 patient population using wavelet and higher order spectra features from transrectal ultrasound images. Technology in cancer research treatment. 2013;12:545–557. doi: 10.7785/tcrt.2012.500346. [DOI] [PubMed] [Google Scholar]
- 75.Shrivastava VK, Londhe ND, Sonawane RS, Suri JS. Exploring the color feature power for psoriasis risk stratification and classification: A data mining paradigm. Comput Biol Med. 2015;65:54–68. doi: 10.1016/j.compbiomed.2015.07.021. [DOI] [PubMed] [Google Scholar]
- 76.Shrivastava VK, Londhe ND, Sonawane RS, Suri JS. A novel and robust Bayesian approach for segmentation of psoriasis lesions and its risk stratification. Comput Methods Programs Biomed. 2017;150:9–22. doi: 10.1016/j.cmpb.2017.07.011. [DOI] [PubMed] [Google Scholar]
- 77.Agarwal M, Saba L, Gupta SK, Johri AM, Khanna NN, Mavrogeni S, Laird JR, Pareek G, Miner M, Sfikakis PP. Wilson disease tissue classification and characterization using seven artificial intelligence models embedded with 3D optimization paradigm on a weak training brain magnetic resonance imaging datasets: a supercomputer application. Medical Biological Engineering Computing. 2021;59:511–533. doi: 10.1007/s11517-021-02322-0. [DOI] [PubMed] [Google Scholar]
- 78.Acharya, U.R.; Kannathal, N.; Ng, E.; Min, L.C.; Suri, J.S. Computer-based classification of eye diseases. In Proceedings of the 2006 International Conference of the IEEE Engineering in Medicine and Biology Society, 2006; pp. 6121–6124. [DOI] [PubMed]
- 79.Chen X, Tang Y, Mo Y, Li S, Lin D, Yang Z, Yang Z, Sun H, Qiu J, Liao Y. A diagnostic model for coronavirus disease 2019 (COVID-19) based on radiological semantic and clinical features: a multi-center study. European radiology. 2020;30:4893–4902. doi: 10.1007/s00330-020-06829-2. [DOI] [PMC free article] [PubMed] [Google Scholar]
- 80.Paluru N, Dayal A, Jenssen HB, Sakinis T, Cenkeramaddi LR, Prakash J, Yalavarthy PK. Anam-Net: Anamorphic depth embedding-based lightweight CNN for segmentation of anomalies in COVID-19 chest CT images. IEEE Transactions on Neural Networks and Learning Systems. 2021;32:932–946. doi: 10.1109/TNNLS.2021.3054746. [DOI] [PMC free article] [PubMed] [Google Scholar]
- 81.COVID-19 Database. Available online: https://radiopaedia.org/articles/covid-19-4?lang=gb (accessed on 10 Feb 2022).
- 82.Paszke, A.; Chaurasia, A.; Kim, S.; Culurciello, E. Enet: A deep neural network architecture for real-time semantic segmentation. arXiv preprint arXiv:1606.021472016.
- 83.Zhou Z, Siddiquee MMR, Tajbakhsh N, Liang J. UNet++: Redesigning Skip Connections to Exploit Multiscale Features in Image Segmentation. IEEE Transactions on Medical Imaging. 2020;39:1856–1867. doi: 10.1109/TMI.2019.2959609. [DOI] [PMC free article] [PubMed] [Google Scholar]
- 84.Wang, Y.; Zhou, Q.; Liu, J.; Xiong, J.; Gao, G.; Wu, X.; Latecki, L.J. Lednet: A lightweight encoder-decoder network for real-time semantic segmentation. In Proceedings of the 2019 IEEE International Conference on Image Processing (ICIP), 2019; pp. 1860–1864.
- 85.Saood A, Hatem I. COVID-19 lung CT image segmentation using deep learning methods: U-Net versus SegNet. BMC Medical Imaging. 2021;21:1–10. doi: 10.1186/s12880-020-00529-5. [DOI] [PMC free article] [PubMed] [Google Scholar]
- 86.Cai W, Liu T, Xue X, Luo G, Wang X, Shen Y, Fang Q, Sheng J, Chen F, Liang T. CT Quantification and Machine-learning Models for Assessment of Disease Severity and Prognosis of COVID-19 Patients. Acad Radiol. 2020;27:1665–1678. doi: 10.1016/j.acra.2020.09.004. [DOI] [PMC free article] [PubMed] [Google Scholar]
- 87.Mansoor, A.; Bagci, U.; Foster, B.; Xu, Z.; Douglas, D.; Solomon, J.M.; Udupa, J.K.; Mollura, D.J. CIDI-lung-seg: A single-click annotation tool for automatic delineation of lungs from CT scans. In Proceedings of the 2014 36th Annual International Conference of the IEEE Engineering in Medicine and Biology Society, 2014; pp. 1087–1090. [DOI] [PMC free article] [PubMed]
- 88.Aggarwal, D.; Saini, V. Factors limiting the utility of bronchoalveolar lavage in the diagnosis of COVID-19. Eur Respir J2020, 56, 10.1183/13993003.03116-2020. [DOI] [PMC free article] [PubMed]
- 89.Suri, J.S. Imaging based symptomatic classification and cardiovascular stroke risk score estimation. 2011.
- 90.Ronneberger, O.; Fischer, P.; Brox, T. U-net: Convolutional networks for biomedical image segmentation. In Proceedings of the International Conference on Medical image computing and computer-assisted intervention, 2015; pp. 234–241.
- 91.Badrinarayanan V, Kendall A, Cipolla R. SegNet: A Deep Convolutional Encoder-Decoder Architecture for Image Segmentation. IEEE Trans Pattern Anal Mach Intell. 2017;39:2481–2495. doi: 10.1109/TPAMI.2016.2644615. [DOI] [PubMed] [Google Scholar]
- 92.Zhao, H.; Shi, J.; Qi, X.; Wang, X.; Jia, J. Pyramid scene parsing network. In Proceedings of the Proceedings of the IEEE conference on computer vision and pattern recognition, 2017; pp. 2881–2890.
- 93.He K, Zhang X, Ren S, Sun J (2016) Deep residual learning for image recognition. In Proceedings of the Proceedings of the IEEE conference on computer vision and pattern recognition, Las Vegas, NV, USA, 27-30 June 2016, pp. 770-778
- 94.Simonyan, K.; Zisserman, A. Very deep convolutional networks for large-scale image recognition. arXiv preprint arXiv:.2014.
- 95.Browne MW. Cross-validation methods. J Math Psychol. 2000;44:108–132. doi: 10.1006/jmps.1999.1279. [DOI] [PubMed] [Google Scholar]
- 96.Refaeilzadeh P, Tang L, Liu H. Cross-validation. Encyclopedia of database systems. 2009;5:532–538. doi: 10.1007/978-0-387-39940-9_565. [DOI] [Google Scholar]
- 97.vanRossum, G. Python reference manual. Department of Computer Science [CS]1995.
- 98.Acharya UR, Faust O, Sree SV, Molinari F, Saba L, Nicolaides A, Suri JS. An accurate and generalized approach to plaque characterization in 346 carotid ultrasound scans. IEEE transactions on instrumentation and measurement. 2011;61:1045–1053. doi: 10.1109/TIM.2011.2174897. [DOI] [Google Scholar]
- 99.Noor NM, Than JC, Rijal OM, Kassim RM, Yunus A, Zeki AA, Anzidei M, Saba L, Suri JS. Automatic lung segmentation using control feedback system: morphology and texture paradigm. Journal of medical systems. 2015;39:1–18. doi: 10.1007/s10916-015-0214-6. [DOI] [PubMed] [Google Scholar]
- 100.Araki T, Ikeda N, Shukla D, Jain PK, Londhe ND, Shrivastava VK, Banchhor SK, Saba L, Nicolaides A, Shafique S. PCA-based polling strategy in machine learning framework for coronary artery disease risk assessment in intravascular ultrasound: a link between carotid and coronary grayscale plaque morphology. Computer methods programs in biomedicine. 2016;128:137–158. doi: 10.1016/j.cmpb.2016.02.004. [DOI] [PubMed] [Google Scholar]
- 101.Kuppili V, Biswas M, Sreekumar A, Suri HS, Saba L, Edla DR, Marinhoe RT, Sanches JM, Suri JS. Extreme learning machine framework for risk stratification of fatty liver disease using ultrasound tissue characterization. Journal of Medical Systems. 2017;41:1–20. doi: 10.1007/s10916-017-0797-1. [DOI] [PubMed] [Google Scholar]
- 102.Shrivastava VK, Londhe ND, Sonawane RS, Suri JS. Reliable and accurate psoriasis disease classification in dermatology images using comprehensive feature space in machine learning paradigm. Expert Systems with Applications. 2015;42:6184–6195. doi: 10.1016/j.eswa.2015.03.014. [DOI] [Google Scholar]
- 103.Acharya UR, Mookiah MR, Vinitha Sree S, Yanti R, Martis RJ, Saba L, Molinari F, Guerriero S, Suri JS. Evolutionary algorithm-based classifier parameter tuning for automatic ovarian cancer tissue characterization and classification. Ultraschall Med. 2014;35:237–245. doi: 10.1055/s-0032-1330336. [DOI] [PubMed] [Google Scholar]
- 104.Sudeep P, Palanisamy P, Rajan J, Baradaran H, Saba L, Gupta A, Suri JS. Speckle reduction in medical ultrasound images using an unbiased non-local means method. Biomedical Signal Processing Control. 2016;28:1–8. doi: 10.1016/j.bspc.2016.03.001. [DOI] [Google Scholar]
- 105.Sanches, J.M.; Laine, A.F.; Suri, J.S. Ultrasound imaging; Springer: 2012.
- 106.Suri JS, Liu K, Singh S, Laxminarayan SN, Zeng X, Reden L. Shape recovery algorithms using level sets in 2-D/3-D medical imagery: a state-of-the-art review. IEEE Transactions on information technology in biomedicine. 2002;6:8–28. doi: 10.1109/4233.992158. [DOI] [PubMed] [Google Scholar]
- 107.El-Baz, A., Gimel’farb, G., & Suri, J.S. Stochastic Modeling for Medical Image Analysis (1st ed.); CRC Press: 2015.
- 108.El-Baz, A.S.; Acharya, R.; Mirmehdi, M.; Suri, J.S. Multi Modality State-of-the-Art Medical Image Segmentation and Registration Methodologies: Volume 2; Springer Science & Business Media: Boca Raton, 2011; Volume 2.
- 109.Suri, J.S.; Rangayyan, R.M. Recent advances in breast imaging, mammography, and computer-aided diagnosis of breast cancer. 2006.
- 110.Suri JS, Puvvula A, Majhail M, Biswas M, Jamthikar AD, Saba L, Faa G, Singh IM, Oberleitner R, Turk M. Integration of cardiovascular risk assessment with COVID-19 using artificial intelligence. Reviews in Cardiovascular Medicine. 2020;21:541–560. doi: 10.31083/j.rcm.2020.04.236. [DOI] [PubMed] [Google Scholar]
Associated Data
This section collects any data citations, data availability statements, or supplementary materials included in this article.


