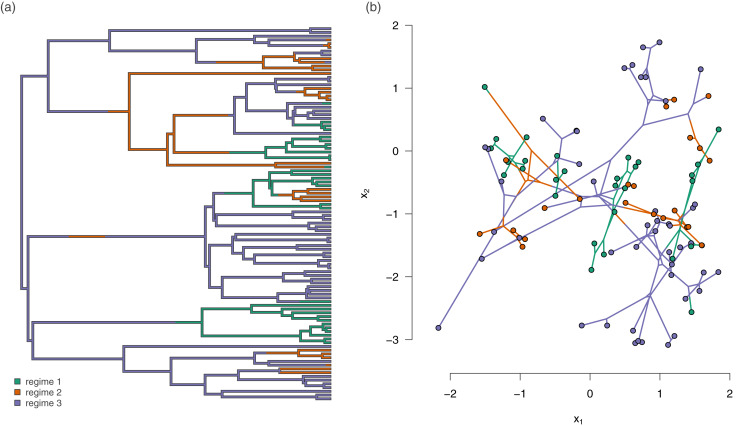
Figure 3. (A) Example simulated phylogenetic tree with three mapped evolutionary regimes; and (B) the phylogeny of (A) projected into a two dimensional phenotypic trait space.
The trait data in (B) were simulated under model 3b from Table 1 (different rates in trait 1, different correlations), in which the simulated evolutionary correlation between traits x1 and x2 was positive in regimes 1 and 3, but strongly negative in regime 2.

