Abstract
Bottom-up proteomics is a powerful method for the functional characterization of mouse gut microbiota. To date, most of the bottom-up proteomics studies of the mouse gut rely on limited amounts of fecal samples. With mass-limited samples, the performance of such analyses is highly dependent on the protein extraction protocols and contaminant removal strategies. Here, protein extraction protocols (using different lysis buffers) and contaminant removal strategies (using different types of filters and beads) were systematically evaluated to maximize quantitative reproducibility and the number of identified proteins. Overall, our results recommend a protein extraction method using a combination of sodium dodecyl sulfate (SDS) and urea in Tris–HCl to yield the greatest number of protein identifications. These conditions led to an increase in the number of proteins identified from gram-positive bacteria, such as Firmicutes and Actinobacteria, which is a challenging task. Our analysis further confirmed these conditions led to the extraction of non-abundant bacterial phyla such as Proteobacteria. In addition, we found that, when coupled to our optimized extraction method, suspension trap (S-Trap) outperforms other contaminant removal methods by providing the most reproducible method while producing the greatest number of protein identifications. Overall, our optimized sample preparation workflow is straightforward and fast, and requires minimal sample handling. Furthermore, our approach does not require high amounts of fecal samples, a vital consideration in proteomics studies where mice produce smaller amounts of feces due to a particular physiological condition. Our final method provides efficient digestion of mouse fecal material, is reproducible, and leads to high proteomic coverage for both host and microbiome proteins.
Keywords: Proteomics, Sample preparation, Protein extraction, Contaminant removal, Fecal sample
Introduction
Mass spectrometry (MS) is a technology that is widely used as an analytical tool for bioanalysis [1, 2]. The term bottom-up proteomics describes the characterization of proteins by analysis of peptides resulting from proteolysis. MS-based bottom-up proteomics is performed by combining liquid chromatography and tandem mass spectrometry (LC–MS/MS) [3]. MS-based bottom-up proteomics sample preparation workflows involve several steps, during which the proteins are converted into peptides, either by chemical or enzymatic digestion [4]. Key steps in this workflow include the extraction of proteins, enrichment or depletion of any particular proteins of (or not of) interest, cleanup of the protein mixtures (detergent removal), enzymatic digestion of proteins into peptides, and desalting of the final peptide mixture before the MS analysis [3]. The MS analysis is then performed on the peptide mixture [4, 5].
Recent studies have shown the potency of bottom-up proteomics as an emerging technique to study the gut microbiome [6, 7]. The normal gut microbiome is a collection of beneficial microorganisms inhabiting the gastrointestinal tract and referred to as “gut microbiota” [8]. Gut microbiota plays essential roles in the immune system’s functioning, maintaining the physiological environment, and providing critical nutrients [9, 10]. While bottom-up proteomics can directly measure the microbiome’s expressed proteins, currently, there is a lack of consistency in methods used for protein extraction from fecal samples, which may contain host-secreted and tissue proteins, microbial proteins, and undigested foods/fibers. In addition, protein extraction from the complex gut microbiome with inherent differences in microbial cell walls is challenging [11, 12]. Therefore, typical methods for cell lysis need to be adjusted for fecal proteomics studies [12]. This work aims to define optimal sample preparation conditions for the proteomic analysis of small amounts of mouse feces to maximize protein extraction and digestion efficiency without adversely interfering with downstream MS analysis.
The first key step after sample collection is employing chemical and physical methods to extract proteins. The incorporation of different classes of MS-compatible or incompatible reagents for improving protein extraction from complex mixtures has been investigated in multiple recent studies [11, 13, 14]. In general, these reagents are classified as chaotropic agents and surfactants that help protein unfolding and facilitate enzymatic digestion by exposing cleavage sites [13]. The most commonly used chaotropic agent is urea, which effectively disrupts hydrogen bonds, aiding protein unfolding and stabilizing unfolded proteins for better enzymatic cleavage [15]. Surfactants, with their amphipathic nature, allow for higher protein solubility. Surfactants such as sodium dodecyl sulfate (SDS) have been emphasized in many studies for their role in extracting hydrophobic membrane proteins [13, 16, 17]. Although SDS can readily solubilize proteins in biological matrices, it is not compatible with the LC–MS analysis. SDS suppresses the ionization of peptides due to its great abundance and higher ionizability compared to individual peptides [15, 18]. Therefore, SDS needs to be removed for downstream LC/MS analysis. While there are numerous techniques for detergent removal, filter-based methods have been among the most popular methods in recent years [19]. Filter-aided sample preparation (FASP) is one of the most popular filter-based methods. This method allows for the processing of proteins retained on a membrane with a specific molecular weight cutoff. Retained proteins are further digested into peptides [20]. Over the past decade, the FASP method has been used frequently in proteomics studies due to its robustness and gel-free nature [19]. In recent years, a new method called suspension trapping (S-Trap) has been developed to help SDS-based proteomic preparations [21]. S-Traps are made of quartz fibers used as filters to trap the protein suspension and wash away excess SDS [21]. In recent years, another alternative technology for protein cleanup has been a bead-based technology, originally called the single-pot, solid-phase, sample preparation (SP3) method [22, 23]. SP3 is based on paramagnetic beads such as AMPure beads (Beckman Coulter). It uses ethanol to capture proteins on the surface of hydrophilic beads coated with carboxylate groups. The beads are then washed to remove excess MS-incompatible reagents such as SDS and elute proteins or peptides following digestion [22].
While several recent studies investigated either the effect of different lysis buffers or surfactant removal strategies separately [13, 19], the current literature lacks a comprehensive investigation of proteomics sample preparation workflow for feces to study the gut environment’s natural proteome profile. There was, however, a recent study that investigated sample preparation conditions using different physical disruption methods for humanized germ-free mice gavaged with 11 bacterial strains isolated from the human gut [12]. Here, we compared the effect of the most commonly used lysis buffers, including SDS, urea, Tris–HCl, and combinations of these reagents, on protein extraction from mouse fecal samples. Simultaneously, we tried three different protein cleanup strategies, including FASP, S-Trap, and modified SP3, to evaluate their simplicity and reproducibility.
Materials and methods
Fecal sample collection
Ten 6- to 10-week-old female CBA/J mice were obtained from The Jackson Laboratory (Bar Harbor, ME) for this study. Mice were housed in conventional cages (5 per cage, two cages total) and fed a standard chow diet ad libitum (Teklad, 7912). Cages were kept in a temperature-controlled room under a 12-h light/dark cycle. Fecal pellets were collected daily for 15 days from each mouse on autoclaved aluminum foil. Fecal pellets were immediately transferred to pre-labeled Lo-Bind microcentrifuge tubes (Eppendorf), flash-frozen in liquid nitrogen, and stored at − 80 °C until further processing.
Proteomic sample preparation
Frozen fecal samples were thawed on ice, and a pooled sample consisting of feces from ten different CBA/J mice at different days was prepared in a new microcentrifuge tube. To study the effect of different lysis buffers or filtration methods on protein extraction, ~ 10 mg of the pooled sample was transferred to a new tube, each prepared for further steps of the bottom-up proteomics workflow. We used pooled sample masses ranging from 5 to 20 mg as the expected weight range for a single fecal pellet from CBA/J mice under healthy (~ 20 mg) and disease (~ 5 mg) conditions.
Protein extraction with different lysis buffers
SDS and urea-based lysis buffers were freshly made for use in this study. Four out of 6 tested lysis buffers contain SDS. One of the SDS-based buffers was prepared to contain 5% SDS (w/v) in H2O. Two other SDS-based lysis buffers were prepared to contain 5% SDS in 50 mM Tris–HCl buffer (pH 8.0) and 5% SDS in the presence of 2 M urea, respectively. Urea-based buffers consisted of one containing 2 M urea in H2O and one containing 2 M urea in 50 mM Tris–HCl buffer (pH 8.0). One additional lysis buffer contains 5% SDS and 2 M urea in 50 mM Tris–HCl buffer (pH 8.0). Pooled fecal samples were resuspended in 200 μL of each of these six different lysis buffers (three technical replicates were conducted for each lysis buffer). Samples were then vortexed for 2 min to facilitate pellet disruption and protein extraction. The resulting fecal slurry was then subjected to 20 cycles of ultrasonication (30 s each with 30-s intervals in between) using a Bioruptor® Pico (Diagenode). It should be noted that in a separate, ongoing project using mouse feces, we found that combining probe sonication and Bioruptor-based sonication is more efficient for mechanical disruption of cells; this procedure is now being used is ongoing studies of inflamed gut. In addition, we initially compared the effect of bead beating as a potential method for cell lysis; however, compared to ultrasonication, bead beating resulted in too much protein loss and, therefore, was discarded from our sample preparation workflow. The lysate was then centrifuged at 16,000 × g for 15 min, and the supernatant was used for further analysis. Proteins were reduced with 5 μL of 5 mg/mL dithiothreitol (DTT) at 65 °C for 15 min and alkylated using 15 mg/mL of iodoacetamide (IAA) in the dark for 30 min.
Trypsin digestion on suspension trapping preparation
Following protein reduction and alkylation as described above, 2.5 μL of 12% phosphoric acid was added to each sample to acidify them before transferring them onto the S-Trap filters. One hundred sixty-five microliters of freshly made S-Trap binding buffer (90% methanol; 100 mM triethylammonium bicarbonate (TEAB); pH 7.1) was added to the acidified lysate. After gentle mixing, the protein solution was loaded onto the S-Trap filter and spun at 4000 rpm for 3 min, and the flow-through was removed. Trapped proteins in the filter were then washed three times, each time with 200 μL of S-Trap binding buffer. Finally, trypsin digestion was performed by adding trypsin in 100 mM TEAB solution (final concentration 1 unit trypsin:100 units protein) and incubating overnight at 37 °C with gentle shaking. Peptides were then eluted by applying three solutions sequentially onto the S-Trap filters. Forty microliters of each solution, including 50 mM TEAB, 0.2% formic acid in H2O, and 50% acetonitrile + 0.2% formic acid in H2O, was added respectively and spun down at 4000 g for 3 min. The resulting peptides were then pooled and desalted with Agilent SPE cartridges (SPEC Pt C18 column), and tryptic enzymes were eluted with 60% acetonitrile (v/v)/0.1% formic acid (v/v). The final tryptic peptide samples were vacuum-dried, and, after evaporation, they were reconstituted in 0.1% formic acid (v/v) before the LC–MS/MS analysis.
Filter-aided sample preparation
To compare the effect of FASP with S-Trap, protein samples were lysed with 5% SDS + 2 M urea + 50 mM Tris–HCl and then combined with 8 M urea in 100 mM Tris–HCl (pH 8). Here we evaluated the performance of two commercially available FASP filter units from Microcon (Millipore), those with nominal cutoffs of 10 and 30 kDa, respectively. First, filters were activated by briefly spinning 60% methanol through the filter at 14,000 × g. Samples were then loaded onto the membrane, combined with 200 μL of 8 M urea and 50 mM ammonium bicarbonate in the filter unit, and spun at 14,000 × g for 15 min (or 45 min for 10-kDa filtration device). The membrane was then washed three times with 200 μL of 8 M urea to remove SDS by centrifuging 15 min at 13,000 × g (or 45 min for 10-kDa filtration device). The membrane was then washed twice with 200 μL of 50 mM ammonium bicarbonate (ABC) and spun for 15 min (or 45 min for 10-kDa filtration device) each time to remove urea. Protein digestion was achieved by adding trypsin in 50 mM ABC (1 unit trypsin:100 units protein) and incubating at 37 °C overnight. Peptides were recovered from the membrane in two washes with 50 μL of 50 mM ABC and spinning at 14,000 × g for 5 min each (15 min for 10-kDa filtration device). The resulting peptides were then pooled and desalted, as discussed in “Trypsin digestion on suspension trapping preparation.” The final tryptic peptide samples were vacuum-dried and reconstituted in 0.1% formic acid (v/v) before the LC–MS/MS analysis.
Single-pot, solid-phase, sample preparation
To compare the effect of the paramagnetic bead-based approach for detergent removal with S-Trap and FASP, some of the 5% SDS + 2 M urea + 50 mM Tris–HCl-containing samples were vortexed and sonicated as described in “Protein extraction with different lysis buffer.” Following the manufacturer’s procedure, the lysate was mixed with 180-μL AMPure paramagnetic beads (Beckman Coulter) (previously warmed up to room temperature). To induce binding of the proteins to the beads, a volume of 100% ethanol equal to the total volume of (sample + AMPure beads) was added to the mixture containing the SP3 beads. The binding mixture was then incubated at 24 °C for 5 min. After completing the binding, each sample tube was placed in a magnetic rack and incubated until the beads migrated to the tube wall. After 3–5 min, the unbound supernatant was discarded, and the tubes were removed from the magnetic rack. One hundred eighty microliters of 80% ethanol SP3 rinse solution was added to each tube to rinse the beads. By incubating the tubes on the magnetic rack, beads migrated to the tube wall, and the unwanted supernatants containing salt and detergents were removed. The bead washing step was repeated three times. To elute purified proteins, 50 μL of a mixture containing 90% methanol in 100 mM TEAB + 100 mM DTT was added to the beads and gently resuspended. Samples were boiled for 5 min, and the reaction tube was placed onto the Magnetic Separation Rack for 1 min. Eluted protein was then transferred into a clean tube. Following protein cleanup using beads, reduction, alkylation, and enzymatic digestion were performed off-bead by adding trypsin in 100 mM TEAB solution and incubating overnight at 37 °C. The resulting peptides were desalted, as discussed in “Trypsin digestion on suspension trapping preparation.” The final tryptic peptide samples were vacuum-dried and reconstituted in 0.1% formic acid (v/v) for the LC–MS/MS analysis.
Building database of genes from CBA/J mice and their microbiota
To build a database of representative protein sequences, data were acquired from multiple sources. Three fecal samples, collected as described above, were selected for metagenomic sequencing. DNA was extracted using Zymo’s Quick-DNA Fecal/Soil Microbe Kit (cat# D6012) following the manufacturer’s protocol for fecal samples. According to the manufacturer’s instructions, libraries were prepared using an Illumina Library creation kit (KAPA Biosystems) with solid-phase reversible immobilization size selection. The quantified libraries were then prepared for sequencing on the Illumina HiSeq 2500 sequencing platform utilizing a TruSeq Rapid paired-end cluster kit, v4. Fastq files were generated with CASSAVA 1.8.2. The raw reads were processed with bbduk.sh to remove adapters and low-quality bases with Phred scores less than 20 (https://jgi.doe.gov/data-and-tools/bbtools/bb-tools-user-guide/bbduk-guide/). Reads were then assembled with IDBA-UD [24] and MEGAHIT [25] using default parameters. The reads and assemblies have been deposited at NCBI (Bioproject PRJNA348350). All sequences less than 2.5 kb in length were removed, and then protein coding sequences were predicted using Prodigal [26]. To build a more complete set of mouse microbiome proteins, we also retrieved the predicted proteins from iMGMC [27]. To represent the mouse proteome, the UniProt mouse proteome was used (UP000000589). The predicted proteins from the CBA/J metagenomes, iMGMC, and the UniProt mouse proteome were then dereplicated (100% identity and 100% length coverage) using MMseqs2 [28] to form the final protein database.
Mass spectrometry and data analysis
Samples were analyzed using a nanoElute LC coupled to a timsTOF Pro equipped with a CaptiveSpray source (Bruker Scientific, Billerica, MA). Peptides were separated on a 25 cm × 75-μm analytical column, packed with 1.6 μm C18 beads (IonOpticks, Australia). The column temperature was maintained at 50 °C using an integrated column oven (Sonation GmbH, Germany). Solvent A consisted of 0.1% formic acid in water, while solvent B consisted of 0.1% formic acid in acetonitrile. Peptide separation was achieved at 0.4 mL/min using a linear gradient from 2 to 25% solvent B over 90 min, 25 to 37% over 10 min, and 37 to 80% over 10 min, and maintained for 10 min for a total separation method time of 120 min. Data acquisition on the timsTOF Pro utilized the Parallel Accumulation Serial Fragmentation (PASEF) acquisition mode. Instrument settings included default imeX mode, mass range 100 to 1700 m/z, a capillary voltage of 1.6 kV, dry gas 3 L/min, and dry temp of 180 °C. PASEF settings included 10 MS/MS scans at 1.18-s total cycle time, scheduling target intensity of 20,000, active exclusion release after 0.4 min, and CID collision energy 42 eV. Protein identifications were obtained via the Thermo Proteome Discoverer software (v 1.4) using the Sequest search algorithm and the database described in “Building database of genes from CBA/J mice and their microbiota.” Search parameters were set as follows: enzyme, trypsin; maximum missed cleavage sites, 2; peptide length range, 7–50 amino acids; precursor mass tolerance, 10 ppm; fragment mass tolerance, 0.6 Da; cysteine carbamidomethylation was set as a fixed modification, while oxidation of methionine and deamidation of asparagine and glutamine were all set as variable modifications. False discovery rate (FDR) control was performed using a percolator at a threshold of 1% for peptide spectral match (PSM), peptide, and protein identifications. Protein groups were filtered to include peptides with 99% confidence and a minimum of two peptides per protein group. Proteome Discoverer outputs were further processed for statistical analysis using Python scripts (v 3.7), RforProteomics package in R (v3.5.3). The mass spectrometry proteomics data have been deposited to the ProteomeXchange [29] Consortium via the PRIDE [30] partner repository with the dataset identifier PXD027788.
Results and discussion
Comparing protein extraction methods using different lysis buffers
This study compared six different lysis buffers (see Fig. 1) during bottom-up proteomic sample preparation for mouse fecal samples. As noted in “Proteomic sample preparation,” we started the protein extraction by weighing out ~ 10 mg of pooled feces and transferring to a new tube. To study the effect of the six chosen lysis buffers, for each 10 mg of feces, 200 μL of lysis buffer was added. In addition, after protein extraction and before enzymatic digestion, a NanoDrop protein measurement was performed at A280 to measure the protein concentration. Then, trypsin digestion was performed with the amount of trypsin based on the protein content of each sample (1 unit trypsin:100 units protein). To demonstrate each lysis buffer’s impact on protein extraction from feces, we chose to use the numbers of identified proteins as metrics for comparison because the amounts of starting materials were identical. As indicated in Fig. 1a, the number of unique proteins was analyzed using six different lysis buffers in experimental triplicate with S-Trap used as cleanup method. We found that a combination of 5% SDS + 2 M urea + 50 mM Tris–HCl outperformed other conditions yielding the greatest numbers of unique proteins (mean = 2924). We also compared the effect of all six lysis buffers with SP3 used as the filtration method (Fig. 1b). Our analysis with SP3 demonstrated that 5% SDS + 2 M urea + 50 mM Tris–HCl outperformed other lysis buffers and resulted in the greatest numbers of protein identifications (mean = 1732). Overall, based on our results with two filter types, the combination of 5% SDS + 2 M urea + 50 mM Tris–HCl is the best among the tested lysis buffers. Furthermore, with all tested lysis buffers, we identified more proteins when S-Trap used as the cleanup method compared to SP3 (Fig. 1; see peptide comparison in Electronic Supplementary Material Fig. S1).
Fig. 1.
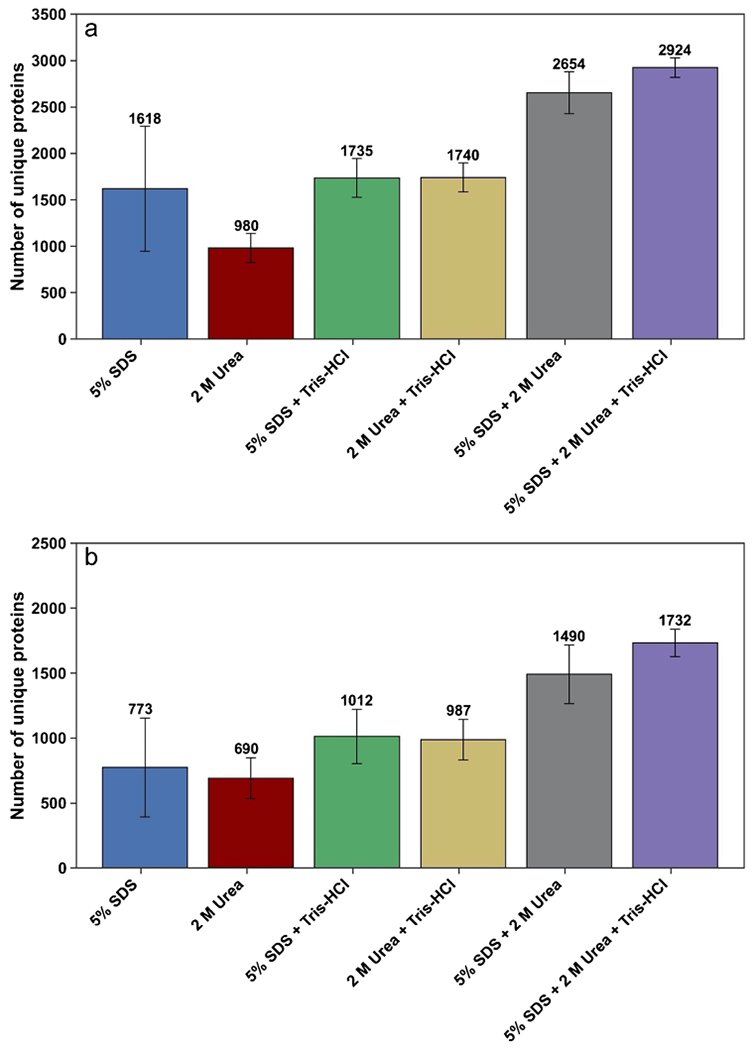
Comparison of six lysis buffers. a Mean number of unique proteins identified based on two or more unique peptides, with S-Trap used as the filtration method. b Mean number of unique proteins identified based on two or more unique peptides, with SP3 used as the filtration method. Error bars represent standard deviation (n = 3). (Peptide identified in each case is shown in Electronic Supplementary Material Fig. S1)
Previous studies reported that the addition of urea to the SDS-based lysis buffer provides an additional solubilizing agent for proteins [11]. The improved performance of the mixture of 5% SDS, 2 M urea, and 50 mM Tris–HCl can be explained by the synergistic effect of different lysis mechanisms in a mixture of these reagents. (Note that while the present results provide a systematic comparison of the different conditions used, a much higher number of total proteins per sample condition can be obtained by combining probe sonication and Bioruptor-based sonication, a disruption procedure that is now being used in our ongoing investigations that involve comparison of results for control and inflamed intestine. In addition, more peptides and proteins would be identified with an open search algorithm, which will be used in our continuing work on samples from healthy vs diseased mice.
Each experiment was performed in triplicate to evaluate the reproducibility of the preparation methods that used different lysis buffers. The overlap in protein identifications between replicates is presented in the Venn diagrams in Fig. 2. To generate each Venn diagram, the list of identified proteins in three replicates of each lysis buffer (with S-Trap used as the filtration method) was compared. The red number in the middle of each Venn diagram is calculated based on the number of the common proteins across three replicates over the total number of identified proteins. The greatest degree of overlap (75%) was observed across three replicates of 5% SDS + 2 M urea + Tris–HCl. In contrast, 5% SDS resulted in the greatest variability in protein identifications between three replicates. In addition, Pearson correlation coefficients (r) of the number of PSM were calculated to quantitatively assess the reproducibility of each lysis buffer across its replicates (Fig. 2 heatmaps). To generate the heatmaps, we used the PSM comparison of proteins detected in all replicates and their corresponding Pearson correlation coefficient (r). The PSM values were normalized based on the length of each protein (number of amino acids) using the normalized spectral abundance factor (NSAF) method [31]. It was determined that 5% SDS + 2 M urea + Tris–HCl demonstrated the strongest linear correlations (r = 0.9123–0.9663) between replicates.
Fig. 2.
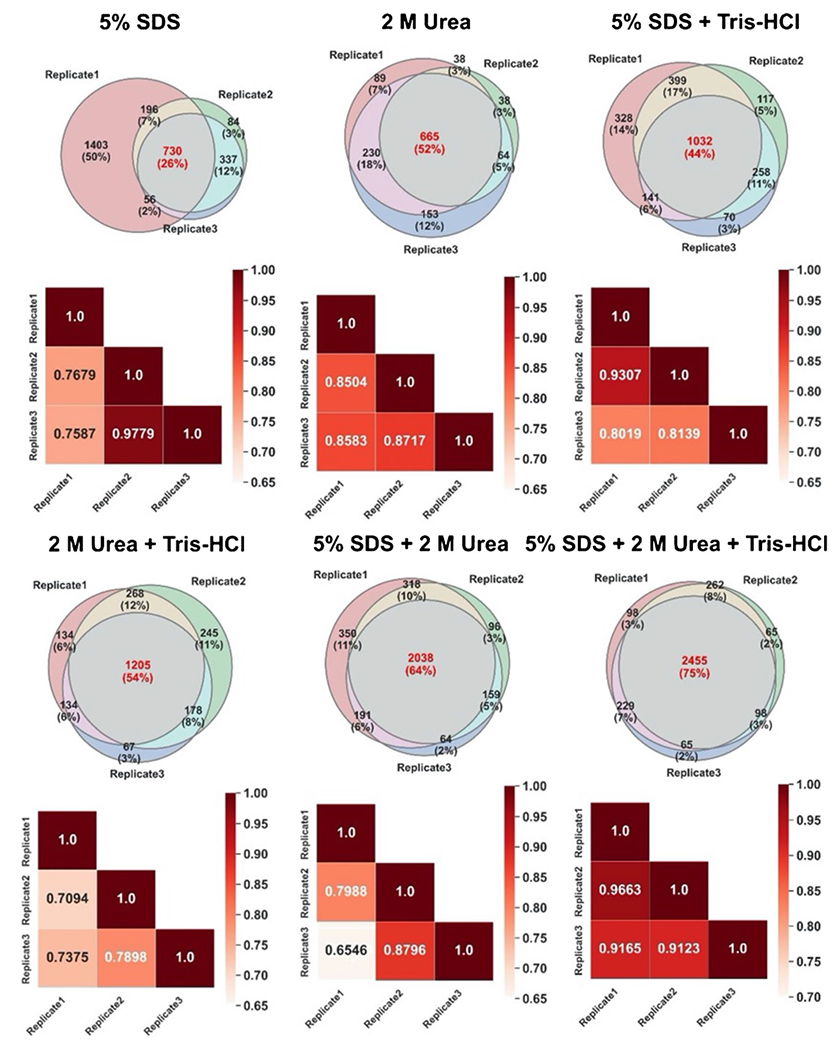
Experimental reproducibility on the protein level. Venn diagrams display the overlap in protein identifications across three experimental replicates of each of 6 lysis buffers. The heatmaps display the PSM comparison of proteins detected in all replicates and their corresponding Pearson correlation coefficient (r)
Overall, samples lysed using 5% SDS + 2 M urea + Tris–HCl represented the strongest protein-level correlations between replicates, with the greatest number of identified proteins and peptides, which further supports the use of a mixture of different chaotropic agents and surfactants for more efficient protein extraction from complex samples. No previous studies had reported fecal proteomics analysis when CBA/J mice were used to the best of our knowledge. However, comparison of our data obtained from CBA/J mice with previous analyses of mouse fecal proteomes using C57BL mice or Swiss-Webster mice showed that our approach using 5% SDS + 2 M urea + Tris–HCl resulted in better coverage of the mouse fecal proteome with 2924 protein identifications compared to 612 proteins reported by Lichtman et al. [32] and 336 proteins identified by Ang et al. [33]. On the other hand, Wu et al. identified more than 4000 proteins from fecal pellet analysis of humanized germ-free mice gavaged with 11 bacterial strains isolated from the human gut; however, they loaded five times more peptide mass onto the LC/MS than our approach [12]. Overall, the differences in the numbers of identified proteins from mouse fecal proteome analysis could be due to several factors such as the type, age, and sex of the mice, and differences in the amount of feces mass, the amount of injected peptides, and the data searching parameters. We also performed taxonomic analysis based on identified peptides using Unipept web application tools to investigate whether the taxonomic compositions observed from proteomics results were affected by the lysis buffers used for protein extraction [34, 35]. As indicated in Fig. 3, Firmicutes and Bacteroidetes were the dominant gut bacterial phyla, which agrees with most metaproteomics, amplicon sequencing, and metagenomics studies of healthy mouse feces [34, 36, 37], including a previous study of CBA/J mice using 16S amplicon sequencing (Fig. 3b) [38]. However, different lysis buffers caused different relative abundances of these two phyla. Our results indicated that the combination of different reagents (as in 5% SDS + 2 M urea + Tris–HCl) led to relatively higher proportions of Firmicutes and Actinobacteria. Using 5% SDS + 2 M urea + Tris–HCl also led to the extraction and identification of non-abundant bacterial phyla such as Proteobacteria and Actinobacteria. Previous studies reported that protein extraction from Gram-positive bacteria, such as Firmicutes and Actinobacteria, is a more challenging task that requires stronger chemical lysis or physical disruption methods [11]. Our analysis further confirms that the addition of different reagents benefits protein extractions from the larger microbial community, and it is more important for the extraction of proteins from Gram-positive bacteria. While a recent study showed that extraction with bead beating improved the protein extraction from Gram-positive bacteria [12], bead beating in our analysis using a smaller amount of feces caused more protein loss than ultrasonication.
Fig. 3.
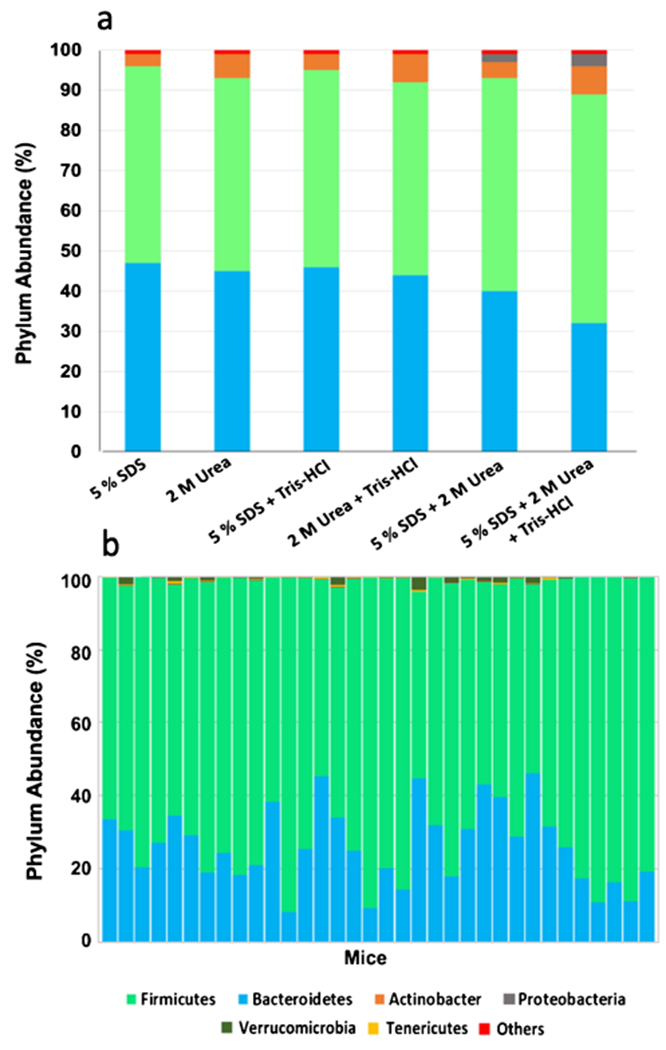
Measured taxonomic composition of CBA/J mouse fecal samples a based on metaproteomics analysis using different lysis buffers for protein extraction (see Electronic Supplementary Material, Table S1), and b based on 16S rRNA sequencing in Borton et al. [38]
Comparing different filters for protein cleanup
As mentioned above, four out of six tested lysis buffers contained SDS in their mixture. SDS is generally among the most frequently used detergents in bottom-up proteomics as it allows for the extraction of both hydrophilic and hydrophobic proteins [39, 40]. However, it is critical to remove SDS before MS analysis [41]. Therefore, here, we compared the performance of different filters for SDS removal. Because our results for two different filter types (S-Trap and SP3) show that 5% SDS + 2 M urea + Tris–HCl outperforms other studied lysis buffers, we used this lysis buffer for comparison of S-Trap, SP3, and two filter-aided sample preparation (FASP) units with different molecular weight cutoffs. The FASP method has been adopted widely in the bottom-up proteomics community since 2009, while S-Trap filtering was introduced a few years ago [42]. The four filtration units were analyzed and compared based on their proteomics coverage, speed, and reproducibility. We started our evaluation by comparing the number of identified proteins and peptides after loading the same amount (150 μg) of lysed protein on each filter. As indicated in Fig. 4, the S-Trap approach yielded the greatest number of protein (mean = 2924) and peptide (mean = 11,496) identifications. In contrast, the fewest protein (mean = 1232) and peptide (mean = 4208) identifications resulted from FASP 10 k.
Fig. 4.
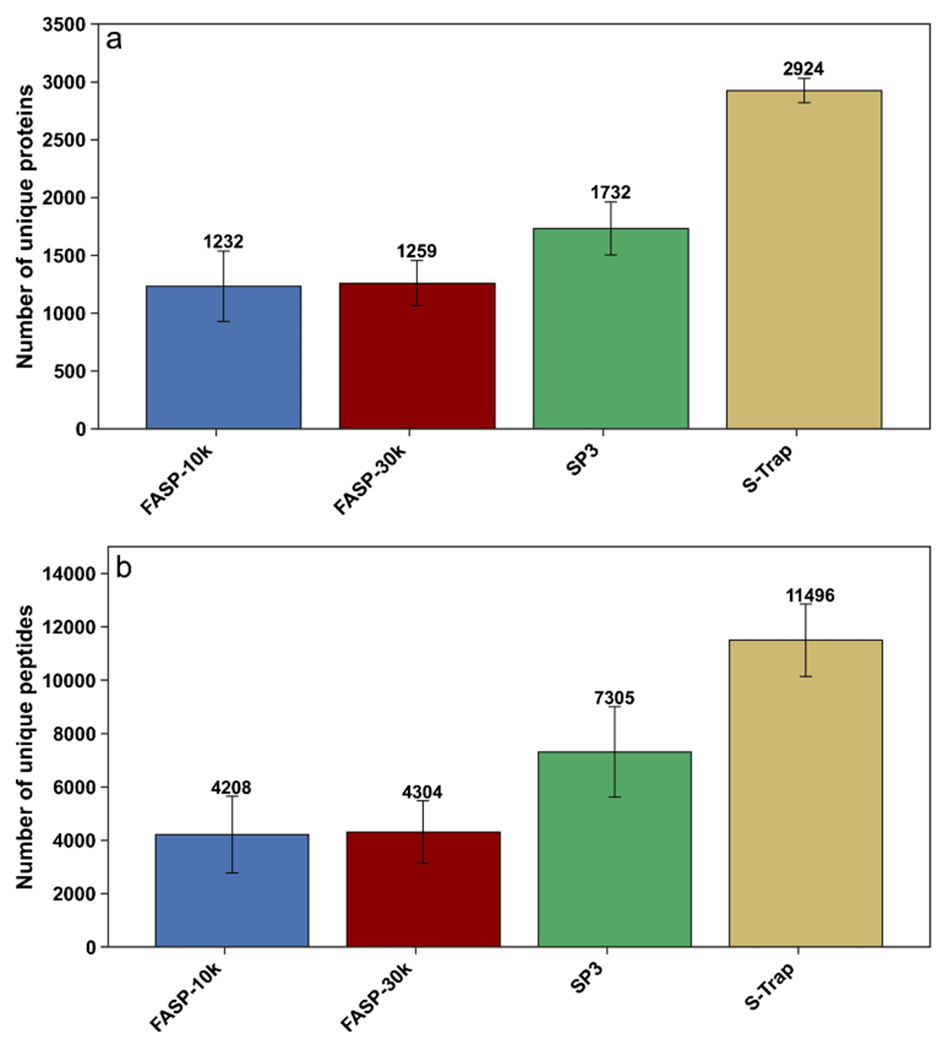
Comparison of four filtration methods, with the optimized lysis buffer from Fig. 1 used with each filtration method. a Mean number of unique proteins identified based on two or more unique peptides. b Mean number of unique peptides. Error bars represent standard deviation (n = 3)
Because the contaminant removal step using a filtration device is a common cause of sample loss during a bottom-up proteomics sample preparation workflow, we also compared each filtration device’s reproducibility across its three experimental replicates using Venn diagrams. The overlap in identified proteins between replicates is in the range of 37–75%, with FASP 10 and 30 k each showing the lowest overlap numbers, followed by SP3 and S-Trap (Fig. 5 Venn diagrams). Furthermore, we used a Pearson correlation coefficient (r) of the number of peptide spectral matches (PSM) of each protein identified in three replicates to evaluate the reproducibility of each filtration method across its replicates (Fig. 5 heatmaps). We used the PSM comparison of proteins detected in all replicates and their corresponding Pearson correlation coefficient (r) to generate the heatmaps. These PSM values were normalized based on the length of each protein (number of amino acids) using the normalized spectral abundance factor (NSAF) strategy [31]. It was determined that S-Trap resulted in the strongest correlations (r = 0.9123–0.9663) between replicates.
Fig. 5.
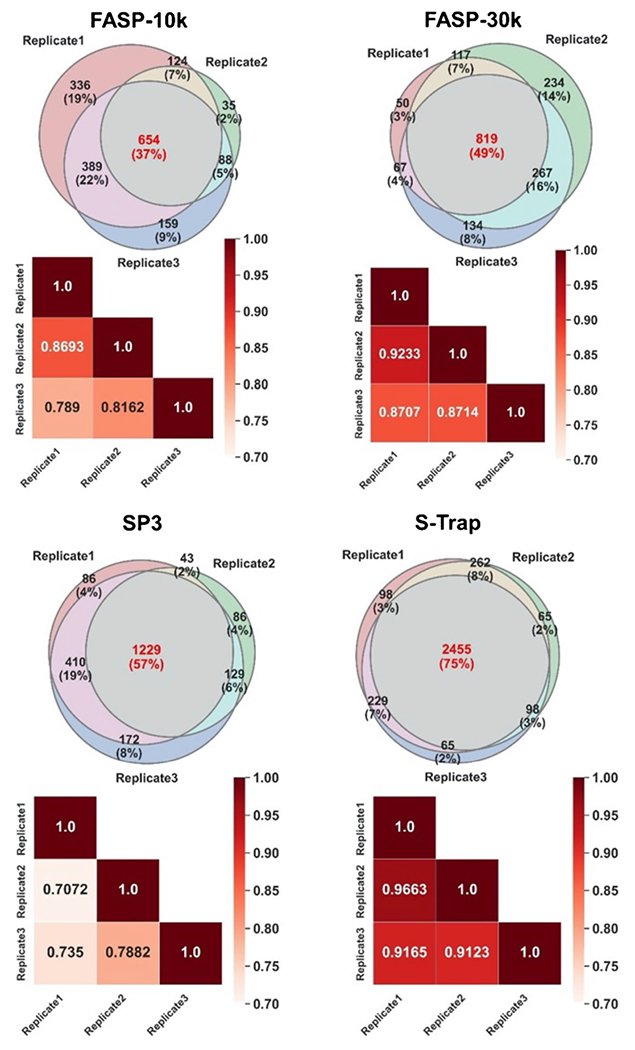
Experimental repeatability on the protein level. Venn diagrams display the overlap in protein identifications across three experimental replicates of each filtration method. The heatmaps display the PSM comparison of proteins detected in all replicates and their corresponding Pearson correlation coefficient (r)
To further compare the performance of these filtration methods, time was considered to be an important factor. Substitution of the FASP 10 k cutoff Microcon filtration units with 30 k cutoff units increased the protein yield while concomitantly reducing the overall time spent for the multiple centrifugation rounds. However, FASP is still a much more time-consuming technique compared to S-Trap and modified SP3. Among the three tested methods, S-Trap is the fastest protocol (time ≤ 50 min), as indicated in Fig. 6. Unlike FASP and SP3, the S-Trap decreases sample preparation time since each centrifugation step using S-Trap rarely takes more than 3 min. Overall, compared to the FASP and SP3 methods’ total on-filter times of approximately 200 and 80 min, respectively, S-Trap on-filter time is less than 50 min, providing a highly efficient cleanup method for bottom-up proteomics.
Fig. 6.
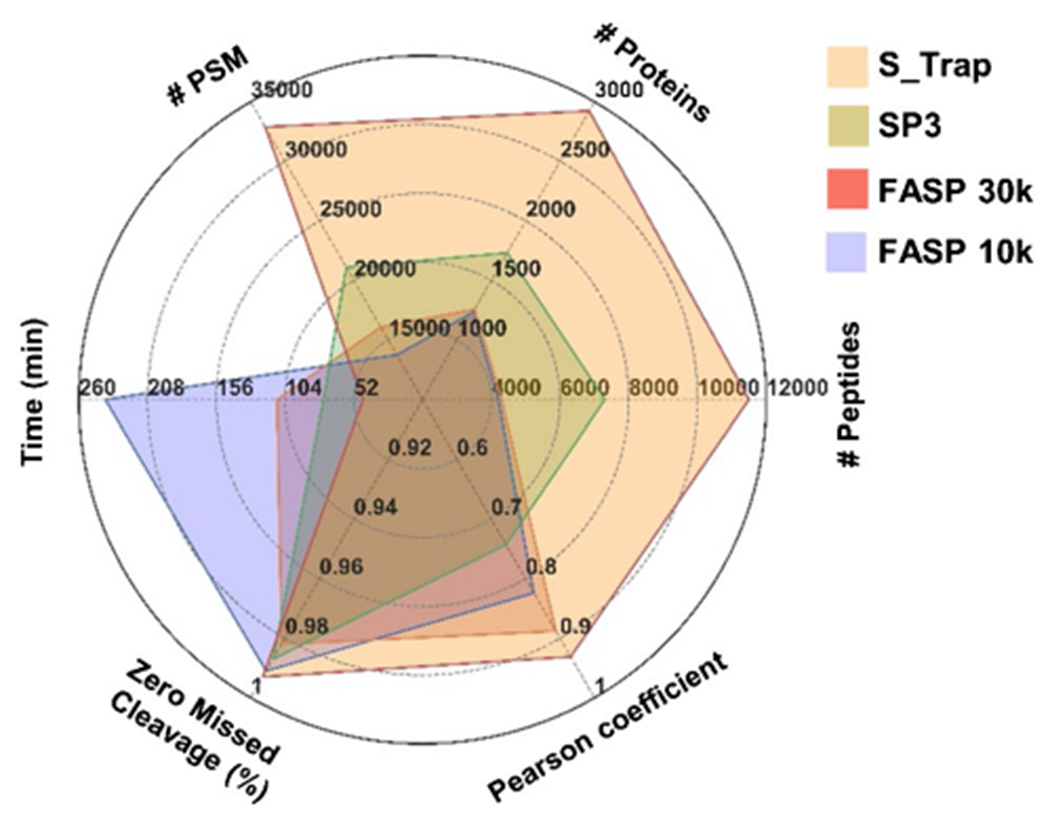
Characteristics of each filtration method, including mean number of identified proteins, peptides, PSMs, Pearson correlation coefficient (r), percentage of zero missed cleavages (%), and time (min)
Overall, S-Trap is a faster protein cleanup technique. In addition, S-Trap provided the greatest number of identified proteins, peptides, and PSMs and the strongest correlations between replicates at the protein level. S-Trap also offered the highest percentage of zero missed cleavages as an important factor in evaluating enzymatic digestion efficiency (Fig. 6).
Evaluating the initial mass of samples on protein coverage
One of the main challenges of bottom-up proteomics has been limited total biological sample mass [43]. Mass-limited samples might not provide reproducible amounts of proteins to generate reliable mass spectrometric data. In addition, protein extraction and contaminant removal steps are more sensitive to sample losses when only small amounts of material are available. Therefore, here, we compared different initial masses of 5, 10, and 20 mg of feces to determine how the sample amount affects the final fecal protein profile. The range was selected based on a single fecal pellet’s normal weight from CBA/J mice under healthy (~ 20 mg) and disease (~ 5 mg) conditions, realizing that we often split collected fecal pellets between our metabolomics, proteomics, genomics, and transcriptomics work. Here we used the number of identified peptides and proteins as well as replicate reproducibility as the metrics for comparison, as the same amount of protein was used for digestion and the peptide mass loaded on the LC/MS was kept the same (200 ng). Initially, we assessed each sample mass’s performance by comparing the number of identified proteins and PSMs. As indicated in Fig. 7, 20 mg of feces, with 200 ng loaded onto the LC/MS, yielded the greatest number of protein identifications (mean = 2661). However, there are no significant differences between 10 and 20 mg in the number of identified proteins (P-value > 0.05) (realizing that 200 ng was loaded onto the instrument in each case). In contrast, a fecal mass of 5 mg (with 200 ng loaded onto the instrument) resulted in the fewest protein identifications (mean = 1747) and the differences are significant comparing 5 mg to either 10 or 20 mg. This suggests more sample loss throughout the sample preparation steps for the 5-mg sample than the 10- and 20-mg samples and/or detection of fewer proteins with a minimum of two peptides identified. The sample loss is more critical for lower abundance proteins and can significantly impact the identification of these proteins. Therefore, despite injecting the same peptide mass for all samples, in the case of the 5-mg sample, these peptides are mapped to a smaller number of proteins (mainly high-abundance proteins).
Fig. 7.
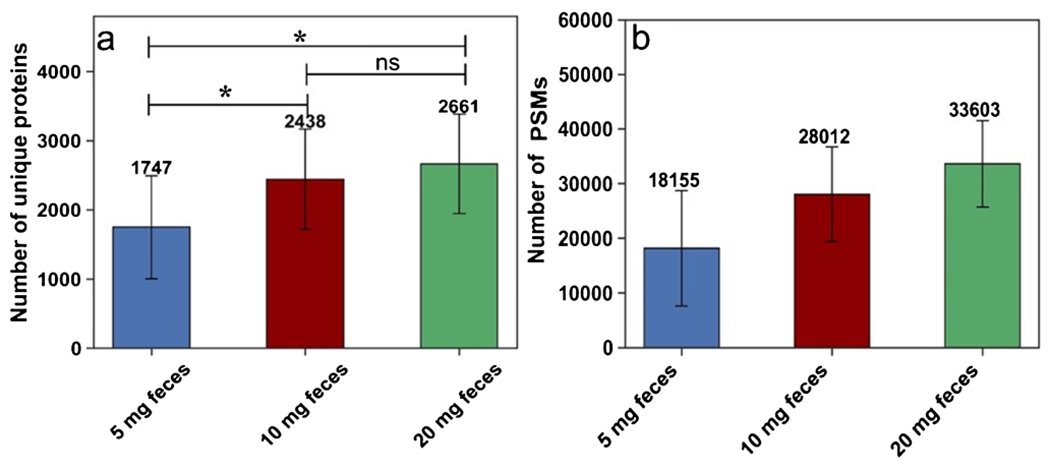
For each initial mass, only 200 ng peptides were loaded onto the LC/MS. a Mean number of unique proteins identified based on two or more unique peptides. b Mean number of peptide spectral matches. Error bars represent standard deviation (n = 3). ns = not significant, *p-value < 0.05
We further assessed each method’s quantitative reproducibility by calculating the Pearson correlation coefficient for the number of PSMs for similar proteins between the three replicates. The resulting linear correlations between the experiments (See Electronic Supplementary Material, Fig. S2) signified that the experiments based on the 20-mg feces performed marginally better (average r = 0.8546) than 10 mg (average r = 0.8314). Nevertheless, the difference was not statistically significant. Thus, overall, based on our results, while increasing the initial amount of feces from 5 to 10 or 20 mg raises the protein yields, it does not affect the reproducibility as indicated by comparable Pearson correlation coefficients between PSMs.
Conclusion
Reproducible proteomics sample preparation is challenging, especially when limited amounts of complex starting material are available. A prerequisite for reliable bottom-up proteomics analysis is efficient cell lysis and protein extraction. However, protein extraction from some biological samples such as feces is typically more challenging than others, such as tissues, mainly due to the presence of a diversity of microbial cell wall structures with different resistance that adds to the biological samples’ inherent complexity. Therefore, in this study, we aimed to build an optimal sample preparation workflow for proteomic analysis of mouse fecal samples based on (i) simplicity in setup and operation; (ii) reproducibility across the replicates; (iii) compatibility with a diverse set of chemicals (e.g., detergents, chaotropes, and salts); and (iv) sample preparation time when a small amount of sample is used. To meet these criteria, we have tested the performance of different lysis buffers for protein extraction and different filtration methods for the removal of MS-incompatible salts during proteomics analysis of mouse fecal samples. Among the evaluated conditions, we concluded that the optimal lysis buffer contains 5% SDS, 2 M urea, and 50 mM Tris–HCl. S-Trap was the fastest and most highly reproducible method compared with the popular FASP and SP3 protocols. Although the FASP method has been frequently used for many applications, the batch-to-batch variation is one of the main limitations of this method when a limited amount of sample is available [19, 44]. Protein extraction with 5% SDS + 2 M urea + 50 mM Tris–HCl followed by cleanup using S-Trap resulted in the best combination of high protein identifications, a smaller number of identified peptides with missed cleavages, and high reproducibility, yielding an optimal method for proteomics analysis of fecal samples. No significant differences were observed in protein yields from 10 to 20 mg feces when 200 ng of prepared sample was injected into the LC–MS suggesting reproducible homogenization of the samples and/or uniform loss, but the use of 5 mg initial fecal sample led to an overall lower number of protein identifications. Overall, our optimized sample preparation workflow is fast and straightforward, and does not require a high amount of initial fecal sample. Our final optimized method provides an efficient digestion of mouse fecal material that is highly reproducible and leads to high proteomic coverage for both host and microbiome proteins, although we have subsequently established that a combination of probe sonication and Bioruptor provides even more protein IDs. Our optimized proteomics sample preparation is currently being applied to gut environment fecal analyses under different disease conditions.
Supplementary Material
Acknowledgements
We thank the OSU Campus Chemical Instrument Center for access to the timsTOF Pro purchased with grant S10 OD026945 from the National Institutes of Health.
Funding
This work was funded by the grant number 5R01AI43288 from the National Institutes of Health.
Data availability
The mass spectrometry proteomics data have been deposited to the ProteomeXchange [29] Consortium via the PRIDE [30] partner repository with the dataset identifier PXD027788.
Biographies
Maryam Baniasad is a PhD candidate in Vicki Wysocki’s lab at The Ohio State University. After working in the field of pharmaceutical biotechnology as an undergraduate, she has focused on mass spectrometry–based proteomics and metabolomics for characterizing Salmonella infection.

Yongseok Kim is a PhD candidate in Vicki Wysocki’s lab at The Ohio State University. He is interested in mass spectrometry–based omics to study Salmonella-induced inflammation.

Michael Shaffer is a microbiome-focused computational biologist who received his PhD from the University of Colorado Anschutz Medical Campus. He is interested in understanding the interactions within microbial communities.

Anice Sabag-Daigle received her B.S. in Microbiology from Ohio Wesleyan University in 2001 and went on to receive her PhD from The Ohio State University in 2009. Her research expertise is in the regulation of virulence and metabolic gene expression of pathogenic microbes.

Ikaia Leleiwi is a PhD candidate at Colorado State University where he performs multi-omics microbiome research to identify community dynamics and pathogen-commensal interactions during Salmonella-induced inflammation.

Rebecca A. Daly is a research associate at Colorado State University. Her research focuses on viruses that infect bacteria and archaea in different ecosystems.
Brian M. M. Ahmer is Professor at Ohio State University where he studies bacterial genetics and pathogenesis, primarily using Salmonella as the model.

Kelly C. Wrighton is Associate Professor at Colorado State University where she couples holistic and reductionist approaches to interrogate the interactions between organismal bioenergetics, interconnected community metabolism, and chemical processes. Her lab employs computational systems biology approaches that predict metabolic potential in both individual microorganisms and microbial communities.

Vicki H. Wysocki is Professor and Ohio Eminent Scholar at The Ohio State University, where she is also Director of the Campus Chemical Instrument Center, Associate Director of the Foods for Health Initiative, and Director of the NIH-funded Resource for Native Mass Spectrometry Guided Structural Biology.

Footnotes
Supplementary Information The online version contains supplementary material available at https://doi.org/10.1007/s00216-022-03885-z.
Ethics approval Mouse experiments in this study were performed in accordance with protocols approved by The Ohio State University Institutional Animal Care and Use Committee (IACUC; OSU 2009A0035-R4).
Consent to participate Not applicable.
Consent for publication The authors have approved the manuscript and agree with submission.
Conflict of interest The authors declare no competing interests.
References
- 1.Finehout EJ, Lee KH. An introduction to mass spectrometry applications in biological research. Biochem Mol Biol Educ. 2004;32:93–100. 10.1002/bmb.2004.494032020331. [DOI] [PubMed] [Google Scholar]
- 2.Chace DH, Petricon EF, Liotta LA. Mass spectrometry-based diagnostics: the upcoming revolution in disease detection has already arrived [3] (multiple letters). Clin Chem. 2003;49:1227–9. 10.1373/49.7.1227. [DOI] [PubMed] [Google Scholar]
- 3.Zhang Y, Fonslow BR, Shan B, Baek MC, Yates JR. Protein analysis by shotgun/bottom-up proteomics. Chem Rev. 2013;113:2343–94. 10.1021/cr3003533. [DOI] [PMC free article] [PubMed] [Google Scholar]
- 4.Gundry RL, White MY, Murray CI, Kane LA, Fu Q, Stanley BA, et al. Preparation of proteins and peptides for mass spectrometry analysis. 2010;77:342–55. 10.1002/0471142727.mb1025s88.Preparation. [DOI] [PMC free article] [PubMed] [Google Scholar]
- 5.Gillet LC, Leitner A, Aebersold R. Mass spectrometry applied to bottom-up proteomics: entering the high-throughput era for hypothesis testing. Annu Rev Anal Chem. 2016;9:449–72. 10.1146/annurev-anchem-071015-041535. [DOI] [PubMed] [Google Scholar]
- 6.Lichtman JS, Ferreyra JA, Ng KM, Smits SA, Sonnenburg JL, Elias JE. Host-microbiota interactions in the pathogenesis of antibiotic-associated diseases. Cell Rep. 2016;14:1049–61. 10.1016/j.celrep.2016.01.009. [DOI] [PMC free article] [PubMed] [Google Scholar]
- 7.Deatherage Kaiser BL, Li J, Sanford JA, Kim YM, Kronewitter SR, Jones MB, et al. A Multi-omic view of host-pathogen-commensal interplay in Salmonella-mediated intestinal infection. PLoS One 2013;8. 10.1371/journal.pone.0067155. [DOI] [PMC free article] [PubMed] [Google Scholar]
- 8.Thursby E, Juge N. Introduction to the human gut microbiota. Biochem J. 2017;474:1823–36. 10.1042/BCJ20160510. [DOI] [PMC free article] [PubMed] [Google Scholar]
- 9.Hao WL, Lee YK. Microflora of the gastrointestinal tract: a review. Methods Mol Biol. 2004;268:491–502. 10.1385/1-59259-766-1:491. [DOI] [PubMed] [Google Scholar]
- 10.Hillman ET, Lu H, Yao T, Nakatsu CH. Microbial ecology along the gastrointestinal tract. Microbes Environ. 2017;32:300–13. 10.1264/jsme2.ME17017. [DOI] [PMC free article] [PubMed] [Google Scholar]
- 11.Zhang X, Li L, Mayne J, Ning Z, Stintzi A, Figeys D. Assessing the impact of protein extraction methods for human gut metaproteomics. J Proteomics. 2018;180:120–7. 10.1016/j.jprot.2017.07.001. [DOI] [PubMed] [Google Scholar]
- 12.Wu J, Zhu J, Yin H, Liu X, An M, Pudlo NA, et al. Development of an integrated pipeline for profiling microbial proteins from mouse fecal samples by LC-MS/MS. J Proteome Res. 2016;15:3635–42. 10.1021/acs.jproteome.6b00450. [DOI] [PMC free article] [PubMed] [Google Scholar]
- 13.Waas M, Bhattacharya S, Chuppa S, Wu X, Jensen DR, Omasits U, et al. Combine and conquer: surfactants, solvents, and chaotropes for robust mass spectrometry based analyses of membrane proteins. Anal Chem. 2014;86:1551–9. 10.1021/ac403185a. [DOI] [PMC free article] [PubMed] [Google Scholar]
- 14.Wang Y, Zhou Y, Xiao X, Zheng J, Zhou H. Metaproteomics: a strategy to study the taxonomy and functionality of the gut microbiota. vol. 219. Elsevier B.V; 2020. 10.1016/j.jprot.2020.103737. [DOI] [PubMed] [Google Scholar]
- 15.Chen EI, Cociorva D, Norris JL, Yates JR. Optimization of mass spectrometry-compatible surfactants for shotgun proteomics. J Proteome Res. 2007;6:2529–38. 10.1021/pr060682a. [DOI] [PMC free article] [PubMed] [Google Scholar]
- 16.Botelho D, Wall MJ, Vieira DB, Fitzsimmons S, Liu F, Doucette A. Top-down and bottom-up proteomics of SDS-containing solutions following mass-based separation. J Proteome Res. 2010;9:2863–70. 10.1021/pr900949p. [DOI] [PubMed] [Google Scholar]
- 17.Ilavenil S, Al-Dhabi NA, Srigopalram S, Kim YO, Agastian P, Baaru R, et al. Removal of SDS from biological protein digests for proteomic analysis by mass spectrometry. Proteome Sci. 2016;14:1–6. 10.1186/s12953-016-0098-5. [DOI] [PMC free article] [PubMed] [Google Scholar]
- 18.Baniasad M, Reed AJ, Lai SM, Zhang L, Schulte KQ, Smith AR, et al. Optimization of proteomics sample preparation for forensic analysis of skin samples. J Proteomics. 2021;249: 104360. 10.1016/j.jprot.2021.104360. [DOI] [PubMed] [Google Scholar]
- 19.Ludwig KR, Schroll MM, Hummon AB. Comparison of in-solution, FASP, and S-Trap based digestion methods for bottom-up proteomic studies. J Proteome Res. 2018;17:2480–90. 10.1021/acs.jproteome.8b00235. [DOI] [PMC free article] [PubMed] [Google Scholar]
- 20.Wiśniewski JR, Zougman A, Nagaraj N, Mann M. Universal sample preparation method for proteome analysis. Nat Methods. 2009;6:359–62. 10.1038/nmeth.1322. [DOI] [PubMed] [Google Scholar]
- 21.Hailemariam M, Eguez RV, Singh H, Bekele S, Ameni G, Pieper R, et al. S-Trap, an ultrafast sample-preparation approach for shotgun proteomics. J Proteome Res. 2018;17:2917–24. 10.1021/acs.jproteome.8b00505. [DOI] [PubMed] [Google Scholar]
- 22.Hughes CS, Moggridge S, Müller T, Sorensen PH, Morin GB, Krijgsveld J. Single-pot, solid-phase-enhanced sample preparation for proteomics experiments. Nat Protoc. 2019;14:68–85. 10.1038/s41596-018-0082-x. [DOI] [PubMed] [Google Scholar]
- 23.Müller T, Kalxdorf M, Longuespée R, Kazdal DN, Stenzinger A, Krijgsveld J. Automated sample preparation with SP 3 for low-input clinical proteomics . Mol Syst Biol 2020;16:1–19. 10.15252/msb.20199111. [DOI] [PMC free article] [PubMed] [Google Scholar]
- 24.Peng Y, Leung HCM, Yiu SM, Chin FYL. IDBA-UD: A de novo assembler for single-cell and metagenomic sequencing data with highly uneven depth. Bioinformatics. 2012;28:1420–8. 10.1093/bioinformatics/bts174. [DOI] [PubMed] [Google Scholar]
- 25.Li D, Liu CM, Luo R, Sadakane K, Lam TW. MEGAHIT: an ultra-fast single-node solution for large and complex metagenomics assembly via succinct de Bruijn graph. Bioinformatics. 2015;31:1674–6. 10.1093/bioinformatics/btv033. [DOI] [PubMed] [Google Scholar]
- 26.Hyatt Doug, Chen Gwo-Liang, LoCascio Philip F, Land Miriam L, L FW, J Hauser L. Prodigal: prokaryotic gene recognition and translation initiation site identification. BMC Bioinformatics 2010;6:1–8. [DOI] [PMC free article] [PubMed] [Google Scholar]
- 27.Lesker TR, Durairaj AC, Gálvez EJC, Lagkouvardos I, Baines JF, Clavel T, et al. An integrated metagenome catalog reveals new insights into the murine gut microbiome. Cell Rep. 2020;30:2909–2922.e6. 10.1016/j.celrep.2020.02.036. [DOI] [PMC free article] [PubMed] [Google Scholar]
- 28.Steinegger M, Söding J. Clustering huge protein sequence sets in linear time. Nat Commun 2018;9. 10.1038/s41467-018-04964-5. [DOI] [PMC free article] [PubMed] [Google Scholar]
- 29.Deutsch EW, Csordas A, Sun Z, Jarnuczak A, Perez-Riverol Y, Ternent T, et al. The ProteomeXchange consortium in 2017: supporting the cultural change in proteomics public data deposition. Nucleic Acids Res. 2017;45:D1100–6. 10.1093/nar/gkw936. [DOI] [PMC free article] [PubMed] [Google Scholar]
- 30.Perez-Riverol Y, Csordas A, Bai J, Bernal-Llinares M, Hewapathirana S, Kundu DJ, et al. The PRIDE database and related tools and resources in 2019: improving support for quantification data. Nucleic Acids Res. 2019;47:D442–50. 10.1093/nar/gky1106. [DOI] [PMC free article] [PubMed] [Google Scholar]
- 31.McIlwain S, Mathews M, Bereman MS, Rubel EW, MacCoss MJ, Noble WS. Estimating relative abundances of proteins from shotgun proteomics data. BMC Bioinformatics. 2012;13:308. 10.1186/1471-2105-13-308. [DOI] [PMC free article] [PubMed] [Google Scholar]
- 32.Lichtman JS, Marcobal A, Sonnenburg JL, Elias JE. Host-centric proteomics of stool: a novel strategy focused on intestinal responses to the gut microbiota. Mol Cell Proteomics. 2013;12:3310–8. 10.1074/mcp.M113.029967. [DOI] [PMC free article] [PubMed] [Google Scholar]
- 33.Ang CS, Rothacker J, Patsiouras H, Burgess AW, Nice EC. Murine fecal proteomics: a model system for the detection of potential biomarkers for colorectal cancer. J Chromatogr A. 2010;1217:3330–40. 10.1016/j.chroma.2009.10.007. [DOI] [PubMed] [Google Scholar]
- 34.Mesuere B, Debyser G, Aerts M, Devreese B, Vandamme P, Dawyndt P. The Unipept metaproteomics analysis pipeline. Proteomics. 2015;15:1437–42. 10.1002/pmic.201400361. [DOI] [PubMed] [Google Scholar]
- 35.Mesuere B, Devreese B, Debyser G, Aerts M, Vandamme P, Dawyndt P. Unipept: tryptic peptide-based biodiversity analysis of metaproteome samples. J Proteome Res. 2012;11:5773–80. 10.1021/pr300576s. [DOI] [PubMed] [Google Scholar]
- 36.Forster SC, Kumar N, Anonye BO, Almeida A, Viciani E, Stares MD, et al. A human gut bacterial genome and culture collection for improved metagenomic analyses. Nat Biotechnol. 2019;37:186–92. 10.1038/s41587-018-0009-7. [DOI] [PMC free article] [PubMed] [Google Scholar]
- 37.Zhang X, Ning Z, Mayne J, Moore JI, Li J, Butcher J, et al. MetaPro-IQ: a universal metaproteomic approach to studying human and mouse gut microbiota. Microbiome. 2016;4:1–12. 10.1186/s40168-016-0176-z. [DOI] [PMC free article] [PubMed] [Google Scholar]
- 38.Borton MA, Sabag-Daigle A, Wu J, Solden LM, O’Banion BS, Daly RA, et al. Chemical and pathogen-induced inflammation disrupt the murine intestinal microbiome. Microbiome. 2017;5:1–15. 10.1186/s40168-017-0264-8. [DOI] [PMC free article] [PubMed] [Google Scholar]
- 39.Jiang X, Jiang X, Feng S, Tian R, Ye M, Zou H. Development of efficient protein extraction methods for shotgun proteome analysis of formalin-fixed tissues. J Proteome Res. 2007;6:1038–47. 10.1021/pr0605318. [DOI] [PubMed] [Google Scholar]
- 40.Tanca A, Palomba A, Pisanu S, Addis MF, Uzzau S. Enrichment or depletion? The impact of stool pretreatment on metaproteomic characterization of the human gut microbiota. Proteomics. 2015;15:3474–85. 10.1002/pmic.201400573. [DOI] [PubMed] [Google Scholar]
- 41.Isaacson T, Damasceno CMB, Saravanan RS, He Y, Catalá C, Saladié M, et al. Sample extraction techniques for enhanced proteomic analysis of plant tissues. Nat Protoc. 2006;1:769–74. 10.1038/nprot.2006.102. [DOI] [PubMed] [Google Scholar]
- 42.Zougman A, Selby PJ, Banks RE. Suspension trapping (STrap) sample preparation method for bottom-up proteomics analysis. Proteomics. 2014;14:1006–1000. 10.1002/pmic.201300553. [DOI] [PubMed] [Google Scholar]
- 43.Feist P, Hummon AB. Proteomic challenges: sample preparation techniques for microgram-quantity protein analysis from biological samples. Int J Mol Sci. 2015;16:3537–63. 10.3390/ijms16023537. [DOI] [PMC free article] [PubMed] [Google Scholar]
- 44.Erde J, Loo RRO, Loo JA. Improving proteome coverage and sample recovery with enhanced FASP (eFASP) for quantitative proteomic experiments. Methods Mol Biol 2017;1551:11–8. 10.1007/978-1-4939-6747-6_2. [DOI] [PMC free article] [PubMed] [Google Scholar]
Associated Data
This section collects any data citations, data availability statements, or supplementary materials included in this article.
Supplementary Materials
Data Availability Statement
The mass spectrometry proteomics data have been deposited to the ProteomeXchange [29] Consortium via the PRIDE [30] partner repository with the dataset identifier PXD027788.


