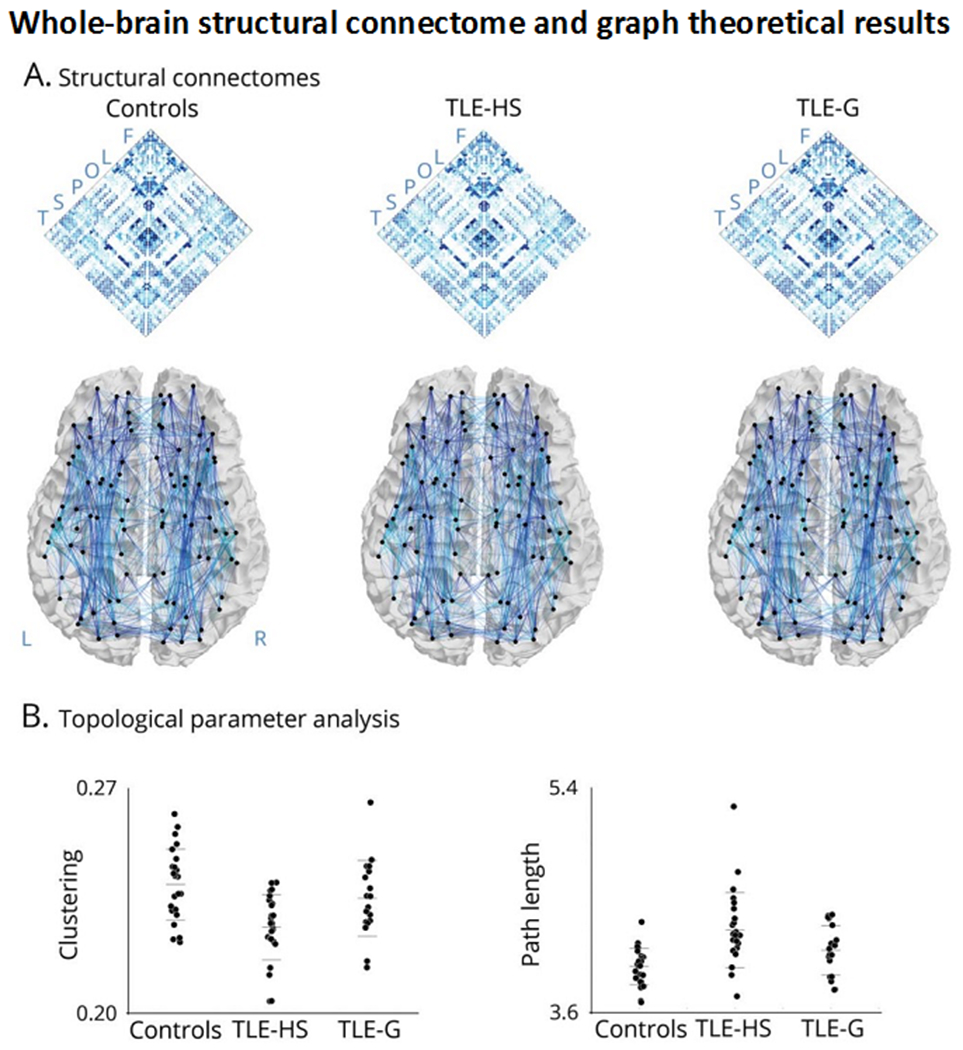
Figure 3. Group differences in network topology.

Panel A shows whole-brain structural connectomes in healthy controls, temporal lobe epilepsy (TLE) patients with hippocampal sclerosis (TLE-HS), and TLE patients with isolated gliosis (TLE-G). Maps were generated using diffusion tractography between all regions. Letters refer to regional groupings of the nodes (F = frontal; L = limbic; O = occipital; P = parietal; S = sub-cortical; T= temporal). Panel B depicts whole-brain graph theoretical results showing a markedly increased path length and decreased clustering coefficient in TLE-HS compared to controls and TLE-G, whereas those with TLE-G are only moderately affected compared to controls. Reproduced from Bernhardt et al., 2019, with permission.
