

Abstract
γ-Aminobutyric acid (GABA) transporter 1 (GAT1)1 regulates neuronal excitation of the central nervous system by clearing the synaptic cleft of the inhibitory neurotransmitter GABA upon its release from synaptic vesicles. Elevating the levels of GABA in the synaptic cleft, by inhibiting GABA reuptake transporters, is an established strategy to treat neurological disorders, such as epilepsy2. Here we determined the cryo-electron microscopy structure of full-length, wild-type human GAT1 in complex with its clinically used inhibitor tiagabine3, with an ordered part of only 60 kDa. Our structure reveals that tiagabine locks GAT1 in the inward-open conformation, by blocking the intracellular gate of the GABA release pathway, and thus suppresses neurotransmitter uptake. Our results provide insights into the mixed-type inhibition of GAT1 by tiagabine, which is an important anticonvulsant medication. Its pharmacodynamic profile, confirmed by our experimental data, suggests initial binding of tiagabine to the substrate-binding site in the outward-open conformation, whereas our structure presents the drug stalling the transporter in the inward-open conformation, consistent with a two-step mechanism of inhibition4. The presented structure of GAT1 gives crucial insights into the biology and pharmacology of this important neurotransmitter transporter and provides blueprints for the rational design of neuromodulators, as well as moving the boundaries of what is considered possible in single-particle cryo-electron microscopy of challenging membrane proteins.
GABA is the main inhibitory neurotransmitter of the mature mammalian central nervous system and is responsible for the reduction of neuronal excitability by lowering the probability of triggering an action potential through interactions with ionotropic (GABAA)5 and metabotropic (GABAB)6 GABA receptors. The release of GABA into the synaptic cleft is tightly regulated to avoid overexposure and leakage to surrounding synapses. GAT1 (encoded by SLC6A1) is responsible for clearing GABA from the synaptic cleft, commonly referred to as ‘reuptake’1. GAT1 serves as the main GABA reuptake transporter of the mammalian brain and is dominantly expressed in the cerebral cortex, where it is localized in both axonal termini of neurons, as well as astrocytes7, in addition to other neuronal tissues, such as the basal ganglia8. Imbalances in the levels of GABA in the synaptic cleft can lead to severe neurological disorders, such as epilepsy, schizophrenia, anxiety, alcoholism and depression9–11, whereas dysfunction of GAT1 is linked to neurodegenerative diseases, such as Parkinson disease8 and Alzheimer disease12.
Inhibition of reuptake transporters to elevate the levels of GABA in the synaptic cleft is an established strategy to treat neurological disorders, such as epilepsy2. At present, only one drug targeting GAT1—tiagabine—is approved as an anticonvulsant and is used in the treatment of partial seizures in patients with epilepsy. Tiagabine has also been investigated for its effect on alcohol withdrawal symptoms13, anxiety disorders14 and depression15. Tiagabine was demonstrated to target GAT1 in 1990 (ref. 3), although its immediate mechanism of action has been elusive. It has been described as a mixed-type inhibitor of GAT1 with characteristics of both competitive and non-competitive inhibition3,16,17. In the recent past, several studies have focused on molecular-docking investigations of tiagabine inhibition, performed under the assumption that GAT1 remains locked in the outward-open conformation18–20.
GAT1 is a member of the solute carrier 6 (SLC6) transporter family, also referred to as secondary active neurotransmitter/sodium-symporters (NSSs). Members of the NSS family, such as the serotonin (SERT), dopamine (DAT) and glycine (GlyT) transporters, and GAT1 show a modest sequence identity of approximately 50%. NSS family members share a common fold comprising 12 transmembrane domains (TM1–12) and utilize the Na+ and Cl− gradient across the synaptic plasma membrane, where each substrate molecule is co-transported with Na+ and Cl− ions, whereas the exact substrate-to-ion stoichiometry is transporter-dependent21–23. The transport mechanism of NSS follows an alternating-access mechanism24,25, in which the initial outward-open conformation of the transporter exposes the substrate-binding site to the synaptic cleft, enabling ion and substrate binding. This, in turn, triggers closing of the extracellular gate (occluded conformation), followed by opening of the intracellular gate, resulting in the release of the substrate into the cytoplasm (inward-open conformation). The conformational rearrangements associated with this mechanism are predominantly driven by TM1 and TM6, each of which consists of two helices, connected by a hinge region in the centre of the lipid bilayer (Fig. 1c. These hinge segments coordinate the binding of Na+ (binding sites: Na1 and Na2) and Cl−, forming the substrate-binding pocket (S1)26–28, while also accommodating the majority of known inhibitors of varying sizes26,29–31.
Fig. 1 |. Cryo-EM structure determination of full-length, wild-type human GAT1 in the inward-open conformation.
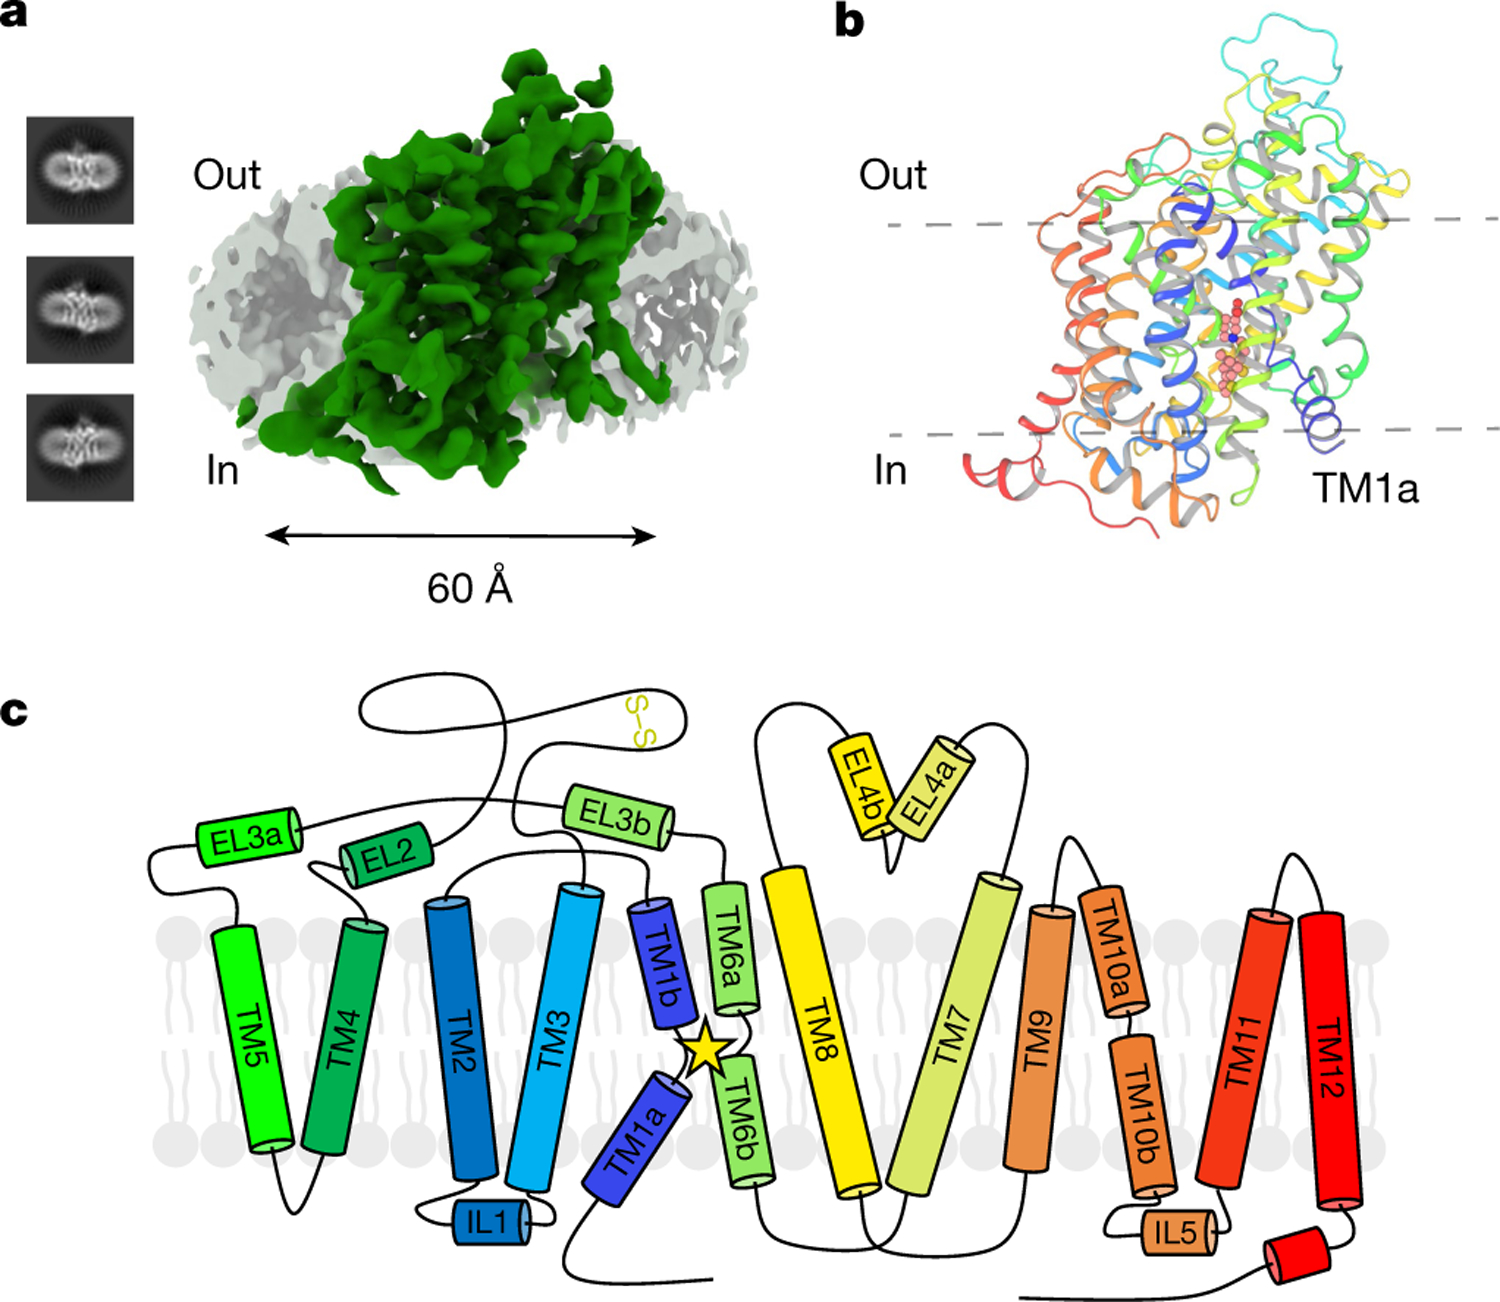
a, Representative 2D classes obtained during single-particle cryo-EM data analysis, together with overall reconstruction of GAT1 (green) at 3.8 Å with depicted LMNG or CHS micelle (grey). b, Overview of the final GAT1 model (cartoon representation). View is from the membrane plane, with highlighted tiagabine (spheres). TM1a is labelled to emphasize the inward-open conformation. c, Topology diagram of the full-length, wild-type GAT1 cryo-EM construct, carrying no thermostabilizing mutations, nor any truncations. Extracellular loop EL2 has a strictly conserved disulfide bond observed in NSS transporters between C163 and C173. The star emphasizes the location of the substrate-binding pocket between TM3, TM8 and the hinge regions of TM1 and TM6.
Structural details of the NSS transporter fold, as well as the transport mechanism have been studied extensively on the bacterial homologue leucine transporter (LeuT) by X-ray crystallography28,32,33. Technical advances in cryo-electron microscopy (cryo-EM) have allowed the analysis of the serotonin transporter (SLC6A4) in various conformational states30. Most recently, the X-ray crystallography structure of the human GlyT transporter has been reported, presenting the transporter in complex with a conformationally selective nanobody and a small-molecule inhibitor (Cmpd1)31.
Structure determination of GAT1
Considering the above findings, our investigation was motivated by (1) how the apparent mixed-type inhibition by tiagabine manifested at the molecular level, and (2) how it would be compatible with locking GAT1 in a single (outward-open) conformation. To study this intriguing phenomenon, we used single-particle cryo-EM. In the recent past, several structures from the SLC family have been reported in the literature30,31,34. Owing to the small size of monomeric SLCs (50–70 kDa) and their low thermal stability, the majority of these transporters were studied in the presence of thermostabilizing mutations and truncations, and all structural studies of mammalian SLCs were performed in the presence of selective binding proteins (synthetic nanobodies (sybodies) or Fab fragments). These binding proteins are often selected to lock the respective transporter in a specific conformational state, which is typically accompanied by an increase in thermal stability35, and can interfere with, or entirely block, transport activity30. Small membrane proteins are particularly challenging imaging targets, as in many cases the majority of their ordered structure is buried within the detergent micelle, impeding alignment of the projections required in the reconstruction process. As a consequence, these binding proteins substantially aid the reconstruction process by adding to the overall mass and contrast of the transporter, and can be used as molecular fiducials36,37, thereby alleviating limitations of current algorithms.
However, the conceived limitations of single-particle cryo-EM are constantly shifting due to experimental and computational improvements, which motivated us to attempt a reconstruction of human GAT1 in the absence of a binding protein, using its wild-type and full-length sequence (Fig. 1). Indicative of specific binding, we measured the half-maximal inhibitory concentration (IC50) of tiagabine in [3H]-GABA uptake assays in HEK293S cells expressing human GAT1 with an IC50 = 390 ± 30 nM (Fig. 2c), which is well within the range of previously described values38–41. We expressed and purified human GAT1 from Sf9 insect cells, resulting in a monodisperse and stable sample (Methods and Extended Data Fig. 1), which could be specifically inhibited by tiagabine in a scintillation proximity assay with an IC50 of 290 ± 60 nM (Extended Data Fig. 1d). Our initial imaging attempts were focused on n-dodecyl-β-d-maltopyranoside (DDM)-solubilized GAT1, which were not successful, but changing the detergent throughout the purification to lauryl maltose neopentyl glycol (LMNG) increased the thermal stability of GAT1 from 47.6 °C to 59.4 °C (Extended Data Fig. 1c). Here we present—to our knowledge—the first full-length, wild-type structure of the human neurotransmitter transporter GAT1, with a final overall resolution of 3.8 Å (Fig. 1a and Extended Data Figs. 2 and 3).
Fig. 2 |. Structural details of the GAT1 tiagabine-binding pocket.

a, Overview model of GAT1 in cartoon representation to highlight the tiagabine-binding pocket, and the overall conformation of inward-open GAT1. Highlighted are TM7, TM1 and TM5. TM1 shows a strongly unwound hinge region, upon tiagabine binding. b, Tiagabine (sticks with carbon atoms in salmon) binding pocket in detail, with tiagabine density in mesh (contoured at 4.8σ) and interacting residues in stick representation. c, Specific uptake of [3H]-GABA in HEK293S cells expressing wild-type GAT1, wild-type GAT2, or GAT1 with mutations derived from GAT2, inhibited by increasing concentrations of tiagabine presented as mean counts per minute (CPM). Curves were calculated from n = 3 biologically independent experiments, each performed in triplicate measurements. Data points are normalized data derived from each independent construct to account for variability in transfection rates, followed by non-linear regression fits to calculate IC50 values. The mutant Y60C was chosen as an alternative, as Y60E showed no detectable uptake (Extended Data Fig. 1e), in agreement with previously published results. Two-way analysis of variance (ANOVA), corrected according to Dunnett’s test, was used to determine whether each mean of aggregate data from three independent experiments was significantly different from the corresponding value with wild-type GAT1 and wild-type GAT2 (****P < 0.0001, **P < 0.01, *P < 0.05 and not significant (NS)). d, Schematic representation of the tiagabine-binding site with all residues involved; hydrogen bonds and ionic interactions are shown as dashed lines. Illustration was made using the ChemDraw webserver (PerkinElmer). Tiagabine is circled in green and the nipecotic acid moiety is circled in blue. The substrate GABA is shown in the bottom left corner for comparison. Results from the molecular dynamics simulations are shown in grey, which are depicted as the mean and standard deviation of the shortest observed distance among atoms of the respective residues to the ligand, in the 1-μs simulations.
Architecture of GAT1
The overall architecture of human GAT1 in complex with tiagabine adopts the canonical ‘LeuT’ fold (Extended Data Fig. 3), comprising a 12 ɑ-helical transmembrane domain (TMD) bundle, showing an inverted pseudo-twofold symmetry, captured in the inward-open state (Fig. 1). Although a full-length construct of human GAT1 was used for structure determination, the N terminus (residues 1–46) and C terminus (residues 578–599) are disordered and were not observed in our reconstruction. The ordered N-terminal segment of TM1a points away from the core of the protein and is bent around TM7 (Fig. 3c,d), which opens the intracellular pathway for the substrate into the cytoplasm. This conformation breaks interactions of the intracellular gate, which are typically present in the outward-open and occluded conformations, such as W47 (TM1a)–N310 (TM6b)27,29,42 and R44 (TM1a)–D410 (TM8)43. A superposition with the inward-facing occluded state structure of engineered LeuT highlights the opening of the intracellular gate, namely, by unwinding of the conserved helix-breaking Gly(X9)Pro motif42 on the intracellular part of TM5 (G237(X9)P247 in GAT1), and both TM1a and TM7 splay away from the core of the substrate-binding domain (Fig. 3d). The conformation of TM1a in GAT1 is unique and it is currently the only structure derived from a full-length sequence, as all previous NSS structures were observed using truncated constructs. Its distinctive state could, potentially, be a consequence of the specific interaction of tiagabine with GAT1, or be a unique feature of GAT1 compared to other NSS transporters.
Fig. 3 |. Extracellular gate of GAT1 and comparison to other NSS-fold structures, highlighting rearrangements in the inward-open conformation.

a, Extensive network of interactions within the extracellular gate including the gatekeeper residues R69 and D451. Numbers correspond to the shortest atomic distances, between the respective residues, in Å. b, Superposition of GAT1 with the NSS homologue LeuT in the inward-facing occluded structure (PDB ID: 6XWM27), highlighting the conformational rearrangement of the substrate in the substrate-binding pocket, most dominantly the unwinding of the TM1 hinge. The number of hydrogen bonds and ionic interactions drops from 18 between Phe–Na+–LeuT, to 7 in tiagabine–GAT1. c, Focus on TM1a, which represents the most crucial part of the intracellular gate. GlyT1 and SERT show relatively straight TM1a, whereas GAT1 has a significantly bent helix, curved around TM7. d, Superposition of inward-open GAT1 and the inward-facing occluded LeuT structure (PDB ID: 6XWM27), highlighting the opening of the intracellular gate as the last transition to the inward-open conformation.
Superposition of GAT1 with the two inward-open homologous structures of human GlyT1 (Protein Data Bank (PDB) ID: 6ZBV31) and SERT (PDB ID: 6DZZ30) results in a Cɑ root mean square deviation of 1.2 Å and 1.5 Å, respectively. Despite these relatively low root mean square deviation values, a comparison shows differences mainly in the intracellular half of the transporters (Extended Data Figs. 5 and 6). The most substantial structural difference between the three human inward-open structures is the relative conformation of TM1a (Fig. 3c and Extended Data Fig. 6). Besides TM1a being more unwound at the hinge region (GAT1: 59-GYAIGL-64 versus GlyT1: 116-YAVGL-120 and SERT: 96-AVDL-99), the TM1a domain of GAT1 is bent towards and around TM7, with relative angles of 48.5° and 43.1° compared to TM1a of GlyT1 and SERT, respectively, resulting in longer distances between conserved residues of the intracellular gate in GAT1 (20.1 Å; W47 and V240), GlyT1 (18 Å; W103 and V315) and SERT (19.5 Å; W82 and V281) (Fig. 3c and Extended Data Fig. 5d–f).
The extracellular gate of GAT1 shows a complex network of interactions, with tight packing of the NVWRFPY motif of TM1 conserved among NSS transporters (Fig. 3a), indicating a closed extracellular gate. The extracellular gate shows very similar features to GlyT1; however, various differences to SERT (Extended Data Fig. 5g,h), most importantly the conformation and distances between the gatekeeper residues (for GAT1, R69 and D451 at 3.4 Å and 3.6 Å, respectively; and for SERT, R104 and E493 at 4.2 Å), are observed. Another important aspect is the overall coordination: in GAT1, R69 shares four hydrogen bonds with residues T290, S456 and D451, compared to three and two hydrogen bonds for the corresponding residues in GlyT1 and SERT, respectively. This is partly achieved by the unique addition of residue G457 in TM10, which is not present in any other human NSS homologue, and appears to add a certain degree of flexibility to the hinge region of TM10, allowing additional hydrogen bond formation (Fig. 3a and Extended Data Fig. 6d).
Binding mode of tiagabine
An unambiguous electron density was observed for tiagabine (Fig. 2b). Tiagabine forms a complex with GAT1 through an extensive network of aromatic, hydrophobic, ionic and hydrogen bond interactions, located between the S1 site and the intracellular gate, with the majority of interactions occurring with TM1a, TM6b, TM7 and TM8 (Fig. 2b,d). Superposition of the GAT1 structure with substrate-bound LeuT27 (Fig. 3b) suggests that the carboxyl group of the nipecotic acid moiety of tiagabine replaces the carboxyl group of the substrate GABA (Figs. 2b, d and 3b) and is coordinated by the backbone of TM1, while forming hydrogen bonds with the backbone amino groups of G63, L64 and G65, as well as the hydroxyl of the Y140 side chain (Fig. 2b,d), similar to the interactions of substrates in LeuT27 (Fig. 3b). The observed Y140 interaction is consistent with previous biochemical findings, which was shown to be crucial for substrate binding in GAT1 (ref. 44). The nipecotic acid moiety of tiagabine therefore probably fills the proposed GABA-binding site, located between the two sodium-binding sites Na1 and Na2, which is corroborated by the fact that nipecotic acid is transported as a substrate by GAT1 (ref. 3). The side chains of F294 on TM6a and Y140 on TM3 form the top of the binding pocket (Fig. 2b,d). One of the two 3-methyl-2-thienyl groups of tiagabine interacts with S302 on TM6b, whereas S396, C399 and T400 located on TM8 interact with the tiagabine backbone, as well as the piperidine ring of the nipecotic acid moiety (Fig. 2b,d). Finally, Y60, L303 and L306 interact with the bis(3-methyl-2-thienyl) tail of tiagabine through aromatic interactions by π–π stacking and hydrophobic interactions, representing key residues in the bottom of the tiagabine-binding pocket.
Our molecular dynamics simulations further support this binding pose and polar interaction network of tiagabine, suggesting that the hydrogen bonds of G65 (backbone N), and Y140 (side chain -OH), with the nipecotic acid moiety are more stable than the interactions with G63 and L64 (backbone N) (Fig. 3d and Extended Data Fig. 7). While maintaining key interactions with the nipecotic acid moiety, we also observed that S295 (backbone O) can shift towards tiagabine to interact with the tertiary amine of its piperidine ring (Fig. 3d and Extended Data Fig. 7b). The interactions between Y60 and the 3-methyl-2-thienyl moiety of tiagabine sustain throughout nine out of ten 1-μs trajectories, despite fluctuations of the aromatic rings at various poses (Extended Data Fig. 7b). The interaction with Y60 is the tightest among the other residues (Y60, S302, L303, L306, C399 and T400) in the lower half of the binding pocket (Fig. 3d).
Although the resolution of our reconstruction is probably not sufficient to localize neither Na+ nor Cl− ions, the fact that the transporter adopts an inward-open conformation, and comparing the overall conformation of the binding pockets to homologous structures (Fig. 3b and Extended Data Fig. 5a–c), support our conclusion that both the sodium-binding and the chloride-binding pockets are probably empty.
Superimposing the structure of the substrate-bound NSS transporter LeuT in the inward-facing occluded conformation27 to our inward-open GAT1 structure highlights the rearrangement of the substrate-binding pocket upon transition to the inward-open state. The superposition alludes to a possible trajectory of the substrate before its release, where the interaction of the carboxyl moiety with the protein sustains the conformational transition. The release of sodium from site Na2 relieves its constraint on the backbone of TM1, and the additional release of sodium from Na1 enables the unwinding of the entire hinge region (Fig. 3b). This rearrangement results in the number of hydrogen bonds and ionic interactions in the substrate-binding pocket (S1) to reduce from 18 in Phe–Na+–LeuT to 7 in tiagabine–GAT1 (Fig. 3b). During the transition, tiagabine gains two previously unidentified interactions of the carboxyl group, replacing an ionic interaction with sodium in Na2 in LeuT, by interactions with the backbone of G63 and S295.
The chemical precursor to tiagabine—nipecotic acid—shows minimal selectivity towards GAT1 (refs. 38,45) whereas the residues with which this moiety interacts (L64, G65, Y140, F294, S295 and S396) are conserved among all three GABA reuptake transporters (Fig. 2a, b and Extended Data Fig. 4a). Conversely, tiagabine is highly selective towards GAT1, with a reported 10,000–20,000-fold higher affinity than GAT2 and GAT3 (ref. 45). This selectivity can be well explained by sequence alignment of the three transporters (Extended Data Fig. 4a). One of the most important interactions observed is the bis(3-methyl-2-thienyl) moiety of tiagabine with Y60. This residue, being part of the substrate-binding pocket, corresponds to E47 in GAT2 and E66 in GAT3. The second 3-methyl-2-thienyl ring interacts with S302 on TM6b, which corresponds to C296 of GAT2 and C316 of GAT3. We exploited these non-conserved residues to validate the tiagabine-binding pocket observed in our cryo-EM structure, as well as the specificity of tiagabine towards GAT1, by mutating residues of GAT1 to the corresponding GAT2 residues (Fig. 2c and Extended Data Fig. 4a,b). We performed [3H]-GABA uptake experiments with two wild-type transporter sequences (GAT1 and GAT2) and four designed GAT1 mutants within the observed tiagabine-binding pocket. The corresponding Y60E mutation has been shown to abolish GABA uptake in previous studies46, which we confirmed in our uptake experiments (Extended Data Fig. 1e). However, a quadruple mutant (Y60E/A61I/C399V/T400C) was able to partially restore uptake activity to about 10% of wild-type GAT1, accounting for lower overall expression (Extended Data Fig. 1e). Previous studies by Kanner46,47 have identified the point mutation Y60C, which retains surface expression and uptake levels (Extended Data Fig. 1e). This single mutation Y60C is sufficient to abolish the specificity of tiagabine towards GAT1, and shows a markedly increased IC50, highlighting the importance of this residue for tiagabine selectivity. In summary, our [3H]-GABA uptake assay results support our structurally observed binding pocket, as all combinations of mutations resulted in an increase of their respective IC50 value for tiagabine in an additive manner, approaching the IC50 value for GAT2 (Fig. 2c).
A two-step mechanism of inhibition
The majority of previously described small-molecule inhibitors targeting the NSS family act either competitively by binding at the substrate-binding site (S1), or non-competitively by binding to an allosteric binding pocket, which can also overlap partially with the substrate-binding site31. The latter can either stabilize the outward-open conformation, by binding to the S2 allosteric site on the extracellular side of the transporter29,30,48, or locking the transporter in the inward-open conformation, with two reported examples being the above-described SERT in complex with ibogaine in the absence of Na+ and the presence of K+30,49, and Cmpd1 targeting GlyT1 (ref. 50). Ibogaine was hypothesized to reach the allosteric binding pocket in SERT either from the extracellular space or the cytosol, and Cmpd1 was hypothesized to reach its binding site in GlyT1 by initially crossing the plasma membrane.
By deploying [3H]-GABA uptake saturation assays in HEK293S cells, we were able to confirm previous experiments showing the mixed-type inhibition of GAT1 by tiagabine. Simultaneous application of tiagabine with substrate resulted in a relatively constant maximal velocity of reaction at saturating concentration of substrate (Vmax), but led to a significant increase in Michaelis constant (Km), confirming the competitive inhibition of GAT1 (Fig. 4a). Conversely, the pre-incubation of GAT1-expressing cells with tiagabine, before the addition of substrate, resulted in both a significant decrease in Vmax and a lower apparent affinity, manifesting in an increase in Km, confirming non-competitive (mixed-type) inhibition of tiagabine on GAT1 (Fig. 4b). An inhibitor showing both competitive and non-competitive inhibition can only be explained by a two-step mechanism4. As outlined in Fig. 4c, we hypothesize that the initial step of tiagabine inhibition is binding to the substrate-binding site in the outward-open conformation (competitive inhibition), followed by a conformational transition, or independent binding of tiagabine to the inward-open conformation (non-competitive inhibition) and ultimately stalling GAT1. The tiagabine precursor nipecotic acid, a substrate of GAT1, is transported in a competitive manner3, whereas the co-application of nipecotic acid or GABA can competitively block the binding of tiagabine to GAT1, consistent with our GABA uptake assay results (Fig. 4a) and initial binding to the substrate-binding domain in the outward-open conformation. The second step of inhibition, observed in our structure, can either be explained by a two-step induced-fit mechanism, involving a conformational transition upon sodium-dependent binding of tiagabine to the substrate-binding site in the outward-open state, accompanied by ion release, or by tiagabine independently reaching from the cytosol (Fig. 4c). Given that tiagabine is a hydrophilic compound with a high solubility in water of 50–100 mM and fast bioavailability (15–30 min Tmax (time to maximum plasma concentration))51, combined with the saturable and reversible binding of tiagabine3, the scenario of tiagabine laterally reaching GAT1 through the plasma membrane is rather unlikely. The monophasic, saturable, sodium-dependent binding profile, the heterogeneous tissue distribution and the fact that there is no detectable uptake of tiagabine into synaptosomes3 speak against cytoplasmic uptake, and hence support our hypothesis of a two-step induced-fit mechanism4. Superimposing a homology model generated for the outward-open conformation with our experimentally determined inward-open conformation shows that the residues interacting with tiagabine would largely remain the same and follow the trajectory of the transporter throughout its transition (Extended Data Fig. 4c).
Fig. 4 |. Proposed two-step mode of tiagabine inhibition.

a, Results of [3H]-GABA saturation uptake assays using wild-type GAT1–eGFP-expressing HEK293S cells, in the absence (0 μM in blue) and the presence of tiagabine (0.125 μM in red, 0.25 μM in green and 0.5 μM in purple) without pre-incubation before uptake. Curves were calculated from n = 3 biologically independent experiments, each performed in triplicate measurements. Data points are averages of each independent triplicate experiment, with non-linear regression fits showing characteristic results for competitive inhibition. b, Results of [3H]-GABA saturation uptake assays using wild-type GAT1–eGFP-expressing HEK293S cells, in the absence (0 μM in blue) and the presence of tiagabine (0.125 μM in red, 0.25 μM in green and 0.5 μM in purple) with pre-incubation before uptake. Curves were calculated from n = 3 biologically independent experiments, each performed in triplicate measurements. Data points are averages of each independent triplicate experiment, with non-linear regression fits showing characteristic results for non-competitive (mixed-type) inhibition. c, Proposed mode of inhibition of GAT1 by tiagabine. The initial conformation is based on the AlphaFold55 prediction of the GAT1 outward-open conformation, with superimposed substrates Na+ (purple), Cl− (green) and tiagabine (salmon) based on the outward-open LeuT structure (PDB ID: 4HOD33). Initially, tiagabine and ions are bound to the substrate-binding site in the outward-open conformation, resulting in the conformational rearrangement of GAT1 to the inward-open conformation, accompanied by the release of ions, as tiagabine ultimately stalls the transporter in the inward-open conformation.
Discussion
Our structure of GAT1 in complex with tiagabine in the inward-open conformation reported here sheds light on a surprising mode of NSS transporter inhibition. The mixed-type inhibition of GAT1 by tiagabine suggests initial binding to the outward-open conformation, and we hypothesize that it could remain bound, sustaining the conformational transition of the transporter (Fig. 4), probably forming the basis of the non-competitive facet of the mixed-type inhibition of tiagabine. The larger steric bulk than the substrates GABA and nipecotic acid may preclude tiagabine from its release through the intracellular pathway and thus explain why tiagabine is not a substrate of GAT1 (ref. 3). Previous studies have presented analogous conclusions for the fine line between substrate and uptake inhibitors as a function of bulkiness (Extended Data Fig. 8) for the case of MDMA derivatives in NSS family members52. The two-step mechanism that we proposed above, in which tiagabine first competitively and then non-competitively inhibits GAT1, has thus far not been described for any NSS transporter on the structural level. A notable observation is the lack of available sub-micromolar competitive inhibitors of GAT1 (refs. 20,53), despite their prevalence for other transporters in the SLC6 family. Inhibitors that finally stabilize the inward-open conformation appear to be a more general modus operandi, through which NSS transporters are blocked from substrate uptake30,31,54. In summary, the structural information presented here, in the context of the pharmacodynamics of tiagabine on GAT1, have immediate implications on structure-based drug discovery for the design of novel neuromodulators. Finally, given the prevalence of identified LeuT-fold transporters and the moderate thermal stability of our studied GAT1 sample, we believe that our applied imaging and processing workflow will motivate and accelerate the structure determination of important membrane protein targets.
Methods
Data reporting
No statistical methods were used to predetermine sample size. The experiments were not randomized and the investigators were not blinded to allocation during experiments and outcome assessment.
GAT1 construct, expression and purification
The human full-length, wild-type GAT1 sequence (Uniprot: P30531) was codon optimized and synthesized (Twist Biosciences) for expression in the Spodoptera frugiperda Sf9 insect cell line (Expression Systems). The sequence was subcloned into a modified pFastBac1 vector, with a C-terminal tag containing a HRV-3C restriction site (LEVLFQ|GP), a flexible (GSGGG)2 linker, monomeric eGFP, TwinStrep tag, as well as a terminal His10-tag. The GAT1–eGFP construct used for structural studies was also subcloned into pcDNA3.1(−) for transient expression in HEK293S GnTI− cells (American Type Culture Collection) for functional uptake assays. All cells have been authenticated by the suppliers, and are regularly tested and shown to be free of mycoplasma (Hoechst DNA strain and direct culture methods used).
Recombinant expression of GAT1 was carried out in Sf9 insect cells using the Bac-to-Bac expression system (Gibco). Recombinant baculovirus of wild-type GAT1–eGFP or mutants was added at an multiplicity of infection (MOI) of 5 to the cell cultures, at a density of 2.5–3 × 10⁶ cells per ml in ESF921 medium (Expression Systems), containing 1% (v/v) production boost additive (Expression Systems). Cells were collected after 48 h shaking at 27 °C at 100 rpm, by centrifugation, washed in ice-cold PBS and stored at −80 °C until further use.
Cell pellets were thawed on ice and resuspended in a hypotonic buffer (20 mM HEPES pH 7.5, 10 mM MgCl2, 20 mM KCl, and an in-house prepared protease inhibitor cocktail of 2 mM AEBSF, 14 μM E-64, 1 μM leupeptin and 0.3 μM aprotinin). The cell suspension was dounced using a glass homogenizer, followed by centrifugation at 150,000g at 4 °C for 35 min. The pellets were further homogenized and centrifuged in a hypertonic buffer (hypotonic buffer supplemented with 1 M NaCl) for another three rounds. Washed membranes were finally homogenized in a hypotonic buffer with 30% glycerol and stored at −80 °C until further use.
Membranes were thawed in the presence of 2 mg ml−1 iodoacetamide and 100 μM tiagabine (Sigma-Aldrich), then diluted into a 2X solubilization buffer (100 mM HEPES pH 7.5, 400 mM NaCl, 2% (w/v) LMNG (Anatrace) and 0.2% (w/v) CHS (Anatrace)) for 3 h at 4 °C. Insoluble fractions were removed by centrifugation at 150,000g at 4 °C for 35 min. The supernatant was incubated with in-house anti-GFP nanobody (crosslinked to AminoLink Plus Coupling Resin at a concentration of 10 mg ml−1) resin for 3 h at 4 °C. The resin was then washed with 20 column volumes (CV) of wash buffer containing 50 mM HEPES pH 7.5, 200 mM NaCl, 0.001% (w/v) LMNG, 0.0001% (w/v) CHS, 1 μM tiagabine and 10% glycerol). Overnight elution was performed by incubating the resin with 1 CV wash buffer containing HRV-3C-protease cleavage enzyme with GST-tag and His-tag (ACRO Biosystems) at 4 °C. GST resin was used to remove 3C-protease. The eluted fractions were collected and subjected to preparative size-exclusion chromatography (SEC) on a Superose 6 Increase 10/300 GL column (Cytiva) in SEC buffer containing 50 mM HEPES pH 7.5, 200 mM NaCl, 0.00075% LMNG, 0.000075% CHS and 1 μM tiagabine.
Thermal stability assay
Thermal stability assays were performed following a previously established protocol56. A working solution of 7-diethylamino-3-(4′-maleimidylphenyl)-4-methyl coumarin (CPM; Invitrogen) was freshly made by diluting the stock (4 mg ml−1 in DMF) 100-fold with the respective assay buffer. Of purified GAT1, 2 μg was diluted into the assay buffer (50 mM HEPES pH 7.5, 200 mM NaCl, 0.001% (w/v) LMNG and 0.0001% (w/v) CHS) to a final volume of 80 μl in thin-walled 200-μl PCR tubes. Ten microlitres of 10 mM ligand/assay buffer and 10 μl CPM working solution were then added. The solution was incubated further for 15 min on ice in the dark. A RotorGene (Qiagen) real-time PCR instrument was used to determine melting temperatures by temperature ramping in the range of 25–95 °C at a 1 °C per minute rate, and measuring the fluorescence signal with filters: 350 nm (excitation) and 440 nm (emission). The Tm was calculated in GraphPad Prism 7, by fitting normalized data by non-linear regression with the equation: Y = 100/(1 + (XHillSlope)/(IC50HillSlope)) (option: ‘[inhibitor] versus normalized response − variable slope’), and raw data were plotted.
Cryo-EM sample preparation and data acquisition
GAT1 in LMNG/CHS micelles was immediately used after concentration of the monomeric SEC peak to 18 mg ml−1 using a 100-kDa cutoff concentrator (Amicon). Tiagabine was added at a final concentration of 1 mM to the concentrated GAT1 sample and incubated on ice for 1 h. Cryo-EM grids (Quantifoil Au 1.2/1.3 200 mesh) were glow-discharged (25 mA for 45 s) in an easiGlo instrument (Ted Pella), applied 3 μl of the concentrated sample, blotted for 3 s (95% relative humidity at 4 °C) and vitrified in liquid ethane on a Vitrobot Mark IV (Thermo Fisher). Micrographs were collected using aberration-free image shift (AFIS) data collections scheme (two images per hole) using the EPU data acquisition software (version 2.0) on a Titan Krios (Thermo Fisher) at 300 keV, equipped with a K3 direct-electron detector with post-BioQuantum GIF energy filter, operated with a 20 eV slit size (Gatan). Images were collected with a total exposure time of 2.7 s, total dose of 60 e−/Å2, and a defocus range of −1 μm to −2.4 μm.
Single-particle cryo-EM image processing
Data processing was performed using the software package cryoSPARC57 (v3.2.0; Structura Biotechnology) (Extended Data Fig. 2). An initial 39,572 micrographs were processed through patch motion correction (default parameters) and patch CTF estimation (default parameters). An initial round of processing was carried out on a subset of the data (approximately 5,000 micrographs), using the reference-free Blob picker (120 Å particle diameter) routine, followed by 2D classification until 2D classes with clearly distinguishable TMD densities were obtained. Ab initio reconstruction of these 2D classes was performed to obtain a 3D model used for template-based picking and 3D reconstructions of the full dataset (Extended Data Fig. 2). Particle picking on the entire dataset was followed by extraction of 7,378,346 particles with a box size of 256 pixels (bin = 4). Two rounds of 2D classification were performed to obtain homogenous 2D classes with distinguishable TMD densities (Fig. 1a and Extended Data Fig. 2a), with a final of 3,210,676 particles, after which particles were re-extracted (bin = 2). A total of 12 rounds of heterogeneous refinement were performed, including a re-extraction step with bin = 1, using two 3D references, one with clearly distinguishable TMDs (that is, ‘good’), as well as an empty micelle (that is, ‘junk’) class, in which particles assigned to the good class were successively selected for the subsequent round of heterogeneous refinement, to further clean up the dataset, yielding a final dataset of 135,297 particles. Ab initio reconstructions (number of classes = 1–2) were carried out after each re-extraction step and were incorporated into subsequent analysis steps. Non-uniform refinement58 (low-pass filter = 9 Å) yielded an initial reconstruction at a resolution of 3.93 Å, which was finally subjected to local refinement with a manually created mask around the protein (masking the micelle), and the fulcrum being the centre of mass, which yielded a final reconstruction at 3.82 Å resolution (Extended Data Fig. 2).
Model building and refinement
An initial homology model was generated using the SwissModel59 server, using GlyT1 in the inward-open conformation as template (PDB ID: 6ZBV)31. Disordered N and C termini were truncated in the PDB model. The model was then fitted into the density map in UCSF Chimera (version 1.15)60, and manually adjusted to fit the density map in Coot (version 0.9.2)61. Subsequently, the generated model was automatically refined in phenix.real_space_refine62,63 (version 1.19.2) and manually adjusted in Coot (version 0.9.2) for several iterations. The final geometry validation statistics including clashscore and Ramachandran analysis were calculated by MolProbity64. The final refinement statistics were generated using the ‘comprehensive validation (cryo-EM)’ function in Phenix (version 1.19.2)63.
Molecular dynamics simulations
All molecular dynamics simulations were conducted with Gromacs (v.2020.3) simulation engine65 under Charmm36 force-field parameters and topologies66,67. The tiagabine-bound GAT1 structure was embedded in a lipid bilayer made of 1,2-dipalmitoyl-sn-glycero-3-p hosphatidylcholine (DPPC), 1,2-dioleoyl-sn-glycero-3-p hosphatidylcholine (DOPC) and cholesterol (CHL1) with ratio DPPC:DOPC:CHL1 0.55:0.15:0.30, referencing simulations performed on a G-protein-coupled receptor68. Tiagabine is charged as a zwitterion. The molecular content of the system is listed in Extended Data Table 2. Initial membrane coordinates were assigned by the PPM server via the Charmm-GUI interface69. Ten independent trajectories were simulated starting from the assembled system. After initial energy minimizations, all systems were equilibrated with default parameters (Supplementary Table 1) supplied by the Charmm-GUI, followed by additional equilibrations for 20 ns in total and production runs of up to 1,000 ns under NPT ensemble with Parrinello–Rahman barostat at 1 atm and V-rescale thermostat at 303.15 K. The simulations were performed on a GPU cluster at the Center for Advanced Research Computing (CARC) of the University of Southern California. Molecular dynamics trajectories were analysed using the MDTraj package70.
Figures and graphical illustration
Pymol v.2.4.1 (ref. 71) (Schrödinger), UCSF Chimera 1.15 (ref. 60), UCSF ChimeraX v1.2.5 (ref. 72), ChemDraw JS 19.0.0 (PerkinElmer), GraphPad Prism 7.0 and Adobe Illustrator 2021 25.4.1 were used to create figures. All reported root mean square deviation values were calculated using the align command in Pymol. The reported conformation and relative orientation of TM1a was based on the positions of Cɑ atoms of the following conserved residues: 52.75° in GlyT1 (W103, Y116 and V315), 74.95° in SERT (W82, Y95 and V281) and 88.41° in GAT1 (W47, Y60 and V240), resulting in GlyT1 18 Å (W103 and V315), SERT 19.5 Å (W82 and V281) and GAT1 20.1 Å (W47 and V240). The relative orientation between the substrates (Fig. 3b) was judged by superimposing the three structures and measuring the angle between the Cɑ atom of G65 of GAT1 and the carbon atom adjacent to the carboxyl group, corresponding to the Cɑ of the substrates leucine and phenylalanine and C15 of tiagabine. The AlphaFold55 models for Fig. 4c and Extended Data Fig. 4b,c were downloaded from the AlphaFold Protein Structure Database (accession codes: AF-P30531-F1 (GAT1) and AF-Q9NSD5-F1 (GAT2)).
[3H]-GABA uptake and kinetic assays
[3H]-GABA uptake and kinetic assays were performed as described elsewhere3,16. To determine the respective IC50 value of tiagabine, we transiently expressed wild-type and mutant constructs of GAT1–eGFP and GAT2–eGFP in a pcDNA3.1(−) vector in HEK293S GnTI− cells (American Type Culture Collection) for 48 h at 37 °C with 5% CO2 and shaking at 125 rpm in FreeStyle 293 Expression Medium (Gibco) supplemented with 1% heat-inactivated FBS (HyClone). Mutations were created using a site-directed mutagenesis approach (QuikChange II site-directed mutagenesis kit, Agilent), and all used plasmids were confirmed by sequencing (Genewiz). A standard transfection protocol using the 293fectin Transfection Kit (Gibco) was followed. Forty-eight hours post-transfection, approximately 50,000 cells per well were plated in sterile 96-well, flat bottom, poly-d-lysine-coated tissue culture plates (Corning). Uptake and kinetic assays were performed 24 h after plating. Cells were washed twice with uptake buffer (10 mM HEPES pH 7.5, 150 mM NaCl, 1 mM MgSO4, 5 mM KCl and 10 mM d-glucose), followed by pre-incubation for 10 min at room temperature with tiagabine in a 1:10 dilution series ranging from 1 mM to 0.1 nM for wild-type GAT1, C399V/T400C and S302C/C399V/T400C, and 10 mM to 1 nM range for Y60C, Y60E/A61I/C399V/T400C and wild-type GAT2, followed by incubation with a mixture of 25 μM ‘cold’ GABA and 60 nM [3H]-GABA (PerkinElmer) for an additional 30 min. The reaction was stopped by washing each well three times with uptake buffer, cells were lysed with uptake buffer supplemented with 1% SDS, 150 μl of scintillating agent (Optiphase Supermix, PerkinElmer) was added to the lysate and the mixture was transferred into IsoPlate-96 plates (PerkinElmer, white frame, clear well, polystyrene). Counts were read on a Microbeta2 plate reader (PerkinElmer) for 1 min per well. Each assay was carried out in three biologically independent experiments on separate days, and every data point was performed and measured in triplicates. The IC50 was calculated in GraphPad Prism 7 by fitting a merge of individually normalized datasets of all three experiments to account for fluctuations in transfection efficiency, followed by non-linear regression using the equation: Y = 100/(1 + (XHillSlope)/(IC50HillSlope)).
Kinetic uptake studies were carried out in a similar way. HEK293S GnTI− cells, transiently expressing wild-type GAT1–eGFP, were incubated with a series of a 1:1,000 ratio of [3H]-GABA (PerkinElmer) and ‘cold’ GABA concentration of 100 μM, 50 μM, 25 μM, 12.5 μM, 3.125 μM, 1.56 μM and 0.78 μM, for a total of 8 min. The inhibitor tiagabine was added, with and without pre-incubation of 10 min at room temperature at 0, 0.125, 0.250 and 0.500 μM to determine competitive and non-competitive inhibition. Scintillation counts were read on a Microbeta2 plate reader for 1 min per well. Every uptake experiment was performed in three biologically independent experiments on different days, whereas each data point was carried out in triplicates. Kinetic parameters (Vmax and Km) were calculated by averaging triplicate data of each data point, followed by merging data from all experiments for fitting the uptake velocities and applied substrate concentrations to the following equation Y = Vmax × X/(Km + X) (option: ‘Michaelis Menten’) using a non-linear regression analysis employing GraphPad Prism 7.
Scintillation proximity assay
Scintillation proximity assays were carried out in 96-well plates (OptiPlate, PerkinElmer) using Cu2+ His-tag yttrium-silicate (YSi) scintillation proximity assay beads (PerkinElmer) and [3H]-GABA (40 Ci mmol−1). Reactions were carried out in assay buffer (20 mM HEPES pH 7.5, 150 mM NaCl and 0.001% LMNG), by addition of solubilized GAT1-expressing Sf9 cell membranes, using 0.3 mg of scintillation proximity assay beads per well. For tiagabine competition, the samples were incubated with a 1:10 dilution series with final concentrations ranging from 1 mM to 0.01 nM, followed by the addition of [3H]-GABA at a final concentration of 100 nM. The mixture was incubated for 1 h at 4 °C before reading counts on a Microbeta2 plate reader (PerkinElmer). The IC50 was calculated in GraphPad Prism 7, by fitting normalized data by non-linear regression with the equation: Y = 100/(1 + (XHillSlope)/(IC50HillSlope)).
Reporting summary
Further information on research design is available in the Nature Research Reporting Summary linked to this paper.
Extended Data
Extended Data Fig. 1 |. Protein purification of GAT1 for cryo-EM analysis and [3H]-GABA uptake assay results for quantification of relative uptake rates.

a, Size-exclusion chromatography on a Superose 6 Increase (10/300) column shows a monodisperse peak at a size of approximately 100 kDa, accommodating the protein, as well as the LMNG/CHS detergent micelle.b, SDS-PAGE prior to cryo-EM sample preparation, confirms the high purity of the final sample (> 95%). For gel source data, see Supplementary Fig. 4. c, Thermal stability assay as described in the methods section. Changing the detergent from DDM to LMNG resulted in an increase of Tm by 12 °C. AU, arbitrary units. d, Scintillation proximity assay of GAT1 purified from Sf9 cells, showing specific competition of [3H]-GABA with tiagabine, presented as all data points, overlaid with a nonlinear regression fit, resulting in an IC50 of 290 ± 60 nM. The experiment was performed three times independently with similar results. e, Absolute counts of a representative [3H]-GABA uptake experiment from constructs used for probing tiagabine binding pocket. (Bottom) Comparison of expression levels, based on relative fluorescence of whole cells compared to wildtype GAT1, and maximum uptake values, relative to wildtype GAT1 in above experiment.
Extended Data Fig. 2 |. Cryo-EM reconstruction of full-length, wild-type human GAT1 in complex with tiagabine.

a, Workflow of cryo-EM processing of GAT1 in complex with tiagabine in the inward-open conformation with representative micrograph, picking templates and 2D classes. Data processing was entirely performed in cryoSPARC57. After motion correction, CTF estimation and particle picking, the dataset was sorted using 2D classification, followed by 3D ab initio reconstruction and heterogenous refinement for further clean-up of the particle stack. Finally, 3D reconstructions were performed using non-uniform refinement58 and local refinement, which yielded a final map of 3.8 Å resolution. b, Data quality of the final reconstruction, illustrated as a local resolution map ranging from 3 – 4.8 Å, gold-standard fourier shell correlation plot (masked and unmasked) and angular sampling of the final reconstruction.
Extended Data Fig. 3 |. Atomic model and cryo-EM Coulomb potential map of the human GAT1 complex with tiagabine.

The overall structure of the GAT1 (cyan) complex with bound tiagabine (salmon) (right) and magnified views of individual transmembrane helices (left) are shown in the cryo-EM map (grey mesh) at 5 sigma.
Extended Data Fig. 4 |. Sequence alignment and substrate binding pocket.

a, Sequence alignment of GABA transporters: human GAT1, GAT2, GAT3 (Uniprot: P30531, Q9NSD5, P48066). Green boxes highlight conserved residues observed in the substrate binding pocket and red boxes highlight non-conserved residues. b, AlphaFold55 prediction of GAT1 and GAT2 in the outward-open conformation with tiagabine superimposed with substrate from LeuT (PDB ID: 4HOD33), highlighting non-conserved residues between the two subtypes in the substrate-binding pocket. c, AlphaFold55 prediction of GAT1 outward-open conformation, superimposed with experimentally determined inward-open cryo-EM structure, shows the small relative transition that tiagabine bound to GAT1 would have to undergo for the proposed induced-fit mechanism.
Extended Data Fig. 5 |. Structural comparison of GAT1 with other NSS transporter structures.

a, Superposition of outward-open dDAT26 (PDB ID: 4XP1, yellow, residues F53, Y142, S320 in stick representation) with outward-open SERT30 (PDB ID: 6DZY, red, residues F105, Y121, S336 in stick representation). b, Superposition of outward-open dDAT26 (PDB ID: 4XP1, yellow, residues F53, Y142, S320 in stick representation) with inward-open GAT1 (this study, residues F70, Y86, S295 in stick representation). c, Superposition of inward-open GAT1 structure (this study, residues F70, Y86, S295 in stick representation) with inward-open GlyT131 (PDB ID: 6ZBV, blue, residues F126, Y142, S371 in stick representation). a–c are shown to confirm the conformational state (inward-open) of GAT1, together with the conformation of the Na+ and Cl− coordinating residues suggesting likely empty ion binding pockets. d–f, Superimposed structures of inward-open conformation SERT, GlyT1 and GAT1, highlighting differences in the relative orientation of TM1a. g,h, Superposition to GlyT1 and SERT, showing differences in extracellular gate. GlyT1 shows a very similar network of interactions to GAT1, while the inward-open SERT structure shows markedly larger distances between the corresponding residues. Numbers correspond to the shortest atomic distances, between the respective residues, in Å.
Extended Data Fig. 6 |. Structural comparison of GAT1 (green) with GlyT1 (blue) and SERT (pink) inward-open structures.

a, Superposition of overview models between three structures. b, Focus on the intracellular gate, showing differences in TM6b, TM7, TM1a and TM5. c–e, Minor differences between GAT1, GlyT1 and SERT in TM12, TM9, TM10 and TM8 with respective residues highlighted in stick representation: G457 highlights the unique residue in GAT1, potentially leading to additional flexibility of TM10. The interacting residues between ibogaine and SERT TM8 A441-G442-L443 show a subtle helix break, which is unique among the compared sequences and structures.
Extended Data Fig. 7 |. Summary of MD simulations.

a, Time series showing the shortest observed distance among heavy atoms of the respective GAT1 residues to the 3-methyl-2-thienyl moiety of tiagabine. Numbers in parentheses are the mean and standard deviation of the respective distances in MD simulations. See Supplementary Figs. 1 and 2 for time series of individual trajectories and Supplementary Fig. 3 for histograms of these distances. b, Snapshots of tiagabine binding site for one of the trajectories, taken every 200 ns and spanning 1000 ns. Tiagabine from the cryo-EM structure is colored dark green, MD simulations light green, GAT1 cryo-EM structure in dark pink, GAT1 MD simulations in light pink. c, Root mean square fluctuations (r.m.s.f.) per residue in GAT1. Solid line shows the average of 10 independent trajectories at each residue position; shading refers to 95% confidence interval (n = 10). d, Root mean square deviation (r.m.s.d.) of GAT1 Cα in the 1 μs simulations. The r.m.s.d. are calculated with the protein in trajectories superimposed on the protein in the first frame. e, Root mean square deviation (r.m.s.d.) of tiagabine heavy atoms in the 1 μs simulations. The r.m.s.d. are calculated with the protein in trajectories superimposed on the protein in the first frame.
Extended Data Fig. 8 |. Structural comparison of known GAT1 substrates and inhibitors.

Blue circle highlights nipecotic acid moiety, sand colored circle highlights bis(3-methyl-2-thienyl) tail.
Extended Data Table 1 |.
Cryo-EM data collection, processing and refinement statistics
| GAT-1 (EMDB-25170) (PDB 7SK2) |
|
|---|---|
| Data collection and processing | |
| Magnification | 105,000 |
| Voltage (kV) | 300 |
| Electron exposure (e−/Ǻ2) | 40.5 |
| Defocus range (μm) | −1.0 – −2.4 |
| Pixel size (Ǻ) | 0.813 |
| Symmetry imposed | Cl |
| Initial particle images (no.) | 7,378,346 |
| Final particle images (no.) | 135,297 |
| Map resolution (Ǻ) | 3.82 |
| FSC threshold | 0.143 |
| Map resolution range (Ǻ) | 3 – 4.8 |
| Refinement | |
| Initial model used (PDB code) | Homology model based on 6ZBV |
| Model resolution (Ǻ) | 4.1 |
| FSC threshold | 0.5 |
| Model resolution range (Ǻ) | 19.7 – 3.7 |
| Map sharpening B factor (Ǻ2) | 167.3 |
| Model composition | |
| Non-hydrogen atoms | 4,177 |
| Protein residues | 4,151 |
| Ligands | 26 |
| B factors (Ǻ2) | |
| Protein | 112.9 |
| Ligand | 122.3 |
| R.m.s. deviations | |
| Bond lengths (Ǻ) | 0.005 |
| Bond angles (°) | 1.05 |
| Validation | |
| MolProbity score | 1.86 |
| Clashscore | 8.52 |
| Poor rotamers (%) | 0 |
| Ramachandran plot | |
| Favored (%) | 93.96 |
| Allowed (%) | 6.04 |
| Disallowed (%) | 0 |
Extended Data Table 2 |.
Assembled system for Molecular Dynamics simulation
| Molecule | Number of Molecules |
|---|---|
| GAT-1 | 1 |
| Tiagabine | 1 |
| CHL1 | 61 |
| DPPC | 111 |
| DOPC | 31 |
| Sodium | 38 |
| Chloride | 44 |
| Water | 14503 |
Supplementary Material
Acknowledgements
We thank K. Villers and C. Hanson for technical support for recombinant protein expression in mammalian and Sf9 cells; C. Cato and R. Oania for general laboratory support; S. Khan for helpful discussions; T. Osinski, J. Chu and B. D. Kim at the USC Center for Advanced Research Computing (CARC) for support with computing resources; and D. J. Slotboom (University of Groningen) and K. Pande (LBNL) for comments and suggestions on the manuscript. This research was supported by a US National Institutes of Health grant R35 GM127086 (to V.C.). We acknowledge the Center of Excellence for Nano Imaging (CNI) at the University of Southern California for microscope time.
Footnotes
Online content
Any methods, additional references, Nature Research reporting summaries, source data, extended data, supplementary information, acknowledgements, peer review information; details of author contributions and competing interests; and statements of data and code availability are available at https://doi.org/10.1038/s41586-022-04814-x.
Competing interests The authors declare no competing interests.
Additional information
Supplementary information The online version contains supplementary material available at https://doi.org/10.1038/s41586-022-04814-x.
Peer review information Nature thanks Azadeh Shahsavar, Harald Sitte and the other, anonymous, reviewer(s) for their contribution to the peer review of this work. Peer reviewer reports are available.
Data availability
The final cryo-EM map has been deposited in the Electron Microscopy Data Bank under accession code: EMD-25170. Corresponding atomic coordinates have been deposited in the PDB under accession code: 7SK2. Source data are provided with this paper.
References
- 1.Guastella J et al. Cloning and expression of a rat brain GABA transporter. Science 249, 1303–1306 (1990). [DOI] [PubMed] [Google Scholar]
- 2.Madsen KK, White HS & Schousboe A Neuronal and non-neuronal GABA transporters as targets for antiepileptic drugs. Pharmacol. Ther 125, 394–401 (2010). [DOI] [PubMed] [Google Scholar]
- 3.Braestrup C et al. (R)-N-[4,4-bis(3-methyl-2-thienyl)but-3-en-1-yl]nipecotic acid binds with high affinity to the brain gamma-aminobutyric acid uptake carrier. J. Neurochem 54, 639–647 (1990). [DOI] [PubMed] [Google Scholar]
- 4.Blat Y Non-competitive inhibition by active site binders. Chem. Biol. Drug Des 75, 535–540 (2010). [DOI] [PubMed] [Google Scholar]
- 5.Sieghart W Structure, pharmacology, and function of GABAA receptor rubtypes. GABA 54, 231–263 (2006). [DOI] [PubMed] [Google Scholar]
- 6.Bowery NG et al. International Union of Pharmacology. XXXIII. Mammalian γ-aminobutyric acidB receptors: structure and function. Pharmacol. Rev 54, 247–264 (2002). [DOI] [PubMed] [Google Scholar]
- 7.Fattorini G, Melone M & Conti F A reappraisal of GAT-1 localization in neocortex. Front. Cell. Neurosci 14, 9 (2020). [DOI] [PMC free article] [PubMed] [Google Scholar]
- 8.Roberts BM et al. GABA uptake transporters support dopamine release in dorsal striatum with maladaptive downregulation in a parkinsonism model. Nat. Commun 11, 4958 (2020). [DOI] [PMC free article] [PubMed] [Google Scholar]
- 9.Mermer F et al. Common molecular mechanisms of SLC6A1 variant-mediated neurodevelopmental disorders in astrocytes and neurons. Brain 144, 2499–2512 (2021). [DOI] [PMC free article] [PubMed] [Google Scholar]
- 10.Rosenthal M Tiagabine for the treatment of generalized anxiety disorder: a randomized, open-label, clinical trial with paroxetine as a positive control. J. Clin. Psychiatry 64, 1245–1249 (2003). [DOI] [PubMed] [Google Scholar]
- 11.Lyu S et al. Blockade of GABA transporter-1 and GABA transporter-3 in the lateral habenula improves depressive-like behaviors in a rat model of Parkinson’s disease. Neuropharmacology 181, 108369 (2020). [DOI] [PubMed] [Google Scholar]
- 12.Fuhrer TE et al. Impaired expression of GABA transporters in the human Alzheimer’s disease hippocampus, subiculum, entorhinal cortex and superior temporal gyrus. Neuroscience 351, 108–118 (2017). [DOI] [PubMed] [Google Scholar]
- 13.Paparrigopoulos T, Tzavellas E, Karaiskos D, Malitas P & Liappas I An open pilot study of tiagabine in alcohol dependence: tolerability and clinical effects. J. Psychopharmacol 24, 1375–1380 (2010). [DOI] [PubMed] [Google Scholar]
- 14.Schwartz TL et al. An open-label study of tiagabine as augmentation therapy for anxiety. Ann. Clin. Psychiatry 17, 167–172 (2005). [DOI] [PubMed] [Google Scholar]
- 15.Carpenter LL et al. Open-label tiagabine monotherapy for major depressive disorder with anxiety. J. Clin. Psychiatry 67, 66–71 (2006). [DOI] [PubMed] [Google Scholar]
- 16.Kragholm B et al. Discovery of a subtype selective inhibitor of the human betaine/GABA transporter 1 (BGT-1) with a non-competitive pharmacological profile. Biochem. Pharmacol 86, 521–528 (2013). [DOI] [PubMed] [Google Scholar]
- 17.Hauke TJ, Wein T, Höfner G & Wanner KT Novel allosteric ligands of γ-aminobutyric acid transporter 1 (GAT1) by MS based screening of pseudostatic hydrazone libraries. J. Med. Chem 61, 10310–10332 (2018). [DOI] [PubMed] [Google Scholar]
- 18.Jurik A et al. A binding mode hypothesis of tiagabine confirms liothyronine effect on γ-aminobutyric acid transporter 1 (GAT1). J. Med. Chem 58, 2149–2158 (2015). [DOI] [PMC free article] [PubMed] [Google Scholar]
- 19.Zafar S & Jabeen I Molecular dynamic simulations to probe stereoselectivity of tiagabine binding with human GAT1. Molecules 25, 4745 (2020). [DOI] [PMC free article] [PubMed] [Google Scholar]
- 20.Skovstrup S, David L, Taboureau O & Jørgensen FS A steered molecular dynamics study of binding and translocation processes in the GABA transporter. PLoS ONE 7, e39360 (2012). [DOI] [PMC free article] [PubMed] [Google Scholar]
- 21.Keynan S, Suh YJ, Kanner BI & Rudnick G Expression of a cloned gamma-aminobutyric acid transporter in mammalian cells. Biochemistry 31, 1974–1979 (1992). [DOI] [PubMed] [Google Scholar]
- 22.Cammack JN, Rakhilin SV & Schwartz EA A GABA transporter operates asymmetrically and with variable stoichiometry. Neuron 13, 949–960 (1994). [DOI] [PubMed] [Google Scholar]
- 23.Lester HA, Mager S, Quick MW & Corey JL Permeation properties of neurotransmitter transporters. Annu. Rev. Pharmacol. Toxicol 34, 219–249 (1994). [DOI] [PubMed] [Google Scholar]
- 24.Jardetzky O Simple allosteric model for membrane pumps. Nature 211, 969–970 (1966). [DOI] [PubMed] [Google Scholar]
- 25.Krishnamurthy H & Gouaux E X-ray structures of LeuT in substrate-free outward-open and apo inward-open states. Nature 481, 469–474 (2012). [DOI] [PMC free article] [PubMed] [Google Scholar]
- 26.Penmatsa A, Wang KH & Gouaux E X-ray structure of dopamine transporter elucidates antidepressant mechanism. Nature 503, 85–90 (2013). [DOI] [PMC free article] [PubMed] [Google Scholar]
- 27.Gotfryd K et al. X-ray structure of LeuT in an inward-facing occluded conformation reveals mechanism of substrate release. Nat. Commun 11, 1005 (2020). [DOI] [PMC free article] [PubMed] [Google Scholar]
- 28.Singh SK, Yamashita A & Gouaux E Antidepressant binding site in a bacterial homologue of neurotransmitter transporters. Nature 448, 952–956 (2007). [DOI] [PubMed] [Google Scholar]
- 29.Coleman JA, Green EM & Gouaux E X-ray structures and mechanism of the human serotonin transporter. Nature 532, 334–339 (2016). [DOI] [PMC free article] [PubMed] [Google Scholar]
- 30.Coleman JA et al. Serotonin transporter–ibogaine complexes illuminate mechanisms of inhibition and transport. Nature 569, 141–145 (2019). [DOI] [PMC free article] [PubMed] [Google Scholar]
- 31.Shahsavar A et al. Structural insights into the inhibition of glycine reuptake. Nature 591, 677–681 (2021). [DOI] [PubMed] [Google Scholar]
- 32.Zhou Z et al. LeuT-desipramine structure reveals how antidepressants block neurotransmitter reuptake. Science 317, 1390–1393 (2007). [DOI] [PMC free article] [PubMed] [Google Scholar]
- 33.Kantcheva AK et al. Chloride binding site of neurotransmitter sodium symporters. Proc. Natl Acad. Sci. USA 110, 8489–8494 (2013). [DOI] [PMC free article] [PubMed] [Google Scholar]
- 34.Li F et al. Ion transport and regulation in a synaptic vesicle glutamate transporter. Science 368, 893–897 (2020). [DOI] [PMC free article] [PubMed] [Google Scholar]
- 35.Zimmermann I et al. Synthetic single domain antibodies for the conformational trapping of membrane proteins. eLife 7, e34317 (2018). [DOI] [PMC free article] [PubMed] [Google Scholar]
- 36.Tsutsumi N et al. Structure of human Frizzled5 by fiducial-assisted cryo-EM supports a heterodimeric mechanism of canonical Wnt signaling. eLife 9, e58464 (2020). [DOI] [PMC free article] [PubMed] [Google Scholar]
- 37.Wu X & Rapoport TA Cryo-EM structure determination of small proteins by nanobody-binding scaffolds (Legobodies). Proc. Natl Acad. Sci. USA 118, e2115001118 (2021). [DOI] [PMC free article] [PubMed] [Google Scholar]
- 38.Borden LA et al. Tiagabine, SK&F 89976-A, CI-966, and NNC-711 are selective for the cloned GABA transporter GAT-1. Eur. J. Pharmacol 269, 219–224 (1994). [DOI] [PubMed] [Google Scholar]
- 39.Suzdak PD, Foged C & Andersen KE Quantitative autoradiographic characterization of the binding of [3H]tiagabine (NNC 05–328) to the GABA uptake carrier. Brain Res 647, 231–241 (1994). [DOI] [PubMed] [Google Scholar]
- 40.Korkhov VM, Farhan H, Freissmuth M & Sitte HH Oligomerization of the γ-aminobutyric acid transporter-1 is driven by an interplay of polar and hydrophobic interactions in transmembrane helix II. J. Biol. Chem 279, 55728–55736 (2004). [DOI] [PubMed] [Google Scholar]
- 41.White HS et al. Correlation between anticonvulsant activity and inhibitory action on glial gamma-aminobutyric acid uptake of the highly selective mouse gamma-aminobutyric acid transporter 1 inhibitor 3-hydroxy-4-amino-4,5,6,7-tetrahydro-1,2-benzisoxazole and its N-alkylated analogs. J. Pharmacol. Exp. Ther 302, 636–644 (2002). [DOI] [PubMed] [Google Scholar]
- 42.Malinauskaite L et al. A mechanism for intracellular release of Na+ by neurotransmitter/sodium symporters. Nat. Struct. Mol. Biol 21, 1006–1012 (2014). [DOI] [PMC free article] [PubMed] [Google Scholar]
- 43.Ben-Yona A & Kanner BI Functional defects in the external and internal thin gates of the γ-aminobutyric acid (GABA) transporter GAT-1 can compensate each other. J. Biol. Chem 288, 4549–4556 (2013). [DOI] [PMC free article] [PubMed] [Google Scholar]
- 44.Bismuth Y, Kavanaugh MP & Kanner BI Tyrosine 140 of the gamma-aminobutyric acid transporter GAT-1 plays a critical role in neurotransmitter recognition. J. Biol. Chem 272, 16096–16102 (1997). [DOI] [PubMed] [Google Scholar]
- 45.Dhar TG et al. Design, synthesis and evaluation of substituted triarylnipecotic acid derivatives as GABA uptake inhibitors: identification of a ligand with moderate affinity and selectivity for the cloned human GABA transporter GAT-3. J. Med. Chem 37, 2334–2342 (1994). [DOI] [PubMed] [Google Scholar]
- 46.Kanner BI Transmembrane domain I of the gamma-aminobutyric acid transporter GAT-1 plays a crucial role in the transition between cation leak and transport modes. J. Biol. Chem 278, 3705–3712 (2003). [DOI] [PubMed] [Google Scholar]
- 47.Rudnick G Forty four years with Baruch Kanner and the chloride ion. Neurochem. Res 47, 3–8 (2022). [DOI] [PMC free article] [PubMed] [Google Scholar]
- 48.Wang KH, Penmatsa A & Gouaux E Neurotransmitter and psychostimulant recognition by the dopamine transporter. Nature 521, 322–327 (2015). [DOI] [PMC free article] [PubMed] [Google Scholar]
- 49.Bulling S et al. The mechanistic basis for noncompetitive ibogaine inhibition of serotonin and dopamine transporters. J. Biol. Chem 287, 18524–18534 (2012). [DOI] [PMC free article] [PubMed] [Google Scholar]
- 50.Alberati D et al. Glycine reuptake inhibitor RG1678: a pharmacologic characterization of an investigational agent for the treatment of schizophrenia. Neuropharmacology 62, 1152–1161 (2012). [DOI] [PubMed] [Google Scholar]
- 51.Wang X, Ratnaraj N & Patsalos PN The pharmacokinetic inter-relationship of tiagabine in blood, cerebrospinal fluid and brain extracellular fluid (frontal cortex and hippocampus). Seizure 13, 574–581 (2004). [DOI] [PubMed] [Google Scholar]
- 52.Sandtner W et al. Binding mode selection determines the action of ecstasy homologs at monoamine transporters. Mol. Pharmacol 89, 165–175 (2016). [DOI] [PMC free article] [PubMed] [Google Scholar]
- 53.Clausen RP et al. Structure–activity relationship and pharmacology of gamma-aminobutyric acid (GABA) transport inhibitors. Adv. Pharmacol 54, 265–284 (2006). [DOI] [PubMed] [Google Scholar]
- 54.Reith MEA et al. Novel C-1 substituted cocaine analogs unlike cocaine or benztropine. J. Pharmacol. Exp. Ther 343, 413–425 (2012). [DOI] [PMC free article] [PubMed] [Google Scholar]
- 55.Jumper J et al. Highly accurate protein structure prediction with AlphaFold. Nature 596, 583–589 (2021). [DOI] [PMC free article] [PubMed] [Google Scholar]
- 56.Alexandrov AI, Mileni M, Chien EYT, Hanson MA & Stevens RC Microscale fluorescent thermal stability assay for membrane proteins. Structure 16, 351–359 (2008). [DOI] [PubMed] [Google Scholar]
- 57.Punjani A, Rubinstein JL, Fleet DJ & Brubaker MA cryoSPARC: algorithms for rapid unsupervised cryo-EM structure determination. Nat. Methods 14, 290–296 (2017). [DOI] [PubMed] [Google Scholar]
- 58.Punjani A, Zhang H & Fleet DJ Non-uniform refinement: adaptive regularization improves single-particle cryo-EM reconstruction. Nat. Methods 17, 1214–1221 (2020). [DOI] [PubMed] [Google Scholar]
- 59.Bordoli L et al. Protein structure homology modeling using SWISS-MODEL workspace. Nat. Protoc 4, 1–13 (2009). [DOI] [PubMed] [Google Scholar]
- 60.Goddard TD, Huang CC & Ferrin TE Visualizing density maps with UCSF Chimera. J. Struct. Biol 157, 281–287 (2007). [DOI] [PubMed] [Google Scholar]
- 61.Emsley P & Cowtan K Coot: model-building tools for molecular graphics. Acta Crystallogr. D 60, 2126–2132 (2004). [DOI] [PubMed] [Google Scholar]
- 62.Adams PD et al. PHENIX: a comprehensive Python-based system for macromolecular structure solution. Acta Crystallogr. D 66, 213–221 (2010). [DOI] [PMC free article] [PubMed] [Google Scholar]
- 63.Afonine PV et al. Real-space refinement in PHENIX for cryo-EM and crystallography. Acta Crystallogr. D 74, 531–544 (2018). [DOI] [PMC free article] [PubMed] [Google Scholar]
- 64.Chen VB et al. MolProbity: all-atom structure validation for macromolecular crystallography. Acta Crystallogr. D 66, 12–21 (2010). [DOI] [PMC free article] [PubMed] [Google Scholar]
- 65.Abraham MJ et al. GROMACS: high performance molecular simulations through multi-level parallelism from laptops to supercomputers. SoftwareX 1–2, 19–25 (2015). [Google Scholar]
- 66.Jo S, Kim T, Iyer VG & Im W CHARMM-GUI: a web-based graphical user interface for CHARMM. J. Comput. Chem 29, 1859–1865 (2008). [DOI] [PubMed] [Google Scholar]
- 67.Kim S et al. CHARMM-GUI ligand reader and modeler for CHARMM force field generation of small molecules. J. Comput. Chem 38, 1879–1886 (2017). [DOI] [PMC free article] [PubMed] [Google Scholar]
- 68.Leonard AN & Lyman E Activation of G-protein-coupled receptors is thermodynamically linked to lipid solvation. Biophys. J 120, 1777–1787 (2021). [DOI] [PMC free article] [PubMed] [Google Scholar]
- 69.Lomize MA, Pogozheva ID, Joo H, Mosberg HI & Lomize AL OPM database and PPM web server: resources for positioning of proteins in membranes. Nucleic Acids Res 40, D370–D376 (2012). [DOI] [PMC free article] [PubMed] [Google Scholar]
- 70.McGibbon RT et al. MDTraj: a modern open library for the analysis of molecular dynamics trajectories. Biophys. J 109, 1528–1532 (2015). [DOI] [PMC free article] [PubMed] [Google Scholar]
- 71.DeLano WL Pymol: an open-source molecular graphics tool. CCP4 http://legacy.ccp4.ac.uk/newsletters/newsletter40/11_pymol.html (2002).
- 72.Goddard TD et al. UCSF ChimeraX: meeting modern challenges in visualization and analysis. Protein Sci 27, 14–25 (2018). [DOI] [PMC free article] [PubMed] [Google Scholar]
Associated Data
This section collects any data citations, data availability statements, or supplementary materials included in this article.
Supplementary Materials
Data Availability Statement
The final cryo-EM map has been deposited in the Electron Microscopy Data Bank under accession code: EMD-25170. Corresponding atomic coordinates have been deposited in the PDB under accession code: 7SK2. Source data are provided with this paper.