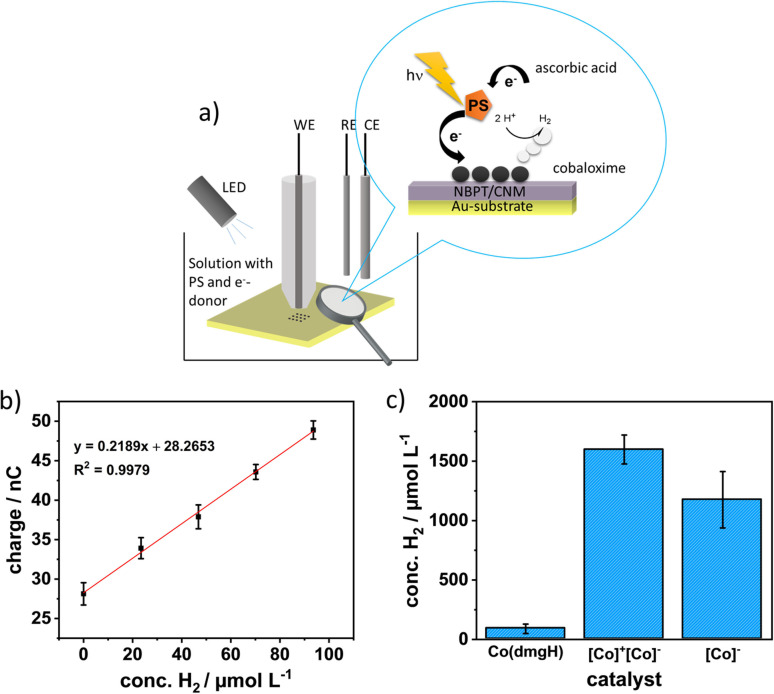
The authors would like to correct the determined H2 concentrations presented in Figure 5 and Figure S21, as we discovered in our further studies a systematic error. The corrected version of Figure 5 is given here.
Figure 5.
a) Schematic of the SECM illumination experiment; b) exemplary calibrations curve for a Pd‐microsensor; c) bar diagram of the H2 concentration yield after one hour illumination of three catalysts. Abbreviations of the x‐coordinate labelling is as follows: [Co(dmgH)2(py)Cl]=Co(dmgH), [Co(dmgH)2(py)2]+[Co(dmgBPh2)2Cl2]−=[Co]+[Co]−, and TBA+[Co(dmgBPh2)2Cl2]−=[Co]−. All experiments were performed under argon atmosphere. Error bars reflect three measurements for [Co]+[Co]− and Co(dmgH), and two measurements for [Co]−.
The corrected concentration values (shown in Figure 5c and reported on page 16901 of the original manuscript) are as follows: for the [Co(dmgH)2(py)2]+[Co(dmgBPh2)2Cl2]− catalyst arrays hydrogen concentrations of 1598.0±121.53 μmol L−1 (n=3), for the [Co(dmgH)2(py)Cl] catalyst arrays of 89.45±39.29 μmol L−1 (n=3) and for the TBA+[Co(dmgBPh2)2Cl2]− catalyst arrays of 1175.29±237.12 μmol L−1 (n=2) were determined.
For the study of the [Co(dmgH)2(py)2]+ at different values: The H2 concentration obtained at pH 5 is 115.24±15.32 mmol L−1 (n=3), now shown in the corrected Figure S21 (see the corrected Supporting Information). The discussion and conclusions are not affected, as the trend in the activities towards hydrogen evolution of the investigated cobaloxime complex salts remain the same.
The authors apologize for any inconvenience caused.


