Abstract
Mutations in ganglioside-induced differentiation-associated protein 1 (GDAP1) alter mitochondrial morphology and result in several subtypes of the inherited peripheral neuropathy Charcot-Marie-Tooth disease; however, the mechanism by which GDAP1 functions has remained elusive. GDAP1 contains primary sequence homology to the GST superfamily; however, the question of whether GDAP1 is an active GST has not been clearly resolved. Here, we present biochemical evidence, suggesting that GDAP1 has lost the ability to bind glutathione without a loss of substrate binding activity. We have revealed that the α-loop, located within the H-site motif is the primary determinant for substrate binding. Using structural data of GDAP1, we have found that critical residues and configurations in the G-site which canonically interact with glutathione are altered in GDAP1, rendering it incapable of binding glutathione. Last, we have found that the overexpression of GDAP1 in HeLa cells results in a mitochondrial phenotype which is distinct from oxidative stress-induced mitochondrial fragmentation. This phenotype is dependent on the presence of the transmembrane domain, as well as a unique hydrophobic domain that is not found in canonical GSTs. Together, we data point toward a non-enzymatic role for GDAP1, such as a sensor or receptor.
Keywords: ganglioside-induced differentiation-associated protein 1, mitochondria, oxidative stress, structural biology, X-ray crystallography
1 |. INTRODUCTION
First described in 1886, Charcot-Marie-Tooth (CMT) disease is the most commonly inherited peripheral neuropathy, affecting more than 3 million people worldwide.1 Clinically, neuronal conduction velocities allow CMT patients to be classified as having demyelinating (CMT1, CMT3, or CMT4), axonal (CMT2) or an intermediate phenotype.2 CMT is a genetically heterogeneous disorder with over 80 causative genes having been identified to date.3–7 Prominent among these are mutations in the gene encoding ganglioside-induced differentiation-associated protein 1 (GDAP1), which are associated with subtypes CMT2K,8–12 CMT4A,8,10,13,14 and intermediate forms.15
GDAP1 is highly expressed in peripheral neurons16–19 where it is localized to the outer mitochondrial membrane.20 It has been proposed to play a role in mitochondria fission,16,21,22 calcium homeostasis,23,24 and mitochondrial redox potential,17,25 although the mechanisms underlying GDAP1’s role in these processes remain unclear. GDAP1 is a novel member of the glutathione S-transferase (GST) superfamily of proteins; with putative glutathione-binding and substrate-binding domains (G- and H-sites, respectively) suggested based on the primary sequence homology.3,26,27 Canonical GSTs catalyze the conjugation of glutathione with the electrophilic center of hydrophobic co-substrates28–31 such as oxidized lipids and xenobiotics, facilitating their transport out of the cell.32–34 GDAP1 knockdown increases the sensitivity of cells to oxidative stress, consistent with GDAP1 playing the role of a canonical GST.25 However, reports of modest35 or no19,26 biochemical activity using purified GDAP1 have made it unclear whether or not GDAP1 plays an enzymatic cellular role.
To answer whether GDAP1 is a GST, we dissected the function of GDAP1 domains using structural, biochemical, and cell-based analyses. Using x-ray crystallography, we have determined the structure of the GST-like core of GDAP1. We find that while the G-site maintains the predicted thioredoxin fold, residues important for glutathione binding are not preserved. Using a series of truncations, we have identified the α-loop as critical for substrate binding. Unlike most active GSTs, we find GDAP1 to be monomeric in solution, as well as in the crystal. Interestingly, GDAP1 mutants found in CMT patients cluster within a portion of the canonical dimerization interface, suggesting that GDAP1 uses this surface to perform a critical function. Last, we demonstrate that GDAP1 regulates the mitochondrial morphology. GDAP1 overexpression causes a dramatic change in the mitochondrial network resulting in the formation of large distended mitochondrial structures near the nucleus. This phenotype was eliminated by deleting the transmembrane domain or the adjacent hydrophobic domain.
2 |. MATERIALS AND METHODS
2.1 |. Cloning, expression, and purification
Human GDAP1 coding sequences were PCR amplified and cloned into the pECYFP-C1 vector for transfection and expression in HeLa cells. Except ΔTM construct, all other constructs for mammalian expression contained the TM domain to ensure proper targeting to the outer mitochondrial membrane. Boundary regions for the domains are identical between human and mouse GDAP1.
For the biochemical and structural biology experiments described, sequences for mouse GDAP1 constructs encoding GDAP1ΔTM, GDAP1ΔHD1, GDAP1ΔNT, GDAP1ΔaL, and GDAP1-core were PCR amplified and cloned into the pKF3 plasmid for bacterial expression with an N-terminal His10-mRuby2 tag which can be removed by cleavage with TEV protease. Expression was performed in BL21(DE3)-RIPL Escherichia coli cells (Agilent) in LB at room temperature by induction with 0.2 mM IPTG for ~24 hours. Cells were then harvested, resuspended in 200 mM NaCl, 20 mM Tris pH8, 40 mM Imidazole pH8, 1 mM Tris(2-carboxyethyl) phosphine (TCEP), and 5% glycerol, and lysed by homogenization (Avestin C-3). Insoluble material was removed by centrifugation at 30 000 g and His10-mRuby2-GDAP1 fusion protein captured using nickel affinity chromatography followed by digestion with TEV protease to liberate GDAP1 protein from the His10-Ruby tag. A second round of nickel affinity chromatography was then performed to remove the tag and TEV. Finally, anion exchange chromatography and gel filtration were used to complete the purification. Protein quality was monitored throughout by SDS-PAGE and the final product was >99% pure.
Purification of selenomethionine-substituted protein used in experimental phasing was identical to the native protein except for the concentration of TCEP was increased to 2 mM throughout all buffers. The same E coli strain was used, however, protein expression was induced using the autoinduction method36 in the PASM media.
2.2 |. Crystallization and structure determination of the GDAP1-core
GDAP1-core was dialyzed into crystallization buffer containing 200 mM NaCl, 20 mM HEPES pH 8, 3% glycerol, 1 mM TCEP, 0.01% sodium azide and concentrated to 9.8 mg/mL prior to crystallization. Cubic crystals of GDAP1-core appear in approximately 3 days with the sitting drop vapor diffusion method using a well solution containing 0.9–1.1 M sodium citrate, 100 mM Tris pH 7, 200 mM NaCl, 10 mM TCEP. Crystals containing selenomethionine-substituted protein exhibited better diffraction properties and were used throughout the structure determination process. The crystals were cryoprotected by transitioning crystals into mother liquor supplemented to 1.6 M sodium citrate before flash freezing in liquid nitrogen. Diffraction data from selenomethionine-substituted crystals were collected at beamline 31-IDD at Argonne National Labs and processed and scaled via AutoPROC37 using I/σI >2.0 and CC(1/2) >0.3 as cutoffs. Crystals of GDAP1-core belong to space group I432 with a = b = c = 196.7 Å. Phases estimated from single-wavelength anomalous dispersion were used to calculate an initial map and an initial model was built into this density using COOT.38 This model was then improved through rounds of refinement in Phenix39 and model building in COOT using maps which were improved by B-sharpening. Positional and individual B-factor refinements were used during this process. Model quality was assessed using MolProbity within Phenix.
2.3 |. Differential scanning flourimetry
Differential scanning fluorimetry (DSF) assays were conducted using a Thermo-Fisher QuantStudio-3 Real-Time PCR machine in 96 well plate format. About 20 μL reactions was performed in at least triplicate at a final concentration of 0.1 mg/mL of protein with Sypro Orange dye at 5X final concentration. Fluorescence at 570 nm was then measured as the samples were subjected to a temperature gradient of 30–95°C and the melting temperature (TM) defined as the peak of the derivative curve. For binding assays with glutathione or ethacrynic acid, stocks of the compound were generated in either water, ethanol, or DMSO as needed, and added to the reaction to the reaction at 1% of the final volume. The control reactions contain the same mixture adding vehicle only. Unless specified, all measurements were made with at least three biological replicates.
2.4 |. Isothermal titration calorimetry
Isothermal titration calorimetry (ITC) was conducted using a MicroCal ITC200 (Malvern) at 25°C. Experiments were run with injections of 15 aliquots (2.5 μL each) of 2 mM GSH solution into the cell (volume 280 μL) containing GDAP1 constructs or GST Mu at 150 μM. GDAP1-binding experiments were performed in 200 mM NaCl, 0.1 M Potassium Phosphate pH 7.4, 1 mM TCEP, and 3% glycerol, while GST Mu experiments were performed in 100 mM NaCl, 50 mM sodium phosphate pH 6.8, and 1 mM TCEP. Initial integration and processing of data were conducted using Origin 7.0 and plotted using Prism.
2.5 |. Analytical size exclusion chromatography
Analytical sizing was carried out using an S75 10/100 GL size exclusion column, run using an AKTA Pure FPLC (GE Life Sciences) using 200 mM NaCl, 20 mM Na HEPES pH8, 1 mM TCEP, and 3% glycerol, as the running buffer. About 100 μL of GDAP1ΔTM and GDAP1-Core was loaded onto the column at 2.5 mg/mL and 2 mg/mL concentrations, respectively. About 100 μL of GST Mu was loaded on the column at 0.4 mg/mL. Bio-Rad Gel Filtration Standards were used to calibrate the column.
2.6 |. Cell imaging
Confocal microscopy was performed as described.40,41 HeLa cells were cultured in 10% fetal bovine serum (Sigma) supplemented DMEM (Lonza) at 37°C in a 5% CO2 humidified atmosphere. Cells used for imaging were grown on glass coverslips and transfection was performed using Lipofectamine 3000 per manufacturer’s instructions. The cells were washed in PBS (Sigma) 24 hours post-transfection and fixed in 4% paraformaldehyde in PBS for 5 minutes at room temperature, followed by permeabilization in 0.1% Triton X-100 at 4°C for 5 minutes. The samples were then blocked in PBS supplemented with 1% BSE and 10% goat serum, overnight, at 4°C. Samples were stained using primary antibodies for 1 hour at room temperature, washed in PBS and stained with secondary antibodies. Following a PBS wash, the coverslips were affixed to glass slides using mounting medium. TOM20 antibodies were purchased from Thermo Fisher and Alexa Fluor 594-tagged secondary antibodies were from Invitrogen.
2.7 |. Statistics
All data presented were the means and standard deviations. Two-way analysis of variance (ANOVA) was used for assessing the significance of melting temperature shifts between proteins and protein constructs (P < .001). One-way ANOVA followed by a Tukey HSD multiple comparison tests was used for assessing the statistical significance of protein constructs with different substrates applied to measure supershifts in temperature (P < .001). Statistical analysis of the mitochondrial shape/size distribution was performed using unpaired two-tailed t-test and Prism 8 software from GraphPad. The significance levels are illustrated in the Figures.
3 |. RESULTS
3.1 |. The GDAP1 G-site lacks glutathione binding activity in vitro
Primary sequence homology indicates that GDAP1 is a novel member of the GST family of proteins, as it possesses recognizable G-site and H-site domains. GDAP1 also contains several non-canonical sequences, including a large insertion called the α-loop,26,27 an N-terminal extension (NT), an additional hydrophobic domain (HD1) which is reported to play an autoinhibitory role,35 and a C-terminal transmembrane domain (TM) which facilitates localization to the outer mitochondrial membrane, ostensibly through a tail-anchoring mechanism20,27 (Figure 1A). To begin to address the molecular mechanism underlying GDAP1 function, we expressed and purified several recombinant fragments of mouse GDAP1. Mouse GDAP1 is 94% identical to human GDAP1, with most of the amino acid differences being within the first 20 amino acids. To facilitate solubility and purification, all of our in vitro constructs lack the C-terminal transmembrane domain. Our collection of constructs includes GDAP1ΔTM, (amino acids 1–322), GDAP1ΔHD1 (amino acids 1–292), GDAP1ΔNT (amino acids 20–322), GDAP1ΔNTΔHD1 (amino acids 20–292), GDAP1ΔaL (amino acids 1–144, 200–322 with a 3 residue GTG linker connecting these portions), and GDAP1-core (20–144, 200–292 with the same GTG linker) (Figure 1A). The GTG linker was chosen to provide a flexible linker that could span the gap between the beginning and the end of the α-loop. After purification, we subjected each protein to differential scanning fluorimetry,42 which uses the hydrophobic fluorescent dye Sypro Orange to measure the temperature of unfolding. We found that each GDAP1 fragment was stably folded and underwent a thermal transition. Comparing the different GDAP1 fragments, we find that the loss of the N-terminal fragment had no effect on thermal stability, while fragments containing the HD1 domain (GDAP1ΔTM, GDAP1ΔNT, and GDAP1ΔaL) unfolded at a significantly higher temperature (Figure 1B), indicating that the HD1 domain is stabilizing the protein. Some GSTs contain sequence after helix α7 that has been shown to fold back between the G- and H-sites, completing a more extensive binding pocket.43 Our observations are consistent with this type of interaction, but could also be explained by a role for the HD1 in protein dimerization or by completing a more extensive H-site, or by the types of autoinhibitory interactions previously proposed for this region.35
FIGURE 1.
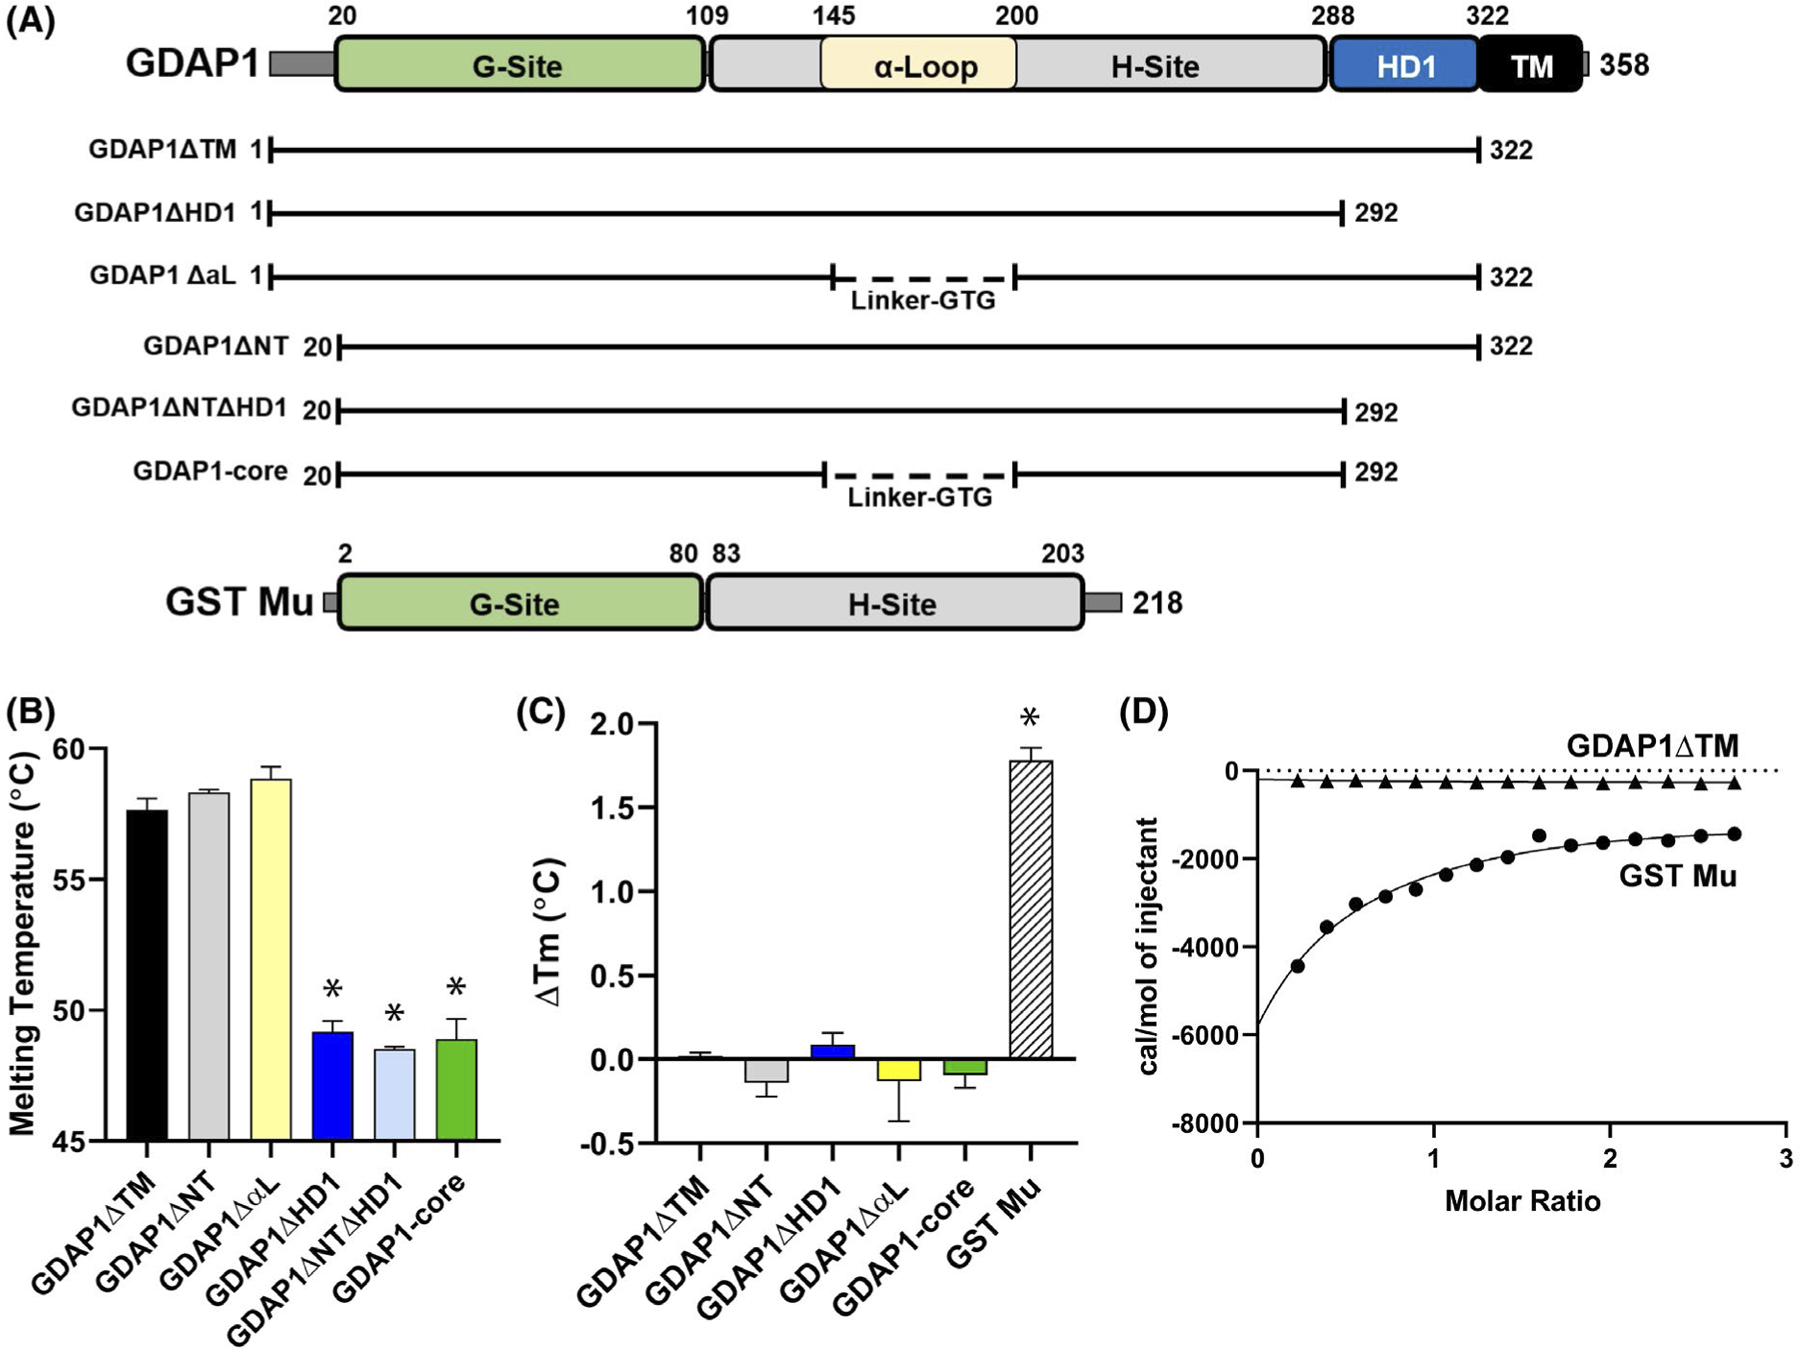
GDAP1 does not bind glutathione in vitro. A, Diagram of GDAP1 protein, its truncated constructs, and GST Mu taken from Schistosoma japonicum44 with showing its functional domains: G-Site, Glutathione binding domain; α-Loop, insertion of unknown function; H-site, substrate-binding domain; HD1, Hydrophobic Domain; TM, Transmembrane Domain. B, Melting temperatures of indicated GDAP1 constructs using differential scanning fluorimetry. The data are the average of three independent experiments with error bars indicating standard deviation. The statistical significance using a one-way ANOVA is shown (*) for P < .01. C, Differential scanning fluorimetry data comparing the melting temperatures in the presence and absence of 2 mM GSH with all GDAP1 constructs vs GST Mu and were statistically analyzed using a two-way ANOVA comparing GDAP1 constructs, with and without 2 mM GSH, with each other and then each construct against GST Mu. Annotations of statistical significance on the graph represent each construct vs GST Mu as the constructs showed no statistical significance from each other. D, Isothermal calorimetry comparing 150μM of GDAP1ΔTM and GST Mu when subjected to injections of 2 mM GSH, as described in Materials and Methods
Prior evidence has questioned GDAP1’s interaction with glutathione.26 We, therefore, sought to address whether GDAP1 harbors glutathione binding activity using differential scanning fluorimetry. We found that while a control Mu class GST from Schistosoma japonicum44 was fully competent in glutathione binding, none of our GDAP1 fragments demonstrated measureable stabilization upon the addition of glutathione (Figure 1C). To confirm that this result was not an artifact of the fluorimetry, we also tested GDAP1ΔTM, and the GST Mu control for their ability to bind glutathione in solution using isothermal titration calorimetry. Once again, we saw robust binding of glutathione to the GST Mu control with an affinity of 515 μM which is consistent with the binding affinity measured for other Mu class GSTs,45–47 however, were not able to detect any interaction between GDAP1 and glutathione using this assay (Figure 1D). This is in agreement with the prior evidence that GDAP1 is not retained on glutathione resin.26 We conclude here that GDAP1 does not bind glutathione.
3.2 |. The GDAP1 H-site retains substrate binding activity
We next sought to address whether the hydrophobic substrate-binding domain (H-site) of GDAP1 retained activity. Since the biological substrate for GDAP1 is currently unknown, we used ethacrynic acid as a model compound to probe interactions within the H-site. Ethacrynic acid is a general competitive GST inhibitor whose interaction within the H-site has been well characterized both at the biochemical and structural levels.28,48–50 Using differential scanning fluorimetry we asked whether any of our GDAP1 fragments retained the ability to interact with ethacrynic acid. Here, we found that GDAP1ΔTM, GDAP1ΔHD1, GDAP1ΔNT, GDAP1ΔNT ΔHD1 all retained ethacrynic acid binding. In contrast, GDAP1ΔαL and GDAP1-core were not stabilized by the presence of either 2 mM or 0.5 mM ethacrynic acid (Figure 2A,B), suggesting that the alpha loop houses residues which are important for ethacrynic acid binding affinity. Interestingly, GDAP1ΔHD1 retains binding but the magnitude of the shift was reduced as compared to ΔTM or ΔNT, suggesting that the HD1 may play a secondary role in binding either by stabilizing the conformation of the α-loop or through a smaller direct interaction with ethacrynic acid. To address whether substrate binding, measured using ethacrynic acid, was affected by the presence of glutathione, we repeated differential scanning fluorimetry adding both glutathione and ethacrynic acid. As expected, we found that GST Mu had an enhanced shift in the presence of both glutathione and EA consistent with it binding both molecules. In contrast, we found no additive effect using GDAP1ΔTM, or GDAP1-core, suggesting that there is no cooperativity or cross-talk between the G- and H-sites, at least with ethacrynic acid as a model substrate (Figure 2C). In addition to showing robust substrate binding of the H-site, these data validate our G-site binding assays. These data also illustrate the contrast between the effective substrate binding by the H-site and the lack of glutathione binding by the G-site. This situation is unique among GSTs, suggesting that GDAP1 function is dramatically different from the canonical GST conjugation activity.
FIGURE 2.
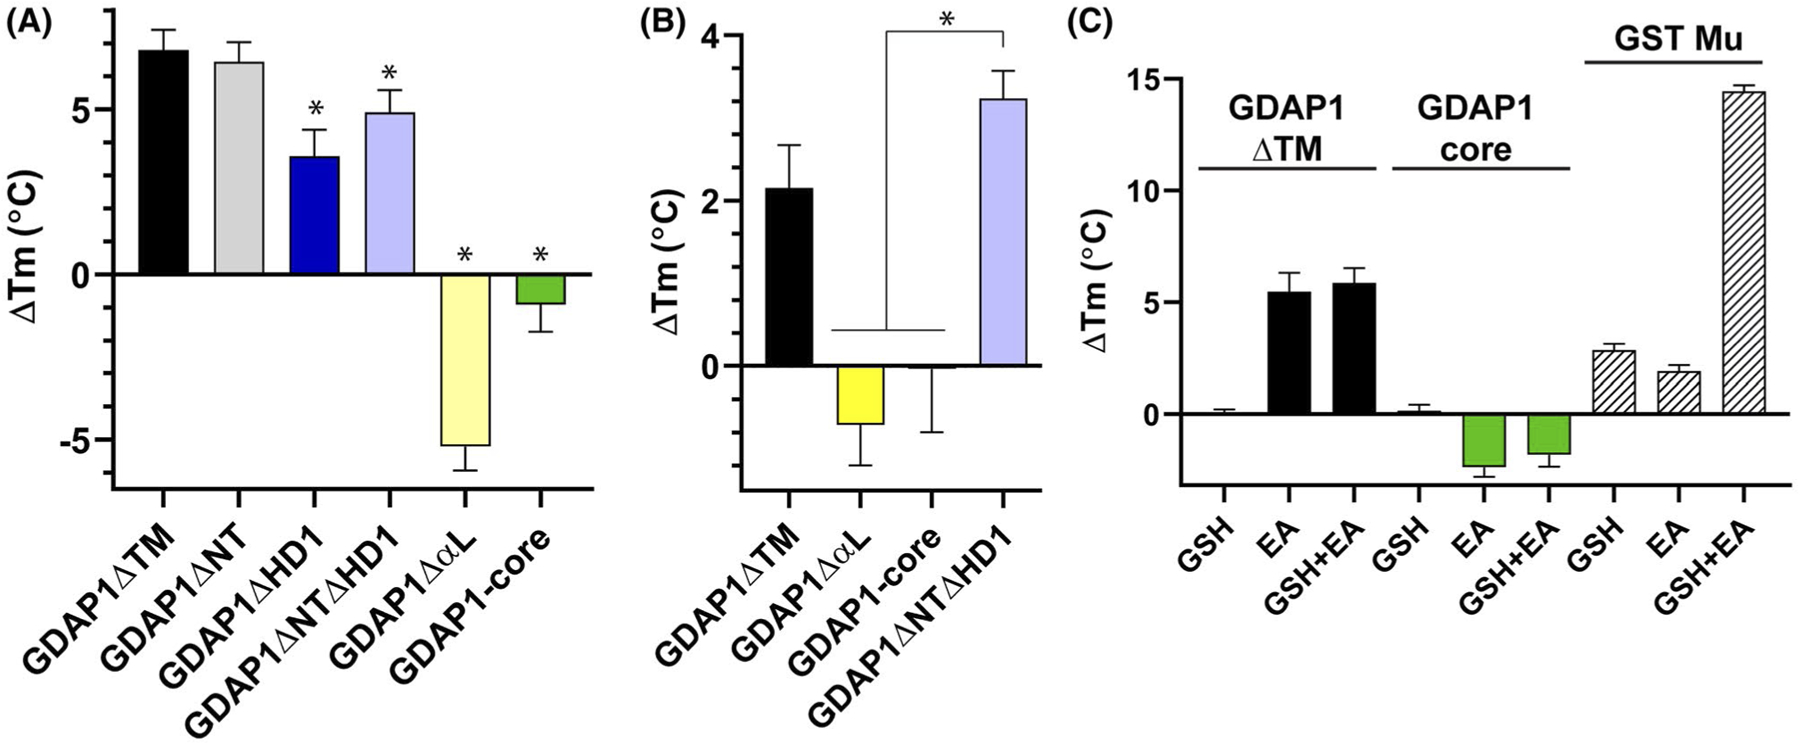
The α-Loop and HD1 are involved in substrate binding in vitro. A, Differential scanning fluorimetry of GDAP1 constructs comparing their melting temperatures with and without the addition of 2 mM Ethacrynic Acid, as described in Materials and Methods. Data are the average of 4 independent experiments with error bars representing standard deviation. Statistically significant (*) indicate a P < .01 using a two-way ANOVA. B, Differential scanning fluorimetry with 0.5 mM ethacrynic acid indicates that the presence of the α-loop plays an important role in substrate binding even at lower substrate concentrations. C, Differential scanning fluorimetry looking at the melting temperature shifts of GDAP1 constructs upon the addition of 1 mM GSH, 1 mM ethacrynic acid, or both 1 mM GSH and 1 mM Ethacrynic Acid. Data are representing four independent experiments with error bars showing standard deviation
3.3 |. The structure of the GDAP1 core reveals critical changes in the G-site that impact the glutathione binding interface
To understand the extent to which GDAP1 has diverged from canonical GSTs at the molecular level, we crystallized and determined the structure of GDAP1-core. Phases were determined using single-wavelength anomalous dispersion from a selenomethionine-substituted crystal and the final model was refined at 2.8 Å resolution to Rwork and Rfree values of 21.5 and 22.7%, respectively. (See Table 1 and the Experimental Methods section for a complete description of the structure determination process). Overall, the structure of the GDAP1-core contained two domains as expected (Figure 3A). The G-site (residues 20–105) adopted the canonical mixed α/β Thioredoxin fold30 with an r.m.s.d of 0.9 Å over 45 Cα when structurally aligned against the G-site of our GST Mu control44 (Figure 3B).
TABLE 1.
Data collection and refinement statistics
| SeMET GDAP1-core | |
|---|---|
| PDB ID | 6UIH |
| Data collection | |
| Space group | I432 |
| Cell dimensions | |
| a = b=c (Å) | 196.6 |
| α = β=γ (°) | 90 |
| Unique Reflections | 15,877 |
| Resolution (Å) | 98.3 – 2.83 (2.88–2.83)a |
| Rpim (%)b | 1.3 (28.7) |
| I/σI | 37.3 (2.3) |
| Completeness (%) | 100.0 (100.0) |
| Redundancy | 70.1 (79.1) |
| CC(1/2) (%) | 99.96 (86.42) |
| Anomalous Completeness | 100 (100) |
| Anomalous Multiplicity | 37.9 (41.6) |
| CC (ano) | 0.868 (0.011) |
| Wilson B-factor (Å2) | 93.2 |
| Refinement | |
| Resolution (Å) | 98.0 – 2.83 |
| Rworkc / Rfreed (%) | 21.5 / 22.7 |
| Number of atoms | 3248 |
| Avg B-factors (Å2) | 98.0 |
| R.m.s. deviations | |
| Bond lengths (Å) | 0.014 |
| Bond angles (°) | 1.291 |
| Ramachandran | |
| Favored, Allowed, Outliers (%) | 95.3, 4.7, 0.0 |
| Clashscore | 0.92 |
Values in parentheses are for highest-resolution shell.
Rpim = Σh [1/(/nh−1)]1/2 * Σi |<Ih> − Ih,i| / Σh Σi Ih,i where h represents unique reflections, i are their symmetry-equivalents, nh denotes the multiplicity, <I> is the average intensity of multiple measurements.
Rwork = Σhkl∥Fobs(hkl)∥ − Fcalc (hkl)∥/Σhkl|Fobs(hkl)|.
Rfree represents the cross-validation R factor for 7.5% of the reflections against which the model was not refined. A total of 1200 reflections are contained in this test set.
FIGURE 3.
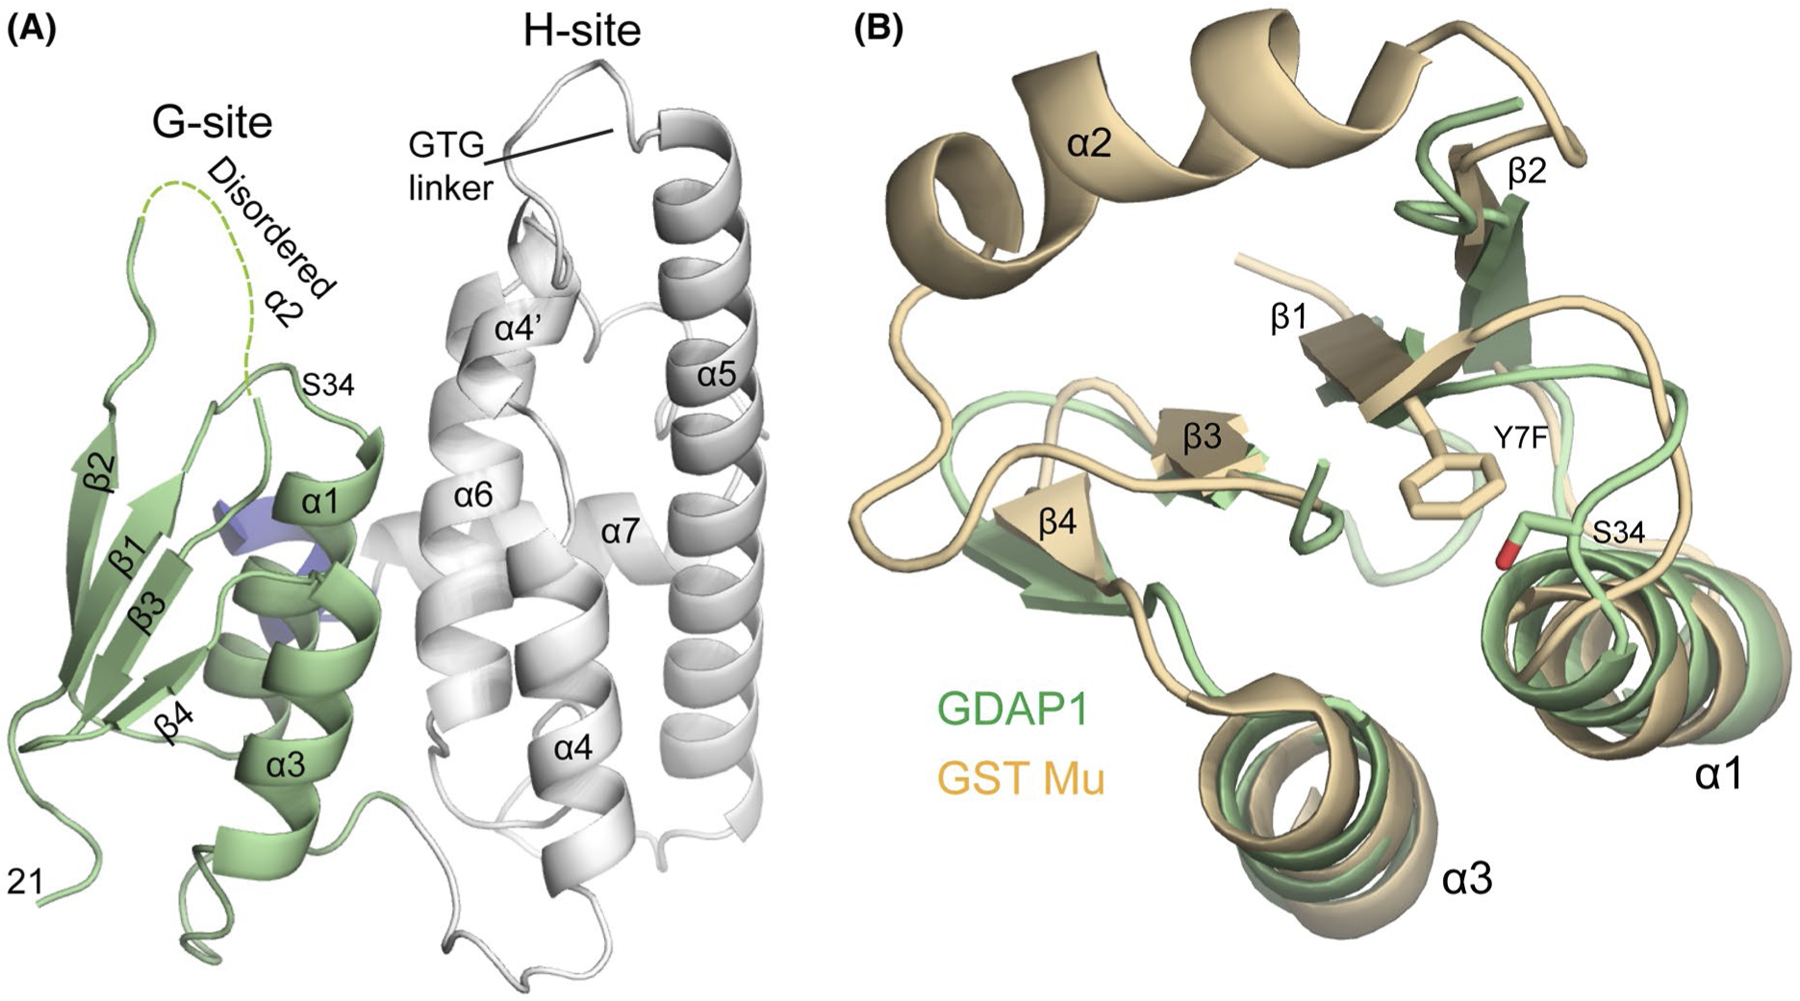
Structure of the GST-like core of GDAP1. A, Cartoon of GDAP1-core structure with G-site shown in green, H-site in white and residues 286–292 which are contained within the HD1 domain indicated in blue. B, Structural overlap of G-sites from GDAP1 (green) and GST Mu (orange). The active site residue position from GST Mu (Y7 but was mutated to Phe in this structure (PDBid:1U87) and the putative active site residue from GDAP1 (S34) are shown as sticks
GSTs typically utilize a network of both hydrogen bonding and van der Waals interactions to bind glutathione (Figure 4A). Despite having a highly similar overall fold, the surface of the GDAP1 G-site does not appear to be compatible with glutathione binding and we have identified four important differences between the G-sites of GDAP1 and canonical GSTs. First, active GSTs contain a cis-proline at the beginning of strand β3 of the Thioredoxin fold, which is a critical component of the fold.30 GDAP1 does contain a proline in this position (P78) but we find it in the trans configuration, which repositions the sequence leading toward helix α2, and facilitates packing of E76 against W31, which is conserved in both GST Mu and GDAP1 (Figure 4B,C). The second difference is that E76 and V77 are extended into the canonical binding pocket, sterically blocking the glutathione binding potential (Figure 4B). Third, helix α2, which contains important residues for recognizing the glutathione moiety in canonical GSTs is disordered in GDAP1 (Figure 4A,B). Sequence conservation between GDAP1 and GSTs in the α2 region is limited making it unclear if this helix could play a canonical role in GDAP1 (Figure 4D). Additionally, the S/TRAIL sequence, which is an important motif for many GSTs51 is missing in GDAP1. We also note that the loop leading from β2 into α2 in GDAP1 is repositioned in GDAP1, suggesting that a conformational change would be needed to get α2 into the location seen in canonical GSTs. Last, additional residues which make specific contacts with glutathione in GST Mu, S68 and L13 are not conserved in GDAP1 (Figure 4A), and would, therefore, not be available for glutathione recognition. Overall this structural data is consistent with the biochemical observations that GDAP1 is not capable of binding glutathione and suggest that proline isomerization, S36, A90, and the configuration of helix α2 are the principle differences that explain the biochemical observations at the molecular level.
FIGURE 4.
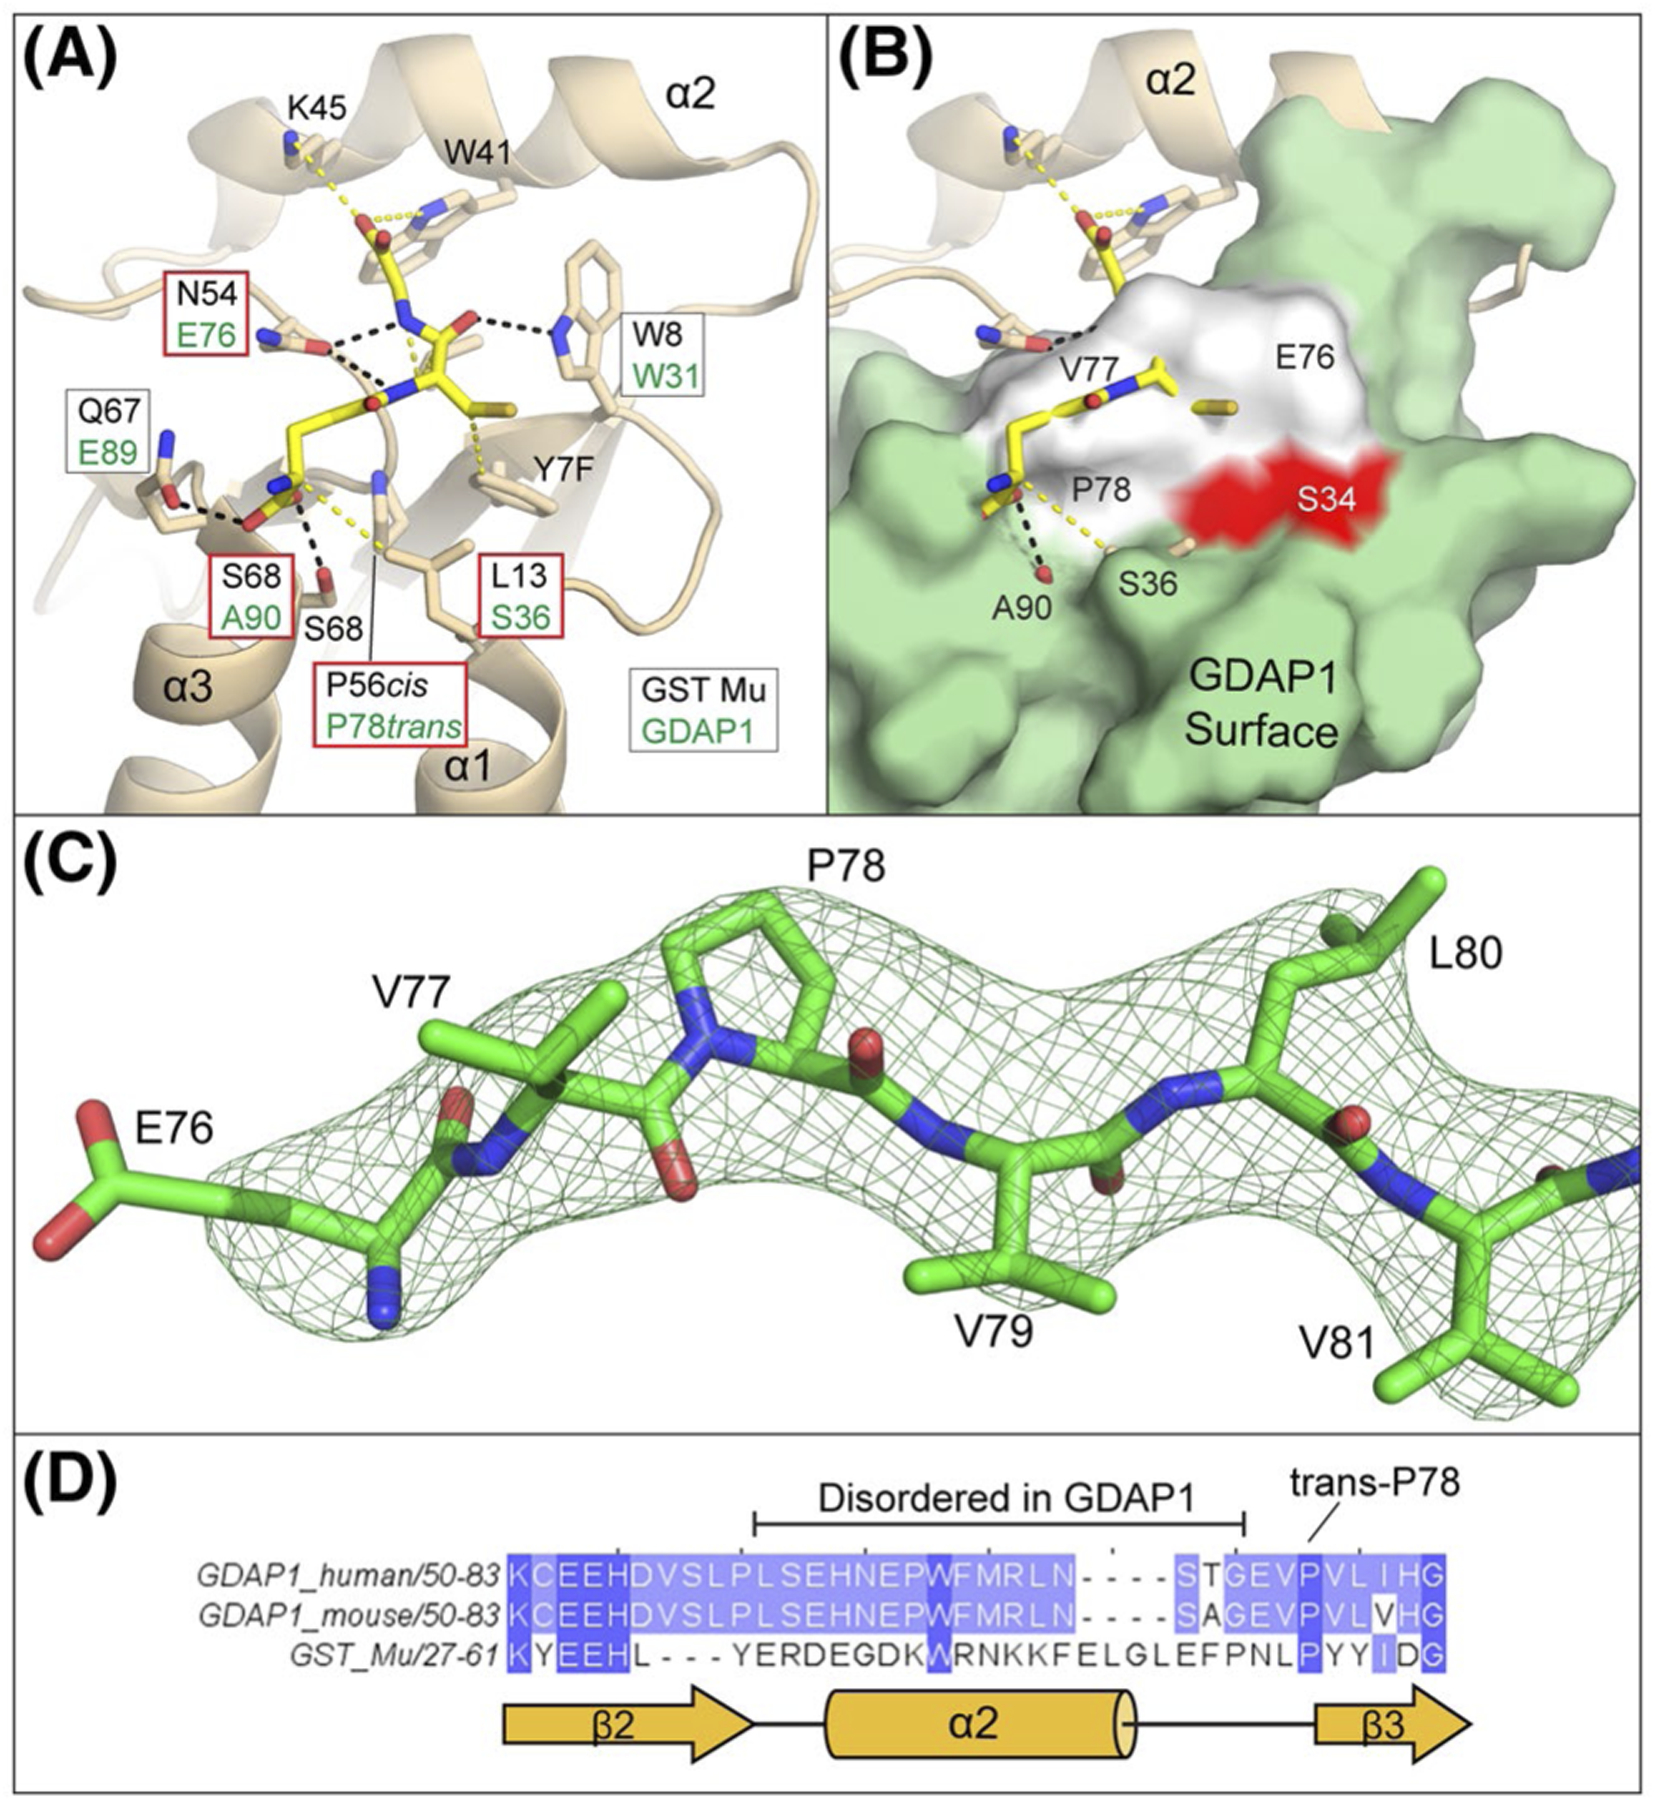
Binding surfaces of the GDAP1 G-Site are incompatible with GSH binding. A, Arrangement of glutathione interacting residues within GST Mu (PDBid 1U87). Hydrogen bonding interactions are indicated as black dashes and van der Walls interactions are yellow dashes. For each interacting residue, the corresponding residue from a structural alignment of GDAP1 with GST Mu is indicated within a box and the box colored by whether the change is conservative (white) or not conservative (red). Corresponding residues within α2 are not known as it is disordered in GDAP1. B, Superposition of GDAP1 with GST Mu glutathione binding pockets. For orientation, the position of the canonical GST active site residue (S34) is shown in red. GDAP1 residues 76–78 which occlude the glutathione binding pocket are shown in white. C, Omit map for residues 76–81 (Fo-Fc map contoured at 3.0σ) shown in mesh while GDAP1 residues 76–81 are shown in sticks, D, Primary sequence alignment of GDAP1 (mouse and human) and GST Mu in the region around helix α2. The observed secondary structure of GST Mu is indicated in yellow cartoon below for reference
3.4 |. GDAP1 is a monomeric GST-like protein
Crystallization of GDAP1 was facilitated by the replacement of the α-loop (amino acids 145–200) with a tripeptide GTG-linker. Limited sequence homology between this region and GSTs had made it difficult to predict a priori whether the α-loop was an independent domain in between G- and H-sites16,20,52 or whether it was instead an integral part of the canonical fold. While our structural data do not inform directly on the structure of the α-loop, helices α4 and α5 in GDAP1 are positioned in a manner similar to most other GSTs, indicating that the α-loop is an insertion within the H-site. To better understand how the α-loop might be positioned within the context of the intact GDAP1, we performed structural prediction of the entire GDAP1 protein using the structure of the GDAP1-core as our threading template.53–55 The resulting prediction places the α-loop just above the canonical binding pocket (Figure 5). This is consistent with our biochemical observation that α-loop deletion abrogates ethacrynic acid binding (Figure 2A). This positioning is not without precedent, however, as the lignin proteins, LigE and LigF, are glutathione activated beta-etherases that contain a lid similar to the predicted structure of the α-loop.56 This model also predicts that a portion of the HD1 through residue 307 is in the proximity of the α-loop consistent with a regulatory role for this domain35 (Figure 5).
FIGURE 5.
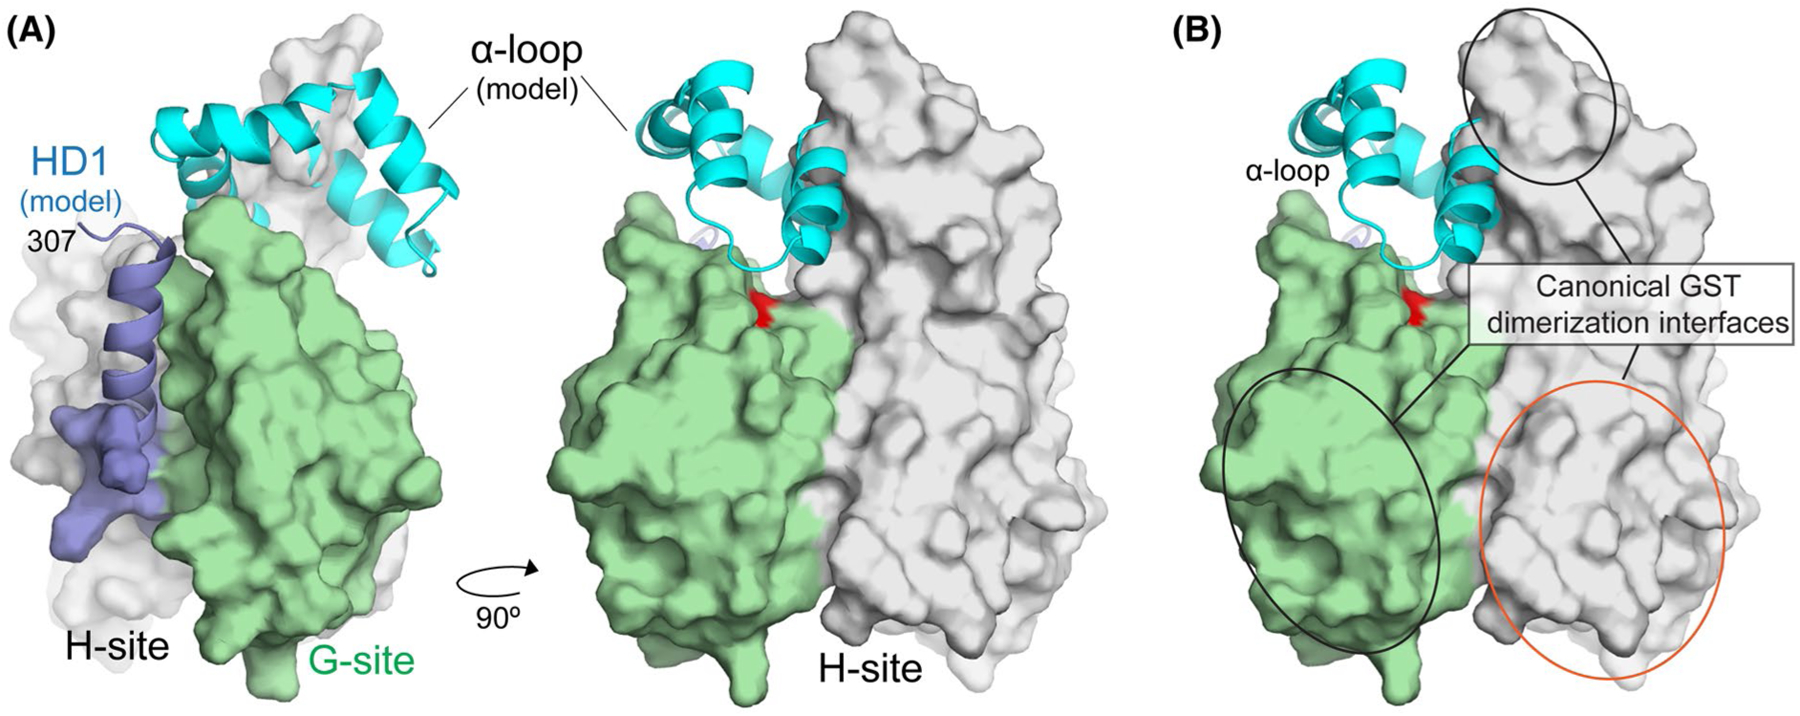
Structural model for the cytoplasmic domain of GDAP1. A, Model for the location of the α-loop and the HD1 domain relative to the core. The experimentally derived GDAP1-core is shown as a molecular surface and colored as in Figure 3. The α-loop (cyan) and a portion of the HD1 (blue) were added from structural predictions generated by I-TASSER. B, Modeled α-loop and HD1 regions do not overlap with surfaces used by canonical GSTs to promote dimerization (red and black ovals)
Interestingly, the model also positions the α-loop near the canonical GST dimerization interface and dimerization is a critical criterion for the enzymatic activity of GSTs. While there are many variations on this theme, most GSTs have an extensive dimerization interface which can be described as three adjacent interaction surfaces. The primary interactions surfaces are formed by the side of the G-site (α3 and the α3-β3 loop) which pack onto a matching surface formed by α4 and α5 of the H-site (Figure 5A). Thus, in the assembled GST dimer, the H-site from one subunit interacts with the G-site of the adjacent subunit, and vice versa. A third smaller interaction surface is formed at the end of helix α4, which packs against the same surface on the adjacent subunit in the dimer. In the case of GST Mu, these surfaces generate an interfacial surface area of ~1500 Å2. There is only one GDAP1 molecule within the asymmetric unit of our crystals so we analyzed whether packing arrangements within the lattice recapitulate all or a portion of the canonical dimerization interface or whether they form a unique dimerization interface. Analysis of all the interfaces found packing interfaces of 989, 884, and 621 Å2, however, none were consistent with a canonical GST interface.
We next sought to reveal whether removal of the NT, α-loop, and HD1 domains, which was needed to facilitate crystallization, may be altering the stoichiometry of the protein in vitro. Therefore, to test whether GDAP1 could dimerize in vitro, we performed analytical size exclusion chromatography experiments on GDAP1ΔTM, GDAP1-core, and GST Mu (monomeric masses of 37.5, 26.6, and 25.5 kDa, respectively). Here we find that both GDAP1ΔTM and GDAP1-core had retention volumes consistent with monomeric species of their respective molecular weights, while GST Mu was eluted off the column with an apparent molecular weight ~46 kDa, consistent with a dimer which was expected for this active GST (Figure 6). These data are in agreement with the crystal structure and demonstrate that neither the GDAP1-core nor the entire cytosolic portion of GDAP1 is facilitating dimerization under these conditions. The analysis also demonstrates that the removal of HD1, NT, and/or α-loop regions of GDAP1 does not alter stoichiometry, in support of the full-length structure predictions of GDAP1 (Figure 5), and suggesting that these regions are not masking potential dimerization through an autoinhibitory mechanism. While we cannot exclude the possibility that dimerization may be mediated solely through the transmembrane regions, the data presented here strongly suggest that the cytosolic portion of GDAP1 is monomeric.
FIGURE 6.
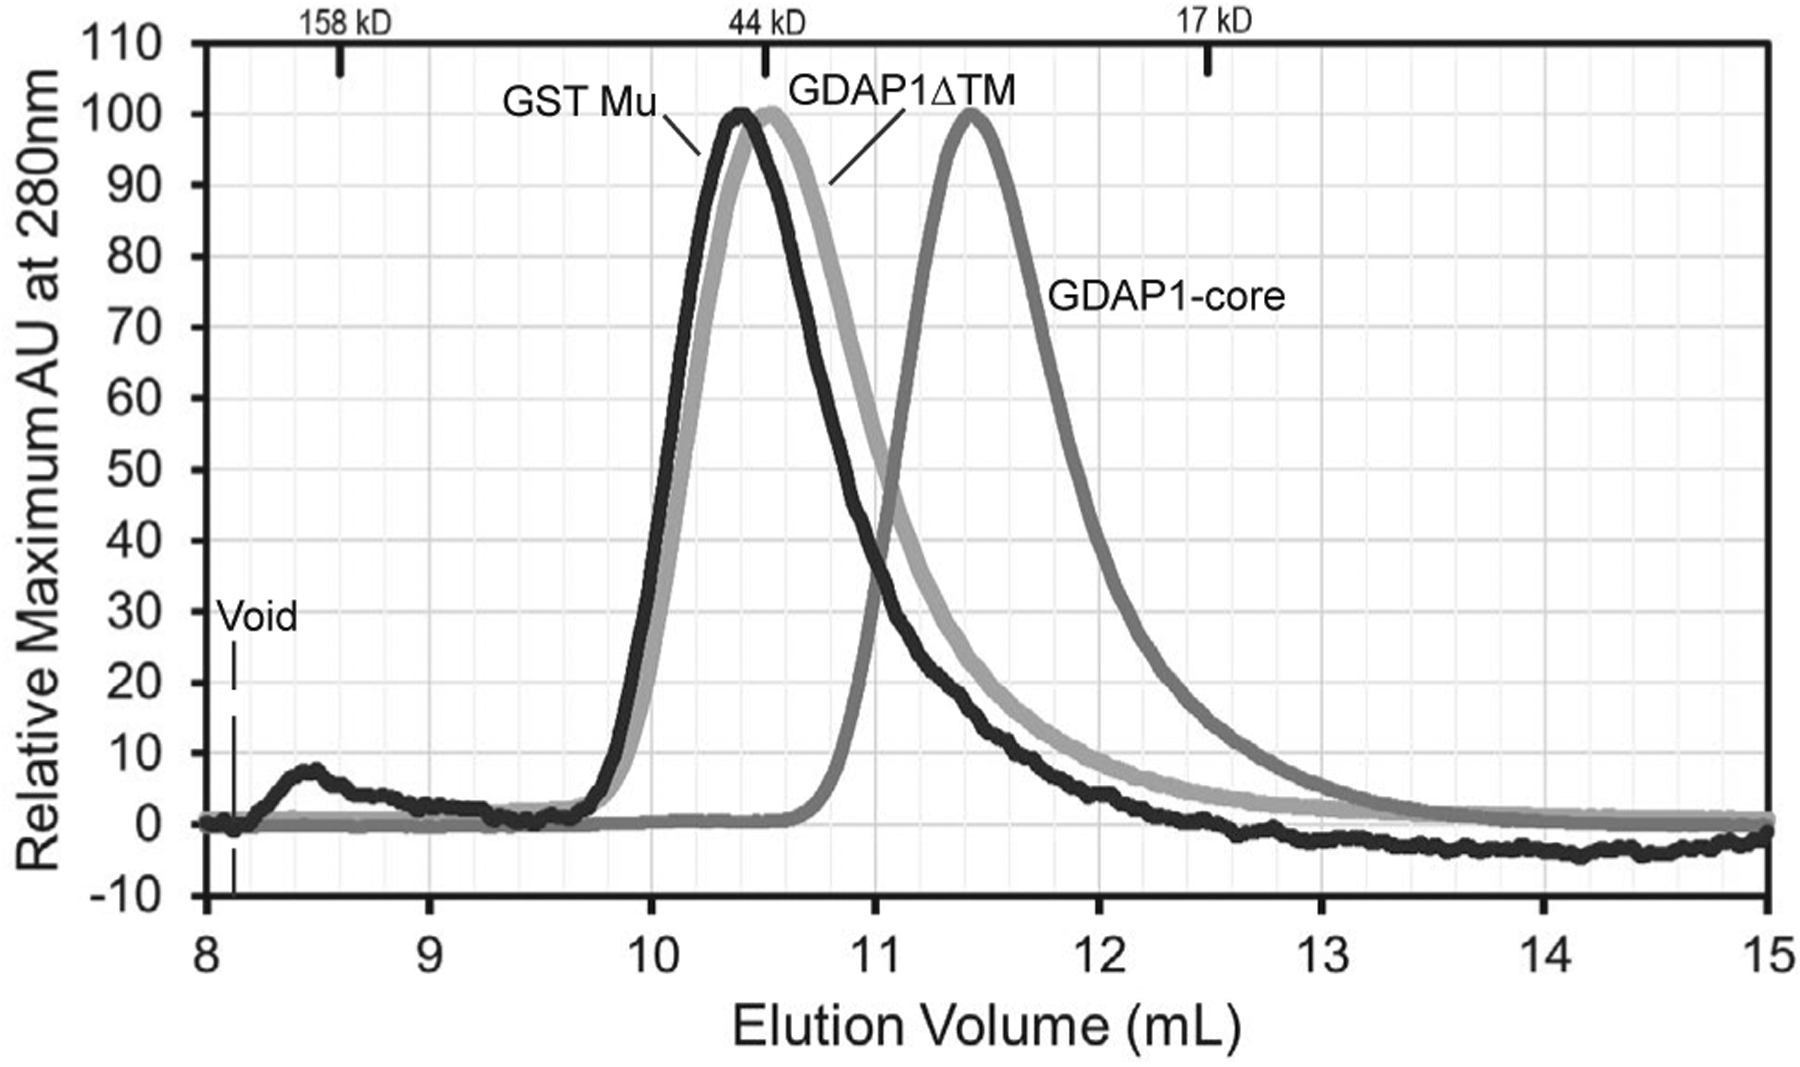
GDAP1 constructs are monomeric. Analytical Size Exclusion Chromatography was performed on GDAP1ΔTM, GDAP1-core, and GST Mu proteins. Retention volumes for standards are indicated on the top. The elution volumes of GDAP1 constructs indicate that GDAP1 constructs lacking the transmembrane domain are monomeric
3.5 |. Mutants associated with CMT cluster along the canonical dimerization interface
Studies on the genetics of CMT have identified a wealth of mutants in GDAP1 associated with the disease57,58 as well as the subtype those mutants are associated with. We can now put these mutants into a three-dimensional context within the structure of GDAP1. As shown in Figure 7, the mutants are strongly (but not exclusively) clustered within the H-site, primarily on helices α4, α5, α7, and the loop connecting α5 and α6. Dominantly inherited mutants (Figure 7, Red) are focused within the center of this CMT cluster, and we find that these residues are mostly surface residues with the potential to facilitate protein-protein interactions. Recessively inherited mutants (Figure 7, orange) are found on the periphery of the dominant mutants and include residues on the surface but also residues L239 and Y279, which are buried and we would predict serve to stabilize the H-site fold. Interestingly, there are two notable CMT mutants found within the G-site. The first is P78, which we noted above is important for the overall architecture of a canonical G-site, and S34 which is the putative active site residue.35 We next asked whether the surface defined by the large collection of CMT mutants is contained within a canonical GST dimerization surface. As shown in Figure 7, we find that many of them are indeed located within the H-site portion of the major GST canonical dimerization interface (Figure 5B, black oval). Few mutants have been identified on the opposite face of the H-site and most appear to be important for protein stability. Interestingly, mutants that fall within the other two portions of the canonical dimerization interface have not been identified, leading us to conclude that they are not as important for the disease state.
FIGURE 7.
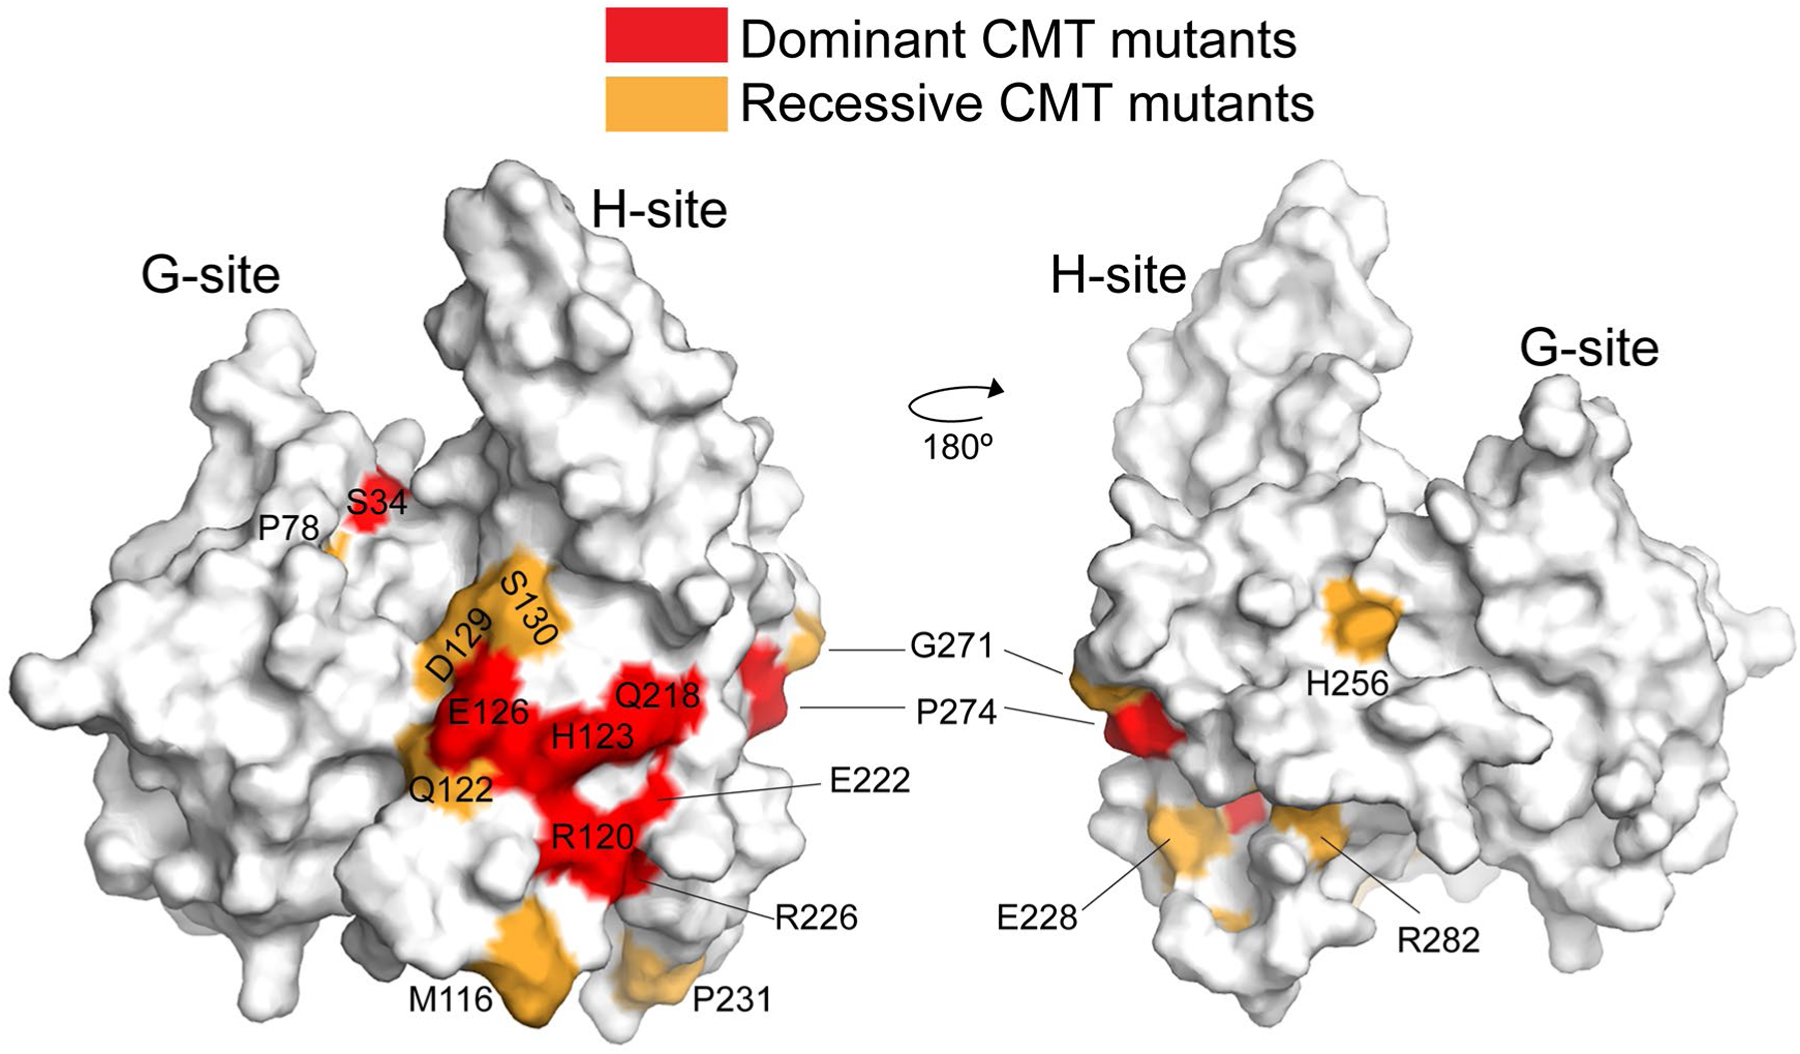
CMT mutants are cluster on a canonical dimerization interface from GSTs. Surface representation of the GDAP1-core in the same orientation as in Figure 3A (left) or rotated 180° (right). Dominant mutations are indicated in red, recessive mutations are shown in orange
3.6 |. The impact of GDAP1 structural domains on mitochondrial morphology
The prior evidence indicates a role for GDAP1 in mitochondrial morphology.21,22,58,59 Dominantly inherited GDAP1 mutations and GDAP1 overexpression have been proposed to cause mitochondrial fragmentation, while GDAP1 loss has been linked to mitochondrial elongation and clumping.16,20 Based on this, GDAP1 was proposed to be a “pinchase”, that is, to possess an activity similar to that of dynamin and its relatives. It should be noted that neither the sequence alignment nor our structural data reveal any signatures that are similar to those of constricting GTPases.
Expression of the N-terminal YFP fusion of human TM-containing GDAP1 full-length in HeLa cells resulted in a range of distinct phenotypes that correlates with the amount of GDAP1 over-expression. Lower-expressing cells (expression judged by the intensity of YFP fluorescence) show normal mitochondrial staining largely undistinguishable from the TOM20 pattern in transfected mitochondria (Figure 8A, bottom). Highly expressing cells showed the condensation of the mitochondrial material in distended structures that were exclusively resident in the perinuclear region (Figure 8A, top). Cells expressing intermediate levels of the YFP fusion showed a transitional phenotype comprising both normal mitochondria strands and distended compartments (Figure 8A, middle). Figure 8B provides a direct comparison of the effects of GDAP1 expression levels on the mitochondrial morphology. A side-by-side comparison of highly and low-expressing cells shows distended phonotype in highly expressing but not low-expressing cells. To statistically analyze the effect of GDAP1 overexpression on mitochondrial morphology, we chose to compare the average width (thickness) of mitochondrial particles for GDAP1 overexpressing and normal cells. We isolated segments of images containing clearly resolvable mitochondrial particles, which were then binarized and analyzed using “analyze particles” function of ImageJ/Fiji.60 Using this technique, we find that control and GDAP1-overexpressing cells have statistically significant differences in mitochondrial morphologies (Figure 8C) with an increase in the population of distended mitochondria in GDAP1 overexpressing cells. We, therefore, propose, in line with prior publications,16,18,20,21 that GDAP1 regulates mitochondrial morphology.
FIGURE 8.
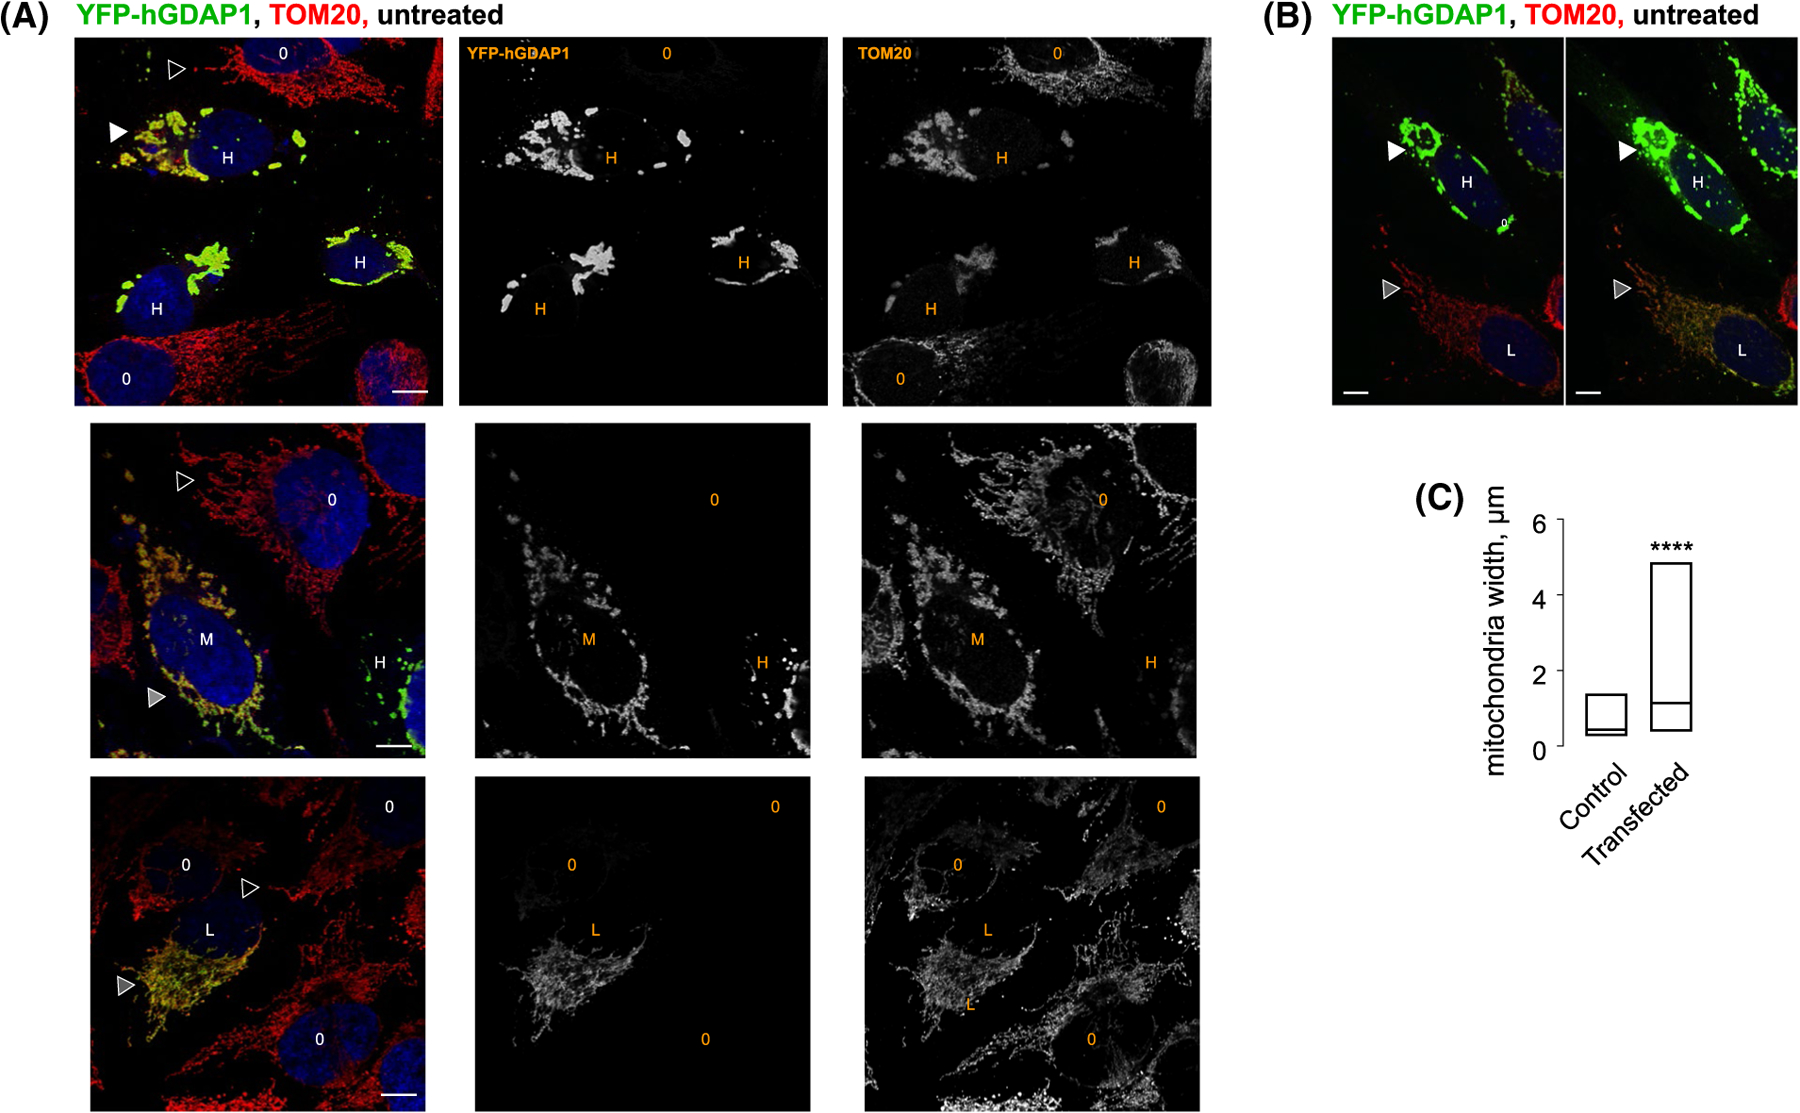
Overexpression of GDAP1 results in a distended mitochondrial morphology. A, Representative confocal images of HeLa cells transfected with YFP-GDAP1 fusion (full-length human GDAP1 containing the transmembrane domain, green) and stained with anti-TOM20 antibodies (red). Blue is DAPI. O identifies cells that were not transfected as evidenced by the lack of green signal from YFP-GDAP1. H, M and L represent highly, medium and low expressing cells. Hollow triangles point to normal tubular mitochondria. White triangles point to the distended mitochondria. Gray triangles point to intermediate and normal mitochondrial phenotypes in GDAP1-positive cells. B, Images representing the same field of view were taken at two different laser intensity and amplification gain to show the differences in GDAP1 expressing levels in GDAP1-positive cells with the distended and normal phenotypes. C, Box plot representing a triplicate set of images used for analysis. Data represent 153 particles for the control and 62 particles for the transfected set. **** is P < .0001 using unpaired two-tailed t-test. The size bar represents 10 μm
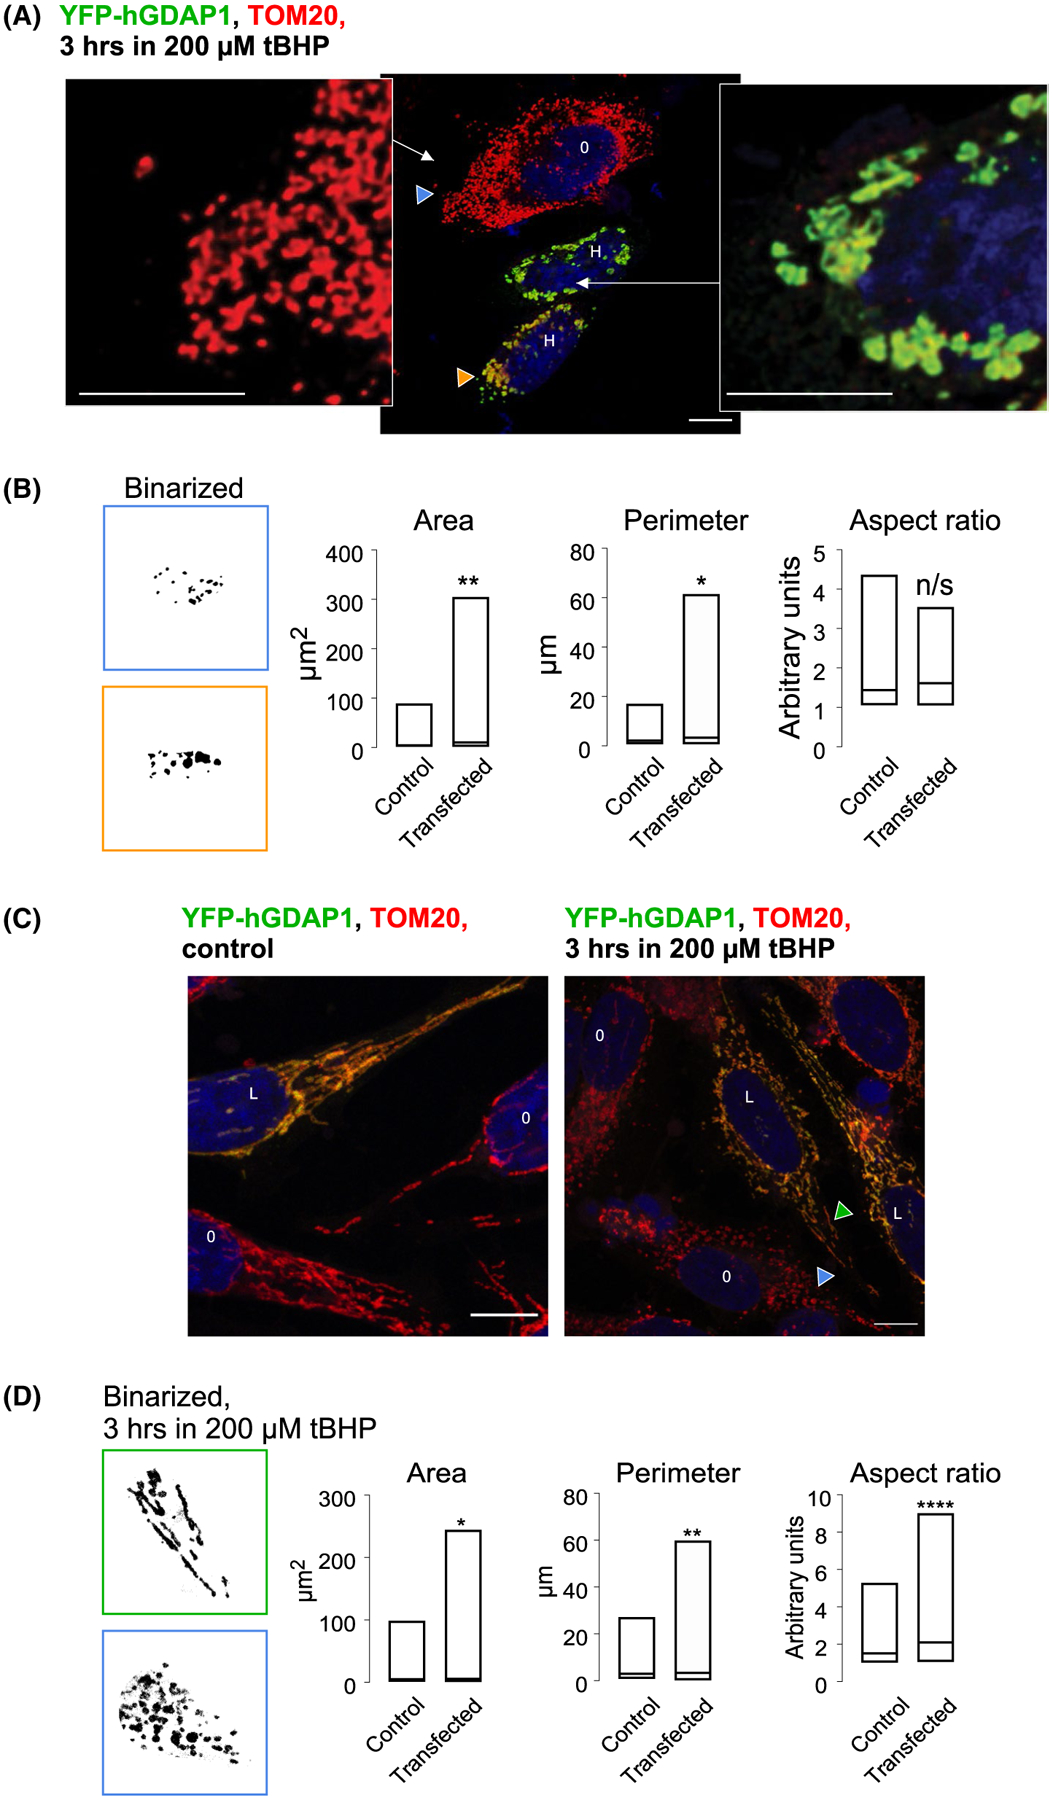
GDAP1 was proposed to cause mitochondrial fragmentation.20–22,58 The distended mitochondrial phenotype induced by GDAP1 overexpression, however, is dissimilar to the mitochondrial fragmentation phenotype induced by oxidative stress (Figure 9). The distended fragments induced by the overexpression of the wilt-type full-length human GDAP1 were significantly larger than those caused by oxidative stress. To compare fragmentation in control and GDAP1 overexpressing cells, we treated HeLa cells with 200 μM of the pro-oxidant tert-Butyl hydroperoxide (tBHP) for 1–3 hours. We find that tBHP induces the breakdown of the mitochondria network in control cells, while the distended phenotype in GDAP1-overexpressing cells persists even under these conditions (Figure 9A). We binarized the fragments of images containing the resolvable individual particles and compared them statistically. Box plots in Figure 9B show that GDAP1 overexpressing cells had significantly larger populations of mitochondrial particles with larger total areas and perimeter. Average values of these parameters varied significantly (P < .05) between these populations. Therefore, the classic fragmentation triggered by oxidative stress and the distended mitochondria phenotype induced by GDAP1 overexpression may involve different mechanisms.
FIGURE 9.
Confocal analysis of mitochondrial morphology in control and GDAP1-overexpressing cells under oxidative stress. A, Mitochondrial fragmentation in control and overexpressing cells exposed to 200 μM tBHP for 3 hours. Zoom-out (middle) and zoom-in images represent control mitochondria (blue arrowheads) and mitochondria overexpressing full -length wild-type human GDAP1 containing the transmembrane domain (orange arrowheads). O represents control cells and H represents highly GDAP1-expressing cells. B, Binarized fragments of images containing the individual mitochondrial particles. Blue frame represents mitochondria from control and orange frame represents mitochondria from GDAP1-overexpressing cells. Box plot representing a triplicate set of images used for analysis. Data represent 126 particles for the control and 57 particles for the transfected set. * is P < .05 and ** is P < .005 using the unpaired two-tailed t-test. C, Protective effect of low GDAP1 expressing against mitochondrial fragmentation induced by oxidative stress. Confocal images. Blue arrowheads point to control mitochondria and green arrowheads point to mitochondria in the cell expressing low levels of recombinant GDAP1. O represents control cells and L represents low GDAP1-expressing cells. D, Binarized fragments of images containing individual mitochondrial particles from cells treated with 200 μM tBHP for 3 hours. Blue frame represents mitochondria from control and green frame represents mitochondria from GDAP1-overexpressing cells. Box plot representing a 5-image set used for analysis. Data represent 280 particles for the control and 325 particles for the transfected set. * is P < .05, ** is ** is P < .005 **** is P < .0001 using unpaired two-tailed t-test. The size bar represents 10 μm
Interestingly, at low levels of expression, GDAP1 offered a degree of protection against the fragmentation induced by oxidative stress. Figure 9C shows sample images in which we observed low-expressing GDAP1-transfected cells next to normal cells. When such cells were stressed using 200 μM tBHP, fragmentation was less pronounced in GDAP1-overexpressing cells as evidenced by an increase in the population of mitochondrial particles with larger total areas, perimeters, and aspect ratios in these cells Figure 9D. Average values of these parameters varied significantly (P < .05) between these populations.
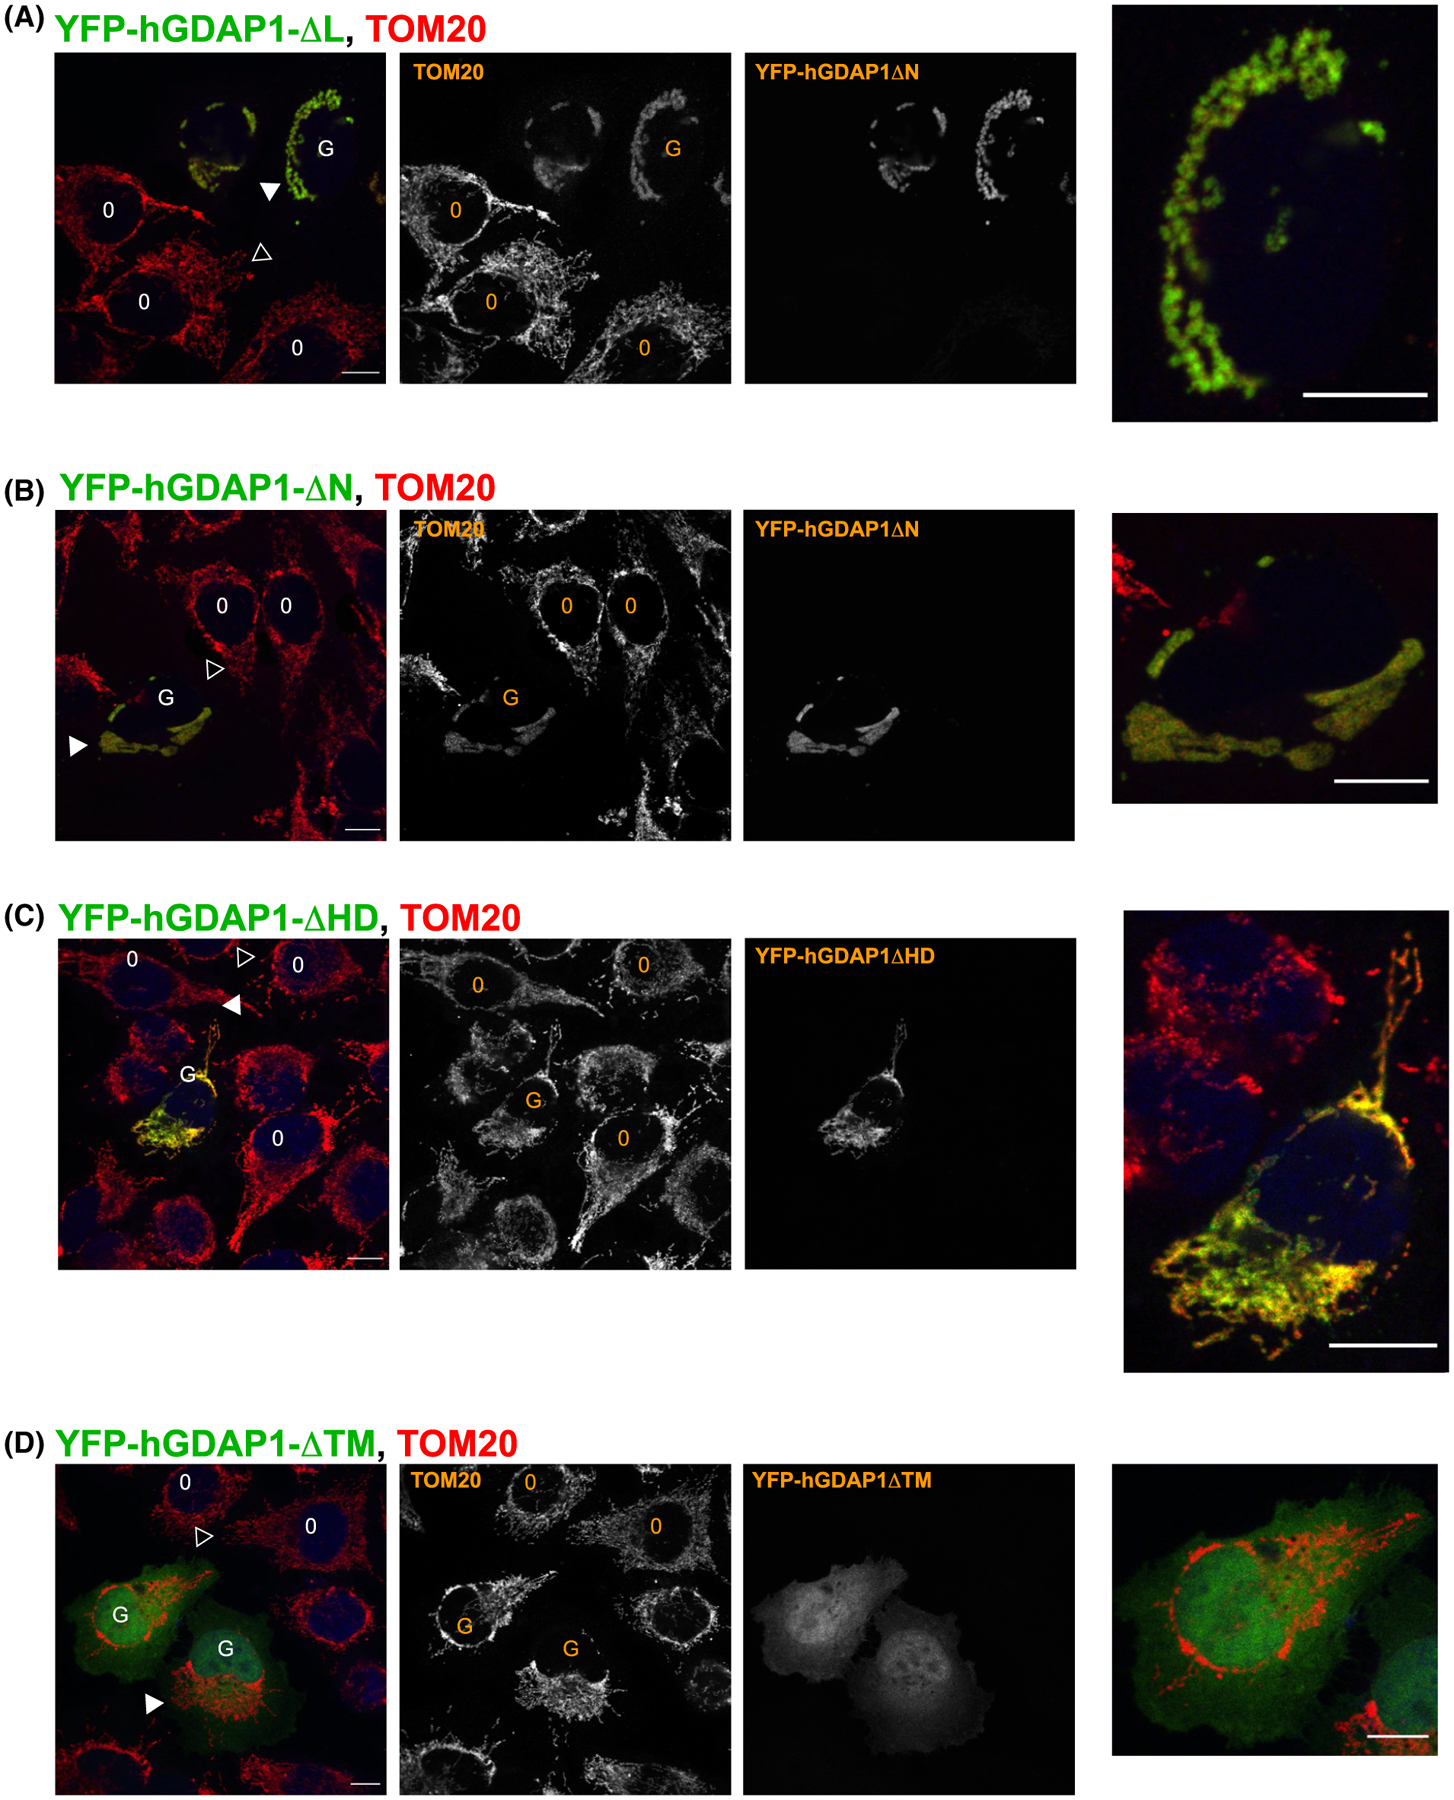
Overexpression of human GDAP1ΔNT and GDAP1ΔαL mutants containing TM caused the distended mitochondrial phenotype indistinguishable from the one caused by overexpression of full-length WT GDAP1 (Figure 10). GDAP1ΔTM and GDAP1ΔHD1 (contains TM) did not cause the condensation of distended mitochondrial material in the perinuclear region, suggesting that mitochondrial anchoring (TM) and HD1 domain are necessary for GDAP1 role in regulating the mitochondrial morphology. It is noteworthy that the HD1 region of GDAP1, the region that impacts mitochondrial morphology, is separate from the canonical binding pocket in GSTs. Therefore, we propose that the pocket does not serve an enzymatic purpose but rather functions as a sensor for the products of mitochondrial damage. We propose that the sensor that works in conjunction with the HD1, such that substrate binding triggers structural rearrangements involving HD1 and TM that regulate mitochondrial morphology.
FIGURE 10.
Confocal analysis of GDAP1 variants indicates that TM and HD1 regions are important for regulating mitochondrial morphology when overexpressed. GFP-fusion of human GDAP1 containing the transmembrane domain was transiently expressed in HeLa cells and analyzed using confocal microscopy. The cells were fixed and stained against the mitochondrial marker TOM20 as described in the methods section. O represents control cells and G represents cells expressing recombinant GDAP1. Solid arrowhead shows mitochondria in cells expressing GDAP1 mutants, and hollow arrowheads show mitochondria in control, un-transfected cells. A, Cells transfected with GDAP1ΔαL show the distended mitochondrial phenotype. B, The distended phenotype is present in cells transfected with GDAP1ΔNT. C, Cells transfected with GDAP1ΔHD1 do not show obvious distended mitochondrial phenotype. D, GDAP1ΔTM is present throughout the cytoplasm and the mitochondrial morphology does not appear to be affected. The size bars represent 10 μm
4 |. DISCUSSION
The putative GST-like protein GDAP1 has been associated with a variety of functions including oxidative stress response, mitochondrial fission, and the control of the mitochondrial redox potential. Previous results have demonstrated GST activity and a role for the HD1 domain in regulating this activity.35 However, these results were in conflict with several other results in the literature, suggesting that it plays a non-enzymatic role.19,24,58,59 Thus, the role of GDAP1 has remained unclear and indeed the question of whether it is an active GST enzyme or a non-enzymatic factor is still unresolved. GDAP1 has several insertions within its primary sequence that do not correspond to canonical GST domains and we reasoned that these could play a role in regulating GDAP1 function both at the biochemical and cellular levels. Here, we have utilized structural, biochemical, and biophysical approaches to examine two central pre-requisites for GST activity: glutathione binding and protein dimerization.
Using a collection of fragments that systematically removed novel sequences within GDAP1, we asked whether we could detect glutathione binding using both differential scanning fluorimetry and isothermal titration calorimetry, but have been unable to do so. Using the structural analysis of the GST-like core of GDAP1, we determined that critical determinants utilized by other GSTs to recognize glutathione such as a conserved cis-proline, and additional important residues within the pocket are not maintained in GDAP1, rendering GDAP1 unable to bind glutathione in this configuration. Interestingly, not all of the glutathione binding residues have evolved away from canonical residues in GSTs leaving the possibility open that GDAP1 utilizes this surface to recognize a different small molecule or that it binds glutathione in a distinctly different manner. While we cannot exclude the possibility that GDAP1 can adopt another conformation that is receptive to glutathione binding, the pocket we observe is not compatible with glutathione binding.
The mechanisms that underlie the ability of GDAP1 to recognize a binding partner or substrate have not been explored. Using the same set of GDAP1 fragments, we have demonstrated the binding for the model GST inhibitor ethacrynic acid finding that the α-loop plays a critical role in binding while the N-terminal extension has no role. Interestingly, the α-loop is the most conserved portion of GDAP1, which is consistent with a prominent role in substrate recognition. Structural predictions place the α-loop just above S34 in the GST canonical active site and we predict that it completes a binding pocket that utilizes S34, the disordered helix α2, and surfaces on both the G- and H-sites. Such an arrangement has been seen for other glutathione-dependent enzymes.56 It is also noteworthy that the position of the α-loop is on the same face of the protein as the HD1 domain, suggesting that the α-loop could play a role in interacting with the mitochondrial membrane or that the autoregulatory role proposed for the HD1 is mediated by an interaction between the HD1 and the α-loop. Future experiments will address this possibility.
Along with the ability to utilize glutathione, dimerization has long been a feature of active GSTs. We have addressed this analysis here, demonstrating that the cytosolic portions of GDAP1 behave as a monomer in solution. Additionally, the “lock and key” motif found in most GSTs to facilitate dimerization is absent in our structure, further supporting a monomeric stoichiometry. Last, disease mutants in GDAP1 that result in CMT are largely clustered on a single surface within the H-site of GDAP1. This surface represents one half of the major dimerization interface for GSTs, suggesting that GDAP1 may have adapted this site to facilitate heterodimeric interactions with another protein. This would be consistent with a role as a sensor of oxidative stress as we and others have proposed.17,25,35 An alternate hypothesis is that GDAP1 has adapted the GST fold for another function. There are many precedents for this, as members of the GST superfamily have been shown to house esterase, peroxidase, reductase, and other activities. Some have even evolved into hormone transporters,61 speaking to the richness of enzymatic and non-enzymatic functions driven through this fold. GDAP1 adds to this diversity and the biochemical and structural data presented here further indicate that it is a unique member of the GST superfamily.
ACKNOWLEDGMENTS
This research used resources of the Advanced Photon Source, a US Department of Energy (DOE) Office of Science User Facility operated for the DOE Office of Science by Argonne National Laboratory under Contract No. DE-AC02-06CH11357. Use of the Lilly Research Laboratories Collaborative Access Team (LRL-CAT) beamline at Sector 31 of the Advanced Photon Source was provided by Eli Lilly Company, which operates the facility. Additionally, we are grateful to Andrea Berman, Roni Lahr, and Shannon Doherty for helpful discussions and technical assistance This work was supported by NIH 1S10OD021540 (CS), NIH R21 grant NS094860 (KK), Mucolipidosis type IV foundation grant (KK), and the University of Pittsburgh (APV). The mouse GDAP1 clone was provided by Dr Axel Methner, Universitätsmedizin der Johannes Gutenberg-Universität. The original human GDAP1 clone was provided by Drs. Pilar González-Cabo and Francesc Palau Martínez, University of Valencia We are grateful for these contributions.
Funding information
HHS | NIH | National Institute of Neurological Disorders and Stroke (NINDS), Grant/Award Number: NS094860; Mucolipidosis Type IV Foundation (ML4); University of Pittsburgh (APV); HHS | NIH | NIH Office of the Director (OD), Grant/Award Number: 1S10OD021540
Abbreviations:
- GDAP1
ganglioside-induced differentiation-associated protein 1
- GSH
glutathione
- CMT
Charcot-Marie Tooth
- GST
glutathione S-transferase
- ITC
isothermal titration calorimetry
- OD
optical density
- PBD
Protein Data Bank
- RMSD
root mean square deviation
Footnotes
CONFLICT OF INTEREST
The authors declare no conflicts of interest.
REFERENCES
- 1.Kazamel M, Boes CJ. Charcot Marie Tooth disease (CMT): historical perspectives and evolution. J Neurol. 2015;262:801–805. [DOI] [PubMed] [Google Scholar]
- 2.Juarez P, Palau F. Neural and molecular features on Charcot-Marie-Tooth disease plasticity and therapy. Neural Plast. 2012;2012:171636. [DOI] [PMC free article] [PubMed] [Google Scholar]
- 3.Laura M, Pipis M, Rossor AM, Reilly MM. Charcot-Marie-Tooth disease and related disorders: an evolving landscape. Curr Opin Neurol. 2019;32(5):641–650. [DOI] [PubMed] [Google Scholar]
- 4.Murphy SM, Laura M, Fawcett K, et al. Charcot-Marie-Tooth disease: frequency of genetic subtypes and guidelines for genetic testing. J Neurol Neurosurg Psychiatry. 2012;83:706–710. [DOI] [PMC free article] [PubMed] [Google Scholar]
- 5.Rossor AM, Lu CH, Petzold A, et al. Plasma neurofilament heavy chain is not a useful biomarker in Charcot-Marie-Tooth disease. Muscle Nerve. 2016;53:972–975. [DOI] [PubMed] [Google Scholar]
- 6.Rossor AM, Polke JM, Houlden H, Reilly MM. Clinical implications of genetic advances in Charcot-Marie-Tooth disease. Nat Rev Neurol. 2013;9:562–571. [DOI] [PubMed] [Google Scholar]
- 7.Zis P, Reilly MM, Rao DG, Tomaselli P, Rossor AM, Hadjivassiliou M. A novel mutation in the FGD4 gene causing Charcot-Marie-Tooth disease. J Peripher Nerv Syst. 2017;22:224–225. [DOI] [PMC free article] [PubMed] [Google Scholar]
- 8.Cuesta A, Pedrola L, Sevilla T, et al. The gene encoding ganglio-side-induced differentiation-associated protein 1 is mutated in axonal Charcot-Marie-Tooth type 4A disease. Nat Genet. 2002;30:22–25. [DOI] [PubMed] [Google Scholar]
- 9.Pakhrin PS, Xie Y, Hu Z, et al. Genotype-phenotype correlation and frequency of distribution in a cohort of Chinese Charcot-Marie-Tooth patients associated with GDAP1 mutations. J Neurol. 2018;265:637–646. [DOI] [PubMed] [Google Scholar]
- 10.Claramunt R, Pedrola L, Sevilla T, et al. Genetics of Charcot-Marie-Tooth disease type 4A: mutations, inheritance, phenotypic variability, and founder effect. J Med Genet. 2005;42:358–365. [DOI] [PMC free article] [PubMed] [Google Scholar]
- 11.Sivera R, Espinos C, Vilchez JJ, et al. Phenotypical features of the p. R120W mutation in the GDAP1 gene causing autosomal dominant Charcot-Marie-Tooth disease. J Peripher Nerv Syst. 2010;15:334–344. [DOI] [PubMed] [Google Scholar]
- 12.Sivera R, Sevilla T, Vilchez JJ, et al. Charcot-Marie-Tooth disease: genetic and clinical spectrum in a Spanish clinical series. Neurology. 2013;81:1617–1625. [DOI] [PMC free article] [PubMed] [Google Scholar]
- 13.Baxter RV, Ben Othmane K, Rochelle JM, et al. Ganglioside-induced differentiation-associated protein-1 is mutant in Charcot-Marie-Tooth disease type 4A/8q21. Nat Genet. 2002;30:21–22. [DOI] [PubMed] [Google Scholar]
- 14.Martin AM, Maradei SJ, Velasco HM. Charcot Marie Tooth disease (CMT4A) due to GDAP1 mutation: report of a Colombian family. Colomb Med (Cali). 2015;46:194–198. [PMC free article] [PubMed] [Google Scholar]
- 15.Senderek J, Bergmann C, Ramaekers VT, et al. Mutations in the ganglioside-induced differentiation-associated protein-1 (GDAP1) gene in intermediate type autosomal recessive Charcot-Marie-Tooth neuropathy. Brain. 2003;126:642–649. [DOI] [PubMed] [Google Scholar]
- 16.Niemann A, Ruegg M, La Padula V, Schenone A, Suter U. Ganglioside-induced differentiation associated protein 1 is a regulator of the mitochondrial network: new implications for Charcot-Marie-Tooth disease. J Cell Biol. 2005;170:1067–1078. [DOI] [PMC free article] [PubMed] [Google Scholar]
- 17.Noack R, Frede S, Albrecht P, et al. Charcot-Marie-Tooth disease CMT4A: GDAP1 increases cellular glutathione and the mitochondrial membrane potential. Hum Mol Genet. 2012;21:150–162. [DOI] [PubMed] [Google Scholar]
- 18.Pedrola L, Espert A, Valdes-Sanchez T, et al. Cell expression of GDAP1 in the nervous system and pathogenesis of Charcot-Marie-Tooth type 4A disease. J Cell Mol Med. 2008;12:679–689. [DOI] [PMC free article] [PubMed] [Google Scholar]
- 19.Pedrola L, Espert A, Wu X, Claramunt R, Shy ME, Palau F. GDAP1, the protein causing Charcot-Marie-Tooth disease type 4A, is expressed in neurons and is associated with mitochondria. Hum Mol Genet. 2005;14:1087–1094. [DOI] [PubMed] [Google Scholar]
- 20.Wagner KM, Ruegg M, Niemann A, Suter U. Targeting and function of the mitochondrial fission factor GDAP1 are dependent on its tail-anchor. PLoS ONE. 2009;4:e5160. [DOI] [PMC free article] [PubMed] [Google Scholar]
- 21.Huber N, Guimaraes S, Schrader M, Suter U, Niemann A. Charcot-Marie-Tooth disease-associated mutants of GDAP1 dissociate its roles in peroxisomal and mitochondrial fission. EMBO Rep. 2013;14:545–552. [DOI] [PMC free article] [PubMed] [Google Scholar]
- 22.Niemann A, Wagner KM, Ruegg M, Suter U. GDAP1 mutations differ in their effects on mitochondrial dynamics and apoptosis depending on the mode of inheritance. Neurobiol Dis. 2009;36:509–520. [DOI] [PubMed] [Google Scholar]
- 23.Gonzalez-Sanchez P, Pla-Martin D, Martinez-Valero P, et al. CMT-linked loss-of-function mutations in GDAP1 impair store-operated Ca(2+) entry-stimulated respiration. Sci Rep. 2017;7:42993. [DOI] [PMC free article] [PubMed] [Google Scholar]
- 24.Pla-Martin D, Rueda CB, Estela A, et al. Silencing of the Charcot-Marie-Tooth disease-associated gene GDAP1 induces abnormal mitochondrial distribution and affects Ca2+ homeostasis by reducing store-operated Ca2+ entry. Neurobiol Dis. 2013;55: 140–151. [DOI] [PubMed] [Google Scholar]
- 25.Niemann A, Huber N, Wagner KM, et al. The Gdap1 knockout mouse mechanistically links redox control to Charcot-Marie-Tooth disease. Brain. 2014;137:668–682. [DOI] [PMC free article] [PubMed] [Google Scholar]
- 26.Shield AJ, Murray TP, Board PG. Functional characterisation of ganglioside-induced differentiation-associated protein 1 as a glutathione transferase. Biochem Biophys Res Commun. 2006;347:859–866. [DOI] [PubMed] [Google Scholar]
- 27.Marco A, Cuesta A, Pedrola L, Palau F, Marin I. Evolutionary and structural analyses of GDAP1, involved in Charcot-Marie-Tooth disease, characterize a novel class of glutathione transferase-related genes. Mol Biol Evol. 2004;21:176–187. [DOI] [PubMed] [Google Scholar]
- 28.Oakley AJ, Rossjohn J, Lo Bello M, Caccuri AM, Federici G, Parker MW. The three-dimensional structure of the human Pi class glutathione transferase P1–1 in complex with the inhibitor ethacrynic acid and its glutathione conjugate. Biochemistry. 1997;36:576–585. [DOI] [PubMed] [Google Scholar]
- 29.Oakley AJ, Lo Bello M, Mazzetti AP, Federici G, Parker MW. The glutathione conjugate of ethacrynic acid can bind to human pi class glutathione transferase P1–1 in two different modes. FEBS Lett. 1997;419:32–36. [DOI] [PubMed] [Google Scholar]
- 30.Oakley A Glutathione transferases: a structural perspective. Drug Metab Rev. 2011;43:138–151. [DOI] [PubMed] [Google Scholar]
- 31.Reinemer P, Dirr HW, Ladenstein R, Schaffer J, Gallay O, Huber R. The three-dimensional structure of class pi glutathione S-transferase in complex with glutathione sulfonate at 2.3 A resolution. EMBO J. 1991;10:1997–2005. [DOI] [PMC free article] [PubMed] [Google Scholar]
- 32.Hayes JD, Flanagan JU, Jowsey IR. Glutathione transferases. Annu Rev Pharmacol Toxicol. 2005;45:51–88. [DOI] [PubMed] [Google Scholar]
- 33.Hauck AK, Bernlohr DA. Oxidative stress and lipotoxicity. J Lipid Res. 2016;57:1976–1986. [DOI] [PMC free article] [PubMed] [Google Scholar]
- 34.Hayes JD, Pulford DJ, Ellis EM, et al. Regulation of rat glutathione S-transferase A5 by cancer chemopreventive agents: mechanisms of inducible resistance to aflatoxin B1. Chem Biol Interact. 1998;111–112:51–67. [DOI] [PubMed] [Google Scholar]
- 35.Huber N, Bieniossek C, Wagner KM, et al. Glutathione-conjugating and membrane-remodeling activity of GDAP1 relies on amphipathic C-terminal domain. Sci Rep. 2016;6:36930. [DOI] [PMC free article] [PubMed] [Google Scholar]
- 36.Studier FW. Protein production by auto-induction in high density shaking cultures. Protein Expr Purif. 2005;41:207–234. [DOI] [PubMed] [Google Scholar]
- 37.Vonrhein C, Flensburg C, Keller P, et al. Data processing and analysis with the autoPROC toolbox. Acta Crystallogr D Biol Crystallogr. 2011;67:293–302. [DOI] [PMC free article] [PubMed] [Google Scholar]
- 38.Emsley P, Lohkamp B, Scott WG, Cowtan K. Features and development of Coot. Acta Crystallogr D Biol Crystallogr. 2010;66:486–501. [DOI] [PMC free article] [PubMed] [Google Scholar]
- 39.Adams PD, Afonine PV, Bunkoczi G, et al. PHENIX: a comprehensive Python-based system for macromolecular structure solution. Acta Crystallogr D Biol Crystallogr. 2010;66:213–221. [DOI] [PMC free article] [PubMed] [Google Scholar]
- 40.Coblentz J, St Croix C, Kiselyov K. Loss of TRPML1 promotes production of reactive oxygen species: is oxidative damage a factor in mucolipidosis type IV? Biochem J. 2014;457:361–368. [DOI] [PubMed] [Google Scholar]
- 41.Kukic I, Lee JK, Coblentz J, Kelleher SL, Kiselyov K. Zinc-dependent lysosomal enlargement in TRPML1-deficient cells involves MTF-1 transcription factor and ZnT4 (Slc30a4) transporter. Biochem J. 2013;451:155–163. [DOI] [PMC free article] [PubMed] [Google Scholar]
- 42.Moreau NG, Falvo MJ, Damiano DL. Rapid force generation is impaired in cerebral palsy and is related to decreased muscle size and functional mobility. Gait Posture. 2012;35:154–158. [DOI] [PMC free article] [PubMed] [Google Scholar]
- 43.Grahn E, Novotny M, Jakobsson E, et al. New crystal structures of human glutathione transferase A1–1 shed light on glutathione binding and the conformation of the C-terminal helix. Acta Crystallogr D Biol Crystallogr. 2006;62:197–207. [DOI] [PubMed] [Google Scholar]
- 44.Andujar-Sanchez M, Smith AW, Clemente-Jimenez JM, et al. Crystallographic and thermodynamic analysis of the binding of S-octylglutathione to the Tyr 7 to Phe mutant of glutathione S-transferase from Schistosoma japonicum. Biochemistry. 2005;44:1174–1183. [DOI] [PubMed] [Google Scholar]
- 45.Ortiz-Salmeron E, Nuccetelli M, Oakley AJ, Parker MW, Lo Bello M, Garcia-Fuentes L. Thermodynamic description of the effect of the mutation Y49F on human glutathione transferase P1–1 in binding with glutathione and the inhibitor S-hexylglutathione. J Biol Chem. 2003;278:46938–46948. [DOI] [PubMed] [Google Scholar]
- 46.Ortiz-Salmeron E, Yassin Z, Clemente-Jimenez MJ, et al. Thermodynamic analysis of the binding of glutathione to glutathione S-transferase over a range of temperatures. Eur J Biochem. 2001;268:4307–4314. [DOI] [PubMed] [Google Scholar]
- 47.Ortiz-Salmeron E, Yassin Z, Clemente-Jimenez MJ, et al. A calorimetric study of the binding of S-alkylglutathiones to glutathione S-transferase. Biochim Biophys Acta. 2001;1548: 106–113. [DOI] [PubMed] [Google Scholar]
- 48.Cameron AD, Sinning I, L’Hermite G, et al. Structural analysis of human alpha-class glutathione transferase A1–1 in the apo-form and in complexes with ethacrynic acid and its glutathione conjugate. Structure. 1995;3:717–727. [DOI] [PubMed] [Google Scholar]
- 49.Quesada-Soriano I, Parker LJ, Primavera A, et al. Influence of the H-site residue 108 on human glutathione transferase P1–1 ligand binding: structure-thermodynamic relationships and thermal stability. Protein Sci. 2009;18:2454–2470. [DOI] [PMC free article] [PubMed] [Google Scholar]
- 50.Quesada-Soriano I, Parker LJ, Primavera A, et al. Diuretic drug binding to human glutathione transferase P1–1: potential role of Cys-101 revealed in the double mutant C47S/Y108V. J Mol Recognit. 2011;24:220–234. [DOI] [PubMed] [Google Scholar]
- 51.Koonin EV, Mushegian AR, Tatusov RL, et al. Eukaryotic translation elongation factor 1 gamma contains a glutathione transferase domain–study of a diverse, ancient protein superfamily using motif search and structural modeling. Protein Sci. 1994;3: 2045–2054. [DOI] [PMC free article] [PubMed] [Google Scholar]
- 52.Estela A, Pla-Martin D, Sanchez-Piris M, Sesaki H, Palau F. Charcot-Marie-Tooth-related gene GDAP1 complements cell cycle delay at G2/M phase in Saccharomyces cerevisiae fis1 gene-defective cells. J Biol Chem. 2011;286:36777–36786. [DOI] [PMC free article] [PubMed] [Google Scholar]
- 53.Yang J, Zhang Y. Protein structure and function prediction using I-TASSER. Curr Protoc Bioinformatics. 2015;52:1–15. [DOI] [PMC free article] [PubMed] [Google Scholar]
- 54.Yang J, Zhang W, He B, et al. Template-based protein structure prediction in CASP11 and retrospect of I-TASSER in the last decade. Proteins. 2016;84(Suppl 1):233–246. [DOI] [PMC free article] [PubMed] [Google Scholar]
- 55.Yang J, Zhang Y. I-TASSER server: new development for protein structure and function predictions. Nucleic Acids Res. 2015;43: W174–W181. [DOI] [PMC free article] [PubMed] [Google Scholar]
- 56.Helmich KE, Pereira JH, Gall DL, et al. Structural basis of stereospecificity in the bacterial enzymatic cleavage of beta-aryl ether bonds in lignin. J Biol Chem. 2016;291:5234–5246. [DOI] [PMC free article] [PubMed] [Google Scholar]
- 57.Rzepnikowska W, Kochanski A. A role for the GDAP1 gene in the molecular pathogenesis of Charcot-Marie-Tooth disease. Acta Neurobiol Exp (Wars). 2018;78:1–13. [PubMed] [Google Scholar]
- 58.Cassereau J, Chevrollier A, Gueguen N, et al. Mitochondrial dysfunction and pathophysiology of Charcot-Marie-Tooth disease involving GDAP1 mutations. Exp Neurol. 2011;227:31–41. [DOI] [PubMed] [Google Scholar]
- 59.Barneo-Munoz M, Juarez P, Civera-Tregon A, et al. Lack of GDAP1 induces neuronal calcium and mitochondrial defects in a knockout mouse model of charcot-marie-tooth neuropathy. PLoS Genet. 2015;11:e1005115. [DOI] [PMC free article] [PubMed] [Google Scholar]
- 60.Schindelin J, Arganda-Carreras I, Frise E, et al. Fiji: an open-source platform for biological-image analysis. Nat Methods. 2012;9:676–682. [DOI] [PMC free article] [PubMed] [Google Scholar]
- 61.Tian M, von Dahl CC, Liu PP, Friso G, van Wijk KJ, Klessig DF. The combined use of photoaffinity labeling and surface plasmon resonance-based technology identifies multiple salicylic acid-binding proteins. Plant J. 2012;72:1027–1038. [DOI] [PubMed] [Google Scholar]


