Abstract
Time-restricted feeding (TRF) has recently gained interest as a potential anti-aging treatment for organisms from Drosophila to humans.1–5 TRF restricts food intake to specific hours of the day. Because TRF controls the timing of feeding, not nutrient or caloric content, TRF has been hypothesized to depend on circadian-regulated functions; the underlying molecular mechanisms remain unclear. To exploit the genetic tools and well-characterized aging markers of Drosophila, we developed an intermittent TRF (iTRF) dietary regimen that robustly extended fly lifespan and delayed onset of aging markers in muscles and gut. We found that iTRF enhanced circadian-regulated transcription and that iTRF-mediated lifespan extension required both circadian regulation and autophagy, a conserved longevity pathway. Night-specific induction of autophagy was both necessary and sufficient to extend lifespan on ad lib diet and also prevented further iTRF-mediated lifespan extension. In contrast, day-specific induction of autophagy did not extend lifespan. Thus, these results identify circadian-regulated autophagy as a critical contributor to iTRF-mediated health benefits in Drosophila. Because both circadian regulation and autophagy are highly conserved processes in human aging, this work highlights the possibility that behavioral or pharmaceutical interventions stimulating circadian-regulated autophagy may provide people with similar health benefits such as delayed aging and lifespan extension.
iTRF extends Drosophila lifespan.
We tested four time-restricted feeding schedules, biased to nighttime fasting, for lifespan extension (Fig. 1a, Extended Data Fig. 1a). The control diet provided 24-hour access to food (ad libitum or ad lib). The standard time-restricted feeding (TRF) schedule (12-hour access to food during lights on, 12-hour fasting during lights off) did not extend lifespan relative to control diet unless limited to adult days 10–40; TRF-mediated lifespan extension was modest and inconsistent from trial to trial (Extended Data Fig. 1b-c).2,6 In contrast, 24-hour fasting (followed by 1–2 days of ad lib feeding)6 shortened lifespan, as shown previously (Extended Data Fig. 1d).6 By trial and error, we identified an intermediate feeding schedule that robustly extended lifespan (Fig. 1a). Flies fasted for 20 hours every other day, starting at mid-morning (6 hours after lights on or ZT6), with a recovery day of ad lib diet between fast days. Though maintaining this diet through old age did not extend lifespan, maintaining this diet for a 30-day window from 10–40 days old resulted in consistent, significant lifespan extension (Fig. 1b, Extended Data Fig. 1e-f). Shorter 10-day windows of this diet at different ages (days 10–20, 20–30, or 30–40) extended lifespan incrementally (Extended Data Fig. 2a-e); in contrast, a 10-day window of this diet with older flies (days 40–50) did not extend lifespan (Extended Data Fig. 2f-g). Relative to animals on ad lib diets, animals on this diet from days 10–40 had a mean lifespan increase of >18% (females) and 13% (males); hereafter, our experiments focused on females. We term this lifespan-extending dietary regimen “intermittent time-restricted feeding”, or iTRF.
Figure 1. intermittent Time-Restricted Feeding (iTRF) extends lifespan and healthspan without dietary restriction.
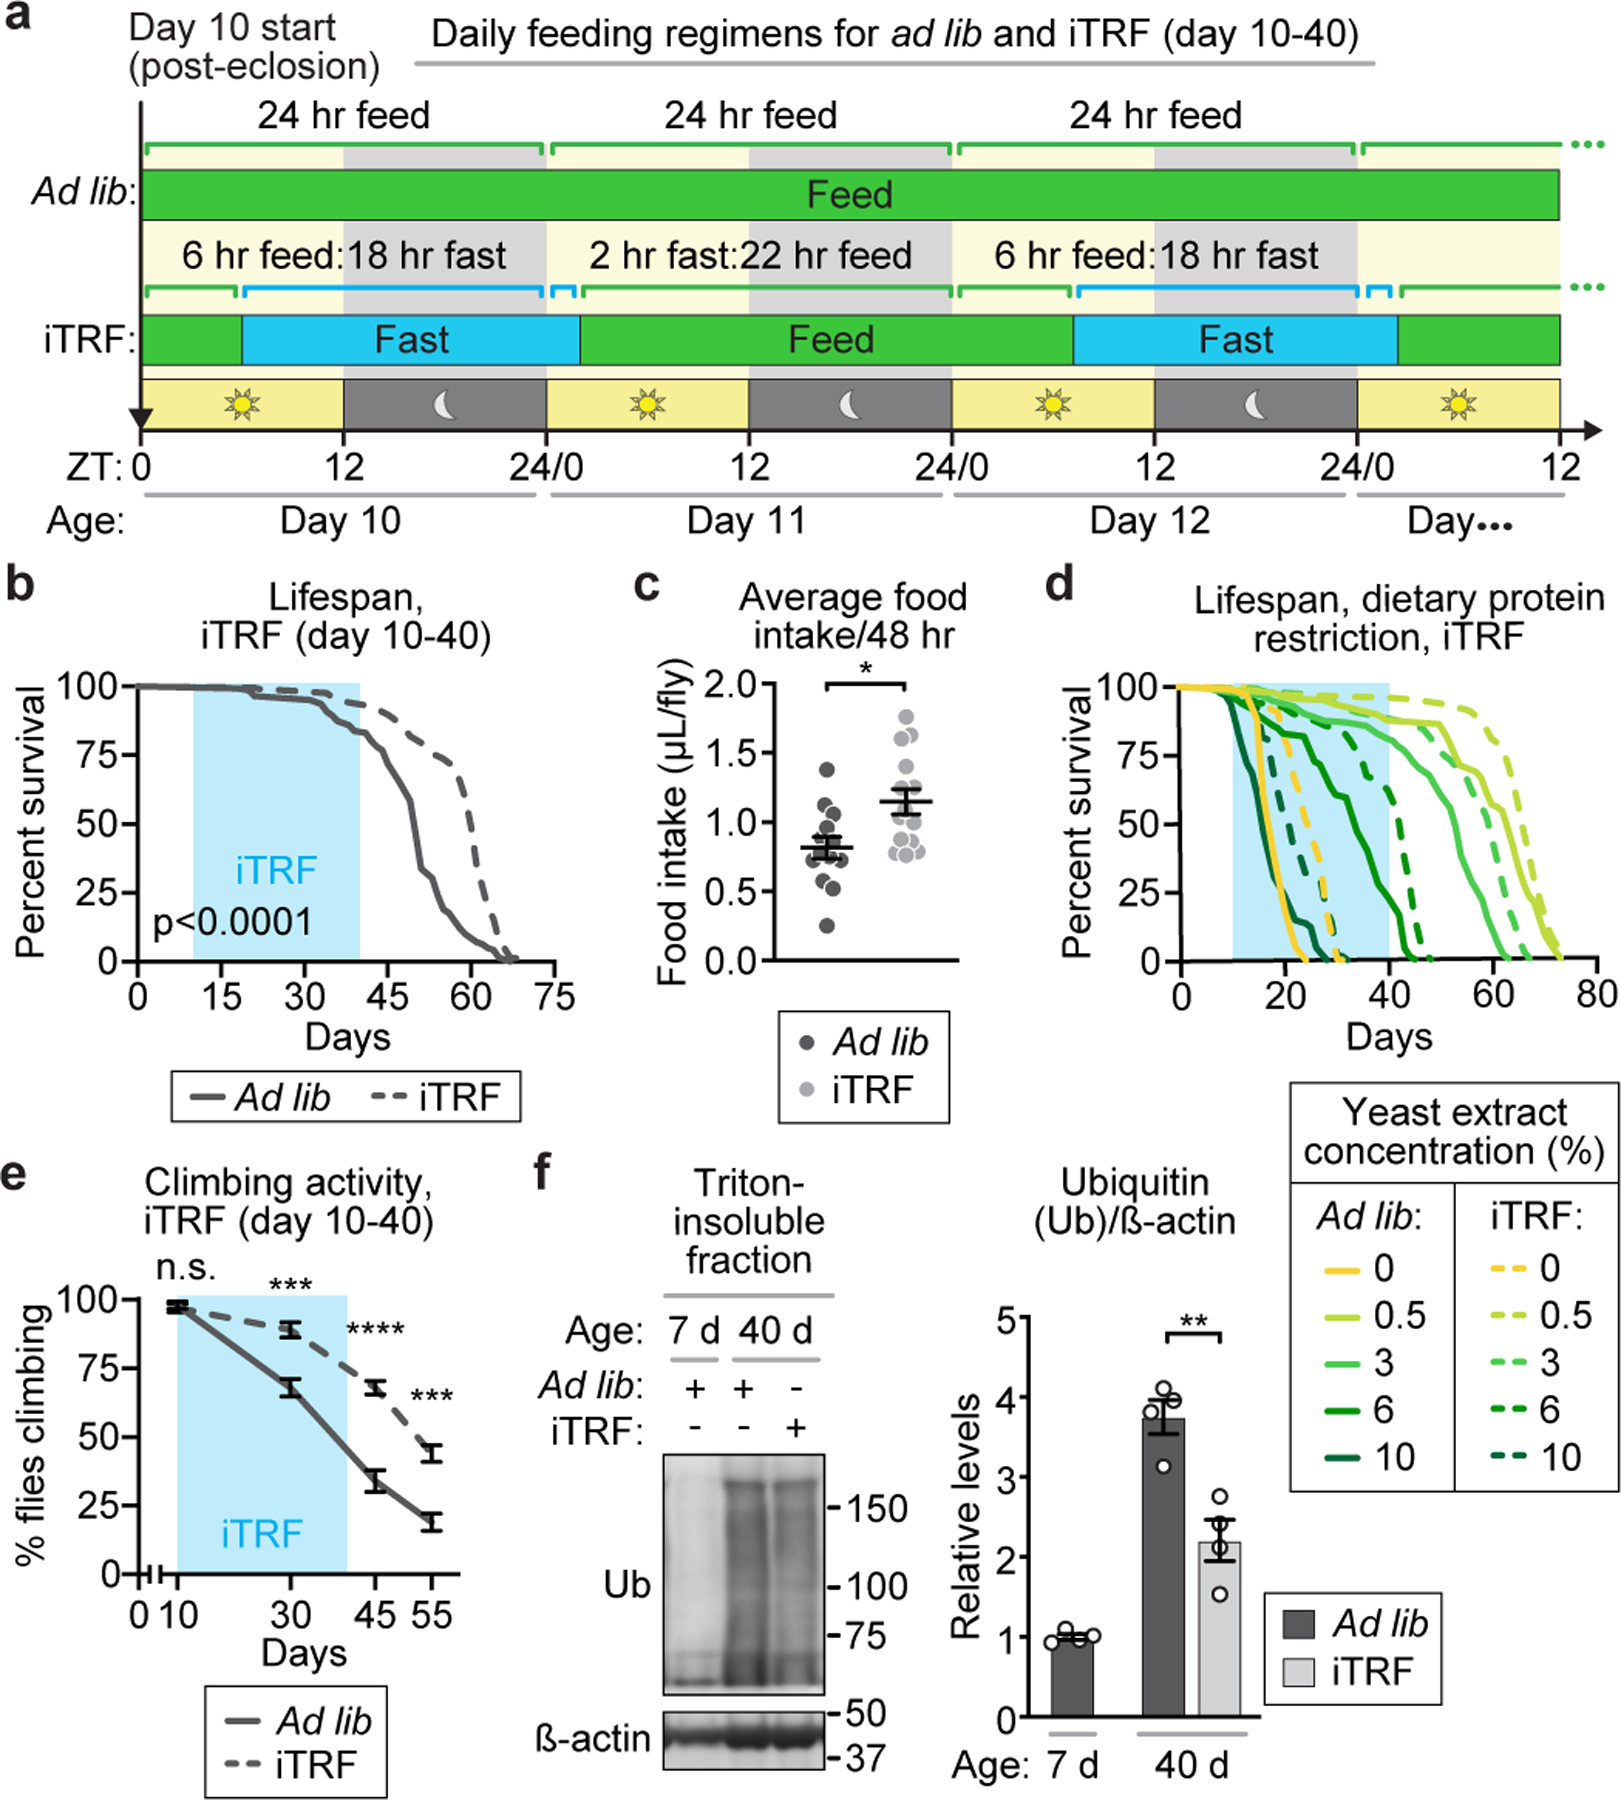
(a) Schematic of ad lib and iTRF diets. (b, d, e) Light blue boxes on graphs=duration of iTRF. (b) Relative to ad lib (solid, n=142), iTRF (dashed, n=205) extended lifespan (p<0.0001). (c) Relative to ad lib (dark gray, n=13), flies on iTRF have increased average food intake (light gray, n=14). (d) iTRF and dietary protein restriction (DR) additively extended lifespan (n>98 for each diet). (e, f) iTRF decreased age-related (e) declines in climbing activity (n=10 vials of 10 flies/genotype/condition/timepoint) and (f) increases in protein aggregation (n=4 biological replicates of 30 flies/genotype/condition/timepoint). (See Methods trials, statistics, and source data; n.s.=p>0.05, *=p<0.05, **=p<0.01, ***=p<0.001, ****=p<0.0001; n=number of flies unless otherwise specified; p-values obtained by unpaired two-tailed t-test (c, f), ANOVA followed by Tukey’s post-hoc test (e), and log-rank analysis (b, d). Center values=averages; error bars=SEM.)
iTRF differs from dietary restriction.
We first tested if iTRF causes caloric restriction, or decreased food intake, which is known to extend lifespan.1,7 To test food intake, we measured the feeding rates of flies on ad lib and iTRF diets over 3 cycles of fasting and refeeding via the CAFE assay.8,9 iTRF flies exhibited compensatory feeding during the recovery period (Extended Data Fig. 2h), resulting in slightly increased average food consumption over 48 hours (fast day plus feed day), relative to control animals on ad lib diet (Fig. 1c). Thus, iTRF does not extend lifespan by limiting nutrient intake.
In flies, two established lifespan-extending manipulations are Dietary protein Restriction (DR) and inhibition of insulin-like signaling.10 To test if iTRF acts via DR to extend lifespan, we titrated protein concentration with either ad lib or iTRF feeding regimens (Fig. 1d, Extended Data Fig. 2i). If iTRF acts solely via DR, we would not expect iTRF and DR to have additive effects. We found that iTRF and DR can act additively. Thus, iTRF-mediated lifespan extension can function independently of DR-mediated longevity. Similarly, though inhibition of insulin-like signaling, a conserved longevity pathway involved in DR longevity, was not complete, ablation of most insulin-producing cells allowed for typical iTRF-mediated lifespan extension of both controls and iTRF flies to similar magnitudes (Extended Data Fig. 2j). Together, these results suggest that iTRF-mediated lifespan extension is distinct from DR-mediated lifespan extension.
iTRF extends healthspan.
To assess the anti-aging effects of iTRF, we assayed known age-related changes in muscle/neuronal function, protein aggregation, and intestinal function. First, to assess overall muscle/neuronal function, we assayed climbing ability. iTRF flies exhibited less age-related decline in climbing ability relative to ad lib flies (Fig. 1e). Second, to measure conserved markers of age-related protein aggregation, we extracted Triton-insoluble fractions from whole-fly extracts of iTRF and ad lib flies both pre- and post-iTRF intervention (7 and 40 days old) followed by western blot analysis for Ubiquitin (Fig. 1f) and the Drosophila ortholog of p62/SQSTM1/ref(2)P (hereafter p62) (Extended Data Fig. 3a-b). For both markers, iTRF flies had decreased levels in the insoluble fraction relative to control (ad lib) flies, demonstrating less aging-related protein aggregation. Third, we directly measured protein aggregation in muscle using anti-polyubiquitin and anti-p62 antibodies with confocal immunofluorescence microscopy. Again, relative to ad lib controls, iTRF significantly decreased the number and area of polyubiquitin and p62 aggregates in the flight muscle of aged flies (Extended Data Fig. 3c-e). Fourth, because decreased intestinal function is another conserved marker of aging, we measured aging-related intestinal stem cell over-proliferation, intestinal integrity, and intestinal microbial load. iTRF decreased these intestinal aging markers relative to ad lib controls (Extended Data Fig. 3f-h). Finally, because diet impacts intestinal microbes, which impact aging, we tested if iTRF-mediated lifespan extension depends on fly-associated microbes. Treatment with antibiotics during both fasting and feeding phases depleted associated microbes to nearly non-detectable levels (Extended Data Fig. 3h); iTRF caused the same lifespan extension in antibiotic-treated flies as vehicle controls, suggesting that iTRF-mediated lifespan extension does not depend on fly-associated microbes (Extended Data Fig. 3i-j). Together, these results demonstrate that iTRF decreased multiple aging parameters relative to ad lib controls and suggest that iTRF extends lifespan by increasing healthspan and delaying aging.
iTRF requires intact circadian clock.
Because iTRF does not alter dietary composition but controls the timing of feeding, we examined the role of circadian clock components, which regulate the timing of physiological functions. Circadian clock components are highly conserved among animals11,12 and regulate 24-hour oscillations in transcription, which underlie 24-hour oscillations in physiology and behavior.13,14 The core circadian clock components form a transcriptional negative feedback loop15: in Drosophila, Clock (Clk) and Cycle (Cyc) proteins activate the transcription of hundreds of genes, including many metabolic genes3,7, and the circadian regulators period (per) and timeless (tim), whose gene products inhibit Clock and Cycle activity (Fig. 2a).
Figure 2. Core circadian clock components are required for iTRF-mediated lifespan and healthspan extension.
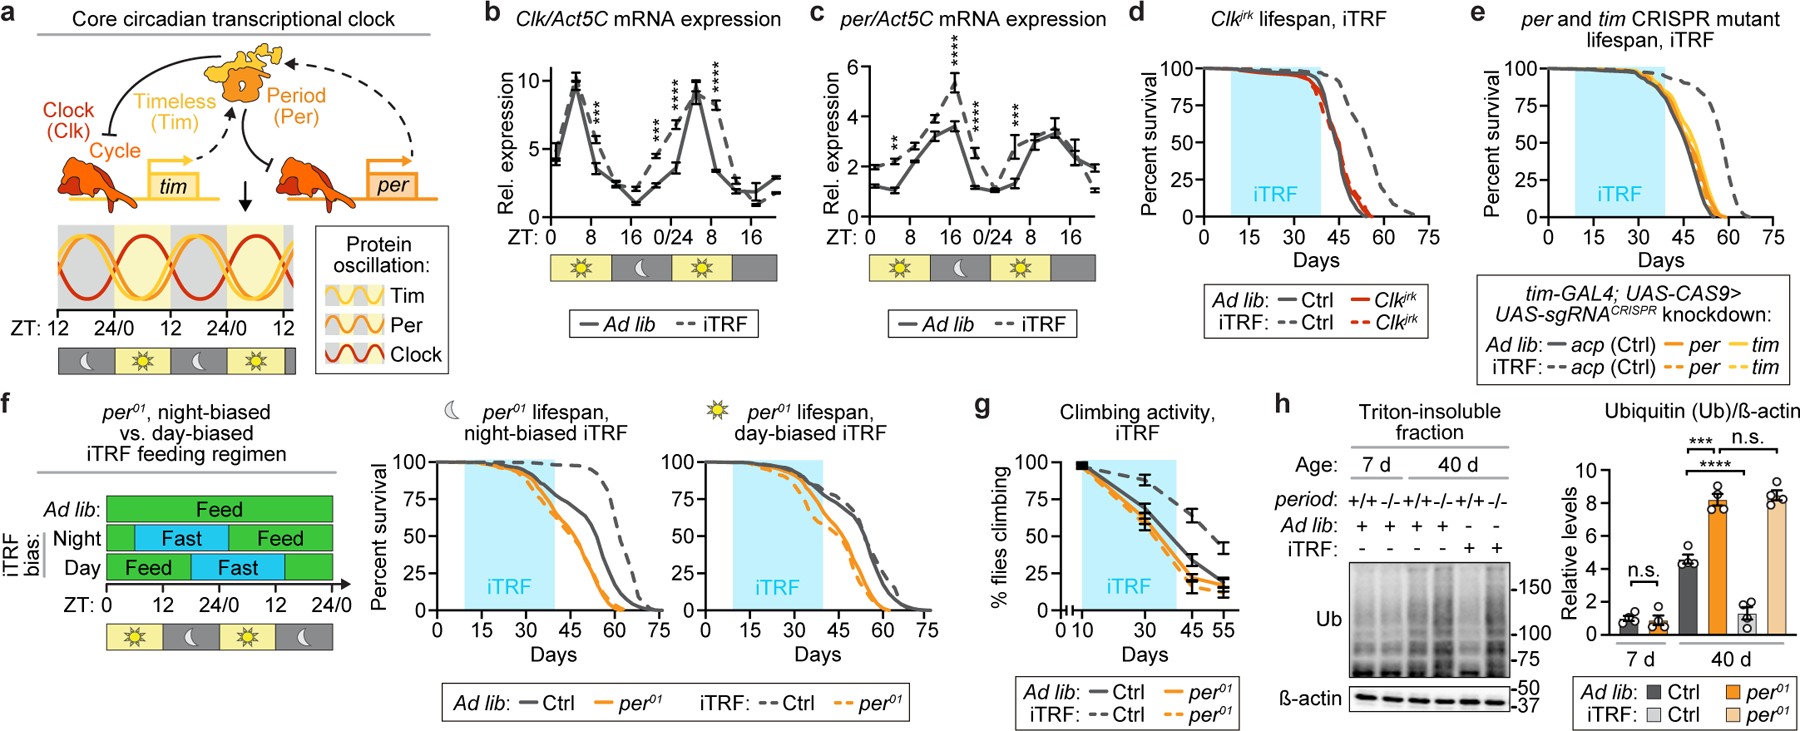
(a) Schematic of the core circadian clock. (b-c) Relative to ad lib diet (solid), iTRF (dashed) enhanced circadian expression of (b) clock and (c) period during fasting (n=4 biological replicates of 30 flies/condition/timepoint; unmarked=n.s.). (d-g) Light blue boxes on graphs=duration of iTRF. (d-e) Relative to ad lib diet (solid), iTRF (dashed) extended the lifespans of controls (gray, ad lib n=145–199, iTRF n=231–262) but not (d) Clkjrk (red-orange, ad lib n=143, iTRF n=196), (e) timCRISPR (gold, ad lib n=228; iTRF n=262 and perCRISPR (orange, ad lib n=179; iTRF n=192) mutants. (f) In contrast to night-biased iTRF (left, dashed gray, n=322), day-biased iTRF (right, dashed gray, n=286) did not extend lifespan relative to ad lib diet (solid gray, n=553); per01 mutants (orange) were not affected by night- or day-biased iTRF (n=209–218). (g-h) Relative to ad lib diet (solid line or dark shade), iTRF (dashed line or light shade) inhibited two aging markers in controls (gray) but not per01 mutants (orange): (g) declines in climbing activity (n=10 vials of 10 flies/genotype/condition/timepoint); and (h) increased protein aggregation (n=4 biological replicates of 30 flies/genotype/condition/timepoint). (See Methods for trials, statistics, and source data; n.s.=p>0.05, **=p<0.01, ***=p<0.001, ****=p<0.0001; n=number of flies unless otherwise specified; p-values obtained by ANOVA followed by Tukey’s post-hoc test (b-c, g-h) and log-rank analysis (d-f). Center values=averages; error bars=SEM.)
Others have shown that TRF regimens enhance circadian gene expression.1,3,16–20 To confirm this effect with iTRF, we performed qRT-PCR analysis of animals on ad lib and iTRF diets every 4 hours for 48 hours. iTRF broadened the daytime peak of clock expression (Fig. 2b) and increased the amplitude of per and tim gene expression, specifically during the night/fasting phase (Fig. 2c, Extended Data Fig. 4a). Thus, similar to other TRF regimens, iTRF enhances circadian gene expression.
To test if circadian clock components are required for iTRF-mediated lifespan extension, we compared several arrhythmic circadian mutants and their genetic controls on ad lib and iTRF diets: Clkjrk, cyc01, per01, and tim01 mutants and mutants with CRISPR-mediated disruption of per (perCRISPR) or tim (timCRISPR) (Fig. 2d-e, Extended Data Fig. 4b-c).21,22 While genetic controls exhibited significant lifespan extension on iTRF, circadian mutants did not. As shown previously, per01 and cyc01 mutants responded normally to DR (Extended Data Fig. 4d-e).23 Starvation and feeding assays confirmed that, like controls, per01 mutants did not die during or after 20-hour fast periods and compensated for fast periods with increased feeding (Extended Data Fig. 4f-g).22,23 Together, our results suggest that iTRF-mediated lifespan extension requires a functional circadian clock.
To test if iTRF-mediated lifespan extension requires a night-biased fast period, we tested day-biased iTRF, shifted by 12 hours (ZT18 to ZT14 the following day), with mainly daytime-fasting. While night-biased iTRF significantly extended lifespan relative to ad lib controls, day-biased iTRF did not (Fig. 2f). per01 mutants were unaffected by either iTRF regimen. This result suggests that night-biased fasting is required for iTRF lifespan extension.
To test if iTRF-mediated healthspan extension is circadian clock-dependent, we measured climbing ability and ubiquitinated protein accumulation for young and old per01 mutants and genetic controls on iTRF or ad lib diets. While iTRF preserved climbing ability and lowered ubiquitinated protein levels in controls relative to ad lib diets, per01 mutants did not respond to iTRF and exhibited aging-related declines in climbing ability and increased protein aggregation similar to per01 mutants on an ad lib diet (Fig. 2g-h, Extended Data Fig. 4h-i). Thus, iTRF-mediated lifespan and healthspan extension require a functional circadian clock and night-biased fasting.
iTRF requires autophagy components.
Because TRF involves fasting, we examined the role of autophagy, a starvation-induced cellular process to recycle macromolecules (Fig. 3a).24,25 We first used qRT-PCR to test if two conserved autophagy mediators, Atg1 and Atg8a (mammalian homologs ULK1 and LC3, respectively), are circadian-regulated in Drosophila. Consistent with other model organisms and cell culture results26,27, both atg1 and atg8a were circadian-regulated in flies, with night-time expression peaks (Fig. 3b-c, solid lines). Similar to circadian genes, iTRF enhanced night-time expression of atg1 and atg8a in controls (Fig. 3b-c, dashed lines) but not per01 mutants (Extended Data Fig. 5a-b). Thus, expression of two key autophagy genes is circadian-regulated and enhanced by iTRF.
Figure 3. Autophagy mediators are required for iTRF-mediated lifespan extension.
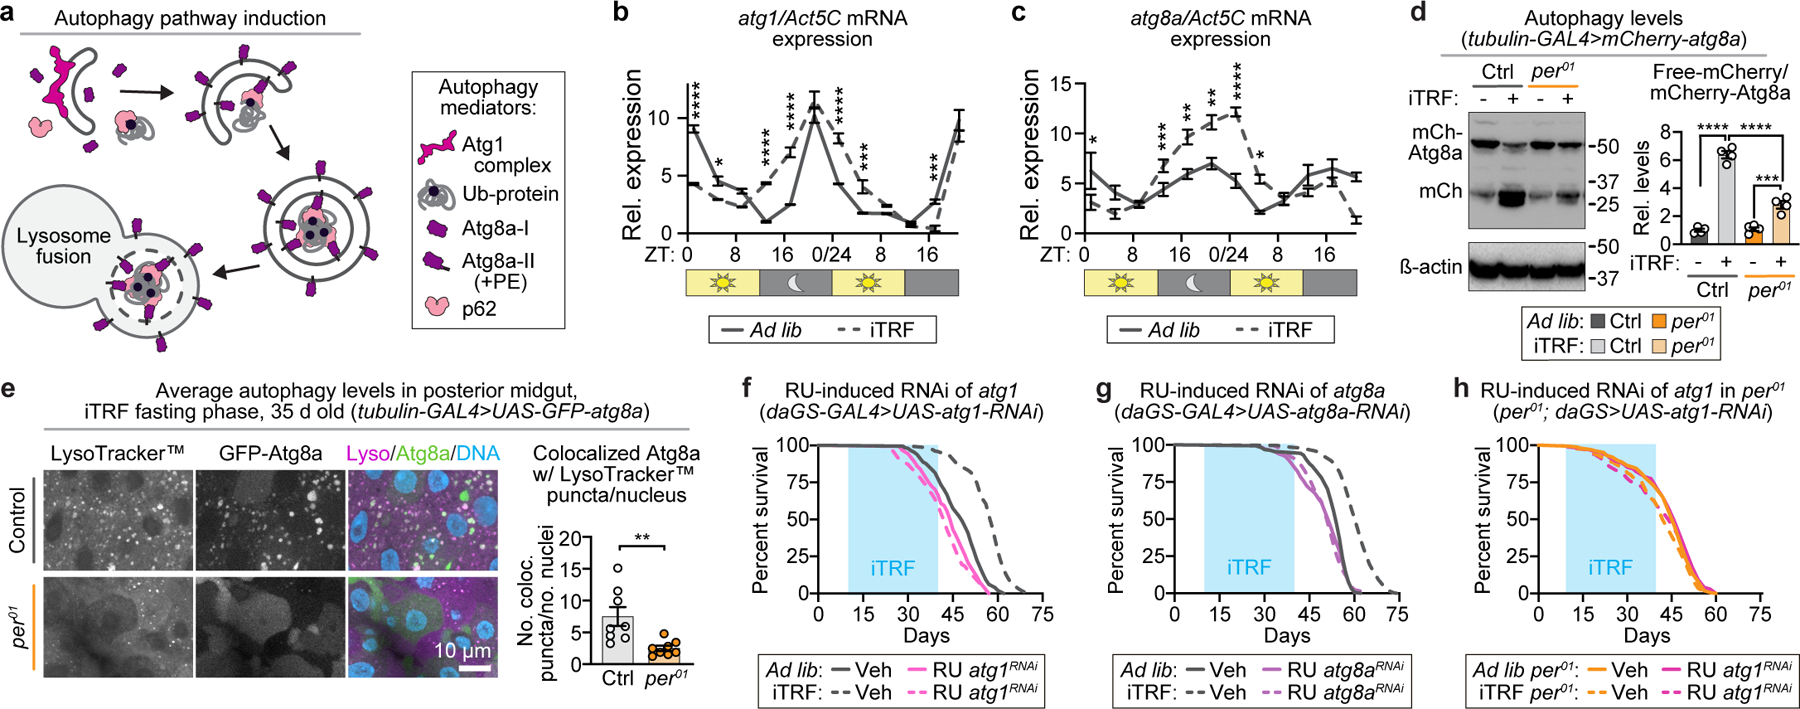
(a) Schematic of core autophagy mediators. (b-c) atg1 and atg8a expression were circadian-regulated; iTRF (dashed) enhanced night-peaking (b) atg1 and (c) atg8a expression relative to ad lib diet (solid); each n=4 biological replicates of 30 flies/ condition/timepoint (unmarked=n.s.). (d) iTRF (light gray) increased the ratio of free mCherry to mCherry-Atg8a in controls relative to ad lib (dark gray) and, to lesser extent, in per01 mutants (ad lib, orange; iTRF, light orange); each n=4 biological replicates of 30 flies/genotype/condition. (e) LysoTracker™ (magenta), GFP-Atg8a (green), and DNA (blue) staining revealed that control iTRF flies had increased autolysosomes in their intestines (light gray, n=8 guts) compared to per01 mutants (light orange, n=8 guts), scale bar=10 µm. (f-h) Light blue boxes on graphs=duration of iTRF. Relative to ad lib diets (solid), iTRF (dashed) extended the lifespans of controls (gray, ad lib (f) n=195, (g) n=169) iTRF (f) n=263, (g) n=238) but not flies with RNAi-mediated knockdown of (f) atg1 (pink, ad lib n=158, iTRF n=179) or (g) atg8a (purple, ad lib n=151, iTRF n=152) in control backgrounds or (h) in per01 backgrounds (per01mutant, orange, ad lib n=161, iTRF n=167; per01 mutant with atg1-RNAi, hot pink, ad lib n=169, iTRF n=174). (See Methods for trials, statistics, and source data; n=number of flies unless otherwise specified; n.s.=p>0.05, *=p<0.05, **=p<0.01, ***=p<0.001, ****=p<0.0001; p-values obtained by ANOVA followed by Tukey’s post-hoc test (b-d), unpaired two-tailed t-test (e), and log-rank analysis (f-h). Center values= averages; error bars=SEM.)
To test if iTRF induces autophagy, we measured signaling markers of autophagy, autophagic flux, and autophagosome/autolysosome formation. We compared genetic controls and per01 mutants on iTRF and ad lib diets, predicting that, if autophagy is a key circadian-regulated function in iTRF, per01 mutants would not respond. We first examined two signaling markers associated with autophagy induction: increased AMPK phosphorylation and decreased S6K phosphorylation.28 Consistent with iTRF-enhanced circadian-regulated autophagy, iTRF increased night-time phospho-AMPK and decreased night-time phospho-S6K relative to ad lib diets for genetic controls but not per01 mutants (Extended Data Fig. 5c-d). Next, we measured autophagic flux in control and per mutants on both ad lib and iTRF diets using mCherry-tagged Atg8. The ratio of free mCherry to mCherry-Atg8a reflects autophagic activity because Atg8a is rapidly destroyed in the lysosome during autophagy while mCherry is more stable.29,30 iTRF induced high levels of autophagy in controls relative to ad lib diet and significantly less in per01 mutants (Fig. 3d). Finally, we directly monitored autophagosome formation, lysosome abundance, and autolysosome formation in the intestine via live fluorescence imaging of the autophagosome marker GFP-Atg8a relative to the lysosomal marker LysoTracker™.30,31 iTRF increased active autolysosomes in controls relative to ad lib diet but not in per01 mutants (Fig. 3e, Extended Data Fig. 5e). Thus, iTRF induction of autophagy correlates with lifespan extension and depends on the circadian clock.
To determine if autophagy components are required for iTRF-mediated lifespan extension, we first manipulated autophagy-regulatory AMPK and TOR signaling pathways by driving expression of dominant-negative (DN) or constitutively active (CA) AMPK and S6K.32,33 On ad lib diet, these known aging regulators had expected effects, with pro-autophagy manipulations extending lifespan and autophagy inhibition shortening lifespan (Extended Data Fig. 6a-d, solid lines). On iTRF, while DN-S6K did not affect iTRF-mediated lifespan extension, DN-AMPK, CA-AMPK, and CA-S6K partially inhibited iTRF-mediated lifespan extension (~10%) relative to controls (>18%) (Extended Data Fig. 6a-d, dashed lines). Thus, in contrast to insulin signaling (Extended Data Fig. 2j), manipulation of these autophagy regulatory pathways affected iTRF-mediated lifespan.
To test the role of Atg1 and Atg8a directly, we knocked down atg1 and atg8a expression using UAS-RNAi-mediated knockdown via a ubiquitous inducible driver (daughterless-GeneSwitch-GAL4 or daGS-Gal4).34 This experiment also tested for developmental effects, as flies were fed the inducing drug RU486 or vehicle control starting at adult day 5. RNAi knockdown of atg1 or atg8a in controls prevented iTRF-mediated lifespan extension (Fig. 3f-g) and atg1 knockdown in per01 mutants had no effect (Fig. 3h). RU486 feeding alone did not affect lifespan extension of flies lacking UAS-RNAi transgenes (Extended Data Fig. 6e-f). Together, these data suggest that activation of autophagy is necessary for iTRF-mediated longevity.
iTRF requires circadian autophagy.
To test if circadian manipulation of autophagy impacts iTRF-mediated health benefits, we exploited circadian promoters and the UAS-GAL4 system (Fig. 4a).35 We used per-GAL4 and tim-GAL435 to drive high night-time and low day-time expression of RNAi constructs against atg1 and atg8a, respectively, confirming gene and protein expression by qRT-PCR and western blot analysis (Fig. 4b, Extended Data Fig. 7a). Flies with night-time RNAi knockdown of atg1 or atg8a did not respond to iTRF (Extended Data Fig. 7b-c), suggesting that night-time atg1 and atg8a expression are required for iTRF-mediated lifespan extension.
Figure 4. Increasing circadian-regulated expression of autophagy-promoting genes is sufficient for the health benefits of iTRF.
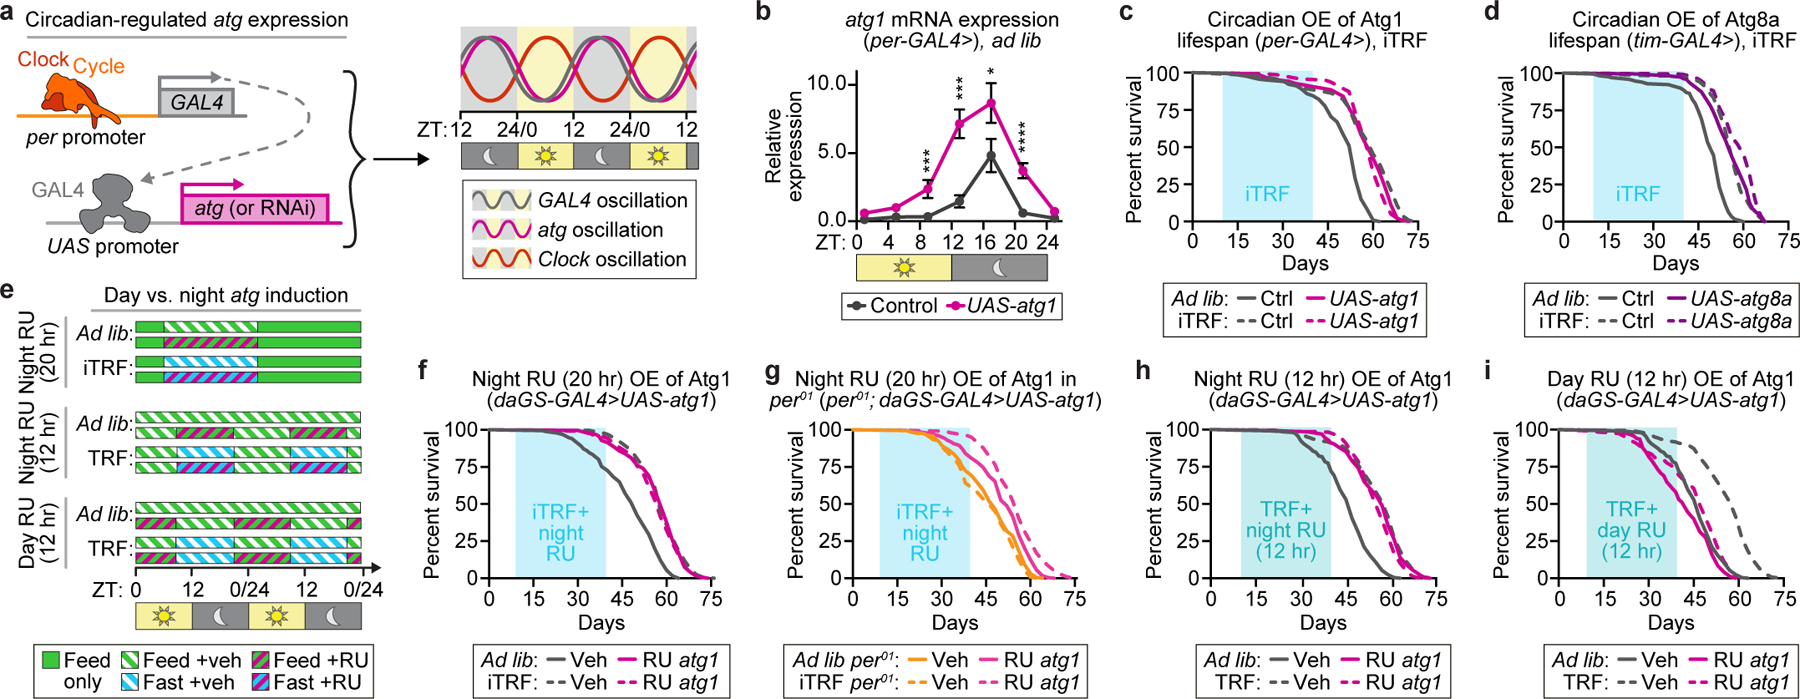
(a) Schematic of genetic method to knockdown (or overexpress) autophagy components with circadian rhythmicity. (b) per-GAL4 driven atg1 expression (magenta) enhanced circadian, night-peaking atg1 gene expression (gray); each n=4 biological replicates of 30 flies/genotype/timepoint (unmarked=n.s.). (c-d, f-i) Light blue boxes on graphs=duration of iTRF (sky blue) or TRF (aqua) diets. (c-d) Relative to controls (solid gray, n=169–206), genetic circadian overexpression of (c) atg1 (solid magenta, n=139) or (d) atg8a (solid purple, n=191) caused lifespan extension on ad lib diets (solid lines) similar to controls on iTRF (dashed gray, n=139–263) that was not further extended by iTRF (atg1, dashed magenta, n=141; atg8a, dashed purple, n=228). (e) Schematic of pharmacological methods to overexpress atg1 at different times of day. (f) RU486 (RU)-induced atg1 overexpression at night extended lifespan on ad lib diet (solid magenta, n=197) relative to ad lib controls (solid gray, n=186), extending lifespan similar to iTRF controls (dashed gray, n=232) and not further extended by iTRF (dashed magenta, n=329). atg1 overexpression extended lifespan less in (g) per01 mutants (per: ad lib, solid orange, n=192; iTRF, dashed orange, n=245; per with night atg1 OE: ad lib, solid pink, n=225; iTRF, dashed pink, n=345). (h, i) Relative to ad lib controls (solid gray, n=208), shifted-TRF controls (dashed gray, n=363) and 12-hour RU-induced overexpression of atg1 (solid magenta, n=236–290) extended lifespan non-additively (dashed magenta, n=192–341) (h) during the night phase but (i) not during the day phase. (See Methods for trials, statistics, and source data; n=number of flies unless otherwise specified; n.s.=p>0.05, *=p<0.05, ***=p<0.001, ****=p<0.0001; p-values obtained by ANOVA followed by Tukey’s post-hoc test (b), and log-rank analysis (c-d, f-i). Center values=averages; error bars=SEM.)
Because increased autophagy is known to extend lifespan24, we tested if circadian-regulated induction of autophagy with per-GAL4 and tim-GAL4 driving atg1 and atg8a, respectively, is sufficient for iTRF lifespan extension. The stronger tim-GAL4 driver induced early lethality in combination with atg1.36 Flies with night-specific over-expression of atg1 or atg8a not only exhibited iTRF-like lifespan extension on an ad lib diet, but also exhibited no additional lifespan extension on iTRF (Fig. 4c-d). This suggests that, if circadian-regulated autophagy is already enhanced, iTRF has no effect. tim-GAL4 driven mCherry-tagged Atg8a expression had similar results (Extended Data Fig. 7d) and western blot analysis confirmed circadian oscillation of protein levels as well as induction of autophagy (Extended Data Fig. 7a). These results suggest that enhancing circadian-regulated autophagy is a major mechanism driving iTRF-mediated lifespan extension.
To confirm that lifespan extension reflects delayed aging, we tested atg1 RNAi and overexpression mutants and controls on ad lib and iTRF diets for age-related declines in climbing ability and increased protein aggregation. Consistent with circadian atg1 requirement for lifespan extension, circadian knockdown of atg1 prevented iTRF-mediated healthspan extension (Extended Data Fig. 8a-b). Similarly, circadian overexpression of atg1 caused iTRF-like healthspan extension on ad lib diet, with no additional improvement on iTRF (Extended Data Fig. 8c-d). This suggests that circadian expression of atg1 is both necessary and sufficient for iTRF-mediated lifespan and healthspan extension.
To pharmacologically enhance circadian-regulated expression, we used the RU486-inducible daGS-GAL4 to overexpress atg1 in flies on ad lib diet during the night/fasting phase (Fig. 4e, Extended Data Fig. 9a). Similar to per-GAL4 driving atg1, night-specific RU-induced over-expression of atg1 was sufficient for iTRF-like lifespan extension on ad lib diet and inhibited further lifespan extension on iTRF (Fig. 4f). RU-induced atg1 over-expression in per01 mutants, which normally have lower iTRF-induced autophagy gene expression and function (Fig. 3d-e, Extended Data Fig. 5a-e), caused modest lifespan extension on both ad lib and iTRF diets (Fig. 4g), suggesting that atg1 expression in per01 mutants was not by itself sufficient for full response to iTRF.
Because night-specific RU-induced autophagy was sufficient for iTRF-like lifespan extension, we tested day-specific RU-induced autophagy. We developed a night-biased shifted 12:12 TRF regimen with 12-hour fast (ZT9–21) and 12-hour feeding (ZT21–9), without recovery days; the 3-hour offset from lights off removed the evening meal and allowed sufficient fasting for robust lifespan extension similar to iTRF (Fig. 4e). Similar to this shifted 12:12 TRF, night-specific 12-hr RU induction of atg1 (ZT9–21) produced iTRF-like lifespan extension that resisted further TRF lifespan extension (Fig. 4h). In contrast, day-specific fasting and/or RU treatment (ZT21–9) did not extend lifespan (Fig. 4i). per01 mutants did not respond to shifted TRF (Extended Data Fig. 9b-c). These data suggest that night-specific enhanced atg1 expression is both necessary and sufficient for iTRF-mediated lifespan extension (Extended Data Fig. 9d). Together, our results support the hypothesis that clock-dependent enhancement of macroautophagy mediates the effects of iTRF-mediated lifespan extension.
Both circadian regulation and autophagy control aging and lifespan.28,37 Here we identified circadian clock components (Timeless, Period, Cycle, and Clock) and essential autophagy components Atg1 and Atg8a as both necessary and sufficient for the anti-aging, lifespan-extending benefits of iTRF. While a previous mouse study had found that TRF-mediated protection against high-fat diet did not require the circadian clock, a recent fly study confirmed our finding that iTRF-mediated lifespan extension requires a functional circadian clock.38 With a diversity of cellular autophagy targets (proteins, lipids, nucleotides, organelles), identifying the major tissues and specific targets involved in iTRF-mediated, autophagy-associated health benefits are challenges for future work. Aging is a major risk factor for mortality, triggering pathological processes that contribute to metabolic, cardiovascular, and neurodegenerative diseases. As a simple dietary intervention strategy, intermittent time-restricted feeding appears to be both efficient and pleiotropic, with health benefits for multiple tissues, and offers a potential method of choice to combat aging.
Methods:
Fly strains
w1118 Canton-S (CS) were used as a “wild-type” strain throughout this manuscript. UAS-DN-S6K (6911), UAS-CA-S6K (6914), UAS-DN-AMPK (32112), UAS-CA-AMPK (32110), UAS-atg1-RNAi (44034), UAS-atg8a-RNAi (34340), and UAS-atg1 (51654) were obtained from the Bloomington Stock Center and outcrossed to w1118 Canton-S (CS) for at least 10 generations. tubulin-GAL4 flies were obtained from John Carlson, UAS-mCh-atg8a and UAS-GFP-Atg8a from Eric Baehrecke, and daughterless-Gene-Switch (daGS) from David W. Walker; all were outcrossed to w1118 Canton-S (CS) for at least 10 generations. period (per01) mutants, timeless-GAL4, and period-GAL4 were obtained from Jaga Giebultowicz and, because they were last outcrossed many years ago, were outcrossed to w1118 Canton-S (CS) for 12 generations in the last 2 years. UAS-gRNA, UAS-CAS9 lines were those utilized in our previous papers and were outcrossed to w1118 Canton-S (CS) for five generations.22,39 Previously outcrossed cycle (cyc01) mutants were obtained from Sheyum Syed with a CS control strain. All experiments with multiple transgenes used flies that have undergone 12 generations of out-crossing into a w1118 Canton-S (CS) control and/or per01, w1118 Canton-S (CS) mutant background.
Fly media
Developmental media consisted of standard yeast-cornmeal-agar media (Archon Scientific, Glucose recipe: 7.6% w/v glucose, 3.8% w/v yeast, 5.3% w/v cornmeal, w/v 0.6% agar, 0.5% v/v propionic acid, 0.1% w/v methyl paraben, 0.3% v/v ethanol). Adult flies that eclosed within a 24-hour period were collected and transferred to “adult medium” containing 4% glucose, 2% sucrose, 8% cornmeal, 1% agar, and either 0%, 0.5%, 1%, 2%, 3%, 6%, or 10% yeast extract (Difco) supplemented with 1.5% methylparaben mix (10% methylparaben dissolved in ethanol) and 1% propionic acid for lifespan and biochemical analysis. Food for ad lib, iTRF, TRF, and shifted TRF diets was adult medium with 3% yeast extract. All percentages given in w/v except methylparaben mix, propionic acid given in v/v. Fasting media consisted of 1% agar in ddH2O made fresh daily. Food for Activity Recording CAFE (ARC) assays is described below.
Drug Supplementation in media for lifespan
All drugs were supplemented into cooled (65ºC) liquid adult medium (containing 3% yeast extract) following preparation to the following final concentration(s): For RNAi experiments RU486 (Cayman Chemical) was dissolved in ethanol and supplemented into medium after day 5 post-eclosion at a final concentration of 100 μg/mL; vehicle controls were supplemented with same volume of ethanol alone. Timed RU486 feeding of daGS>UAS-atg1 consisted of flies being fed 0.5 μg/mL in standard adult media or fasting media only during the fasting phase, then flipped to vehicle control food the following morning only from days 10–40 of adulthood. Vehicle only controls were flipped at the same time for consistency. For gut microbe clearance, the medium contained 500 μg/mL ampicillin, 50 μg/mL tetracycline, and 200 μg/mL rifamycin in 50% ethanol and the same volume of 50% ethanol alone was used as the vehicle control.
Lifespan analysis
Drosophila were reared from embryos in low-density bottles with standard yeast-cornmeal-agar media listed above (Archon Scientific). Newly eclosed flies (~24 hours post-eclosion) were collected onto adult medium w/ 3% yeast extract and allowed to mate for 48 hours. Female and male flies were separated and maintained at a density of 30–35 flies per vial in a humidified (65%), temperature-controlled (25ºC) incubator with a 12-hour light-dark cycle. All flies were raised on ad lib conditions until day 10 post-eclosion upon which flies were placed on various feeding regimes (Extended Data Figure 1a). For consistency, ad lib control flies were flipped on to fresh food at the same time as experimental diet flies were transferred to fasting media, and once again when fasting flies were flipped on to regular adult media. Death was scored at time of flipping, and lifespan compared by log-rank analysis.
Activity Recording CAFE (ARC) Assay
Feeding data from individual flies were collected as described previously9,40. Feeding medium was a solution of 4% dextrose, 2% sucrose, and 3% yeast extract in ddH2O, filtered (0.2-µm cellulose acetate sterile syringe filter, VWR). Flies were transferred to fresh standard medium every other day until the experiment. When the flies were 9–11 days old, the animals were loaded by mouth pipette into standard ARC chambers and allowed to acclimate overnight (~18 hours) with access to the test diet in a glass capillary pipette. The capillaries were replaced daily with those containing fresh food or ddH2O. The meniscus level of each capillary was tracked for the entire duration of the feeding periods at 1-second intervals. Drops in meniscus position above a pre-calibrated threshold were considered feeding events, and feeding bouts less than 2 minutes apart were considered to be part of the same meal. The volume consumed from each feeding event was automatically calculated and collated with a custom Python code9,40.
Intestinal barrier dysfunction “smurf” assay
The “smurf fly”/intestinal barrier dysfunction assay was performed as previously described.41,42 Flies were aged on standard adult medium (see “Fly media“ above) until the day of the smurf assay. Dyed medium was prepared by the addition of FD&C Blue No. 1 at a final concentration of 2.5% w/v. A fly was counted as a smurf when dye coloration was observed outside the digestive tract. Comparisons of smurf proportion per time point were carried out using binomial tests to calculate the probability of having as many smurfs in population A as in population B, as well as ANOVA for proportions of smurf flies per replicate vial with a minimum of 7 vials of 12–31 flies per replicate.
Quantitative real-time PCR (qRT-PCR)
35-day-old female flies on either ad lib or iTRF conditions were collected for RNA extraction over the course of 48 hours in 4-hour intervals. 4 biological replicates of 30 female flies per timepoint and feeding regimen were snap-frozen in liquid nitrogen, and stored at −80ºC. RNA was extracted using TRIzol (Invitrogen) following the manufacturer’s protocol. Samples were treated with DNaseI (Invitrogen), then heat inactivated. cDNA was synthesized by Revertaid First Strand cDNA Synthesis Kit (Thermo Scientific). PowerUp SYBR Mastermix (Applied Biosystems) was used to perform qRT-PCR using a CFX-Connect thermal cycler (BioRad). Primer efficiency and relative quantification of transcripts were determined using a standard curve of serial diluted cDNA. Transcripts were normalized using Actin5C as a reference gene. The Jonckheere-Terpstra-Kendall (JTK) algorithm was applied using the JTK-Cycle package in R software43 to determine significance of rhythmic cycling. Differences between individual timepoints were determined by ANOVA followed by multiple comparison tests.
qRT-PCR primers:
period—fwd- GGTTGCTACGTCCTTCTGGA
period—rev- TGTGCCTCCTCCGATATCTT
timeless—fwd- CCGTGGACGTGATGTACCGCAC
timeless—rev- CGCAATGGGCATGCGTCTCTG
clock—fwd- GGATAAGTCCACGGTCCTGA
clock—rev- CTCCAGCATGAGGTGAGTGT
atg1—fwd- GCTTCTTTGTTCACCGCTTC
atg1—rev- GCTTGACCAGCTTCAGTTCC
atg8a—fwd- AGTCCCAAAAGCAAACGAAG
atg8a—rev- TTGTCCAAATCACCGATGC
actin5C—fwd- TTGTCTGGGCAAGAGGATCAG
actin5C—rev- ACCACTCGCACTTGCACTTTC
16Sr—fwd- AGAGTTTGATCCTGGCTCAG
16Sr—rev- CTGCTGCCTYCCGTA
Microbial load quantification
For 16S bacterial rDNA quantification, 4 replicates of 10 whole flies (washed twice in 70% ethanol, and twice in PBS) were used for total DNA extraction via the Power Soil DNA isolation kit (Qiagen). Universal primers for the 16S ribosomal RNA gene were against variable regions 1 (V1F) and 2 (V2R), as previously published.44
Western blot analysis
Whole-body lysates of female flies (30 flies/genotype/condition/timepoint) were separated by SDS-PAGE using standard procedures. Membranes were probed with antibodies against AMPK phospho-T184 at 1:1000 dilution (Cell Signaling, 40H9); anti-phospho-S6K T398 (Cell Signaling, 9209), mCherry (Cell signaling, E5D8F), and horseradish peroxidase (HRP)-conjugated monoclonal mouse anti-actin antibody at 1:5000 dilution (Sigma-Aldrich, A3854). Rabbit antibodies were detected using HRP-conjugated anti-rabbit IgG antibodies at 1:2000 dilution (Cell Signaling, 7074). Mouse antibodies were detected using HRP-conjugated anti-mouse IgG antibodies at 1:2000 dilution (Cell Signaling, 7076). ECL chemiluminescence reagent (Pierce) was used to visualize horseradish peroxidase activity and detected by a CCD camera BioRad image station. A minimum of four independent samples of each condition were used for statistical analysis and quantification.
Immunostaining of indirect flight muscle.
Immunofluorescence was performed as previously described45. Hemithoraces were dissected and fixed for 20 minutes in PBS with 4% paraformaldehyde and 0.1% Triton X-100. After washing, samples were incubated overnight at 4ºC with an antibody against poly-ubiquitinated proteins, mouse mAb FK2 (Enzo), and anti-P62 rabbit ab178440 (Abcam) at 1:200 dilutions, then washed thoroughly and incubated with secondary anti-mouse AlexaFluor-488 (1:250), anti-rabbit AlexaFluor-555 (1:250), and phalloidin AlexaFluor-647 (1:150) (all Invitrogen). Samples were rinsed three times in PBS+0.1% triton X-100 for 10 minutes at room temperature, then mounted in Prolong Gold (Invitrogen) and imaged via confocal microscopy using 20X dry objective with 0.5 numerical aperture (NA) (LSM-800 Zeiss, standard laser lines: 405, 488, 561, 640 nm). Identical laser power settings and photomultiplier values were used for imaging between conditions. For quantification of protein aggregates of hemithoraces, the size and area of protein aggregates was measured using ImageJ particle counter software (ImageJ version 2.0.0-rc-69/1.52p).46 Statistical analysis was conducted using a two-tailed, unpaired Student’s t-test or ANOVA followed by Tukey’s multiple comparisons (n≥9 thoraces per condition).
Climbing Activity
Assessment of climbing ability was performed as previously described47 with minor modifications. Briefly, 10 flies were transferred to an empty standard 23 mm X 95 mm plastic vial and then gently tapped to the bottom. The number of flies that reached the top quarter of the vial within 20 seconds were then scored as climbing. Each experiment was performed on a minimum of 8 vials of 10 flies per condition repeated three times.
LysoTracker™ Red staining
35-day-old female flies near the end of a 20-hour fasting phase were anesthetized on ice and intestines were dissected in cold PBS. Intestines were washed once in PBS, followed by three 30-second rinses in freshly prepared 1 μM LysoTracker™ Red, (Invitrogen) and 1.5 µg/mL Hoechst stain in PBS at room temperature. Intestines were washed five times for 30 seconds in PBS at room temperature, then mounted in Vectashield (Vector Labs), and imaged immediately. Imaging was conducted using a 63X oil objective with 1.4 numerical aperture (NA) on a Zeiss LSM-800 with standard laser lines (405, 488, 561, 640 nm) and using identical power settings between samples. Imaging should not proceed for very long as apoptosis can be observed after approximately 60 minutes. Colocalization GFP-Atg8a quantification was conducted in COLOC2 plugin for ImageJ (ImageJ version 2.0.0-rc-69/1.52p).46 The number of vesicles with significant LysoTracker™ and GFP-Atg8a colocalization determined by significant Pearson’s Correlation Coefficient were then counted using the ImageJ46 particle counter tool (ImageJ version 2.0.0-rc-69/1.52p). Similarly, the total number of LysoTracker™-labeled and GFP-Atg8a vesicles were determined using the ImageJ46 particle counter tool (ImageJ version 2.0.0-rc-69/1.52p). Statistical analysis was conducted using a two-tailed, unpaired Student’s t-test.
Triton-insoluble protein extracts.
Flies were homogenized in ice-cold PBS with 1% Triton X-100 and protease inhibitor cocktail (Roche). The mixture was spun for 10 minutes at 4ºC, and the pellet and supernatant were collected. The Triton X-100–insoluble pellet was washed in one additional volume of Triton X-100 solution and resuspended in denaturing lysis solution with 5% lithium dodecyl sulfate (LDS) containing 300 mM dithiothreitol (NuPAGE LDS Sample Buffer; Invitrogen). n=4 independent samples of 30 flies were used for post-western blot densitometry analysis.
Phospho-histone H3 immunostaining
Briefly, flies were anesthetized on ice and intestines were dissected in cold PBS. Samples were then fixed in PBS + 0.1% Triton X-100 containing 4% paraformaldehyde at room temperature for 30 minutes and rinsed three times in PBS + 0.1% Triton X-100 for 10 minutes at room temperature. Blocking was performed in 5% BSA in PBS + 0.1% triton X-100 for one hour at room temperature. Primary antibody, anti-phospho-histone H3 (S10) (Cell Signaling, 9701), was added at 1:250 in 5% BSA in PBS + 0.1% triton X-100 and incubated overnight at 4ºC rotating. After washing three times in PBS + 0.1% Triton X-100 secondary antibody, anti-rabbit-AlexaFluor-488 (Invitrogen) was added at 1:250 dilution with 1.5 µg/mL Hoechst stain (Thermo) in 5% BSA in PBS + 0.2% triton X-100 and incubated overnight at 4ºC rotating. After washing, intestines were then mounted in Vectashield mounting medium (Vector Labs) and imaged using a 20X dry objective on a Zeiss LSM-800 with 0.5 numerical aperture (NA) and standard laser lines (405, 488, 561, 640 nm) and using identical power settings between samples. Phospho-histone H3 (p-HH3) positive cells were quantified using the ImageJ46 local maxima tool, with identical thresholding for all images (ImageJ version 2.0.0-rc-69/1.52p). p-HH3 numbers were normalized to the area of the posterior midgut imaged. A minimum of 8 intestines were used for each quantification.
Statistical analysis and replicability.
Prism7 (GraphPad) was used to perform the statistical analysis. Significance is expressed as p values (n.s.=p>0.05, *=p<0.05, **=p<0.01, ***=p<0.001, ****=p<0.0001). For two group comparisons unpaired, two-tailed t-test was used, when data met criteria for parametric analysis (normal distribution and similar variance). For more than two group’s comparison ANOVA with Bonferroni, or Tukey’s post-hoc test was performed. Kruskal–Wallis with Dunn’s post-hoc analysis was used for non-parametric data. All plotted values represent means, with error bars representing SEM. All biochemical experiments were performed with a minimum of 4 biological replicates, repeated in 2–3 independent trials. For comparison of survival curves, log-rank (Mantel-Cox) analysis was used. For ad lib vs. iTRF (day 10–40) comparisons on 3% YE, control flies (w1118, Canton S) were tested 9 times, either as experimentals or as controls for other experiments (Fig 1b, 1d, 2d plus 2 repeats, 2f, ED 3j, ED 4c plus repeat, ED 4e). per01 mutants were tested 4 times (Fig. 2f, ED 4c plus repeat, ED 4e); per and tim CRISPR mutants were each tested twice (Fig. 2e plus repeat), clkJRK mutants were tested 3 times (Fig. 2d plus 2 repeats), and cyc01 mutants were tested 4 times (ED 4b plus 2 repeats, ED 4e). All other lifespans with genetic manipulations were tested 2 times, with the exception of large screens of alternative diets such as protein titrations (Fig. 1d, ED 4d-e), alternative TRFs (ED 1b-f), time windows for iTRF (ED2a-g), antibiotic treatment (ED 3i-j), or night vs day bias (Fig. 2f, Fig. 4h-i, ED 9b-c), as well as mCherry-Atg8 controls (ED 7d) and daGS driver controls (ED 6g-f), which were tested once. Titration of protein and lifespan with per01 mutants has been published previously.23 See SI Table 1 for details of all lifespan trials and SI Table 2 for raw source data.
Extended Data
Extended Data Figure 1. Lifespan changes in response to different feeding and fasting regimens.
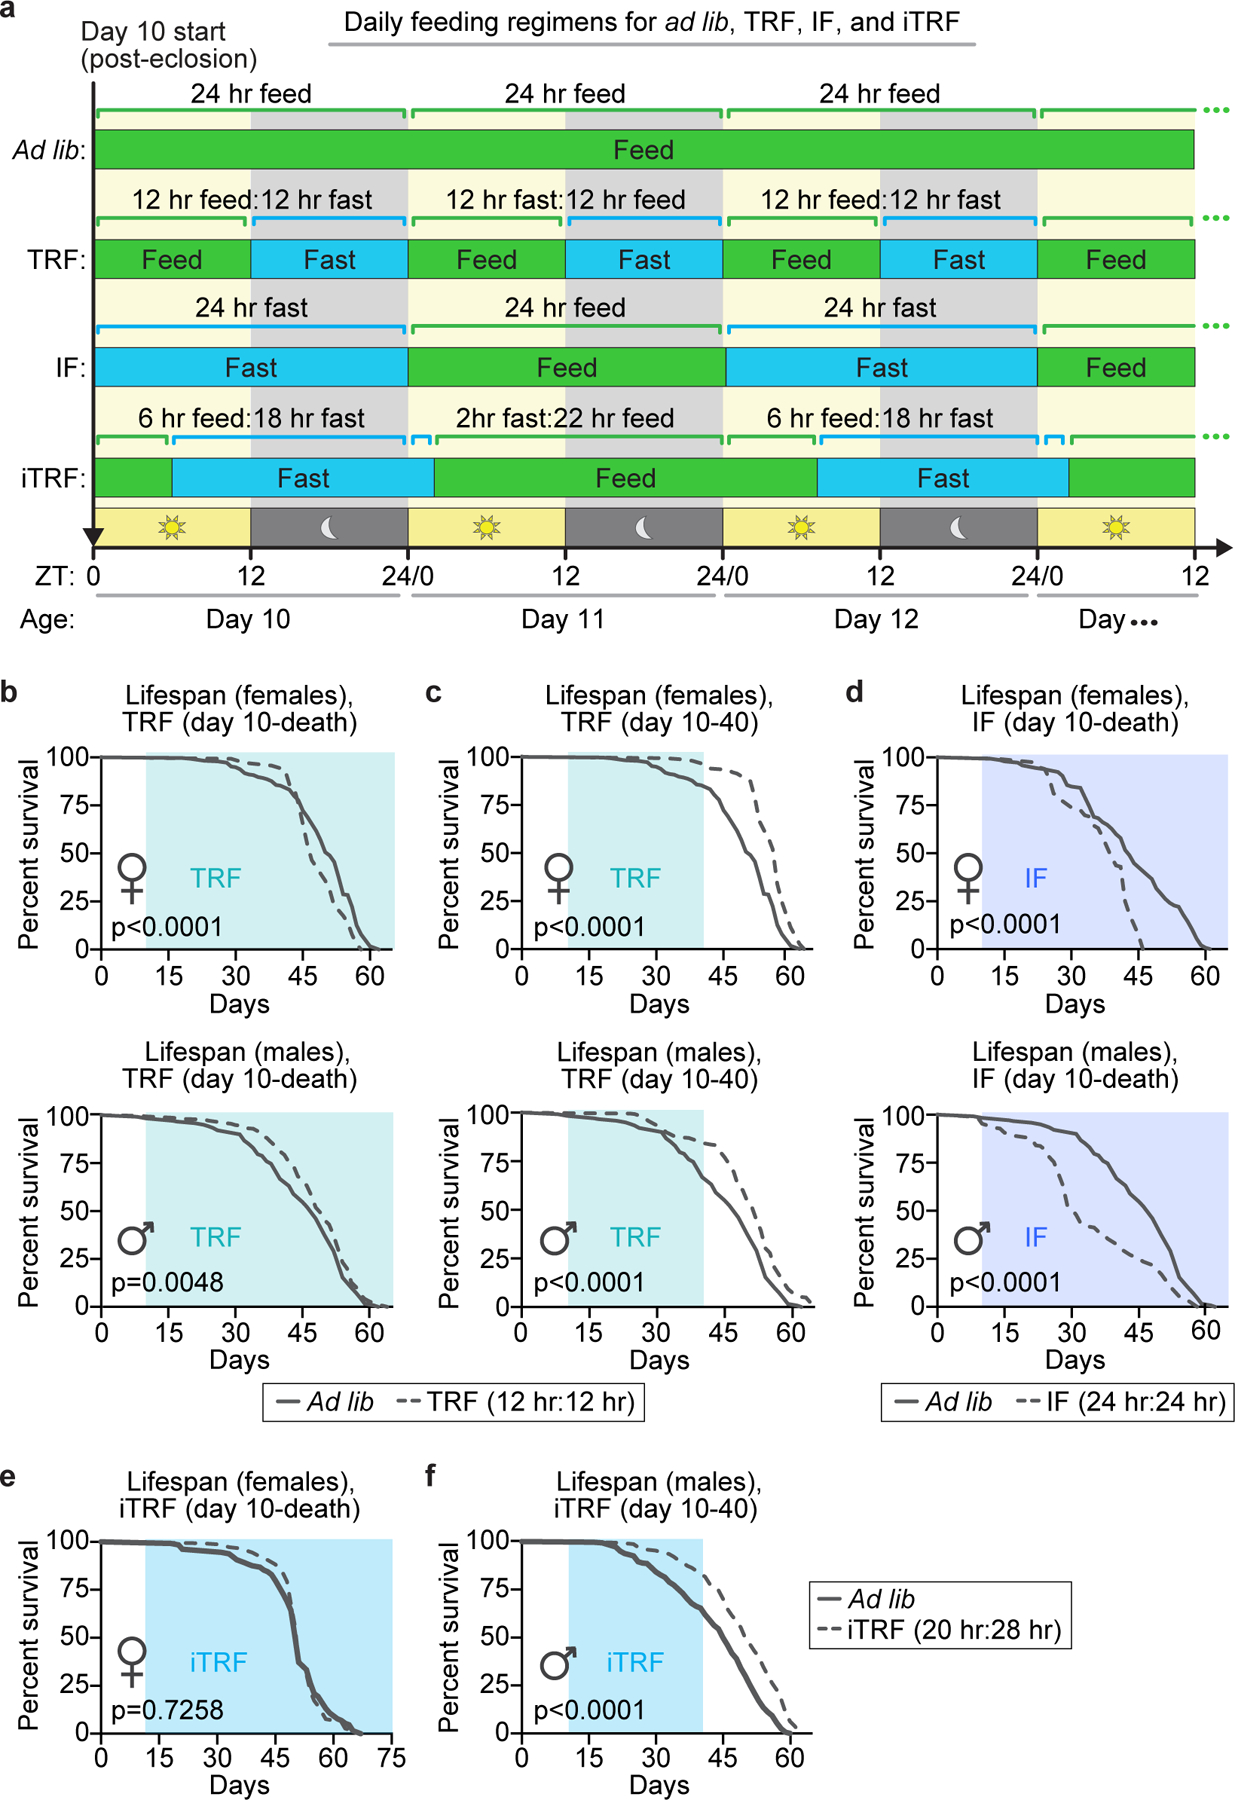
Light blue boxes on graphs indicate duration of TRF (aqua), IF (medium blue), or iTRF (sky blue) during lifespan. (a) Schematic of different feeding regimens utilized in Drosophila lifespan screen. (b) 12-hour time-restricted feeding (TRF) from day 10 until death shortened female lifespan (top; ad lib, solid gray, n=292; TRF, dashed gray, n=142) and minimally extended male lifespan (bottom; ad lib, solid, n=241; TRF, dashed, n=314). (c) In contrast, TRF from days 10–40 extended female (top; ad lib, solid gray, n=292; TRF, dashed gray, n=150) and male (bottom; ad lib, solid gray, n=241; TRF, dashed gray, n=406) lifespan. (d) 24-hour intermittent fasting (IF) from day 10-death shortened both female (top; ad lib, solid gray, n=145; IF, dashed gray, n=149) and male (bottom top; ad lib, solid gray, n=241; IF, dashed gray, n=276) lifespan. (e) Intermittent time-restricted feeding (iTRF) from day 10-death did not extend lifespan (ad lib, solid gray, n=142; TRF, dashed gray, n=157). (f) iTRF regimen from days 10–40 extended male lifespan (ad lib, solid gray, n=323; TRF, dashed gray, n=382). (See Methods for trials, statistics, and source data; n=number of individual flies; p-values were obtained by log-rank analysis (b-f).
Extended Data Figure 2. Characterization of iTRF windows and effect on feeding and dietary restriction.
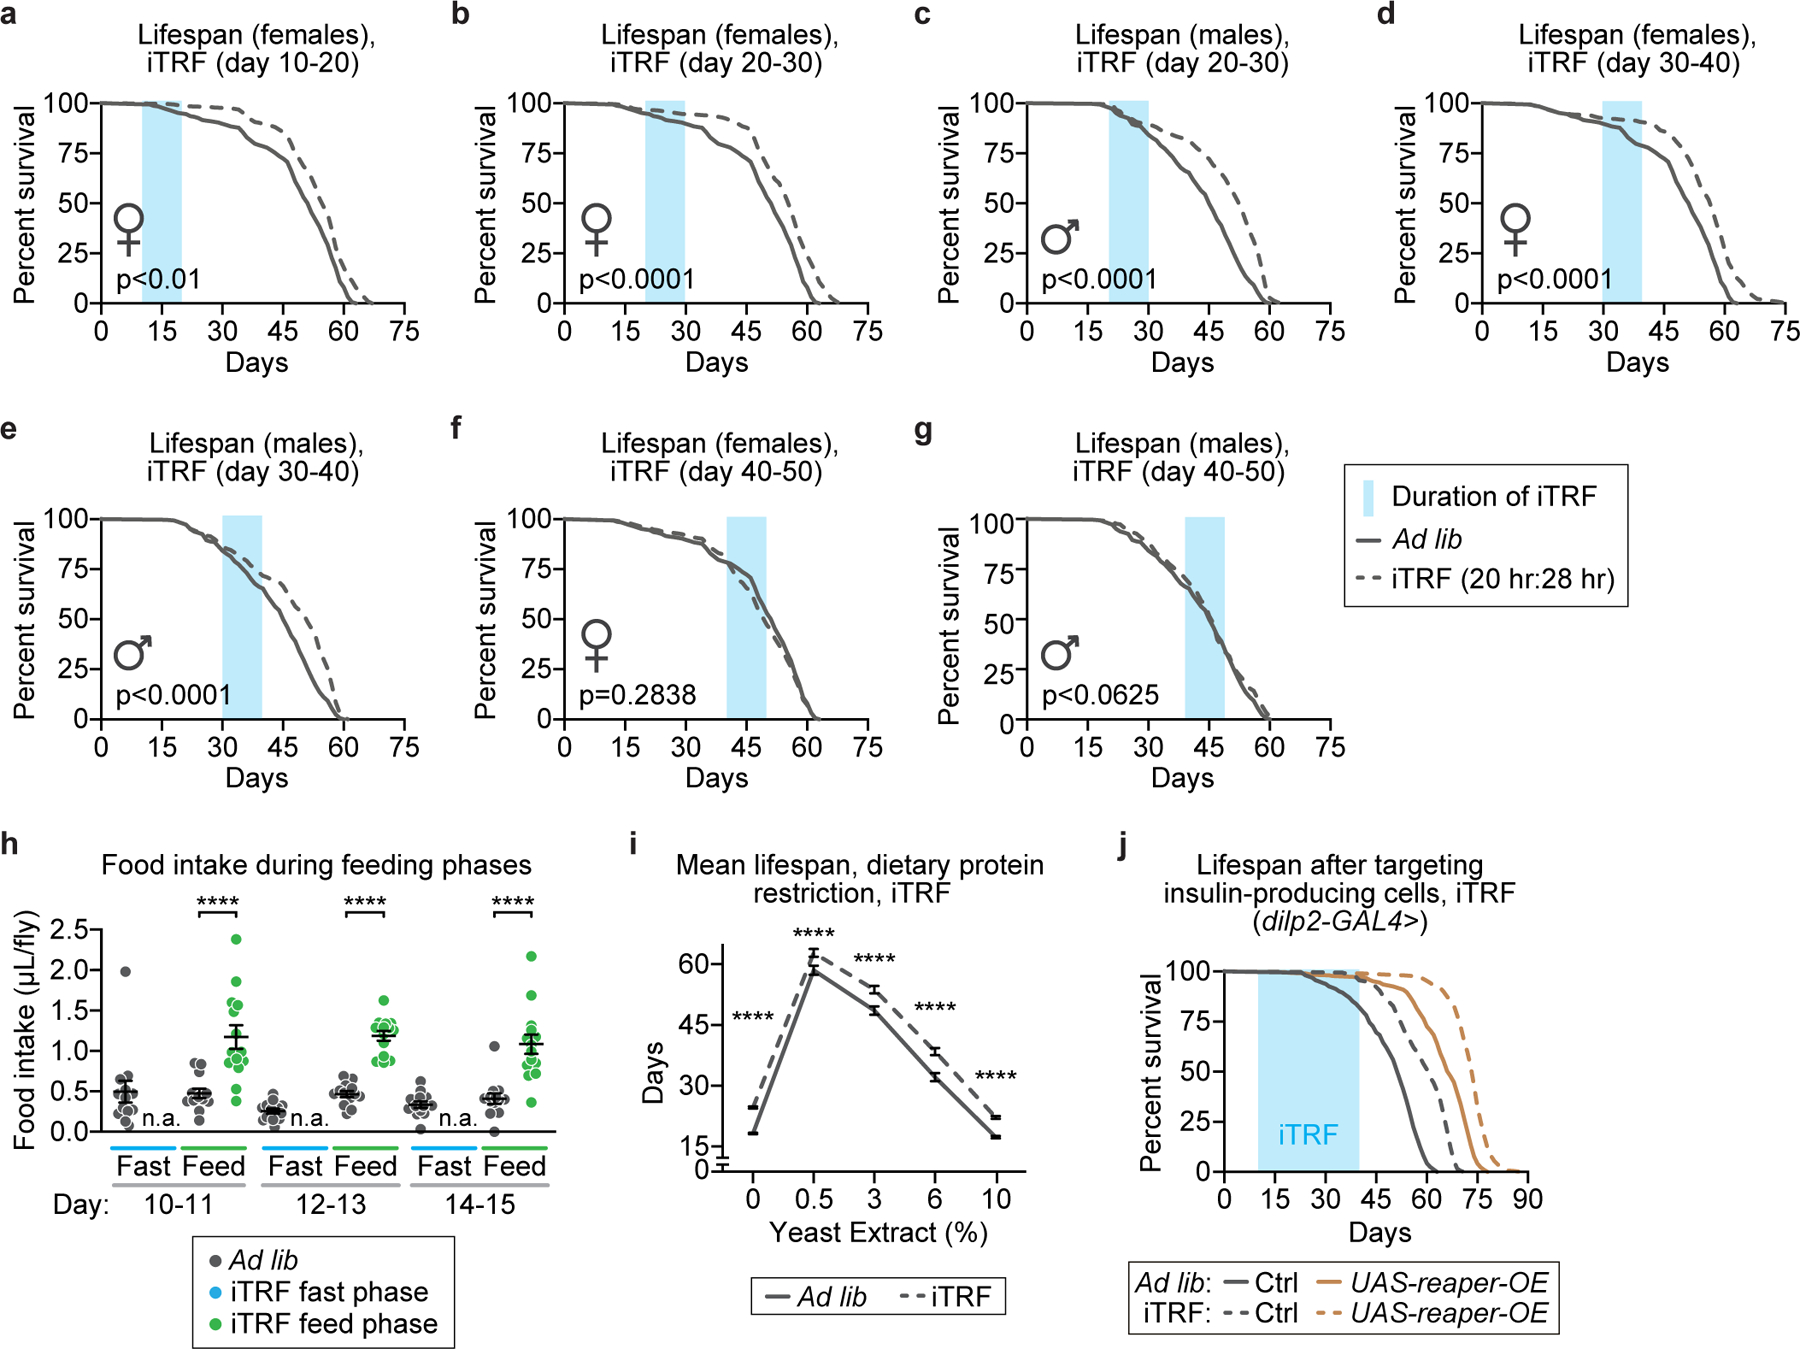
Light blue boxes on graphs indicate duration of iTRF during lifespan; solid and dashed lines represent flies on ad lib and iTRF diets, respectively. 10-day periods of iTRF in early to mid-life (days 10–40 of adulthood) can extend lifespan but not later in life (days 40–50): (a) days 10–20 with females (ad lib n=311; iTRF n=319); days 20–30 with (b) females (iTRF n=337) and (c) males (ad lib n=323; iTRF n=366); days 30–40 with (d) females (iTRF n=355) and (e) males (iTRF n=293) all extend lifespan. (f, g) iTRF days 40–50 of adulthood did not extend male (iTRF n=302) or female (iTRF n=349) lifespan. (h) Relative to flies on ad lib diet (dark gray dots, n=13), flies on iTRF (shown as blue or green dots depending on diet phase, n=14) starve during the fasting phase (n.a., no food available) and eat more during the feeding phase (green dots). (i) iTRF extended mean lifespan regardless of dietary protein concentration (n=98–347 for each sample of ad lib or iTRF flies at each protein concentration). (j) After partial genetic ablation of insulin producing cells, iTRF still extended lifespan (dashed brown, n=424) relative to ad lib diet (solid brown, n=310), to a similar extent as in genetic controls (ad lib, solid gray, n=161; iTRF, dashed gray, n=180). (See Methods for trials, statistics, and source data; n=number of individual flies; ****=p<0.0001; p-values were obtained by log-rank analysis (a-g, and j) and unpaired two-tailed t-test (h-i). Center values=averages; error bars=SEM.)
Extended Data Figure 3. iTRF delays aging markers (protein aggregation and intestinal dysfunction) and extends lifespan independent of microbiota.
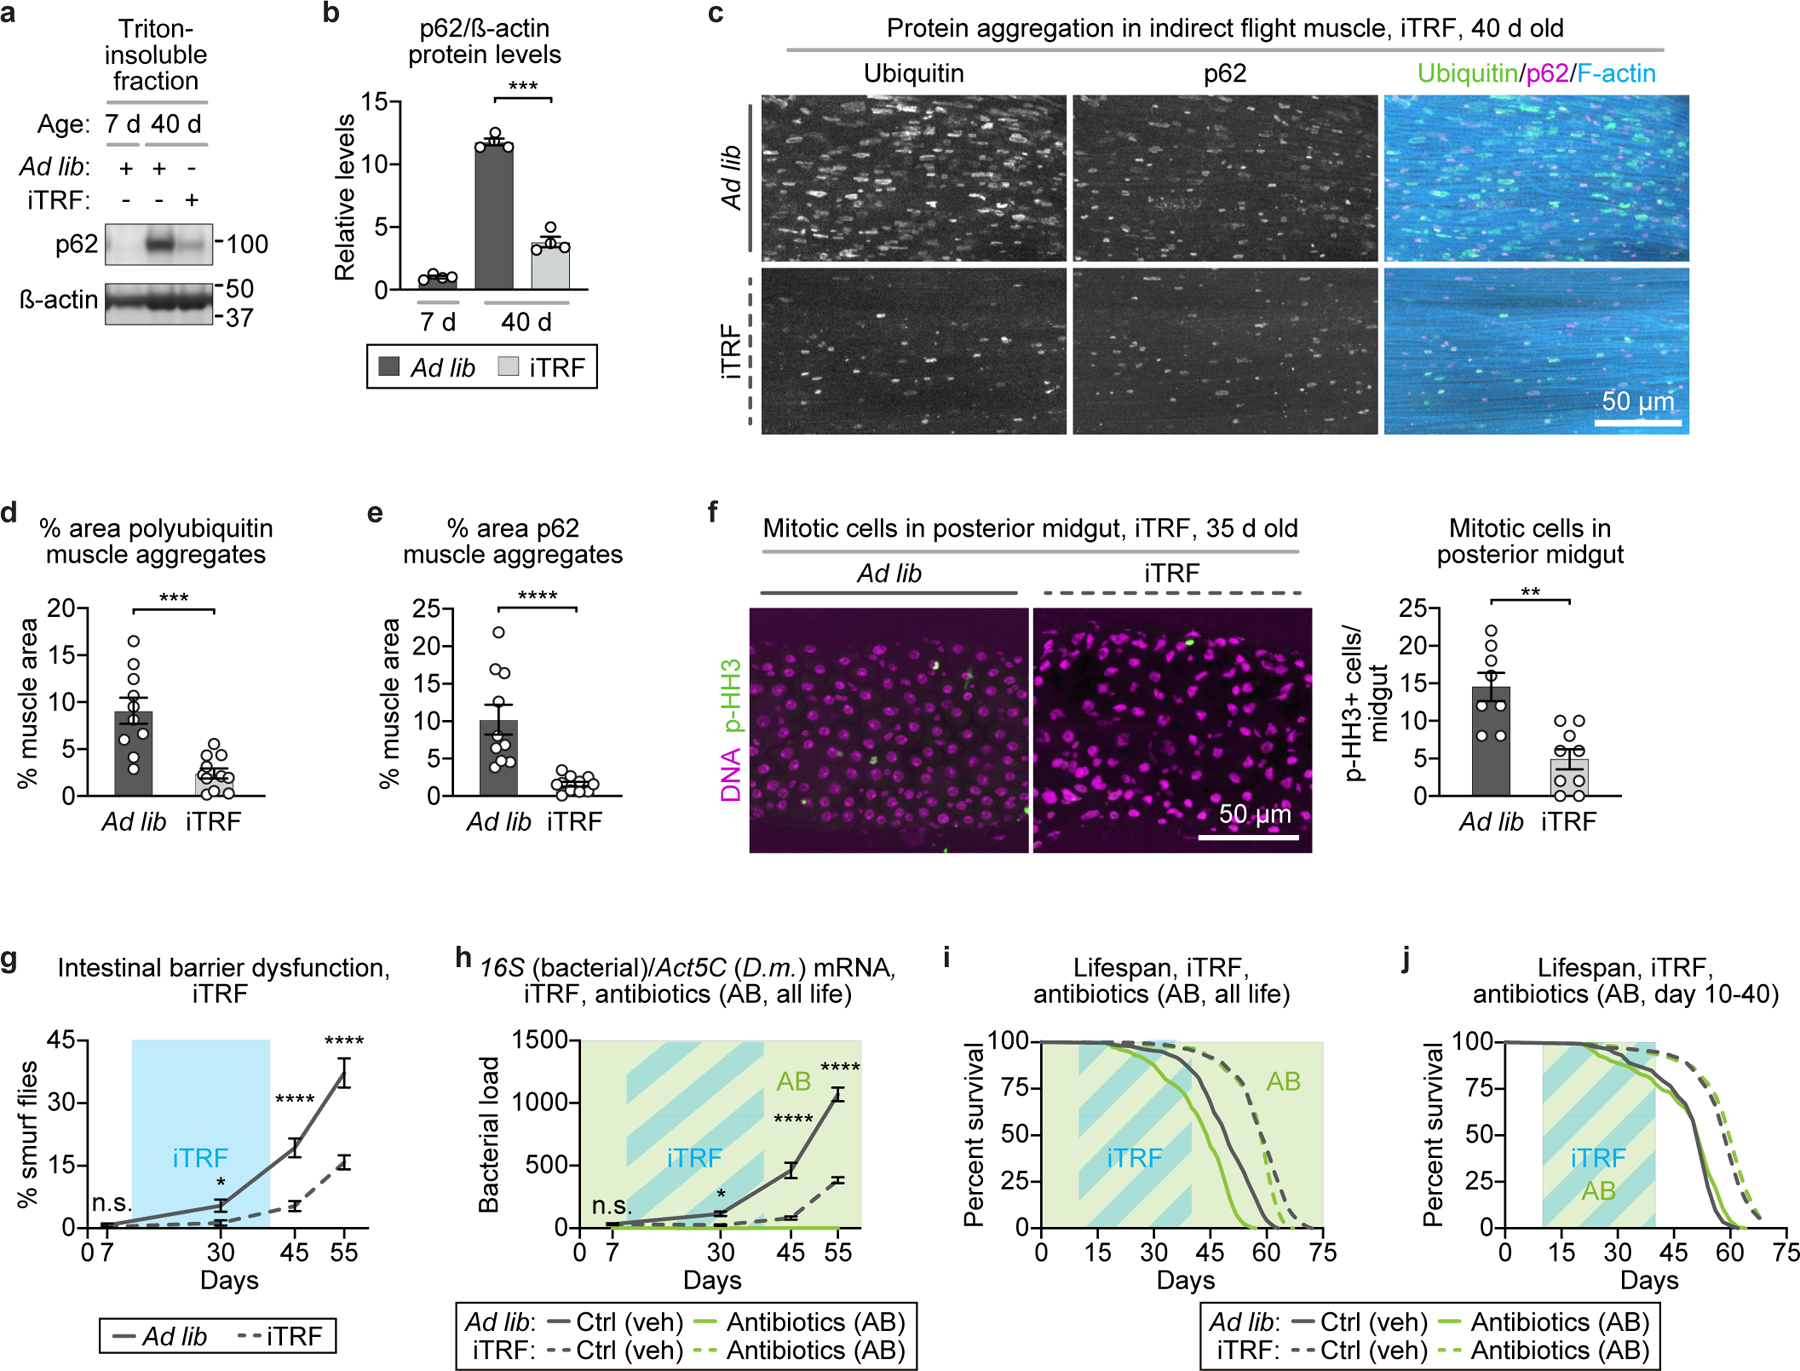
(a) Representative western blot of Triton-insoluble protein accumulation of p62/ref(2)P (each sample=30 flies/condition/timepoint; see also SI Figure 1). (b) Quantification of triton insoluble protein levels showed that iTRF flies (light gray) exhibited reduced accumulation of p62/ref(2)P with age, relative to ad lib flies (dark gray) (average of 4 biological repeats). (c) Representative images of 40-day old indirect flight muscle stained for polyubiquitin protein aggregates (green), p62/ref(2)P (magenta), and filamentous actin (F-actin, blue); scale bar=50 µm. iTRF significantly reduced (d) polyubiquitin aggregates and (e) accumulation of p62 aggregates (ad lib n=10 thoraces, iTRF n=11 thoraces). (f) iTRF also reduced age-related intestinal over-proliferation, as marked by phospho-histone H3 staining (p-HH3) (ad lib n=8 guts; iTRF n=9 guts); scale bar=50 µm. (g) Light blue boxes on graphs indicate duration of iTRF during lifespan. iTRF (dashed line) delayed age-related intestinal barrier dysfunction relative to ad lib (solid line), as marked by decreased numbers of smurf flies (n=8–12 cohorts of 20–31 flies). (h-j) Light colored boxes on graphs indicate duration of antibiotic treatment (AB, green) or antibiotic treatment plus iTRF diet (blue/green striped) during lifespan. (h) iTRF flies showed delayed age-related growth in microbiome load with age (n=30 flies/condition/timepoint, 4 biological replicates). iTRF extended lifespan upon microbiome clearance via antibiotics treatment during either (i) total lifespan (ad lib n=227, iTRF n=268) or (j) only days 10–40 of adulthood (ad lib n=144, iTRF n=190). (See Methods for trials, statistics, and source data; n=number of flies unless otherwise indicated; n.s.=p>0.05, *=p<0.05, **=p<0.01, ***=p<0.001, ****=p<0.0001; p-values were obtained by ANOVA followed by Tukey’s post-hoc test (b, g-h), unpaired two-tailed student’s t-test (d-f), and log-rank analysis (i-j). Center values=averages; error bars=SEM.)
Extended Data Figure 4. Circadian mutants show a normal lifespan response to dietary protein restriction but do not respond to iTRF.
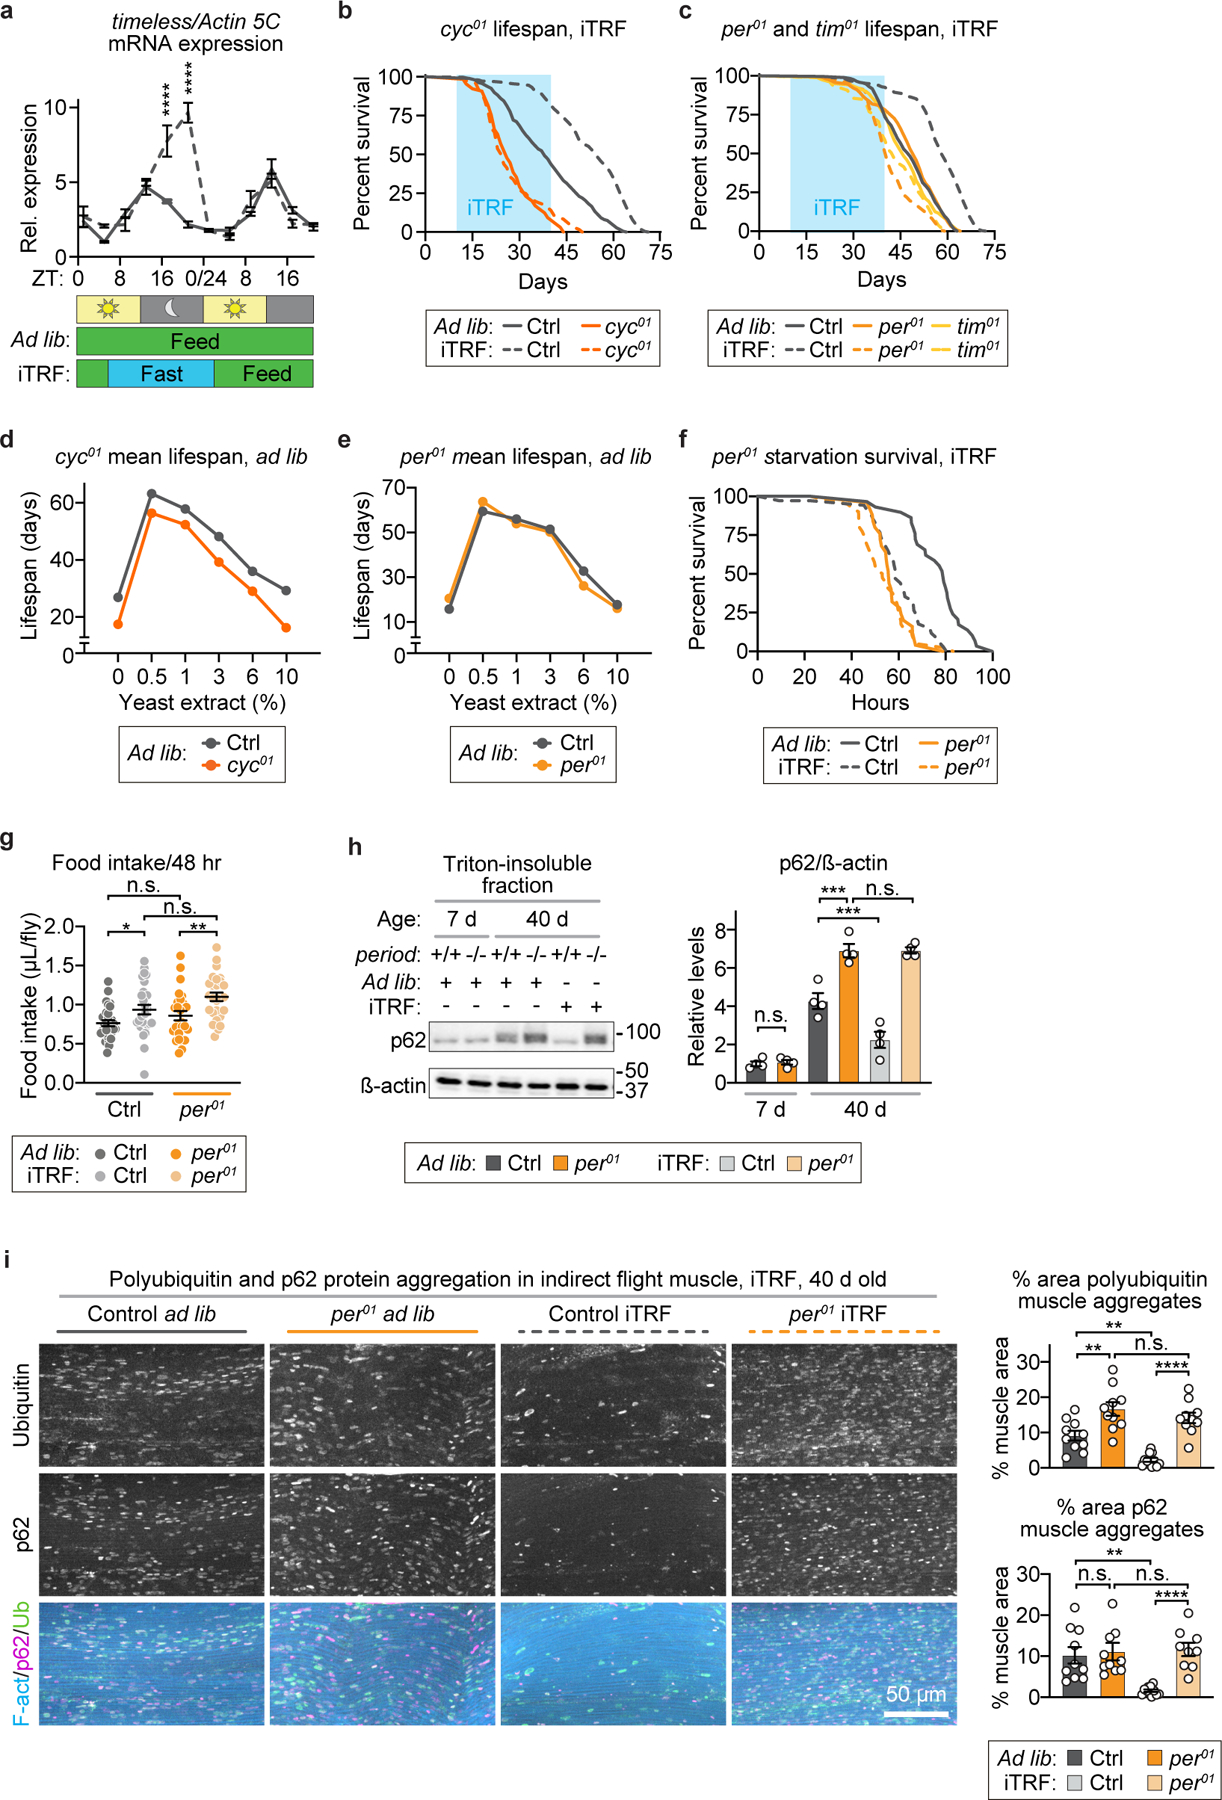
(a) Gene expression of timeless, similar to period and Clock, was enhanced by iTRF during the fasting phase (each n=4 biological replicates of 30 female flies/genotype/condition/timepoint; unmarked=n.s.). (b-c) Light blue boxes on graphs indicate duration of iTRF during lifespan. Circadian mutants did not respond to iTRF with extended lifespan relative to controls (ad lib n=187–288; iTRF n=290–311): (b) cycle01 (ad lib n=65, iTRF n=121) and (c) timeless01 (ad lib n=120, iTRF n=152) and period01 (ad lib n=215, iTRF n=184) null mutant females did not respond to iTRF with extended lifespan. (d) cycle01 and (e) period01 mutant females showed a normal “tent-curve” lifespan response to dietary protein titration (n=61–272 flies/genotype/condition/timepoint). (f) period01 mutant females did not starve significantly faster than controls whether they have been on iTRF or ad lib diet (controls: ad lib n=31, iTRF n=35; per: ad lib n=27, iTRF n=42). (g) Similar to controls (gray, ad lib n=30; light gray, iTRF, n=29), period01 mutant females (orange, ad lib n=27; light orange, iTRF, n=27) ate more on iTRF relative to on ad lib diet. (h) Unlike control iTRF flies (light gray), which had reduced accumulation of p62/ref(2)P with age relative to ad lib flies (dark gray), per mutants had similar levels on ad lib (orange) or iTRF (light orange) diets (each dot=1 sample=30 flies; each bar=average of 4 biological repeats). Actin blot is repeated from Figure 2h because the same western blot was used to quantify Ubiquitin, p62/ref(2)P, and actin (loading control); see also SI Figure 1. (i) Representative images of indirect flight muscle from 40-day-old flies stained for filamentous actin (F-actin, blue), ubiquitin (green), and p62/ref(2)P (magenta) showed that, unlike genetic controls (ad lib n=10, iTRF n=11 thoraces), period mutants did not have decreased polyubiquitin, or p62/ref(2)P aggregate accumulation in response to iTRF (ad lib n=10, iTRF n=10 thoraces); scale bar=50 µm. (See Methods for trials, statistics, and source data; n=number of flies unless otherwise indicated; n.s.=p>0.05, *=p<0.05, **=p<0.01, ***=p<0.001, ****=p<0.0001; p-values were obtained by ANOVA followed by Tukey’s post-hoc test (a, g-i) and log-rank analysis (b-c, f). Center values=averages; error bars=SEM.)
Extended Data Figure 5. period mutants are defective in autophagy regulation and autophagy induction in response to fasting.
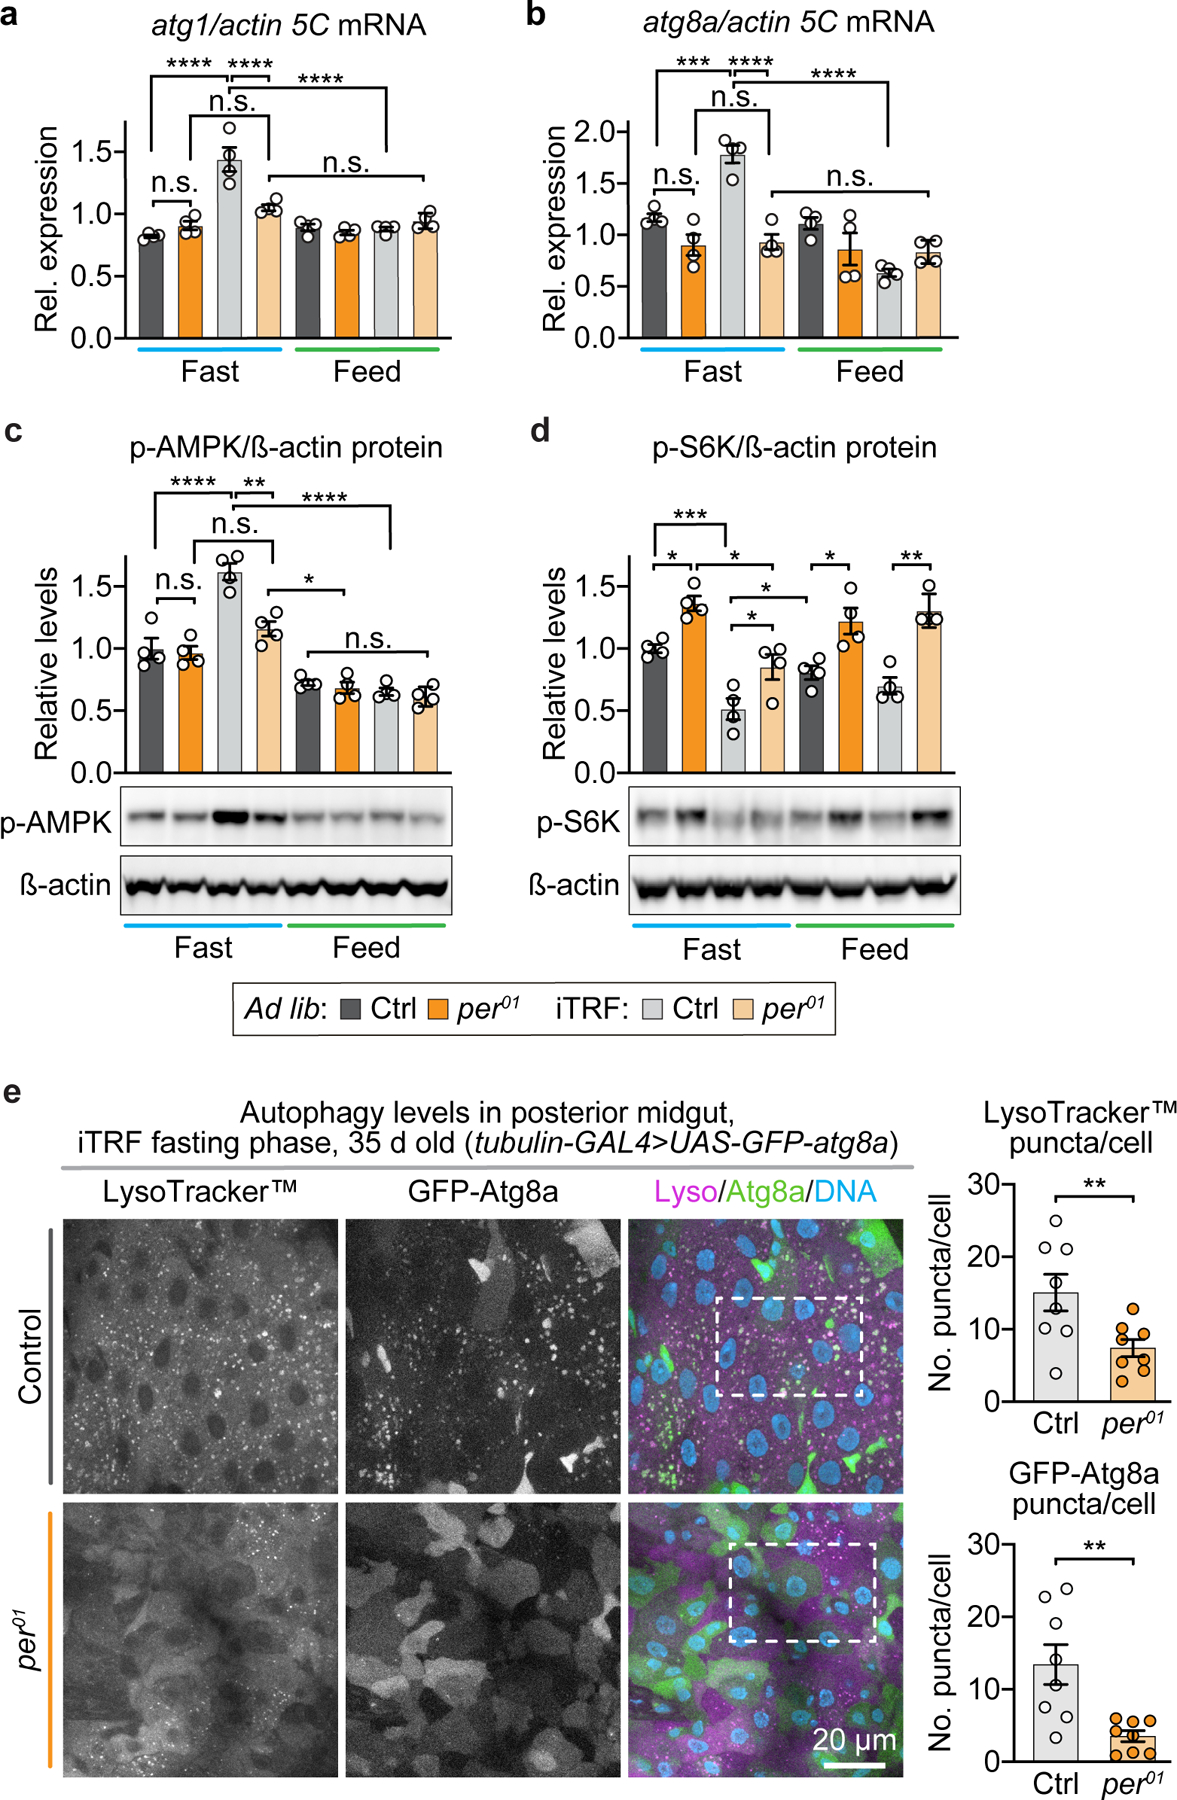
(a-b) Similar to circadian genes, iTRF increased the peak amplitude of (a) atg1 and (b) atg8a mRNA expression during the fasting period in wild-type flies (gray) but not period01 mutants (orange) (each dot=1 sample of 30 flies; each bar=average of 4 biological repeats). (c-d) period01 mutants (orange) had (c) reduced activation of AMPK and (d) high levels of TORC1 activity as marked by S6K phosphorylation, both in response to fasting during iTRF, compared to controls (gray) (each dot=1 sample of 30 flies; each bar=average of 4 biological repeats); see also Extended Data Figure 10. (e) Representative images of posterior midgut cells during fasting phase of iTRF of 35-day-old flies labeled with LysoTracker™ (magenta), GFP-Atg8a (green), and DAPI to label the DNA (blue), showed that control animals (n=8 guts; each dot represents 2–3 Z-stacks of the posterior midgut of 1 animal) had high levels of LysoTracker™ and GFP-Atg8a puncta compared to period mutants (n=8 guts); scale bar=20 µm; white dashed boxes on images represent inset area presented in Figure 3g. (See Methods for trials, statistics, and source data; n=number of flies unless otherwise indicated; n.s.=p>0.05, *=p<0.05, **=p<0.01, ***=p<0.001, ****=p<0.0001; p-values were obtained by ANOVA followed by Tukey’s post-hoc test (a-d) and unpaired, two-tailed t-test (e). Center values=averages; error bars=SEM.)
Extended Data Figure 6. Circadian manipulation of upstream metabolic and autophagy regulators partially determines lifespan response to iTRF.
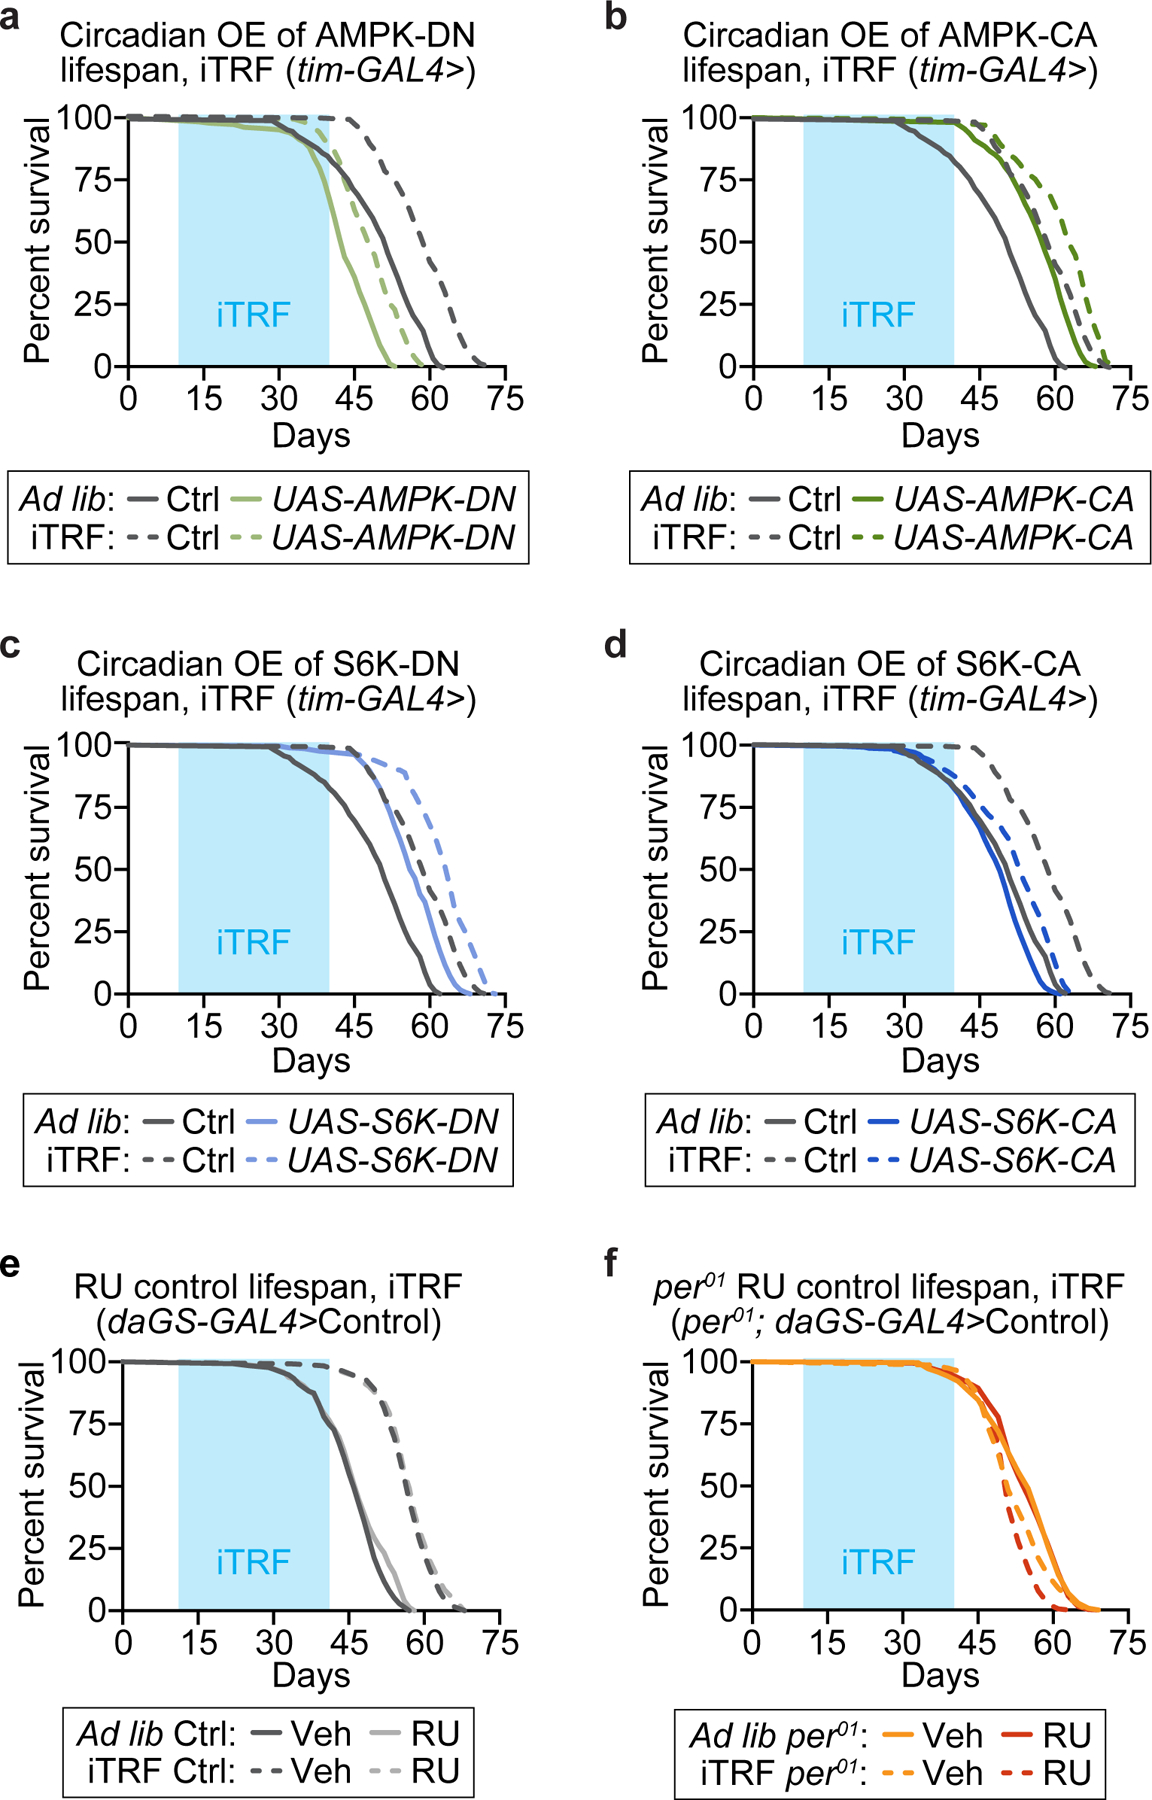
Light blue boxes on graphs indicate duration of iTRF during lifespan. Relative to controls (gray: ad lib, solid, n=161; iTRF, dashed, n=164), which had an ~20% increase in mean lifespan in response to iTRF, circadian overexpression of: (a) dominant-negative (DN) AMPK (K57A, sage green) shortened the lifespan of animals on ad lib diets (solid, n=184) and caused a 13% increase in mean lifespan in response to iTRF (dashed, n=170); (b) constitutively active (CA) AMPK (T184D, dark green) extended lifespan on ad lib diet (solid, n=156) and caused an 8% increase in mean lifespan in response to iTRF (dashed, n=134); (c) dominant-negative (DN) S6K (KQ, light blue) extended lifespan on ad lib diet (solid, n=292) and caused a 12% increase in mean lifespan in response to iTRF (dashed, n=180); (d) constitutively active CA-S6K (STDETE, medium blue) minimally shortened lifespan on ad lib diets (solid, n=237) and caused an 8% increase in mean lifespan in response to iTRF (dashed, n=282). RU486 feeding did not influence control (e) or per01 (f) lifespan in flies lacking UAS transgenes (control: ad lib n=136–146, iTRF n=129–142; per01: ad lib n=294–501, iTRF n=238–415). (See Methods for trials, statistics, and source data; n=number of flies; p-values were obtained by log-rank analysis (a-f)).
Extended Data Figure 7. Circadian regulation of Atg8a is necessary for iTRF and sufficient to extend lifespan.
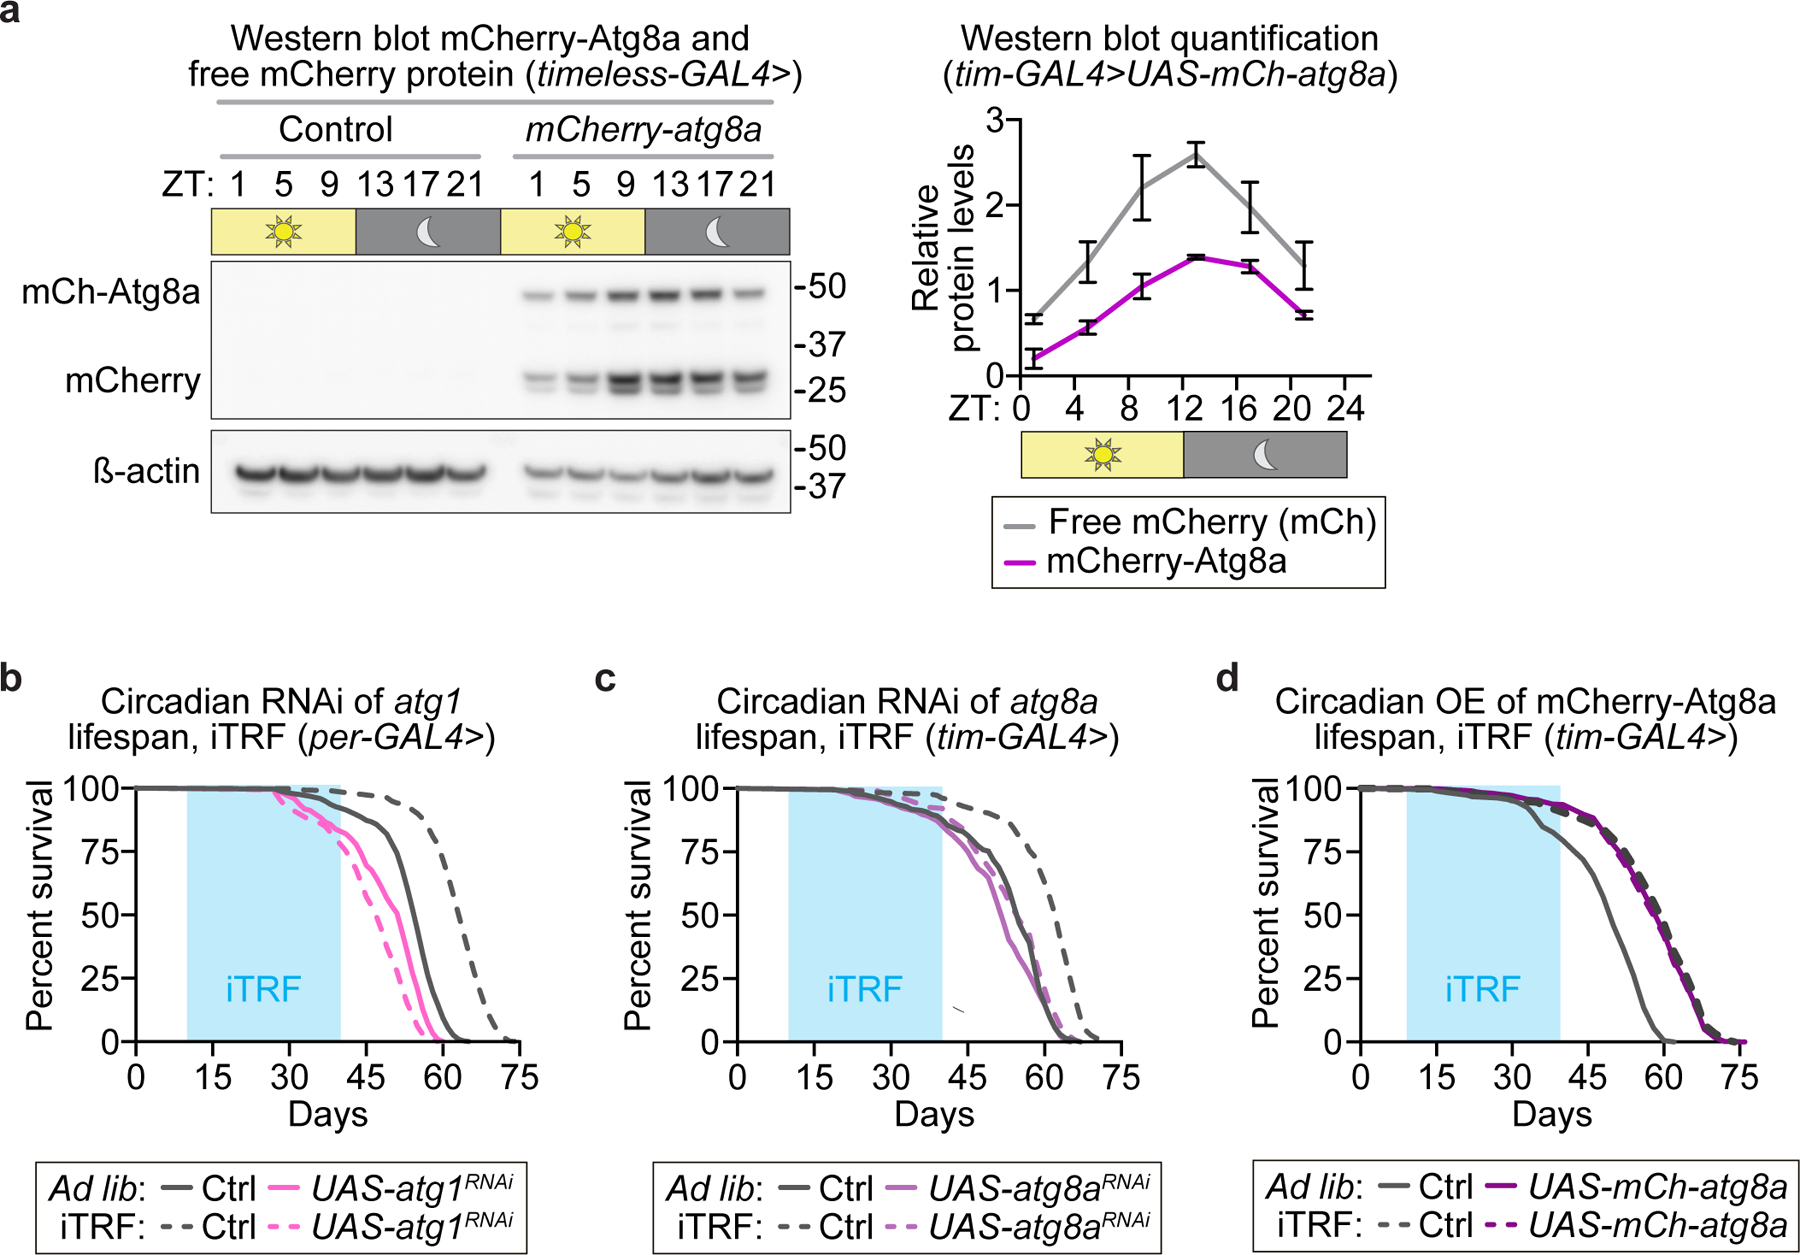
(a) Using tim-GAL4 to drive expression of mCherry-atg8a, we confirmed oscillating mCherry-Atg8a and free mCherry protein expression by western blot analysis (see also SI Figure 1), which demonstrated circadian autophagic flux in controls on ad lib diet (each lane=30 flies; each time point of quantification=average of 3 biological repeats). (b-d) Solid lines represent ad lib flies; dashed lines represent iTRF flies; light blue boxes on graphs indicate duration of iTRF during lifespan. RNAi-mediated circadian knockdown of (b) atg1 (pink: ad lib n=217, iTRF n=166) and (c) atg8a (purple: ad lib n=196, iTRF n=139) was necessary for iTRF-mediated lifespan extension (controls, gray: ad lib n=194–316, iTRF n=196–409. (d) Circadian overexpression of mCherry-Atg8a was sufficient to extend lifespan on ad lib diet (solid lines: gray, control n=185; purple, mCh-atg8a n=422) and responded minimally to iTRF (dashed lines: gray, control n=421, purple, mCh-atg8a n=437). (See Methods for trials, statistics, and source data; n=number of flies unless otherwise indicated; p-values were obtained by log-rank analysis (b-d). Center values=averages; error bars=SEM.)
Extended Data Figure 8. atg1 is necessary and sufficient for iTRF-mediated delays in aging-associated climbing defects and protein aggregation.
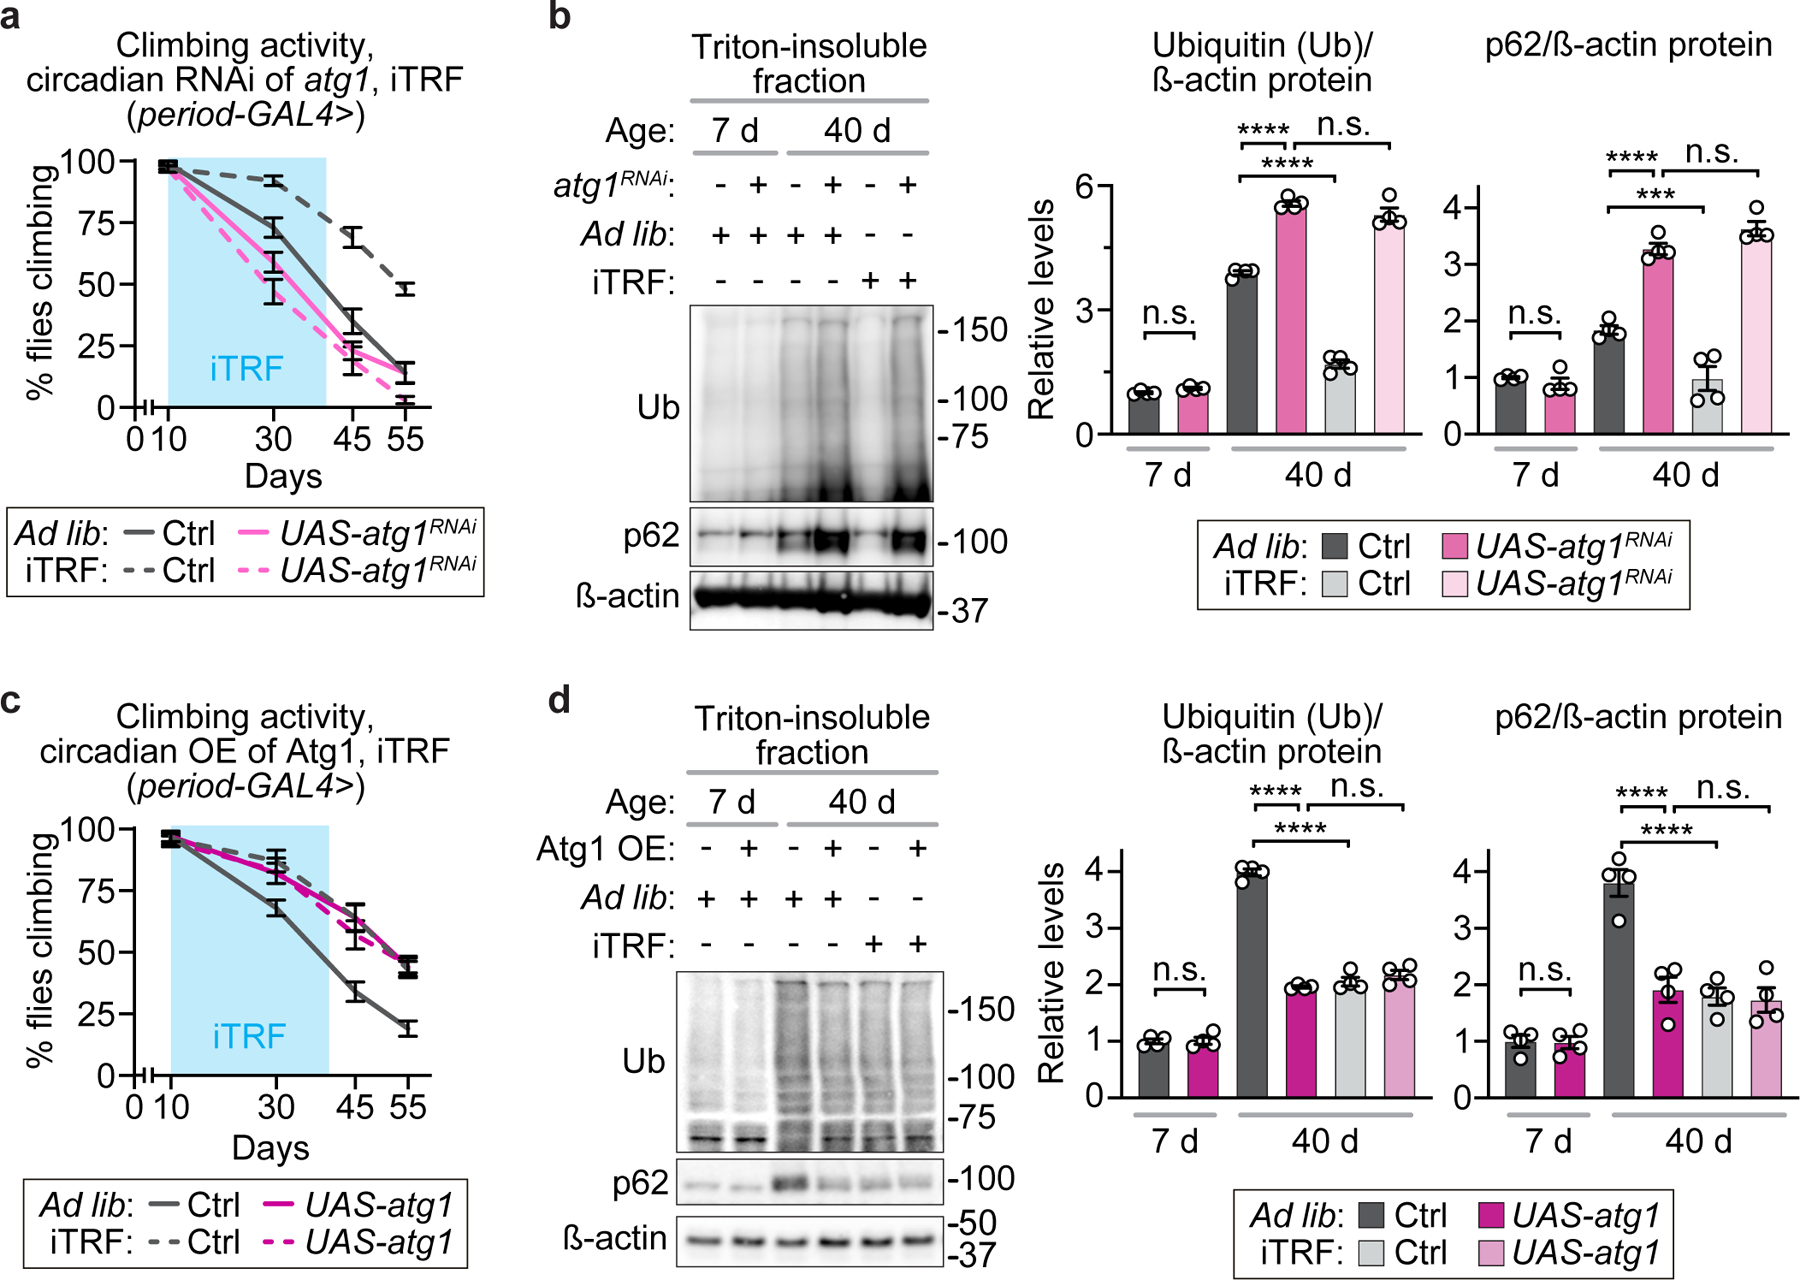
(a, c) Light blue boxes on graphs indicate duration of iTRF during lifespan. (a-b) Relative to controls (gray), circadian knockdown of atg1 (pink) increased aging markers of (a) climbing defects (n=10 vials of 10 flies/condition/genotype/timepoint) and (b) protein aggregation (each lane=30 flies; each time point of quantification=average of 4 biological repeats) and made flies resistant to the effects of iTRF (dashed lines, lighter shades), relative to ad lib diets (solid lines, darker shades). (c-d) In contrast, relative to controls (gray), circadian overexpression of atg1 (magenta) decreased aging markers of (c) climbing defects (n=10 vials of 10 flies/condition/genotype/timepoint) and (d) protein aggregation (each lane=30 flies; each time point of quantification=average of 4 biological repeats; see also SI Figure 1) and also made flies resistant to the effects of iTRF (dashed lines), relative to ad lib diets (solid lines). (See Methods for trials, statistics, and source data; n=number of flies unless otherwise indicated; n.s.=p>0.05, ***=p<0.001, ****=p<0.0001; p-values were obtained by ANOVA followed by Tukey’s post-hoc test (a-d). Center values=averages; error bars=SEM.)
Extended Data Figure 9. Enhanced autophagy specifically during the night phase is necessary and sufficient for TRF-mediated lifespan extension.
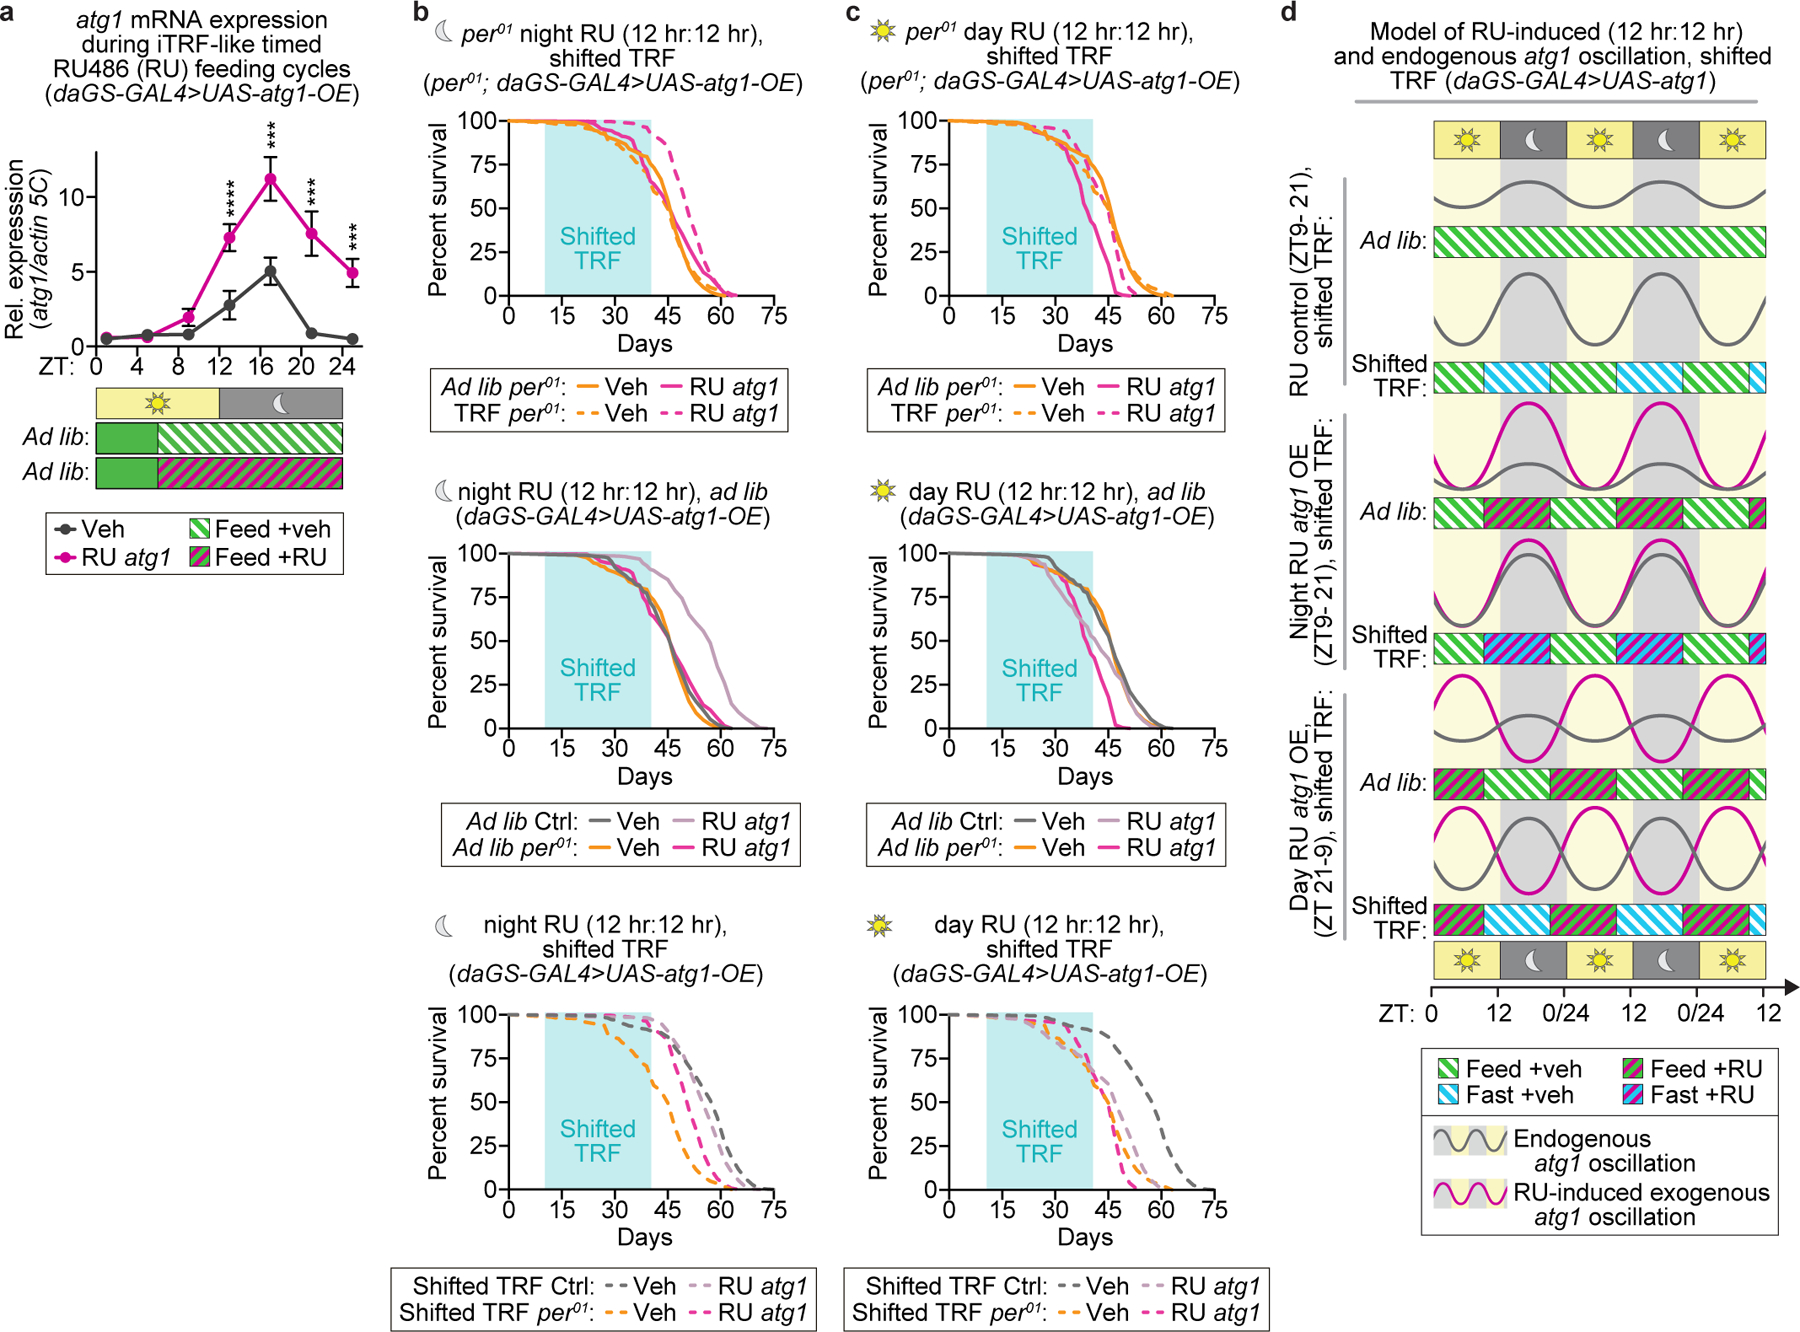
(a) RU-induced overexpression of atg1 during iTRF-like phases of the circadian cycle causes circadian enhanced, night-specific expression of atg1 (n=4 biological replicates of 30 flies/timepoint/condition; unmarked=n.s.). (b-c) Light aqua boxes on graphs indicate duration of shifted-TRF during lifespan. (b) Relative to ad lib diet (period01 mutants ad lib, solid orange, n=225), neither night-biased 12:12 treatment of shifted TRF (dashed orange, n=228) or RU-induced atg1 expression (solid magenta, n=319) alone extended the lifespan of per01 mutants. Combined, night-biased 12:12 shifted TRF and RU-induced atg1 expression modestly increased lifespan of per01 mutants (dashed magenta, n=239). (c) Replotted here are per01 mutants on ad lib diet (solid orange, n=225) and on night-biased 12:12 shifted TRF (dashed orange, n=228). Day-biased 12:12 RU-induced exogenous atg1 expression decreased the lifespan of per01 mutants (solid magenta, n=206); this lifespan was increased by night-biased shifted TRF (dashed magenta, n=192). Also shown below are re-plots comparing control and per01 mutant backgrounds with night (b) and day (c) biased RU-induced atg1 expression on ad lib diet (second row) or shifted TRF (third row). (d) Graphic schematic illustrating endogenous rhythms of atg1 expression (gray) and the predicted effects of RU treatment and 12:12 TRF, either night biased and day-biased, on exogenous atg1 expression. (See Methods for trials, statistics, and source data; n=number of flies unless otherwise indicated; n.s.=p>0.05, ***=p<0.001, ****=p<0.0001; p-values were obtained by ANOVA followed by Tukey’s post-hoc test (a) and log-rank analysis (b-c). Center values=averages; error bars=SEM.)
Supplementary Material
Acknowledgments:
We thank all Shirasu-Hiza and Canman lab members for support, discussions, and feedback. We also thank David W. Walker and Jaga Giebultowicz for fly lines. Other stocks were obtained from the Bloomington Drosophila Stock Center (NIH P40OD018537). Work was supported by: Charles H. Revson Foundation (MU), AFAR Glenn Foundation Postdoctoral Fellowship for Aging Research (MU), Celia Lipton Farris and Victor W. Farris Foundation Graduate Student Fellowship (SJP), NIH T32GM007088 (JG), NIH R01GM117407 (JCC); NIH R01GM130764 (JCC); Joe W. and Dorothy Dorsett Brown Foundation (WWJ), NIH R56AG065986 (WWJ), NIH R35GM127049 (MSH), and NIH R01AG045842 (MSH).
Footnotes
Competing Interests:
The authors declare no competing interests.
Data Availability.
The authors declare that all data supporting the findings of this study are available, including replicate experiments, and will be made available upon reasonable request.
References:
- 1.Longo VD & Panda S Fasting, Circadian Rhythms, and Time-Restricted Feeding in Healthy Lifespan. Cell Metab 23, 1048–1059, doi: 10.1016/j.cmet.2016.06.001 (2016). [DOI] [PMC free article] [PubMed] [Google Scholar]
- 2.Villanueva JE et al. Time-restricted feeding restores muscle function in Drosophila models of obesity and circadian-rhythm disruption. Nature Communications 10, 2700, doi: 10.1038/s41467-019-10563-9 (2019). [DOI] [PMC free article] [PubMed] [Google Scholar]
- 3.Chaix A, Zarrinpar A, Miu P & Panda S Time-restricted feeding is a preventative and therapeutic intervention against diverse nutritional challenges. Cell Metab 20, 991–1005, doi: 10.1016/j.cmet.2014.11.001 (2014). [DOI] [PMC free article] [PubMed] [Google Scholar]
- 4.Gill S, Le HD, Melkani GC & Panda S Time-restricted feeding attenuates age-related cardiac decline in Drosophila. Science 347, 1265–1269, doi: 10.1126/science.1256682 (2015). [DOI] [PMC free article] [PubMed] [Google Scholar]
- 5.de Cabo R & Mattson MP Effects of Intermittent Fasting on Health, Aging, and Disease. N Engl J Med 381, 2541–2551, doi: 10.1056/NEJMra1905136 (2019). [DOI] [PubMed] [Google Scholar]
- 6.Catterson JH et al. Short-Term, Intermittent Fasting Induces Long-Lasting Gut Health and TOR-Independent Lifespan Extension. Curr Biol 28, 1714–1724.e1714, doi: 10.1016/j.cub.2018.04.015 (2018). [DOI] [PMC free article] [PubMed] [Google Scholar]
- 7.Manoogian ENC & Panda S Circadian rhythms, time-restricted feeding, and healthy aging. Ageing Research Reviews 39, 59–67, doi: 10.1016/j.arr.2016.12.006 (2017). [DOI] [PMC free article] [PubMed] [Google Scholar]
- 8.Ja WW et al. Prandiology of Drosophila and the CAFE assay. Proc Natl Acad Sci U S A 104, 8253–8256, doi: 10.1073/pnas.0702726104 (2007). [DOI] [PMC free article] [PubMed] [Google Scholar]
- 9.Murphy KR, Park JH, Huber R & Ja WW Simultaneous measurement of sleep and feeding in individual Drosophila. Nat Protoc 12, 2355–2366, doi: 10.1038/nprot.2017.096 (2017). [DOI] [PMC free article] [PubMed] [Google Scholar]
- 10.Partridge L, Alic N, Bjedov I & Piper MDW Ageing in Drosophila: the role of the insulin/Igf and TOR signalling network. Exp Gerontol 46, 376–381, doi: 10.1016/j.exger.2010.09.003 (2011). [DOI] [PMC free article] [PubMed] [Google Scholar]
- 11.Cox KH & Takahashi JS Circadian clock genes and the transcriptional architecture of the clock mechanism. J Mol Endocrinol 63, R93–r102, doi: 10.1530/jme-19-0153 (2019). [DOI] [PMC free article] [PubMed] [Google Scholar]
- 12.Dunlap JC & Loros JJ Making Time: Conservation of Biological Clocks from Fungi to Animals. Microbiol Spectr 5, 10.1128/microbiolspec.FUNK-0039–2016, doi: 10.1128/microbiolspec.FUNK-0039-2016 (2017). [DOI] [PMC free article] [PubMed] [Google Scholar]
- 13.Allada R & Chung BY Circadian organization of behavior and physiology in Drosophila. Annu Rev Physiol 72, 605–624, doi: 10.1146/annurev-physiol-021909-135815 (2010). [DOI] [PMC free article] [PubMed] [Google Scholar]
- 14.Panda S Circadian physiology of metabolism. Science 354, 1008–1015, doi: 10.1126/science.aah4967 (2016). [DOI] [PMC free article] [PubMed] [Google Scholar]
- 15.Duong HA, Robles MS, Knutti D & Weitz CJ A molecular mechanism for circadian clock negative feedback. Science 332, 1436–1439, doi: 10.1126/science.1196766 (2011). [DOI] [PMC free article] [PubMed] [Google Scholar]
- 16.Xu K, Zheng X & Sehgal A Regulation of feeding and metabolism by neuronal and peripheral clocks in Drosophila. Cell Metab 8, 289–300, doi: 10.1016/j.cmet.2008.09.006 (2008). [DOI] [PMC free article] [PubMed] [Google Scholar]
- 17.García-Gaytán AC et al. Synchronization of the circadian clock by time-restricted feeding with progressive increasing calorie intake. Resemblances and differences regarding a sustained hypocaloric restriction. Scientific Reports 10, 10036, doi: 10.1038/s41598-020-66538-0 (2020). [DOI] [PMC free article] [PubMed] [Google Scholar]
- 18.Kinouchi K et al. Fasting Imparts a Switch to Alternative Daily Pathways in Liver and Muscle. Cell Reports 25, 3299–3314.e3296, doi: 10.1016/j.celrep.2018.11.077 (2018). [DOI] [PMC free article] [PubMed] [Google Scholar]
- 19.Wang H et al. Time-Restricted Feeding Shifts the Skin Circadian Clock and Alters UVB-Induced DNA Damage. Cell Rep 20, 1061–1072, doi: 10.1016/j.celrep.2017.07.022 (2017). [DOI] [PMC free article] [PubMed] [Google Scholar]
- 20.Yamamuro D et al. Peripheral circadian rhythms in the liver and white adipose tissue of mice are attenuated by constant light and restored by time-restricted feeding. PLOS ONE 15, e0234439, doi: 10.1371/journal.pone.0234439 (2020). [DOI] [PMC free article] [PubMed] [Google Scholar]
- 21.Delventhal R et al. Dissection of central clock function in Drosophila through cell-specific CRISPR-mediated clock gene disruption. bioRxiv, 640011, doi: 10.1101/640011 (2019). [DOI] [PMC free article] [PubMed]
- 22.Ulgherait M et al. Circadian regulation of mitochondrial uncoupling and lifespan. Nature Communications 11, 1927, doi: 10.1038/s41467-020-15617-x (2020). [DOI] [PMC free article] [PubMed] [Google Scholar]
- 23.Ulgherait M et al. Dietary Restriction Extends the Lifespan of Circadian Mutants tim and per. Cell Metab 24, 763–764, doi: 10.1016/j.cmet.2016.11.002 (2016). [DOI] [PMC free article] [PubMed] [Google Scholar]
- 24.Hansen M, Rubinsztein DC & Walker DW Autophagy as a promoter of longevity: insights from model organisms. Nature Reviews Molecular Cell Biology 19, 579–593, doi: 10.1038/s41580-018-0033-y (2018). [DOI] [PMC free article] [PubMed] [Google Scholar]
- 25.Scott RC, Schuldiner O & Neufeld TP Role and Regulation of Starvation-Induced Autophagy in the Drosophila Fat Body. Developmental Cell 7, 167–178, doi: 10.1016/j.devcel.2004.07.009 (2004). [DOI] [PubMed] [Google Scholar]
- 26.Kalfalah F et al. Crosstalk of clock gene expression and autophagy in aging. Aging 8, 1876–1895, doi: 10.18632/aging.101018 (2016). [DOI] [PMC free article] [PubMed] [Google Scholar]
- 27.Ma D, Li S, Molusky MM & Lin JD Circadian autophagy rhythm: a link between clock and metabolism? Trends Endocrinol Metab 23, 319–325, doi: 10.1016/j.tem.2012.03.004 (2012). [DOI] [PMC free article] [PubMed] [Google Scholar]
- 28.Rubinsztein David C., Mariño G & Kroemer G Autophagy and Aging. Cell 146, 682–695, doi: 10.1016/j.cell.2011.07.030 (2011). [DOI] [PubMed] [Google Scholar]
- 29.Chang JT, Kumsta C, Hellman AB, Adams LM & Hansen M Spatiotemporal regulation of autophagy during Caenorhabditis elegans aging. Elife 6, doi: 10.7554/eLife.18459 (2017). [DOI] [PMC free article] [PubMed] [Google Scholar]
- 30.DeVorkin L & Gorski SM Monitoring autophagy in Drosophila using fluorescent reporters in the UAS-GAL4 system. Cold Spring Harb Protoc 2014, 967–972, doi: 10.1101/pdb.prot080341 (2014). [DOI] [PubMed] [Google Scholar]
- 31.Ulgherait M, Rana A, Rera M, Graniel J & Walker DW AMPK modulates tissue and organismal aging in a non-cell-autonomous manner. Cell Rep 8, 1767–1780, doi: 10.1016/j.celrep.2014.08.006 (2014). [DOI] [PMC free article] [PubMed] [Google Scholar]
- 32.Mirouse V, Swick LL, Kazgan N, St Johnston D & Brenman JE LKB1 and AMPK maintain epithelial cell polarity under energetic stress. Journal of Cell Biology 177, 387–392, doi: 10.1083/jcb.200702053 (2007). [DOI] [PMC free article] [PubMed] [Google Scholar] [Retracted]
- 33.Barcelo H & Stewart MJ Altering Drosophila S6 kinase activity is consistent with a role for S6 kinase in growth. genesis 34, 83–85, doi: 10.1002/gene.10132 (2002). [DOI] [PubMed] [Google Scholar]
- 34.Tricoire H et al. The steroid hormone receptor EcR finely modulates Drosophila lifespan during adulthood in a sex-specific manner. Mechanisms of Ageing and Development 130, 547–552, doi: 10.1016/j.mad.2009.05.004 (2009). [DOI] [PubMed] [Google Scholar]
- 35.Kaneko M, Park JH, Cheng Y, Hardin PE & Hall JC Disruption of synaptic transmission or clock-gene-product oscillations in circadian pacemaker cells of Drosophila cause abnormal behavioral rhythms. J Neurobiol 43, 207–233, doi: (2000). [DOI] [PubMed] [Google Scholar]
- 36.Plautz JD, Kaneko M, Hall JC & Kay SA Independent Photoreceptive Circadian Clocks Throughout <em>Drosophila</em>. Science 278, 1632, doi: 10.1126/science.278.5343.1632 (1997). [DOI] [PubMed] [Google Scholar]
- 37.Duffy JF, Zitting K-M & Chinoy ED Aging and Circadian Rhythms. Sleep Med Clin 10, 423–434, doi: 10.1016/j.jsmc.2015.08.002 (2015). [DOI] [PMC free article] [PubMed] [Google Scholar]
- 38.Cabrera D, Young MW & Axelrod S Time-restricted feeding prolongs lifespan in Drosophila in a peripheral clock-dependent manner. bioRxiv, 2020.2009.2014.296368, doi: 10.1101/2020.09.14.296368 (2020). [DOI]
- 39.Delventhal R et al. Dissection of central clock function in Drosophila through cell-specific CRISPR-mediated clock gene disruption. eLife 8, e48308, doi: 10.7554/eLife.48308 (2019). [DOI] [PMC free article] [PubMed] [Google Scholar]
- 40.Murphy KR et al. Postprandial sleep mechanics in Drosophila. eLife 5, e19334, doi: 10.7554/eLife.19334 (2016). [DOI] [PMC free article] [PubMed] [Google Scholar]
- 41.Rera M, Clark RI & Walker DW Intestinal barrier dysfunction links metabolic and inflammatory markers of aging to death in Drosophila. Proc Natl Acad Sci U S A 109, 21528–21533, doi: 10.1073/pnas.1215849110 (2012). [DOI] [PMC free article] [PubMed] [Google Scholar]
- 42.Rera M et al. Modulation of longevity and tissue homeostasis by the Drosophila PGC-1 homolog. Cell Metab 14, 623–634, doi: 10.1016/j.cmet.2011.09.013 (2011). [DOI] [PMC free article] [PubMed] [Google Scholar]
- 43.Hughes ME, Hogenesch JB & Kornacker K JTK_CYCLE: an efficient nonparametric algorithm for detecting rhythmic components in genome-scale data sets. J Biol Rhythms 25, 372–380, doi: 10.1177/0748730410379711 (2010). [DOI] [PMC free article] [PubMed] [Google Scholar]
- 44.Claesson MJ et al. Comparison of two next-generation sequencing technologies for resolving highly complex microbiota composition using tandem variable 16S rRNA gene regions. Nucleic Acids Res 38, e200–e200, doi: 10.1093/nar/gkq873 (2010). [DOI] [PMC free article] [PubMed] [Google Scholar]
- 45.Rana A, Rera M & Walker DW Parkin overexpression during aging reduces proteotoxicity, alters mitochondrial dynamics, and extends lifespan. Proceedings of the National Academy of Sciences 110, 8638, doi: 10.1073/pnas.1216197110 (2013). [DOI] [PMC free article] [PubMed] [Google Scholar]
- 46.Schneider CA, Rasband WS & Eliceiri KW NIH Image to ImageJ: 25 years of image analysis. Nat Methods 9, 671–675 (2012). [DOI] [PMC free article] [PubMed] [Google Scholar]
- 47.Copeland JM et al. Extension of Drosophila Life Span by RNAi of the Mitochondrial Respiratory Chain. Current Biology 19, 1591–1598, doi: 10.1016/j.cub.2009.08.016 (2009). [DOI] [PubMed] [Google Scholar]
Associated Data
This section collects any data citations, data availability statements, or supplementary materials included in this article.
Supplementary Materials
Data Availability Statement
The authors declare that all data supporting the findings of this study are available, including replicate experiments, and will be made available upon reasonable request.


