

Abstract
Objectives
The aim of this study was to compare the correlation of gamma‐glutamyl transpeptidase‐to‐platelet ratio (GPR), aspartate aminotransferase‐to‐platelet ratio index (APRI), fibrosis index‐4 (FIB‐4), and liver stiffness measurement (LSM) in the diagnosis of liver fibrosis, and perform a diagnostic value of GPR for predicting fibrosis in CHB patients with NAFLD.
Methods
A retrospective study was conducted on CHB patients concurrent with NAFLD between September 2019 and December 2020. They were divided into control group (LSM ≤ 9.7 kpa) and fibrosis group (LSM ≥ 9.8 kpa). Demographic data were collected; ALT, AST, and PLT were also detected. LSM was measured by transient elastography (TE). The GPR, APRI, and FIB‐4 were calculated. The correlation between GPR, APRI, FIB‐4, and LSM was compared. The accuracy of predicting liver fibrosis using GPR, APRI, and FIB‐4 was assessed.
Results
Eighty‐five CHB patients with NAFLD were enrolled. Multivariate analysis showed that age (p = 0.005), GGT (p = 0.001), and PLT (p = 0.013) were the independent risk factors for LSM. The GPR (p = 0.008), APRI (p = 0.001), and FIB‐4 (p = 0.001) values in fibrosis group were higher than control group. Pearson linear correlation was used to analyze the correlations between LSM and GPR, APRI, and FIB‐4. LSM was correlated with GPR, APRI, and FIB‐4. The AUCs of GPR, APRI, and FIB4 were 0.805, 0.766, and 0.826 in assessing liver fibrosis, respectively. No significant differences in the areas of GPR were comparable to that of APRI and FIB‐4.
Conclusion
GPR has a good correlation with LSM in assessing liver fibrosis and can be used as a noninvasive index for the assessment of liver fibrosis in patients with concomitant CHB and NAFLD.
Keywords: chronic hepatitis, gamma‐glutamyl transpeptidase‐to‐platelet ratio, liver fibrosis, nonalcoholic fatty liver disease
The correlations between LSM and GPR, APRI, FIB‐4. (A) between LSM and GPR (r = 0.244, p = 0.024), (B) between LSM and APRI (r = 0.344, p = 0.001), (C) between LSM and FIB‐4 (r = 0.306, p = 0.004). Abbreviations: APRI, aspartate aminotransferase‐to‐platelet ration index; FIB‐4, fibrosis‐4; GPR, gamma‐glutamyl transpeptidase ‐to‐platelet ration; LSM, liver stiffness measurement.ROC curves of GPR, APRI, and FIB‐4 for significant fibrosis assessment in CHB patients with NAFLD. (A) GPR (AUC = 0.806), (B) APRI (AUC = 0.767), (C) FIB‐4 (AUC = 0.826). Abbreviations: APRI, aspartate aminotransferase‐to‐platelet ration index; AUC, area under the ROC curve; FIB‐4, fibrosis‐4; GPR, gamma‐glutamyl transpeptidase ‐to‐platelet ration.
![]()
1. INTRODUCTION
Chronic hepatitis B (CHB) is a common chronic liver disease, which have a high risk of progression to cirrhosis and even liver cancer. 1 With the improvement of living conditions and lifestyle changes, the incidence rate of nonalcoholic fatty liver disease (NAFLD) is increasing. Coexistence of NAFLD and CHB is commonly observed in high HBV‐endemic regions. 2 A meta‐analysis reported that the prevalence of hepatic steatosis was about 25%–30% among patients with CHB. 3 Previous studies reported that concomitant presence of HBV and hepatic steatosis is associated with increased risk of disease progression to cirrhosis and hepatic and extrahepatic malignancies, 4 , 5 as Choi et al. 6 reported that patients with CHB and nonalcoholic steatohepatitis (NASH) had higher liver‐related outcomes and overall mortality than those with CHB alone. Therefore, it is desirable to have biomarkers that can identify the degree of liver fibrosis in patients concomitant CHB and NAFLD for timely prevention disease progression. 5 , 7 Liver biopsy is the gold standard to diagnose fibrosis; however, it is difficult to be accepted by patients due to the factors of invasive, high cost, complications, and so on. As an important measure of noninvasive diagnosis of liver fibrosis, transient elastography (TE) is widely used in clinical practice. 8 Previous studies have already demonstrated the diagnostic value of serum markers for the degree of liver fibrosis. For example, the aspartate aminotransferase‐ (AST‐) to‐platelet ratio index (APRI) and fibrosis‐4 (FIB‐4) are scores showing satisfactory performance to exclude liver cirrhosis. 9 , 10 , 11 Recently, the gamma‐glutamyl transpeptidase‐ (GGT‐) to‐platelet ratio (GPR) has been shown to have the same diagnostic value as APRI and FIB‐4 in assessment of liver fibrosis with CHB, and even it is considered that GPR is more accurate than APRI and FIB‐4 in evaluating liver fibrosis in patients with CHB. 12 , 13 However, there are few data to explore the diagnostic value of GPR for liver fibrosis in patients with concomitant CHB and NAFLD. Therefore, the aims of this retrospective study were to (a) compare the correlation of GPR and liver stiffness measurement (LSM) detected by TE in diagnosis of hepatic fibrosis (b) explore the diagnostic value of GPR for liver fibrosis in patients with concomitant CHB and NAFLD.
2. PATIENTS AND METHODS
2.1. Study population
This retrospective study collected consecutive patients from the Department of Hepatology, the Third Affiliated Hospital of Shenzhen University between September 1, 2019, and December 31, 2020. All patients were enrolled with CHB and NAFLD. CHB patients were diagnosed with the Guideline of Prevention and Treatment for Chronic Hepatitis B (2019 Version). 14 NAFLD was diagnosed with TE and Doppler ultrasound. The controlled attenuation parameter (CAP) value of TE was used to determine the degree of fatty liver. Further eligibility criteria were as follows: age 18–75 and have detectable HBsAg for 6 months. The exclusion criteria included the following: significant alcohol consumption (alcohol consumption is defined as alcohol intake >30 g/day for men and intake >20 g/day for women), coinfection with other hepatitis virus or HIV, autoimmune hepatitis, and drug‐induced liver disease, concurrent tumors, pregnant, and nursing women. The study protocol conformed to the ethical guidelines of the Declaration of Helsinki and was approved by Luohu hospital's Ethical Committee. Informed consent was obtained from each patient enrolled in the study.
2.2. LSM and CAP detected by TE
TE was detected with a Fibrotouch system (HepTest) using the M probe. All LSM and CAP were detected under fasting conditions by experienced operators according to the manufacturer's protocol. According to well‐established methods, 15 operators were blinded to the clinical data. The value expressed in kilopascal (kPa) was recorded as a representation of the LSM. The value expressed in db/m was recorded as a representation of the CAP. Up to 10 valid measurements were performed on each patient. A success rate above 70% and an interquartile range/median ratio of less than 30% were considered reliable. 15
The fatty liver degree is diagnosed by CAP value. normal: CAP ≤ 239 db/m, mild fatty liver: 240‐264 db/m, moderate fatty liver: 265‐294 db/m, severe fatty liver: CAP ≥ 295 db/m. The fibrosis degree is determined according to the LSM value. Significant fibrosis assessment uses LSM (F3 ≥ 9.8 kpa) as a reference standard.
2.3. Assay methods
All laboratory parameters were detected by standard automated laboratory methods and using commercially available kits according to the manufacturer's protocols. Serum HBV DNA levels were detected using a quantitative real‐time PCR assay (DAAN Gene Co., Ltd.), with a lower limit of detection of 100 IU/ml. HBV serum markers were determined using an commercially available chemiluminescence assay kits (Abbott Diagnostic Systems). Liver function, other biochemical indexes assays, and blood cell counts were measured using automated techniques. On the basis of these biological parameters, the following noninvasive fibrosis scores were calculated as follows:
2.4. Statistical analysis
Data were analyzed using the SPSS software version 20.0 (SPSS Inc.) and MedCalc version 15.2.2 (MedCalc Software). Quantitative data were presented as the mean ± standard deviation (SD). Categorical data were presented as counts and percentages. HBV DNA levels were presented as log transformation. ANOVA and Student's t test were used for quantitative data. Pearson chi‐square and Fisher exact tests were used for categorical variables. Logistic regression analysis was used to investigate the factors were associated with LSM to clinical parameters. Pearson's correlation was used to analyze the correlations of LSM and noninvasive hepatic fibrosis indexes. The diagnostic performance was estimated by using receiver operating characteristic (ROC) curves. Differences between the areas under the ROC curves (AUCs) were compared using DeLong's test. A two‐tailed p‐value <0.05 was considered statistically significant.
3. RESULTS
3.1. Subject disposition
A total of 85 chronic hepatitis B patients concurrent with non‐alcohol fatty liver disease were eligible for this analysis. Characteristics of the participants are shown in Table 1. According to the LSM value detected by TE, they were divided into control group (LSM ≤ F2) and fibrosis group (LSM ≥ F3). In fibrosis group, 87.5% (n = 16) were male, mean age was 48 years, and mean HBV DNA was 3.85 log10IU/ml. AST and GGT were higher in fibrosis group than control group. PLT was lower in fibrosis group than control group. Statistical differences were observed between the two groups.
TABLE 1.
Concomitant with HBV and NAFLD Patients characteristics
| Characteristic | Control group (n = 69) | Fibrosis group (n = 16) | p‐Value |
|---|---|---|---|
| Male gender (n, %) | 54 (78.3%) | 14 (87.5%) | 0.509 |
| Age (years) | 39.16 ± 11.59 | 47.68 ± 10.70 | 0.009 |
| BMI (kg/m2) | 24.26 ± 3.25 | 25.28 ± 3.73 | 0.274 |
| ALT (U/L) | 33.74 ± 22.15 | 47.75 ± 42.15 | 0.064 |
| AST (U/L) | 24.72 ± 8.86 | 42.24 ± 35.51 | 0.000 |
| TBIL (μmol/L) | 11.92 ± 6.22 | 12.26 ± 5.10 | 0.840 |
| GGT (U/L) | 31.29 ± 19.91 | 103.38 ± 186.25 | 0.002 |
| ALP (U/L) | 75.58 ± 33.67 | 83.31 ± 27.97 | 0.339 |
| BUN (mmol/L) | 4.81 ± 1.10 | 4.91 ± 0.79 | 0.723 |
| CR (μmol/L) | 78.13 ± 13.94 | 75.81 ± 14.74 | 0.555 |
| UA (μmol/L) | 365.03 ± 97.66 | 355.94 ± 104.76 | 0.741 |
| WBC (×109/L) | 6.09 ± 1.43 | 6.22 ± 1.22 | 0.728 |
| RBC (×109/L) | 5.04 ± 0.73 | 4.77 ± 0.78 | 0.187 |
| HGB (g/L) | 146.35 ± 16.50 | 143.38 ± 17.02 | 0.520 |
| PLT (×109/L) | 232.04 ± 50.36 | 197.00 ± 54.95 | 0.016 |
| HBeAg positive (n, %) | 25 (36.2%) | 6 (37.5%) | 0.924 |
| HBVDNA (log10 IU/ml) | 3.18 ± 1.74 | 3.85 ± 2.03 | 0.178 |
| CAP (db/m) | |||
| Mild fatty liver | 49 (71%) | 10 (62.5%) | |
| Moderate fatty liver | 16 (27.2%) | 6 (37.5%) | |
| Sever fatty liver | 4 (5.8%) | 0 (0%) |
Note: Data were expressed as means and standard deviations or percentages.
Abbreviations: ALP, alkaline phosphatase; ALT, alanine aminotransferase; AST, aspartate aminotransferase; BMI, body mass index; BUN, blood urea nitrogen; CR, serum creatinine; GGT, Gamma‐glutamyl transpeptidase; HGB, hemoglobin; PLT, platelets count; RBC, red blood cell; TBIL, total bilirubin; UA, uric acid; WBC, white blood cell.
3.2. Influence factors associated with LSM
The univariate and multivariate Logistic regression model were used to analyze risk factors analysis for LSM. The univariate regression analysis showed that age, AST, GGT, and PLT were the influencing factors of LSM. Multivariate analysis showed that age (OR, 1.062; 95% CI, 1.000–1.128; p = 0.05), GGT (OR, 1.046; 95% CI, 1.018–1.075; p = 0.001), and PLT (OR, 1.98; 95% CI, 1.964–1.996; p = 0.013) were the independent risk factors for LSM (Table 2).
TABLE 2.
Univariate and multivariate analyses of influence factors associated with LSM
| Parameter | Univariate analysis | Multivariate analysis | ||||
|---|---|---|---|---|---|---|
| OR | 95% CI | p | OR | 95% CI | p | |
| Age | 1.060 | 1.012–1.111 | 0.014 | 1.062 | 1.000–1.128 | 0.05 |
| Gender | 1.944 | 0.397–0.952 | 0.412 | |||
| BMI | 1.098 | 0.929–1.297 | 0.273 | |||
| ALT | 1.016 | 0.998–1.034 | 0.089 | |||
| AST | 1.055 | 1.011–1.101 | 0.015 | |||
| TBIL | 1.009 | 0.923–1.103 | 0.838 | |||
| GGT | 1.037 | 1.013–1.061 | 0.002 | 1.046 | 1.018–1.075 | 0.001 |
| ALP | 1.007 | 0.992–1.021 | 0.358 | |||
| UA | 0.999 | 0.993–1.005 | 0.738 | |||
| WBC | 1.073 | 0.725–1.589 | 0.725 | |||
| PLT | 1.985 | 1.972–1.998 | 0.022 | 1.98 | 1.964–1.996 | 0.013 |
| AFP | 1.190 | 0.952–1.486 | 0.126 | |||
| HBeAg (+) | 1.056 | 0.343–3.252 | 0.924 | |||
| HBVDNA | 1.211 | 0.914–1.604 | 0.182 | |||
Abbreviations: ALP, alkaline phosphatase; ALT, alanine aminotransferase; AST, aspartate aminotransferase; BMI, body mass index; BUN, blood urea nitrogen; CR, serum creatinine; GGT, Gamma‐glutamyl transpeptidase; HGB, hemoglobin; PLT, platelets count; RBC, red blood cell; TBIL, total bilirubin; UA, uric acid; WBC, white blood cell.
3.3. Comparison of GPR, APRI, and FIB‐4 at different fibrosis stages
The value of GPR and FIB‐4 at different levels was compared by independent‐sample t test. It was concluded that the value of GPR (p = 0.008), APRI (p = 0.001), and FIB‐4 (p = 0.001) at fibrosis group was higher than at control group, respectively. The difference was statistically significant (all p < 0.01, Table 3).
TABLE 3.
Comparison of GPR, APRI, and FIB‐4 at different groups
| Control group | Fibrosis groups | p‐Value | |
|---|---|---|---|
| GRP | 0.233 ± 0.151 | 1.266 ± 0.178 | 0.008 |
| APRI | 0.285 ± 0.145 | 0.647 ± 0.370 | 0.001 |
| FIB‐4 | 0.807 ± 0.379 | 1.919 ± 0.684 | 0.001 |
Abbreviations: APRI, aspartate aminotransferase‐to‐platelet ration index; FIB‐4, fibrosis‐4; GPR: gamma‐glutamyl transpeptidase ‐to‐platelet ration; LSM, liver stiffness measurement.
3.4. Correlations between LSM and GPR, APRI, and FIB‐4
Pearson linear correlation was used to analyze the correlations between LSM and GPR, APRI, and FIB‐4. LSM was positively correlated with GPR (r = 0.244, p = 0.024), APRI (r = 0.344, p = 0.001), and FIB‐4 (r = 0.306, p = 0.004), respectively (Figure 1).
FIGURE 1.
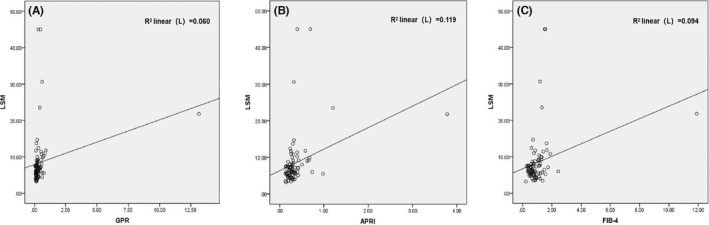
Correlations between LSM and GPR, APRI, and FIB‐4. (A) between LSM and GPR (r = 0.244, p = 0.024), (B) between LSM and APRI (r = 0.344, p = 0.001), (C) between LSM and FIB‐4 (r = 0.306, p = 0.004). Abbreviations: APRI, aspartate aminotransferase‐to‐platelet ration index; FIB‐4, fibrosis‐4; GPR, gamma‐glutamyl transpeptidase ‐to‐platelet ration; LSM, liver stiffness measurement
3.5. Diagnostic value for significant fibrosis
ROC curve was used to evaluate the diagnostic value of GPR in liver fibrosis patients concurrent with HBV and NAFLD. Significant fibrosis assessment uses LSM (F ≥ 9.8 kpa) as a reference standard. The diagnostic value of GPR, APRI, and FIB‐4 for significant fibrosis assessment is showed in Figure 2. The AUCs of GPR, APRI, and FIB‐4 were 0.806, 0.766, and 0.826,respectively. No significant differences in the areas of GPR were comparable to that of APRI (p = 0.7921) and FIB‐4 (p = 0.5453). The desired sensitivity level of 75% was respectively achieved at cutoff values of 0.31, 0.29, and 1.07 for GPR, APRI, and FIB‐4. Correspondingly, the specificity was 79.7%, 66.7%, and 79.7%, respectively. The Youden index of GPR, APRI, and Fib‐4 was 0.547, 0.417, and 0.547 (Table 4).
FIGURE 2.
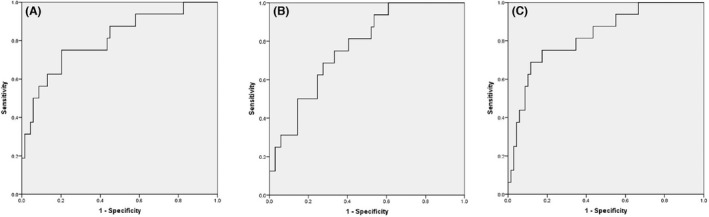
ROC curves of GPR, APRI, and FIB‐4 for significant fibrosis assessment in CHB patients with NAFLD. (A) GPR (AUC = 0.806), (B) APRI (AUC = 0.767), (C) FIB‐4 (AUC = 0.826). Abbreviations: APRI, aspartate aminotransferase‐to‐platelet ration index; AUC, area under the ROC curve; FIB‐4, fibrosis‐4; GPR, gamma‐glutamyl transpeptidase ‐to‐platelet ration
TABLE 4.
Diagnostic value of GPR, APRI, and FIB‐4 in CHB patients with NAFLD for significant fibrosis
| Variables | GPR | APRI | FIB‐4 |
|---|---|---|---|
| AUC | 0.806 (0.697–0.933) | 0.767 (0.652–0.882) | 0.826 (0.715–0.937) |
| Cut‐off value | 0.31 | 0.29 | 1.07 |
| Sensitivity (%) | 75.0 (47.6–92.7) | 75.0 (47.6–92.7) | 75.0 (47.6–92.7) |
| Specificity (%) | 79.7 (68.3–88.4) | 66.7 (54.3–77.6) | 79.7 (68.3–88.4) |
| PPV (%) | 46.2 (33.2–59.7) | 34.3 (25.2–44.7) | 46.2 (33.2–59.7) |
| NPV (%) | 93.2 (85.4–97.0) | 92.0 (82.9–96.5) | 93.2 (85.4–97.0) |
| PLR | 3.7 (2.1–6.4) | 2.25 (1.5–3.5) | 3.7 (2.1–6.4) |
| NLR | 0.31 (0.1–0.7) | 0.38 (0.2–0.9) | 0.31 (0.1–0.7) |
| Youden index | 0.547 | 0.416 | 0.547 |
Note: Significant fibrosis assessment using LSM (F ≥ 2) as a reference standard. The cutoff value was determined to achieve a sensitivity of 75% in predicting significant fibrosis, and data in parentheses were 95% confidence interval.
Abbreviations: APRI, aspartate aminotransferase‐ (AST‐) to‐platelet ratio index; AUC, area under the ROC curve; FIB‐4, fifibrosis‐4; GPR, gamma‐glutamyl transpeptidase‐to‐platelet ratio; NLR, negative likelihood ratio; NPV, negative predictive value; PLR, positive likelihood ratio; PPV, positive predictive value.
4. DISCUSSION
Noninvasive assessment of liver fibrosis is urgently essential. Transient elastography(TE), which is widely used, can accurately evaluate the inflammation and fibrosis of liver tissue. 8 , 10 Relevant research results suggest that Fibroscan may improve the sensitivity of the diagnosis of liver fibrosis in patients with CHB and ALT levels <2 times the upper normal limit, and that this sensitivity may increase with the progression of liver fibrosis. 17 However, the LSM is affected by inflammation, congestion, cholestasis, different probes, and other factors. 18 Liver inflammation can increase the value of liver stiffness detected by TE. 19 During the acute flare of chronic hepatitis, the value of LSM will increase when ALT reflecting inflammation of the liver elevated. Inflammation has a significant influence on LSM values in patients with chronic hepatitis B with mild fibrosis, but not in those with significant fibrosis. 20 , 21 In this study, multivariate logistic regression analysis showed that age, GGT, and ALP were independent influencing factors of LSM. It is suggested that biochemical indexes should be taken into consideration when interpreting LSM report.
Several serum biochemical markers (such as FIB‐4 and APRI) have also been used to evaluate the degree of liver fibrosis in chronic liver disease. 11 , 22 Recently, a new biochemical marker GPR has been recommended for patients with chronic liver disease. GPR has been shown to be equivalent or superior to APRI and FIB‐4 in CHB patients in several studies. 23 , 24 Khare et al. reported that noninvasive blood parameters (APRI, FIB‐4, and GPR) with negative predictive values above 93% are excellent parameters for ruling‐out significant fibrosis in patients with chronic hepatitis B. 25 However, less is known about the diagnostic value in hepatic fibrosis of GPR in CHB patients with NAFLD. This study analyzed the correlation between GPR, APRI, FIB‐4, and LSM in CHB patients with NAFLD. The results showed that GPR, APRI, and FIB‐4 were highly correlated with LSM. It is suggested that serological markers could better evaluate liver fibrosis.
ROC curve was used to appraise the diagnostic value of GPR in hepatic fibrosis patients concurrent with HBV and NAFLD. GPR, APRI, and FIB‐4 have better diagnostic value in the evaluation of liver fibrosis in CHB patients with NAFLD. The AUCs of GPR, APRI, and FIB‐4 were 0.805,0.766,and 0.826,respectively. The AUC area of GPR and FIB‐4 seems to be higher than that of APRI, but the difference is not statistically significant, and the AUC area of GPR was similar to that of APRI (p = 0.7921) and FIB‐4 (p = 0.5453). This result is consistent with previous study on the value of noninvasive markers in the evaluation of liver fibrosis in patients with chronic hepatitis B and nonalcoholic fatty liver disease. 12 Similarly, in another study, GPR was used to compare with APRI and FIB‐4 in the diagnosis of liver fibrosis in patients with chronic hepatitis B. The results showed that the diagnostic value of GPR did not show a greater advantage compared with APRI and FIB‐4. 26 , 27 However, Lemoine suggested that GPR may be better than APRI in predicting significant hepatic fibrosis and cirrhosis in CHB patients. 13 This result is inconsistent with the above studies. The reason may be related to whether fatty liver aggravates the inflammation of the liver and also be different from the normal range of biochemical tests in different hospitals.
However, in different diseases states, the diagnostic value of the corresponding noninvasive indicators in evaluating fibrosis is different. GPR and APRI were reported to be more effective than FIB‐4 and red cell distribution width‐platelet ratio (RPR) at diagnosing liver inflammation and fibrosis in treatment‐naive CHB patients. 28 Dong et al. suggested that HBeAg status should be taken into account when GPR was used to diagnose liver fibrosis and cirrhosis. 24 FIB‐4 seems to be more useful than GPR and APRI in predicting the risk assessment of CHB‐induced HCC development. 29
Other new indicators or combined detection indicators are used to predict liver fibrosis. INR‐to‐platelet ratio (INPR) is regarded as a new marker to predict fibrosis in patients with CHB. The AUCs of INPR for predicting significant fibrosis, advanced fibrosis, and cirrhosis were 0.74, 0.76, and 0.86, respectively. 30 The FibroScan‐AST (FAST) score also provides an efficient way to noninvasively identify patients at risk of activity and fibrosis for NASH and could reduce unnecessary liver biopsy. 31 GPR combined with fibrinogen could be used as a prognostic indicator of HBV‐related hepatocellular carcinoma. 32 A sequential combinations of FIB4‐FM (VCTE) provide an excellent diagnostic accuracy of 90% of advanced fibrosis in NAFLD. 33 The above studies suggest that different noninvasive markers have different values in predicting liver fibrosis.
Unfortunately, there are some defects in this study. Liver biopsy is recognized as the gold standard for the diagnosis of liver fibrosis. However, it is unwilling to perform liver biopsy for many patients considering its invasiveness, high cost, discomfort, and other risks. Due to the limitation of conditions, the LSM value detected by TE was used as the diagnostic reference of liver fibrosis, rather than liver biopsy. In addition, It cannot reflect the whole process of the development of liver disease in this cross‐sectional study. Therefore, a multi‐center, large sample randomized controlled clinical study is needed to further explore the diagnostic value of GPR in predicting liver fibrosis in HBV patients concomitant with NAFLD.
In conclusion, GPR has a good correlation with LSM in assessing liver fibrosis in CHB patients with NAFLD and can be used as a noninvasive measure to predict hepatic fibrosis in patients concomitant with CHB and NAFLD, which is simple, convenient, and effective.
AUTHOR CONTRIBUTIONS
Jie Luo and Zhan Du were involved in the study design. Clinical studies were performed by Jie Luo and Zhan Du. Statistical analysis included input from Jie Luo and Zhan Du, while DongLi Liang, Manni Li, and Yanyao Yin collected the data. The study was prepared by Jie Luo and Zhan Du, while the study review by Mingfa Chen and Liuqing Yang. All authors reviewed and edited the report and have seen and approved the final draft.
CONFLICT OF INTEREST
The authors declare that they have no competing interests.
ACKNOWLEDGEMENT
This study was supported by grants from the Shenzhen Luohu Soft Science Project (LX20191307, LX20201108).
Luo J, Du Z, Liang D, et al. Gamma‐Glutamyl Transpeptidase‐to‐Platelet ratio predicts liver fibrosis in patients with concomitant chronic hepatitis B and nonalcoholic fatty liver disease. J Clin Lab Anal. 2022;36:e24596. doi: 10.1002/jcla.24596
Jie Luo and Zhan Du: Co‐first authors, contributed equally to this work.
Contributor Information
Mingfa Chen, Email: cmf20170328@163.com.
Liuqing Yang, Email: windflower0702@hotmail.com.
DATA AVAILABILITY STATEMENT
Data are available from the corresponding author on reasonable account.
REFERENCES
- 1. Tang A, Hallouch O, Chernyak V, Kamaya A, Sirlin CB. Epidemiology of hepatocellular carcinoma: target population for surveillance and diagnosis. Abdom Radiol (NY). 2018;43(1):13‐25. [DOI] [PubMed] [Google Scholar]
- 2. Hanif H, Khan MM, Ali MJ, et al. A new endemic of concomitant nonalcoholic fatty liver disease and chronic hepatitis B. Microorganisms. 2020;8(10):1526. [DOI] [PMC free article] [PubMed] [Google Scholar]
- 3. Hui RWH, Seto WK, Cheung KS, et al. Inverse relationship between hepatic steatosis and hepatitis B viremia: results of a large case‐control study. J Viral Hepat. 2018;25(1):97‐104. [DOI] [PubMed] [Google Scholar]
- 4. Chan AW, Wong GL, Chan HY, et al. Concurrent fatty liver increases risk of hepatocellular carcinoma among patients with chronic hepatitis B. J Gastroenterol Hepatol. 2017;32(3):667‐676. [DOI] [PubMed] [Google Scholar]
- 5. Peleg N, Issachar A, Sneh Arbib O, et al. Liver steatosis is a strong predictor of mortality and cancer in chronic hepatitis B regardless of viral load. JHEP Rep. 2019;1(1):9‐16. [DOI] [PMC free article] [PubMed] [Google Scholar]
- 6. Choi HSJ, Brouwer WP, Zanjir WMR, et al. Nonalcoholic steatohepatitis is associated with liver‐related outcomes and all‐cause mortality in chronic hepatitis B. Hepatology. 2020;71(2):539‐548. [DOI] [PubMed] [Google Scholar]
- 7. Wong GL, Wong VW, Choi PC, et al. Metabolic syndrome increases the risk of liver cirrhosis in chronic hepatitis B. Gut. 2009;58(1):111‐117. [DOI] [PubMed] [Google Scholar]
- 8. Lim JK, Flamm SL, Singh S, Falck‐Ytter YT. American Gastroenterological Association Institute guideline on the role of elastography in the evaluation of liver fibrosis. Gastroenterology. 2017;152(6):1536‐1543. [DOI] [PubMed] [Google Scholar]
- 9. WHO . Guidelines Approved by the Guidelines Review Committee. Guidelines for the Prevention, Care and Treatment of Persons with Chronic Hepatitis B Infection. World Health Organization; 2015. [PubMed] [Google Scholar]
- 10. Li Q, Huang C, Xu W, Hu Q, Chen L. Accuracy of FibroScan in analysis of liver fibrosis in patients with concomitant chronic hepatitis B and nonalcoholic fatty liver disease. Medicine. 2020;99(23):e20616. [DOI] [PMC free article] [PubMed] [Google Scholar]
- 11. Sonneveld MJ, Brouwer WP, Chan HL, et al. Optimisation of the use of APRI and FIB‐4 to rule out cirrhosis in patients with chronic hepatitis B: results from the SONIC‐B study. Lancet Gastroenterol Hepatol. 2019;4(7):538‐544. [DOI] [PubMed] [Google Scholar]
- 12. Li Q, Lu C, Li W, Huang Y, Chen L. The gamma‐glutamyl transpeptidase to platelet ratio for non‐invasive assessment of liver fibrosis in patients with chronic hepatitis B and non‐alcoholic fatty liver disease. Oncotarget. 2017;8(17):28641‐28649. [DOI] [PMC free article] [PubMed] [Google Scholar]
- 13. Lemoine M, Shimakawa Y, Nayagam S, et al. The gamma‐ glutamyl transpeptidase to platelet ratio (GPR) predicts significant liver fibrosis and cirrhosis in patients with chronic HBV infection in West Africa. Gut. 2016;65(8):1369‐1376. [DOI] [PMC free article] [PubMed] [Google Scholar]
- 14. Chinese Society of Hepatology and Chinese Society of Infectious Diseases, Chinese Medical Association . The guideline of prevention and treatment for chronic hepatitis B (2019 version). Zhonghua Gan Zang Bing Za Zhi. 2019;27(12):938‐961. [DOI] [PMC free article] [PubMed] [Google Scholar]
- 15. Wai CT, Greenson JK, Fontana RJ, et al. A simple noninvasive index can predict both significant fibrosis and cirrhosis in patients with chronic hepatitis C. Hepatology. 2003;38(2):518‐526. [DOI] [PubMed] [Google Scholar]
- 16. Sterling RK, Lissen E, Clumeck N, et al. Development of a simple noninvasive index to predict significant fibrosis in patients with HIV/HCV coinfection. Hepatology. 2006;43(6):1317‐1325. [DOI] [PubMed] [Google Scholar]
- 17. Huang R, Jiang N, Yang R, et al. Fibroscan improves the diagnosis sensitivity of liver fibrosis in patients with chronic hepatitis B. Exp Ther Med. 2016;11(5):1673‐1677. [DOI] [PMC free article] [PubMed] [Google Scholar]
- 18. Oeda S, Tanaka K, Oshima A, Matsumoto Y, Sueoka E, Takahashi H. Diagnostic accuracy of FibroScan and factors affecting measurements. Diagnostics (Basel). 2020;10(11):940. [DOI] [PMC free article] [PubMed] [Google Scholar]
- 19. Chen XB, Xia Z, Chen LY, Chen EQ, Tang H, et al. Accuracy of Fibroscan for the diagnosis of liver fibrosis influenced by serum alanine aminotransferase levels in patents with chronic hepatitis B. Chin. J Hepatol. 2011;19(4):286‐290. [DOI] [PubMed] [Google Scholar]
- 20. Verveer C, Zondervan PE, Kate FJW, Hansen BE, Janssen HLA, Knegt RJ. Evaluation of transient elastography for fibrosis assessment compared with large biopsies in chronic hepatitis B and C. Liver Int. 2012;32(4):622‐628. [DOI] [PubMed] [Google Scholar]
- 21. Zeng X, Xu C, He D, et al. Influence of hepatic inflammation on FibroScan findings in diagnosing fibrosis in patients with chronic hepatitis B. Ultrasound Med Biol. 2015;41(6):1538‐1544. [DOI] [PubMed] [Google Scholar]
- 22. Yen YH, Kuo FY, Kee KM, et al. APRI and FIB‐4 in the evaluation of liver fibrosis in chronic hepatitis C patients stratified by AST level. PloS One. 2018;13(6):e0199760. [DOI] [PMC free article] [PubMed] [Google Scholar]
- 23. Lee J, Kim MY, Kang SH, et al. The gamma‐glutamyl transferase to platelet ratio and the FIB‐4 score are noninvasive markers to determine the severity of liver fibrosis in chronic hepatitis B infection. Br J Biomed Sci. 2018;75(3):128‐132. [DOI] [PubMed] [Google Scholar]
- 24. Dong M, Wu J, Yu X, et al. Validation and comparison of seventeen noninvasive models for evaluating liver fibrosis in Chinese hepatitis B patients. Liver Int. 2018;38(9):1562‐1570. [DOI] [PubMed] [Google Scholar]
- 25. Khare S, Arora A, Sharma P, et al. Performance of non‐ invasive blood parameters for ruling out significant liver fibrosis in patients with chronic hepatitis B. J Clin Transl Hepatol. 2020;8(2):143‐149. [DOI] [PMC free article] [PubMed] [Google Scholar]
- 26. Li Q, Song J, Huang Y, et al. The gamma‐glutamyl‐transpeptidase to platelet ratio does not show advantages than APRI and fib‐4 in diagnosing significant fibrosis and cirrhosis in patients with chronic hepatitis B: a retrospective cohort study in China. Medicine. 2016;95(16):e3372. [DOI] [PMC free article] [PubMed] [Google Scholar]
- 27. Huang R, Wang G, Tian C, et al. Gamma‐glutamyl‐transpeptidase to platelet ratio is not superior to APRI,FIB‐4 and RPR for diagnosing liver fibrosis in CHB patients in China. Sci Rep. 2017;7(1):8543. [DOI] [PMC free article] [PubMed] [Google Scholar]
- 28. Wu X, Cai B, Su Z, et al. Aspartate transaminase to platelet ratio index and gamma‐glutamyl transpeptidase‐to‐platelet ratio outweigh fibrosis index based on four factors and red cell distribution width‐platelet ratio in diagnosing liver fibrosis and inflammation in chronic hepatitis B. J Clin Lab Anal. 2018;32(4):e22341. [DOI] [PMC free article] [PubMed] [Google Scholar]
- 29. Kim MN, Lee JH, Chon YE, Ha Y, Hwang SG. Fibrosis‐4, aspartate transaminase‐to‐platelet ratio index, and gamma‐glutamyl transpeptidase‐to‐platelet ratio for risk assessment of hepatocellular carcinoma in chronic hepatitis B patients: comparison with liver biopsy. Eur J Gastroenterol Hepatol. 2020;32(3):433‐439. [DOI] [PubMed] [Google Scholar]
- 30. Ding R, Zheng J, Huang D, et al. INR‐to‐platelet ratio (INPR) as a novel noninvasive index for predicting liver fibrosis in chronic hepatitis B. Int J Med Sci. 2021;18(5):1159‐1166. [DOI] [PMC free article] [PubMed] [Google Scholar]
- 31. Newsome PN, Sasso M, Deeks JJ, et al. FibroScan‐AST (FAST) score for the non‐invasive identification of patients with non‐alcoholic steatohepatitis with significant activity and fibrosis: a prospective derivation and global validation study. Lancet Gastroenterol Hepatol. 2020;5(4):362‐373. [DOI] [PMC free article] [PubMed] [Google Scholar]
- 32. Dai T, Deng M, Ye L, et al. Prognostic value of combined preoperative gamma‐glutamyl transpeptidase to platelet ratio and fibrinogen in patients with HBV‐related hepatocellular carcinoma after hepatectomy. Am J Transl Res. 2020;12(6):2984‐2997. [PMC free article] [PubMed] [Google Scholar]
- 33. Boursier J, Guillaume M, Leroy V, et al. New sequential combinations of non‐invasive fibrosis tests provide an accurate diagnosis of advanced fibrosis in NAFLD. J Hepatol. 2019;71(2):389‐396. [DOI] [PubMed] [Google Scholar]
Associated Data
This section collects any data citations, data availability statements, or supplementary materials included in this article.
Data Availability Statement
Data are available from the corresponding author on reasonable account.