Abstract
Purpose
To determine the agreement and repeatability of inner retinal thickness measures from widefield imaging compared to standard scans in healthy nonhuman primates.
Methods
Optical coherence tomography (OCT) scans were acquired from 30 healthy rhesus monkeys, with 11 animals scanned at multiple visits. The scan protocol included 20° × 20° raster scans centered on the macula and optic nerve head (ONH), a 12° diameter circular scan centered on the ONH, and a 55 × 45° widefield raster scan. Each scan was segmented using custom neural network–based algorithms. Bland–Altman analysis were used for comparing average circumpapillary retinal nerve fiber layer (RNFL) thickness and ganglion cell inner plexiform layer (GCIPL) thickness for a 16° diameter region. Comparisons were also made for similar 1° × 1° superpixels from the raster scans.
Results
Average circumpapillary RNFL thickness from the circular scan was 114.2 ± 5.8 µm, and 113.2 ± 7.3 µm for an interpolated scan path from widefield imaging (bias = −1.03 µm, 95% limits of agreement [LOA] −8.6 to 6.5 µm). GCIPL thickness from standard raster scans was 72.7 ± 4.3 µm, and 73.7 ± 3.7 µm from widefield images (bias = 1.0 µm, 95% LOA −2.4 to 4.4 µm). Repeatability for both RNFL and GCIPL standard analysis was less than 5.2 µm. For 1° × 1° superpixels, the 95% limits of agreement were between −13.9 µm and 13.7 µm for RNFL thickness and −2.5 µm and 2.5 µm for GCIPL thickness.
Conclusions
Inner retinal thickness measures from widefield imaging have good repeatability and are comparable to those measured using standard scans.
Translational Relevance
Monitoring retinal ganglion cell loss in the non-human primate experimental glaucoma model could be enhanced using widefield imaging.
Keywords: non-human primate, optical coherence tomography, GCIPL, RNFL
Introduction
Optical coherence tomography (OCT) produces high-resolution images of ocular tissues and has become an essential tool for managing ocular pathologies. For glaucoma management, retinal ganglion cell content is assessed using circumpapillary retinal nerve fiber layer (RNFL) thickness and macula ganglion cell inner plexiform layer (GCIPL) thickness.1,2 In combination or independently, these measures demonstrate good repeatability and diagnostic value.3–5
Although there have been significant improvements in OCT resolution and speed, assessing RNFL and GCIPL thickness commonly requires two separate scans. These include a volume or circular scan centered on the optic nerve head and a volume scan centered on the fovea. Because there are often expected losses in both regions, combining the scanned areas with montaging algorithms has been shown to have added value.6 In fact, by montaging several raster scans, inner retinal thickness maps covering the entire area sampled by perimetry can be generated.7,8 Although montaging is effective, scanning multiple regions with subsequent scan registration takes longer and adds an element of variability. In contrast, widefield OCT can scan areas routinely sampled for visual function. These single wide-angle scans are valuable for detecting arcuate defects,9 and segmented thickness measures correspond well to those from more standard scan protocols.10,11
The rhesus macaque (Macaca mulatta) has similar ocular and brain anatomy to humans, and experimental glaucoma in this model has provided valuable insights into disease pathophysiology and changes in visual function.12–16 As with the human condition, monitoring experimental glaucoma nominally involves two scans to assess optic nerve head and macula health. Widefield scans are commonly not acquired in this model, and normative data, including variability of thickness measures, have not yet been established. Nonhuman primates (NHPs) are a scarce resource, hence maximizing and standardizing data collected are important for comparability across studies. We hypothesized that inner retinal thickness measures from widefield scans are similar to those obtained using standard protocols and have similar repeatability. Our study aimed to determine the utility of widefield scans in quantifying RNFL and macula ganglion cell inner plexiform layer (GCIPL) thickness in healthy rhesus macaques.
Methods
Subjects
A total of 30 rhesus monkeys (13 female) were used for this study (mean age 5.6 years, range 1.6–9.8 years). Both eyes of each animal were imaged, but to minimize bias from intereye symmetry, data from only one randomized eye was used for analysis (14 right eyes). Eleven animals were imaged at least four times, with each of the repeated scans obtained at least two weeks apart to determine repeatability. Experimental and animal care procedures were reviewed and approved by the Institutional Animal Care and Use Committee of the University of Houston. The use of animals adhered to the ARVO Statement for the Use of Animals in Ophthalmic and Vision Research.
Animal Sedation
Before sedation, animals were fasted for at least 12 hours but were allowed free access to water. An intramuscular injection of ketamine (20–25 mg/kg) and xylazine (0.4–0.5 mg/kg) was administered after lightly squeezing the animal in their home cage. After transport to the imaging laboratory, animals were given a subcutaneous injection of atropine sulfate (0.04 mg/kg), and pupils were dilated with 1% tropicamide. Most imaging sessions lasted approximately one hour, and when extra time was needed, an additional injection of ketamine (20–25 mg/kg) and xylazine (0.4–0.5 mg/kg) was administered an hour after the initial dose. For the duration of anesthesia, heart rate and partial pressure of oxygen were continuously monitored, and a heated pad was used to keep the animal at a steady body temperature. After the imaging session, atipamezole (0.1 mg/kg) was used for reversal, and the animal was returned to their home cage.
OCT
For imaging, the monkey was placed in a prone position, and their head stabilized using mouth and occipital bars. Eyelids were held open using a pediatric speculum, and the cornea was protected from dehydration using a gas permeable contact lens, which covered the entire cornea.
All scans were acquired using the Spectralis OCT (Heidelberg Engineering, Heidelberg, Germany) system with high-resolution and small eye settings. For circumpapillary RNFL thickness, a standard 12° diameter circular scan with 100 frames averaged was used. With nine frame averaging, 20 × 20° raster scans with 193 b-scans were acquired centered on the optic nerve head and macula. Scan density was reduced to 97 lines when excessive eye movement was present. Widefield imaging included a 217 line raster scan covering 55 × 45°, with nine frames averaged. With this protocol, the 20 × 20° raster scans had twice the b-scan and a-scan density compared to the widefield raster volume. Images were exported as “*.vol” files and then read into Matlab (R2021, The MathWorks Inc, Natick, MA, USA), where images were segmented using custom programs, and thickness measures extracted.
OCT Segmentation
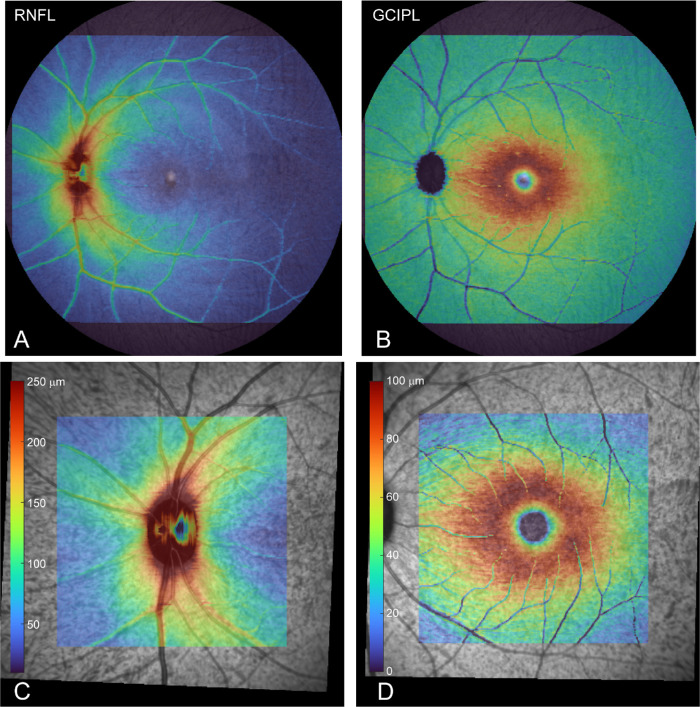
The RNFL and GCIPL were segmented using three separate neural networks, each trained on a DeepLab v3+ network based on ResNet-18, to an accuracy of 98.5% or better and loss of less than 0.02.17,18 The trained networks were specific for the optic nerve head region (RNFL), macula region (RNFL and GCIPL), and widefield imaging (RNFL and GCIPL). Scans previously segmented for other studies, which included controls and eyes with experimental glaucoma, were used for training the optic nerve head and macular region networks,2,19–22 whereas a separate series of 6117 b-scans was used to train the network for widefield scans. Segmentation criteria used for the training dataset have been previously reported,2,21,22 and none of the b-scans used for the training sets were included in the analysis for this study. Figure 1 illustrates a sample representative output using these methods for the three raster scans from the left eye of a single subject.
Figure 1.
(A, B) Widefield (55° × 45°) segmented RNFL and GCIPL for a healthy eye. (C, D) Corresponding 20° × 20° raster scans centered on the optic nerve head and macula from the same animal.
Individual and Average Thickness Comparisons
Global RNFL thickness was determined for the circumpapillary scan, and thickness maps were generated for each of the raster scans using linear interpolation. For comparison, circumpapillary RNFL thickness was determined for an interpolated 12° scan path from each widefield thickness map. Similarly, the average GCIPL thickness for each subject was determined for a 16° diameter circular region centered on the macula for both the 20° × 20° and 55° × 45° raster scans.
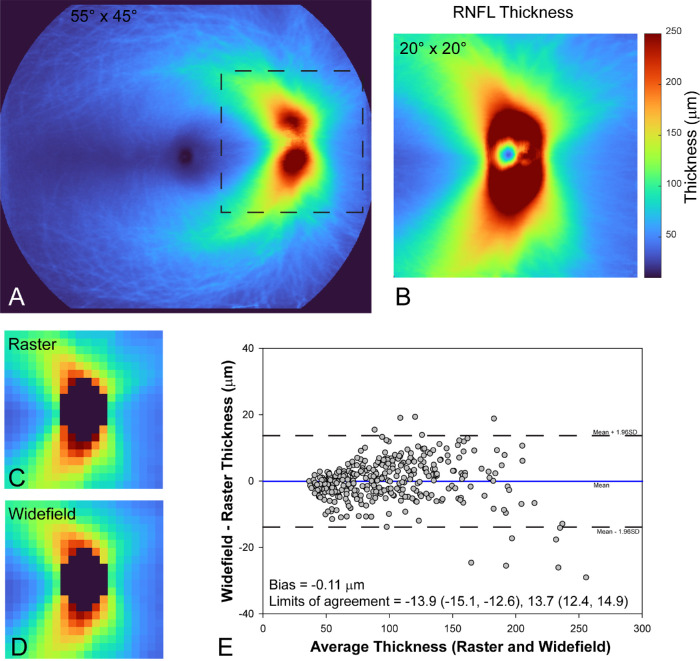
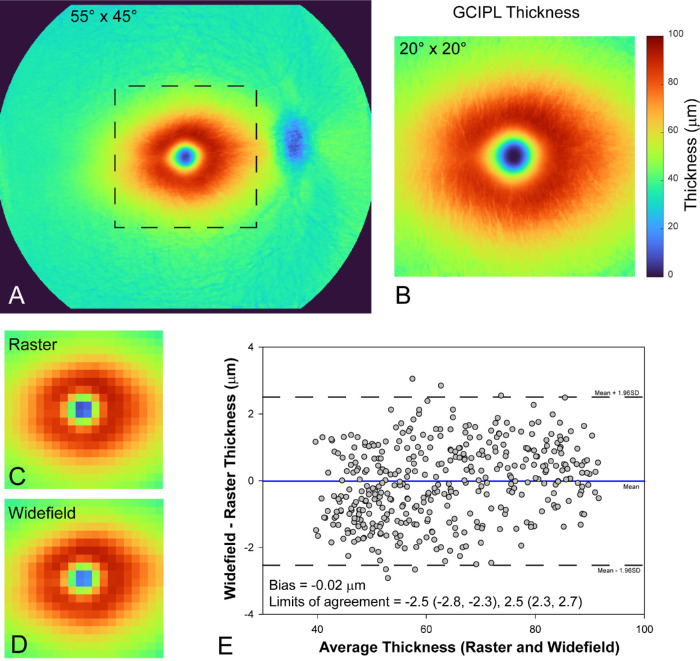
Afterward, an average thickness map for each of the three raster scan protocols was generated using data from all 30 animals. Resultant thickness maps from left eyes were flipped on the vertical axis to maintain a right eye output for statistical analysis. For the 20° × 20° scans, data were aligned to either the center of the fovea or the optic nerve head. The horizontal raphe was identified on widefield en face images flattened to the inner limiting membrane. Each widefield scan was then aligned to the fovea raphe plane, with the fovea in the center of the frame. From the average widefield thickness maps, 20° × 20° regions centered on the macula and optic nerve head (Figs. 2A, 3A, dashed lines), were extracted. For both the 20° × 20° standard scans and the extracted 20° × 20° regions from widefield scan, the average thickness map was further segmented to 1° × 1° thickness superpixel regions (Figs. 2C, 2D, 3C, 3D). For areas centered on the optic nerve head, the optic nerve head region was masked and not used for analysis.
Figure 2.
Average widefield (A) and 20° × 20° raster (B) RNFL thickness maps from scans of 30 healthy eyes. (C) Average thickness for 1° × 1° regions from B. (D) Average thickness for 1° × 1° regions from widefield imaging, corresponding to an identical 20 × 20 area as in B (dashed boxed region in A). The optic nerve head region in A–D has been masked. (E) Bland-Altman plot comparing thickness measures from each of the locations in C and D.
Figure 3.
Average widefield (A) and 20° × 20° raster (B) GCIPL thickness maps from scans of 30 healthy eyes. (C) Average thickness for 1° × 1° regions from B. (D) Average thickness for 1° × 1° regions from widefield imaging, corresponding to an identical 20 × 20 area as in B (dashed boxed region in A). (E) Bland-Altman plot comparing thickness measures from each of the locations in C and D.
Repeatability
Eleven animals had each of the described scans repeated at five sessions, separated by a minimum of two weeks. Only four sessions were used for two of the subjects because of instrument misalignment at one of the scan sessions. As for average thickness comparisons, repeatability of RNFL and GCIPL was assessed for one-degree square superpixel regions across the scanned area.
Statistics
Thickness data are presented as mean ± standard deviation. Repeatability was calculated as 2.77 × intrasubject standard deviation (Sw).23 Comparisons between thickness measures from standard scan protocols and widefield imaging included a Bland-Altman analysis and intraclass correlation.24,25 Bland-Altman analyses are reported as the mean difference and 95% limits of agreement, with 95% confidence intervals. Intraclass correlation coefficients (ICC) were computed with two-way mixed effects and absolute agreement, with 95% confidence intervals. IBM SPSS (Version 27.0, IBM Corp, Armonk, NY, USA) was used for statistical analysis, and all plots were made using SigmaPlot (Version 14.0, Systat Software Inc, San Jose, CA, USA).
Results
Each animal included in the study was determined to have good systemic health and healthy eyes at the time of imaging. All scans used for data analysis had a quality greater than 25dB, and two repeatability scan sessions were excluded because of scan misalignment.
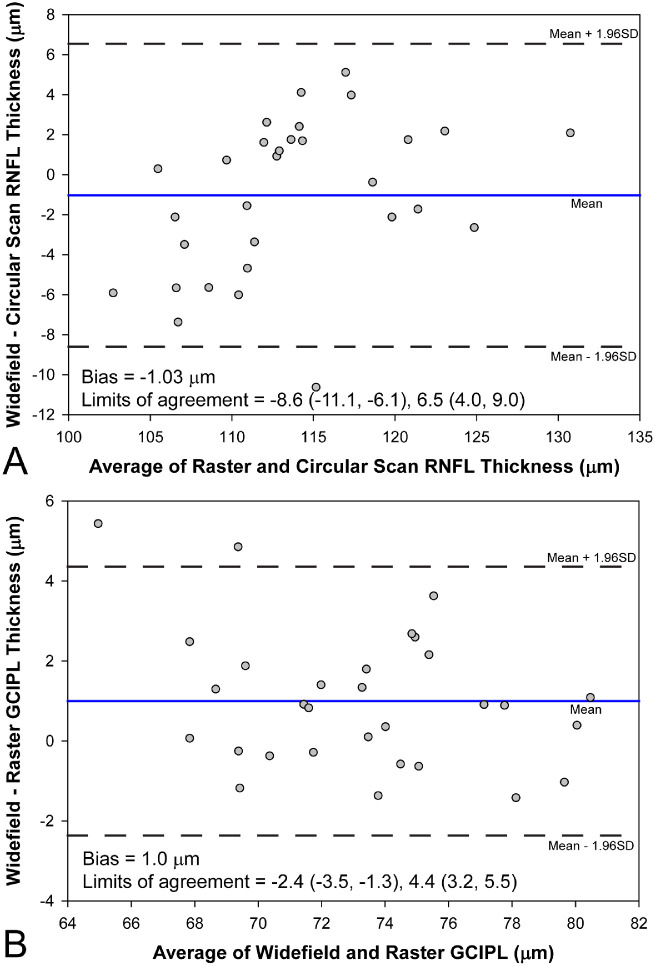
Average circumpapillary RNFL thickness from standard 12° circular scans was 114.2 ± 5.8 µm, with repeatability of 4.5 µm. For the equivalent interpolated scan path from widefield imaging, RNFL thickness was 113.2 ± 7.3 µm, with a repeatability of 5.2 µm. The mean difference between the two RNFL thickness methods was −1.03 µm (Fig. 4A), with 95% limits of agreement, and 95% confidence interval, between −8.6µm (−11.1 µm, −6.1 µm) and 6.5 µm (4.0 µm, 9.0 µm). The ICC for the two methods was 0.90 (0.80, 0.95), suggesting very good agreement. Average GCIPL thickness from the 20° × 20° raster scan was 72.7 ± 4.3 µm, with repeatability of 3.2 µm. For the same region, GCIPL thickness from widefield imaging was 73.7 ± 3.7 µm, with a repeatability of 2.7 µm. The mean difference between the two methods was 1.0 µm (Fig. 4B), with 95% limits of agreement between −2.4 µm (−3.5 µm, −1.3 µm) and 4.4 µm (3.2 µm, 5.5 µm). The ICC for the two methods was 0.94 (0.83, 0.97).
Figure 4.
(A) Bland-Altman plots comparing circumpapillary RNFL thickness from a traditional circular scan to that interpolated from widefield imaging. (B) Comparison of average GCIPL thickness from 20° × 20° raster and widefield scans.
For the three raster scan types, data from all animals were successfully aligned and used to generate average thickness maps oriented to the right eye. Comparisons between standard 20° × 20° raster and widefield imaging were made after binning the average maps using one-degree superpixel squares (Figs. 2, 3). For the area centered on the optic nerve head, a total of 364 average binned RNFL thickness measures were compared after masking out the nerve region. The mean difference in RNFL thickness for the two methods was −0.11 µm, with 95% limits of agreement between −13.9 µm (−15.1 µm, −12.6 µm) and 13.7 µm (12.4 µm, 14.9 µm). The ICC for the two methods was 0.99 (0.992, 0.995). For the macula region, all 400 one-degree binned squares were compared. The mean difference in GCIPL thickness comparing the two methods was −0.02 µm, with 95% limits of agreement between −2.5 µm (−2.8 µm, −2.3 µm) and 2.5 µm (2.3 µm, 2.7 µm), and the ICC was 0.998 (0.998, 0.998). There was no significant trend (P > 0.05) for the mean versus thickness differences for either RNFL of GCIPL.
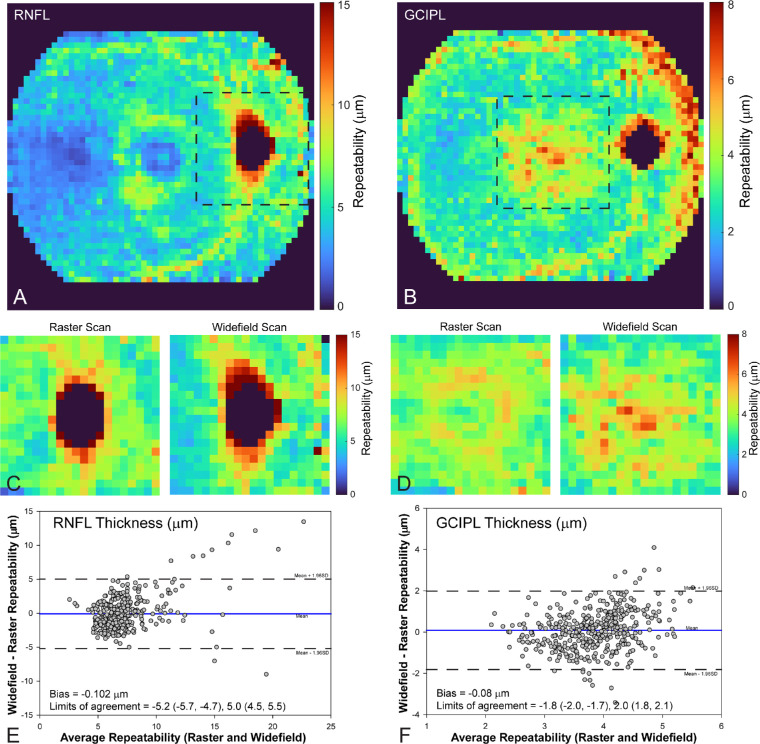
In addition to global measures, repeatability for one-degree binned squares was determined for all three raster scan protocols (Fig. 5). For comparison, similar regions to the 20° × 20° scans (Figs. 5C, 5D) were extracted from widefield data (dashed lines in Figs. 5A, 5B). For the optic nerve head region, the variability of RNFL thickness was the greatest closest to the rim margin, and similar for both 20° × 20° and widefield scans (Fig. 5C). Bland-Altman analysis comparing repeatability of the two methods (Fig. 5E) had a mean bias of −0.10 µm, with 95% limits of agreement between −5.2 µm (−5.7 µm, −4.7 µm) and 5.0 µm (4.5 µm, 5.5 µm). In general, there was no pattern to the repeatability from the 20° × 20° raster scanned macula region (Fig. 5D). In contrast, repeatability was larger for the central foveal region and nasal periphery for widefield scans. Bland-Altman analysis comparing repeatability of the two methods (Fig. 5F) for the central 20° had a mean bias of −0.08 µm, with limits of agreement between −1.8 µm (−2.0 µm, −1.7 µm) and 2.0 µm (1.8 µm, 2.1 µm).
Figure 5.
Repeatability of RNFL and GCIPL thickness was determined for 1° × 1° thickness regions for both widefield (A, B) and 20° × 20° (C, D) scans (n = 11 NHPs). For comparison, C and D illustrate corresponding identical regions from widefield imaging (boxed regions in A, B). (E, F) The Bland-Altman plots for data shown in C and D.
Discussion
Noninvasive measures of inner retinal thickness have become essential for the detection, and monitoring of optic neuropathies. In the NHP experimental glaucoma model, morphological changes are assessed using a combination of raster, radial, and circular OCT scans.26–29 These well-established scan protocols have very good repeatability but are limited to a 30° scan area.30 Although there is evidence from clinical studies that widefield imaging has advantages,9,31,32 these have not been adopted in the NHP, because of a lack of normative data. The present study of healthy NHP eyes shows that inner retinal thickness measures from widefield imaging are similar to those from standard raster scans, and have similar repeatability. In addition, aligned data from 30 healthy NHP subjects provide normative data for both 20° and widefield raster scans.
Thickness measures from OCT systems are known to correspond well with histology.33,34 However, there are often discrepancies in absolute thickness measurements and repeatability when comparing different OCT systems.4,35–37 Although instrument differences in image quality can be a factor,38 discrepancy in thickness measures often reflects differences in image processing.36,39 This is due to lack of standards for retinal layer segmentation and the fact that most algorithms are proprietary. Furthermore, in experimental animal models, instrument-based segmentation generally performs poorly, necessitating the development of custom algorithms. In the described study, the training data set for the neural networks were segmented using identical criteria for each of the three raster scan types. Briefly, borders of the inner limiting membrane, nerve fiber layer, inner plexiform layer and Bruch's membrane were manually marked, and major retinal vessels were included in the nerve fiber layer when these had any physical contact with that layer.2,21,22 Hence, although there were differences in the transverse spacing of A-scans and B-scans, thickness measures were similar for traditional 20° scan protocols and widefield imaging.
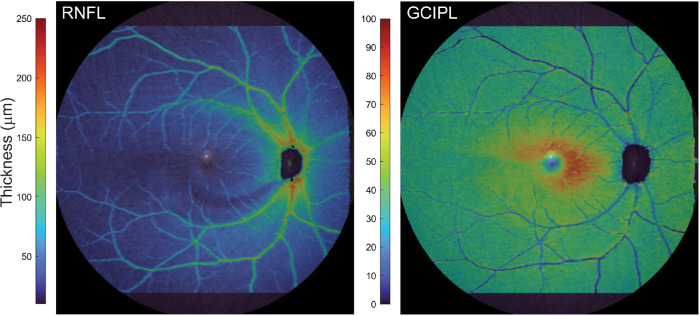
RNFL thickness profiles (i.e., temporal-superior-nasal-inferior-temporal [TSNIT] plots) from circumpapillary scans and the corresponding sectoral and global average thicknesses are among the most commonly used analyses to monitor clinical disease and experimental glaucoma in the non-human primate.40–42 Nominally these are derived from a single circular scan, 12° in diameter, but interpolated images extracted from raster scans are also used.22 Regardless of methodology, global circumpapillary RNFL thickness is correlated with total retrobulbar axons.1,2,43 Although thickness metrics from circumpapillary scans are sensitive, and local defects can be identified on TSNIT profiles, they cannot be used to determine the arcuate nature of loss. In this case, OCT en face images and RNFL probability maps from raster scans have excellent diagnostic value.44–46 Furthermore, several clinical studies have shown that wedge defects identified on thickness or deviation maps mirror those on red-free fundus imaging.47–50 Similarly, although NHP experimental glaucoma normally results in a global reduction in RNFL thickness, there are associated localized arcuate defects (Fig. 6). Longitudinal monitoring of these measures could provide valuable insights regarding both structure-structure and structure-function relationships.
Figure 6.
RNFL and GCIPL thickness maps from an animal with mild to moderate experimental glaucoma. The RNFL thickness map illustrates an inferior wedge defect, with corresponding GCIPL thickness loss.
Arcuate losses visualized on RNFL thickness maps provide information on localizing defects to a specific optic nerve head sector but not the precise location of RGC soma loss. For this, GCIPL thickness is known to relate well with localized RGC soma content, at least for the macula region where cell density is greatest.2 As with RGC densities from histology,51 GCIPL thickness from widefield imaging is concentrated in the central 20° degrees (boxed region in Fig. 3), thinning to a uniform thickness in the periphery. In principle, because in vivo structural measures and thresholds from visual fields reflect on RGC content, there should be good correspondence between the two measures. Although GCIPL thickness is reduced in the periphery, when combined with RNFL thickness, perimetric thresholds can be predicted from in vivo structure.7,8 This suggests that peripheral thickness measures from widefield imaging may provide useful insight into RGC content. Hence, it is possible that longitudinal monitoring of disease progression using widefield imaging may provide valuable insights into the compartmental losses associated with glaucoma.
The confidence for detecting progression depends on the sources of variability for OCT thickness measures, which include animal factors, instrument factors, and segmentation. All animals used for assessing repeatability had good health throughout the imaging session for the described experiment. In addition, all sessions were at approximately the same time of the day, minimizing diurnal sources of variability. Imaging with OCT technology is robust. However, two instances of instrument error were encountered and images from these sessions were excluded from analysis. In our previous work,2,20–22 we used semiautomated segmentation, which was depended on manually correcting segmentation errors, and inherently had subjective bias. Although the neural network learns some of these biases, they are typically agnostic to the eye being analyzed and the disease state. Repeatability using segmentation from neural networks of widefield imaging is on par with measures from standard 20° scan protocols. Furthermore, although the dynamic range of widefield inner retinal thickness is not currently known for this model, repeatability (Fig. 5) is at least five times the average thickness (Figs. 2, 3), suggesting that loss of inner retinal thickness, even in peripheral locations should be quantifiable.
There are several limitations to the current work. Although identical criteria were used for manual segmentation, the training dataset was labeled by only three individuals, and differences between the three were not considered. During imaging, we were careful with maintaining clear optics and alignment. However, sedated animals can have cyclotorsion, and scans were not acquired aligned to either the fovea—Bruch's membrane opening axis—or the horizontal raphe.39,52 Each of the animals used for determining repeatability had healthy eyes. Although OCT measures are known to have good repeatability in disease eyes,30 it will be important to establish repeatability at varying stages of neuropathy to assess the utility of widefield imaging in experimental disease. Previous work comparing thickness from widefield imaging and raster scans accounted for differences in retinal curvature,10 which were not accounted for in the present study. Although this was initially part of the experimental design, animals used for the current work were emmetropic, and scans acquired were relatively flat. However, accounting for retinal curvature will likely be needed for myopic eyes.
In this study, we show that RNFL and GCIPL thickness can be reliably quantified using widefield imaging in the non-human primate. The data encompass standard 20° raster scans and have similar thickness and repeatability. Although histological correlations for widefield in vivo measures are unknown, they could provide methods for predicting visual thresholds and determining the time course of compartmental losses in experimental disease. Because the NHP is a scarce resource, the normative data and neural networks used in this study will be made freely available.
Acknowledgments
Supported by NIH grants: P30 EY007551, R01 EY029229, and the UH Mary Murphy Endowment.
Disclosure: V.V. Srinivasan, None; S. Das, None; N. Patel, None
References
- 1. Fortune B, Hardin C, Reynaud J, et al.. Comparing optic nerve head rim width, rim area, and peripapillary retinal nerve fiber layer thickness to axon count in experimental glaucoma. Invest Ophthalmol Vis Sci. 2016; 57: OCT404–OCT412. [DOI] [PMC free article] [PubMed] [Google Scholar]
- 2. Antwi-Boasiako K, Carter-Dawson L, Harwerth R, Gondo M, Patel N.. The relationship between macula retinal ganglion cell density and visual function in the nonhuman primate. Invest Ophthalmol Vis Sci. 2021; 62: 5. [DOI] [PMC free article] [PubMed] [Google Scholar]
- 3. Dong ZM, Wollstein G, Schuman JS.. Clinical utility of optical coherence tomography in glaucoma. Invest Ophthalmol Vis Sci. 2016; 57: OCT556–OCT567. [DOI] [PMC free article] [PubMed] [Google Scholar]
- 4. Tan BB, Natividad M, Chua KC, Yip LW.. Comparison of retinal nerve fiber layer measurement between 2 spectral domain OCT instruments. J Glaucoma. 2012; 21: 266–273. [DOI] [PubMed] [Google Scholar]
- 5. Mwanza JC, Oakley JD, Budenz DL, Chang RT, Knight OJ, Feuer WJ.. Macular ganglion cell-inner plexiform layer: automated detection and thickness reproducibility with spectral domain-optical coherence tomography in glaucoma. Invest Ophthalmol Vis Sci. 2011; 52: 8323–8329. [DOI] [PMC free article] [PubMed] [Google Scholar]
- 6. Lee WJ, Kim TJ, Kim YK, Jeoung JW, Park KH.. Serial Combined wide-field optical coherence tomography maps for detection of early glaucomatous structural progression. JAMA Ophthalmol. 2018; 136: 1121–1127. [DOI] [PMC free article] [PubMed] [Google Scholar]
- 7. Bogunović H, Kwon YH, Rashid A, et al.. Relationships of retinal structure and Humphrey 24-2 visual field thresholds in patients with glaucoma. Invest Ophthalmol Vis Sci. 2014; 56: 259–271. [DOI] [PMC free article] [PubMed] [Google Scholar]
- 8. Guo Z, Kwon YH, Lee K, et al.. Optical coherence tomography analysis based prediction of Humphrey 24-2 visual field thresholds in patients with glaucoma. Invest Ophthalmol Vis Sci. 2017; 58: 3975–3985. [DOI] [PMC free article] [PubMed] [Google Scholar]
- 9. Wu Z, Weng DSD, Thenappan A, Rajshekhar R, Ritch R, Hood DC.. Comparison of widefield and circumpapillary circle scans for detecting glaucomatous neuroretinal thinning on optical coherence tomography. Transl Vis Sci Technol. 2018; 7: 11. [DOI] [PMC free article] [PubMed] [Google Scholar]
- 10. Tong J, Yoshioka N, Alonso-Caneiro D, Zangerl B.. Ganglion cell-inner plexiform layer measurements derived from widefield compared to montaged 9-field optical coherence tomography [published online ahead of print November 18, 2021]. Clin Exp Optom, 10.1080/08164622.2021.1993058. [DOI] [PubMed] [Google Scholar]
- 11. Hong EH, Shin YU, Kang MH, Cho H, Seong M.. Wide scan imaging with swept-source optical coherent tomography for glaucoma diagnosis. PLoS One. 2018; 13: e0195040. [DOI] [PMC free article] [PubMed] [Google Scholar]
- 12. Quigley H, Anderson DR.. The dynamics and location of axonal transport blockade by acute intraocular pressure elevation in primate optic nerve. Invest Ophthalmol. 1976; 15: 606–616. [PubMed] [Google Scholar]
- 13. Quigley HA, Addicks EM.. Chronic experimental glaucoma in primates. I. Production of elevated intraocular pressure by anterior chamber injection of autologous ghost red blood cells. Invest Ophthalmol Vis Sci. 1980; 19: 126–136. [PubMed] [Google Scholar]
- 14. Burgoyne CF. The non-human primate experimental glaucoma model. Exp Eye Res. 2015; 141: 57–73. [DOI] [PMC free article] [PubMed] [Google Scholar]
- 15. Downs JC. Optic nerve head biomechanics in aging and disease. Exp Eye Res. 2015; 133: 19–29. [DOI] [PMC free article] [PubMed] [Google Scholar]
- 16. Harwerth RS, Wheat JL, Fredette MJ, Anderson DR.. Linking structure and function in glaucoma. Prog Retin Eye Res. 2010; 29: 249–271. [DOI] [PMC free article] [PubMed] [Google Scholar]
- 17. Chen L-C, Papandreou G, Schroff F, Adam H.. Rethinking atrous convolution for semantic image segmentation. arXiv preprint arXiv:170605587. 2017.
- 18. He K, Zhang X, Ren S, Sun J.. Deep residual learning for image recognition. In: 2016 IEEE Conference on Computer Vision and Pattern Recognition (CVPR). 2016: 770–778.
- 19. Pardon LP, Harwerth RS, Patel NB.. Neuroretinal rim response to transient changes in intraocular pressure in healthy non-human primate eyes. Exp Eye Res. 2020; 193: 107978. [DOI] [PMC free article] [PubMed] [Google Scholar]
- 20. Patel N, McAllister F, Pardon L, Harwerth R.. The effects of graded intraocular pressure challenge on the optic nerve head. Exp Eye Res. 2018; 169: 79–90. [DOI] [PMC free article] [PubMed] [Google Scholar]
- 21. Patel NB, Sullivan-Mee M, Harwerth RS.. The relationship between retinal nerve fiber layer thickness and optic nerve head neuroretinal rim tissue in glaucoma. Invest Ophthalmol Vis Sci. 2014; 55: 6802–6816. [DOI] [PMC free article] [PubMed] [Google Scholar]
- 22. Patel NB, Luo X, Wheat JL, Harwerth RS.. Retinal nerve fiber layer assessment: area versus thickness measurements from elliptical scans centered on the optic nerve. Invest Ophthalmol Vis Sci. 2011; 52: 2477–2489. [DOI] [PMC free article] [PubMed] [Google Scholar]
- 23. Bland JM, Altman DG.. Measurement error. BMJ. 1996; 313: 744. [DOI] [PMC free article] [PubMed] [Google Scholar]
- 24. Altman DG, Bland JM.. Measurement in medicine: the analysis of method comparison studies. J R Stat Soc. 1983; 32: 307–317. [Google Scholar]
- 25. Bartko JJ. The intraclass correlation coefficient as a measure of reliability. Psychol Rep. 1966; 19: 3–11. [DOI] [PubMed] [Google Scholar]
- 26. Wilsey LJ, Reynaud J, Cull G, Burgoyne CF, Fortune B.. Macular structure and function in nonhuman primate experimental glaucoma. Invest Ophthalmol Vis Sci. 2016; 57: 1892–1900. [DOI] [PMC free article] [PubMed] [Google Scholar]
- 27. Strouthidis NG, Fortune B, Yang H, Sigal IA, Burgoyne CF.. Longitudinal change detected by spectral domain optical coherence tomography in the optic nerve head and peripapillary retina in experimental glaucoma. Invest Ophthalmol Vis Sci. 2011; 52: 1206–1219. [DOI] [PMC free article] [PubMed] [Google Scholar]
- 28. Ivers KM, Sredar N, Patel NB, et al.. High-resolution longitudinal examination of the lamina cribrosa and optic nerve head in living non-human primates with experimental glaucoma. Invest Ophthalmol Vis Sci. 2012; 53: 3697–3697. [Google Scholar]
- 29. He L, Yang H, Gardiner SK, et al.. Longitudinal detection of optic nerve head changes by spectral domain optical coherence tomography in early experimental glaucoma. Invest Ophthalmol Vis Sci. 2014; 55: 574–586. [DOI] [PMC free article] [PubMed] [Google Scholar]
- 30. Mwanza JC, Chang RT, Budenz DL, et al.. Reproducibility of peripapillary retinal nerve fiber layer thickness and optic nerve head parameters measured with cirrus HD-OCT in glaucomatous eyes. Invest Ophthalmol Vis Sci. 2010; 51: 5724–5730. [DOI] [PMC free article] [PubMed] [Google Scholar]
- 31. Kim YW, Lee J, Kim JS, Park KH.. Diagnostic accuracy of wide-field map from swept-source optical coherence tomography for primary open-angle glaucoma in myopic eyes. Am J Ophthalmol. 2020; 218: 182–191. [DOI] [PubMed] [Google Scholar]
- 32. Lee WJ, Oh S, Kim YK, Jeoung JW, Park KH.. Comparison of glaucoma-diagnostic ability between wide-field swept-source OCT retinal nerve fiber layer maps and spectral-domain OCT. Eye. 2018; 32: 1483–1492. [DOI] [PMC free article] [PubMed] [Google Scholar]
- 33. Schuman JS, Pedut-Kloizman T, Pakter H, et al.. Optical coherence tomography and histologic measurements of nerve fiber layer thickness in normal and glaucomatous monkey eyes. Invest Ophthalmol Vis Sci. 2007; 48: 3645–3654. [DOI] [PMC free article] [PubMed] [Google Scholar]
- 34. Anger EM, Unterhuber A, Hermann B, et al.. Ultrahigh resolution optical coherence tomography of the monkey fovea. Identification of retinal sublayers by correlation with semithin histology sections. Exp Eye Res. 2004; 78: 1117–1125. [DOI] [PubMed] [Google Scholar]
- 35. Pierro L, Gagliardi M, Iuliano L, Ambrosi A, Bandello F. Retinal nerve fiber layer thickness reproducibility using seven different OCT instruments. Invest Ophthalmol Vis Sci. 2012; 53: 5912–5920. [DOI] [PubMed] [Google Scholar]
- 36. Leite MT, Rao HL, Weinreb RN, et al.. Agreement among spectral-domain optical coherence tomography instruments for assessing retinal nerve fiber layer thickness. Am J Ophthalmol. 2011; 151: 85–92.e81. [DOI] [PubMed] [Google Scholar]
- 37. Kim JS, Ishikawa H, Gabriele ML, et al.. Retinal nerve fiber layer thickness measurement comparability between time domain optical coherence tomography (OCT) and spectral domain OCT. Invest Ophthalmol Vis Sci. 2010; 51: 896–902. [DOI] [PMC free article] [PubMed] [Google Scholar]
- 38. Balasubramanian M, Bowd C, Vizzeri G, Weinreb RN, Zangwill LM.. Effect of image quality on tissue thickness measurements obtained with spectral domain-optical coherence tomography. Optics Express. 2009; 17: 4019–4036. [DOI] [PMC free article] [PubMed] [Google Scholar]
- 39. Patel NB, Wheat JL, Rodriguez A, Tran V, Harwerth RS.. Agreement between retinal nerve fiber layer measures from Spectralis and Cirrus spectral domain OCT. Optom Vis Sci. 2012; 89: E652–666. [DOI] [PMC free article] [PubMed] [Google Scholar]
- 40. Gardiner SK, Boey PY, Yang H, Fortune B, Burgoyne CF, Demirel S.. Structural measurements for monitoring change in glaucoma: comparing retinal nerve fiber layer thickness with minimum rim width and area. Invest Ophthalmol Vis Sci. 2015; 56: 6886–6891. [DOI] [PMC free article] [PubMed] [Google Scholar]
- 41. Schuman JS, Hee MR, Puliafito CA, et al.. Quantification of nerve fiber layer thickness in normal and glaucomatous eyes using optical coherence tomography. Arch Ophthalmol. 1995; 113: 586–596. [DOI] [PubMed] [Google Scholar]
- 42. Zangwill LM, Williams J, Berry CC, Knauer S, Weinreb RN.. A comparison of optical coherence tomography and retinal nerve fiber layer photography for detection of nerve fiber layer damage in glaucoma. Ophthalmology. 2000; 107: 1309–1315. [DOI] [PubMed] [Google Scholar]
- 43. Cull GA, Reynaud J, Wang L, Cioffi GA, Burgoyne CF, Fortune B.. Relationship between orbital optic nerve axon counts and retinal nerve fiber layer thickness measured by spectral domain optical coherence tomography. Invest Ophthalmol Vis Sci. 2012; 53: 7766–7773. [DOI] [PMC free article] [PubMed] [Google Scholar]
- 44. Park JH, Yoo C, Kim YY.. Localized retinal nerve fiber layer defect location among red-free fundus photographs, en face structural images, and cirrus HD-OCT maps. J Glaucoma. 2019; 28: 1054–1060. [DOI] [PubMed] [Google Scholar]
- 45. Hood DC, La Bruna S, Tsamis E, et al.. Detecting glaucoma with only OCT: Implications for the clinic, research, screening, and AI development[published online ahead of print February 22, 2022]. Prog Retinal Eye Res, 10.1016/j.preteyeres.2022.101052. [DOI] [PubMed] [Google Scholar]
- 46. Ashimatey BS, King BJ, Burns SA, Swanson WH.. Evaluating glaucomatous abnormality in peripapillary optical coherence tomography en face visualisation of the retinal nerve fibre layer reflectance. Ophthalmic Physiol Opt. 2018; 38: 376–388. [DOI] [PMC free article] [PubMed] [Google Scholar]
- 47. Shin JW, Uhm KB, Seong M, Kim YJ.. Diffuse retinal nerve fiber layer defects identification and quantification in thickness maps. Invest Ophthalmol Vis Sci. 2014; 55: 3208–3218. [DOI] [PubMed] [Google Scholar]
- 48. Lim AB, Park J-H, Jung JH, Yoo C, Kim YY.. Characteristics of diffuse retinal nerve fiber layer defects in red-free photographs as observed in optical coherence tomography en face images. BMC Ophthalmology. 2020; 20: 16. [DOI] [PMC free article] [PubMed] [Google Scholar]
- 49. Kim KE, Ahn SJ, Kim DM.. Comparison of two different spectral domain optical coherence tomography devices in the detection of localized retinal nerve fiber layer defects. Jpn J Ophthalmol. 2013; 57: 347–358. [DOI] [PubMed] [Google Scholar]
- 50. Leung CK, Lam S, Weinreb RN, et al.. Retinal nerve fiber layer imaging with spectral-domain optical coherence tomography: analysis of the retinal nerve fiber layer map for glaucoma detection. Ophthalmology. 2010; 117: 1684–1691. [DOI] [PubMed] [Google Scholar]
- 51. Polyak SL. The retina; the anatomy and the histology of the retina in man, ape, and monkey, including the consideration of visual functions, the history of physiological optics, and the histological laboratory technique. Chicago: The University of Chicago Press; 1941:x,607. [Google Scholar]
- 52. He L, Ren R, Yang H, et al.. Anatomic vs. acquired image frame discordance in spectral domain optical coherence tomography minimum rim measurements. PLoS One. 2014; 9: e92225. [DOI] [PMC free article] [PubMed] [Google Scholar]


