Abstract
Adaptation of the glucose metabolism of Leishmania donovani promastigotes (insect stage) was investigated by simultaneously measuring metabolic rates, enzyme activities, message levels, and cellular parameters under various conditions. Chemostats were used to adapt cells to different growth rates with growth rate-limiting or excess glucose concentrations. L. donovani catabolized glucose to CO2, succinate, acetate, and pyruvate in ratios that depended on growth rate and glucose availability. Rates of glucose consumption were a linear function of growth rate and were twice as high in excess glucose-grown cells as in glucose-limited organisms. The major end product was CO2, but organic end products were also formed in ratios that varied strongly with growth conditions. The specific activities of the 14 metabolic enzymes measured varied by factors of 3 to 17. Two groups of enzymes adapted specific activities in parallel, but there was no correlation between the groups. The activities of only one group correlated with specific rates of glucose metabolism. Total RNA content per cellular protein varied by a factor of 6 and showed a linear relationship with the rate of glucose consumption. There was no correlation between steady-state message levels and activities of the corresponding enzymes, suggesting regulation at the posttranscriptional level. A comparison of the adaptation of energy metabolism in L. donovani and other species suggests that the energy metabolism of L. donovani is inefficient but is well suited to the environmental challenges that it encounters during residence in the sandfly, its insect vector.
Leishmania donovani is a unicellular parasite belonging to the kinetoplastids. Like any other organism, L. donovani must balance a variety of demands on its metabolism. Two major requirements are the synthesis of new biomass and the regulation of internal conditions. Cellular operations must be coordinated to optimally distribute the available energy over different processes. Since external conditions are rarely constant, the cell must be able to adapt to environmental variations. A way to study intracellular coordination is to force the organism to adapt to various external conditions and to monitor the adaptive changes. Glucose catabolism of L. donovani is a suitable model for analyzing adaptation, as it is well documented (6, 38), comparatively simple, and easily manipulated. Once changes in enzyme abundance are observed, the next question is at which level is the expression of metabolic enzymes regulated: transcriptional or translational? In the former case, there will be a direct correlation between message levels and enzyme concentrations; in the latter case, there will be no such relationship. An integrated study of metabolic fluxes, enzyme levels, total RNA, and mRNA will therefore provide important insights into the coordination of cellular processes.
The carbohydrate metabolism of L. donovani promastigotes differs only slightly from that of procyclic Trypanosoma brucei, another kinetoplastid (38). Glucose or amino acids are used as carbon sources (6, 7). The initial part of the glycolytic pathway is sequestered in the glycosome, an organelle unique to the Kinetoplastida (17, 25, 26). The promastigote or insect stage has functional mitochondria, but the oxidation of glucose is incomplete, and organic acids, primarily acetate, succinate, and pyruvate, are formed in addition to CO2 (25, 38).
Chemostats, or continuous cultures, can be used to grow organisms at constant rates under constant conditions for several generation times (43). In the past, this method has been used mostly to provide an overall characterization of the physiology of organisms. In addition, cells can be adapted to a specific set of conditions by long-term growth in chemostats. This approach was used to study the adaptation of glucose uptake due to mutual adaptation of the glucose transporter and the subsequent metabolism in L. donovani (37). The extent of adaptation was relatively small and could be attributed to the difference in the synthesis of the polymannose storage carbohydrate present in L. donovani (19). In these studies, adaptation was measured only as a change in the uptake of [14C]glucose, and no enzyme activities were monitored.
The specific activities of core metabolic enzymes change in response to various external conditions by 1 order of magnitude in Trichomonas vaginalis (32) and by factors of 2 to 40 in T. brucei (33). Enzyme recruitment has been proposed as the mechanism for this change in activities, because in these two species, as in L. donovani, only pyruvate kinase (PK) is known to be regulated by low-molecular-weight effectors (14, 23, 41). Nevertheless, the ways in which the two species adapt their energy metabolism differ greatly. The coordinated change in the activities of a group of nine enzymes in T. vaginalis suggests a central regulatory mechanism. The activities of the same enzymes in T. brucei vary independently. The results of the different modes of adaptation are that ratios of end products vary widely in T. vaginalis but are almost constant in T. brucei. Furthermore, the energy metabolism of T. brucei is far more efficient than that of T. vaginalis. It is unclear whether the close kinship between L. donovani and T. brucei is reflected in the respective ways for adapting their energy metabolism.
Increased synthesis of enzymes can be achieved at the transcriptional level by increasing message levels or at the translational level by more rapidly translating constant amounts of mRNA. Since no correlation was observed between mRNA levels and the cellular activities of the corresponding enzymes in T. brucei and T. vaginalis (34), regulation probably occurred primarily at the translational level. Message levels depended primarily on the growth rate in both species, but in a different manner. In T. brucei, there was a steep increase in the mRNA level once the growth rate exceeded half the maximum rate. The variation was much smaller in T. vaginalis, never exceeding a factor of 2. Message levels decreased with growth rate in cells grown on limiting concentrations of glucose (LG cells) but increased in cells grown on excess glucose (EG cells).
The purpose of this study was to analyze the coordination of intracellular processes by documenting the adaptation of L. donovani to changes in growth rate and carbon regimen. Continuous cultures were used to measure specific rates of glucose consumption and end-product formation, the corresponding enzyme activities, and the mRNA levels of the same cells. When combined, the different types of information provide insight into the organization and regulation of the energy metabolism of L. donovani.
MATERIALS AND METHODS
L. donovani promastigotes (ATCC 50127) were grown in a single-stage flow-controlled chemostat with pH (6.90) and temperature (27.5°C) control and air as the driving gas (35). The culture was therefore fully oxygenated. The medium was SDM 79 (9) with a rate-limiting concentration (5 mM) of glucose for LG cells or an excess level (30 mM) for EG cells. In the latter case, the fetal bovine serum content was reduced from 10 to 4%. After approximately 3 volume changes, a steady state in which the cells grew at a rate equal to the dilution rate was reached. By changing the pumping rate, cells could be grown at any rate below the maximum one. Cells were grown at approximately 0.4, 0.8, 1.2, 1.6, and 2.0 doublings per day. Glucose was rate limiting for one set of steady states (LG cells) and present in excess for a second set (EG cells), giving a total of 10 steady states. Surprisingly, the maximum growth rates were 2.2 doublings per day for LG cells but only 1.8 doublings per day for EG cells. The occurrence of steady states was monitored by counting cells. A culture was assumed to be in a steady state when the dilution rate and other conditions had been constant for at least five doubling times and cell density had not changed for a minimum of one doubling time or 24 h, whichever was longer. One generation time is generally considered sufficient for adaptation to take place completely.
For every steady state, the following sampling program was conducted. A 5-ml sample was rapidly filtered, distributed into microcentrifuge tubes, and frozen at −20°C for analysis of glucose and end-product concentrations. A 20-ml sample was distributed in 1.0-ml portions into microcentrifuge tubes. After centrifugation, the supernatant was removed and the pellets were stored at −20°C for subsequent measurements of enzyme activities and protein contents. A 90-ml sample was centrifuged, and the pellets were washed with 0.9% NaCl solution. The pellets were dissolved in 4 M guanidinium isothiocyanate solution and placed on a layer of 5.7 M CsCl solution. After ultracentrifugation, a hard, glassy pellet of very pure and minimally degraded RNA was obtained (12). This RNA was dissolved in 0.1% sodium dodecyl sulfate and stored at −80°C. During processing of the RNA, all standard precautions used to prevent degradation were observed.
The activities of all enzymes were measured spectrophotometrically as described earlier (32, 33). In addition, glucose-6-phosphate dehydrogenase (G-6-PDH) and succinate thiokinase activities were measured as described by Bergmeyer (4). Procedures were done as published earlier in order to facilitate comparison and were not specifically designed to optimally mimic in vivo conditions. The protein level was determined by the method of Lowry and was used as a normalizing factor throughout the data set, because cell size and protein level per cell varied considerably, depending on culture conditions. The concentrations of glucose and the end products acetate, succinate, and pyruvate were determined as described before (32, 33). No measurable quantities of alanine, a known end product of Leishmania major (13), lactate, glycerol, and ethanol could be detected in the culture fluid.
Total RNA was determined by measuring A260/A280. Northern blotting was performed to compare relative abundances of messages in samples of the 10 steady states. A Northernmax Kit (Ambion) was used by following the instructions of the manufacturer; blots of 10 lanes were transferred to a BrightStar Plus positively charged nylon membrane (Ambion) and cross-linked by UV light. Four identical blots were prepared and were used and reused after stripping in boiling 0.1% sodium dodecyl sulfate (diethylpyrocarbonate treated). Probes were radiolabeled, and the amount of hybridized probe was determined by the phosphorimaging method. Each probe was hybridized twice on different blots, and although absolute numbers varied, the trends were always very similar.
Sequences of L. donovani were not available for all mRNAs analyzed. In those situations, sequences of Leishmania mexicana mexicana were used, in which case the probe was designed to complement the most conserved region. Probes (36 nucleotides) for the following messages were based on L. donovani sequences (accession number): heat shock protein HSP70 (X60101), β-tubulin (X51821), 18S rRNA (U42465), and hexose transporter HTD2 (M85073). Probes based on sequences of L. mexicana mexicana were successful for the following messages: glyceraldehyde-3-phosphate dehydrogenase (GAPDH), glycosomal (X65226) and cytosolic (X65220); glycerol-3-phosphate dehydrogenase (G-3-PDH) (X89739); phosphoglucose isomerase (PGI) (X78206); and phosphoglycerate kinase B (X98486). Very little hybridization was obtained and/or results were not reproducible for the following L. mexicana mexicana sequences: PK (X74944), triosephosphate isomerase (TIM) (X74797), phosphoglycerate kinase C (X98487), and L. donovani amastigote hexose transporter (HTD1) (M85072). A probe for T. brucei GAPDH and its complement, used as controls, also gave no measurable hybridization.
RESULTS
The cellular activities of 14 metabolic enzymes were measured in samples from every steady-state culture, also measured were protein content, cell density, and RNA quantity. RNA was also used for Northern blotting. Correlation coefficients were calculated for all measured parameters as the initial step in the analysis of the data set. A total of 10 steady states were analyzed at different growth rates: 5 with glucose limitation and 5 with excess glucose. Since there were large differences between LG cells and EG cells, these data sets were also analyzed separately. Protein content was used as a normalizing factor instead of cell number. The analysis focused on rates of glucose consumption and end-product formation, cellular enzyme activities, and total RNA and mRNA levels as a function of growth rate and on the relationships among these parameters.
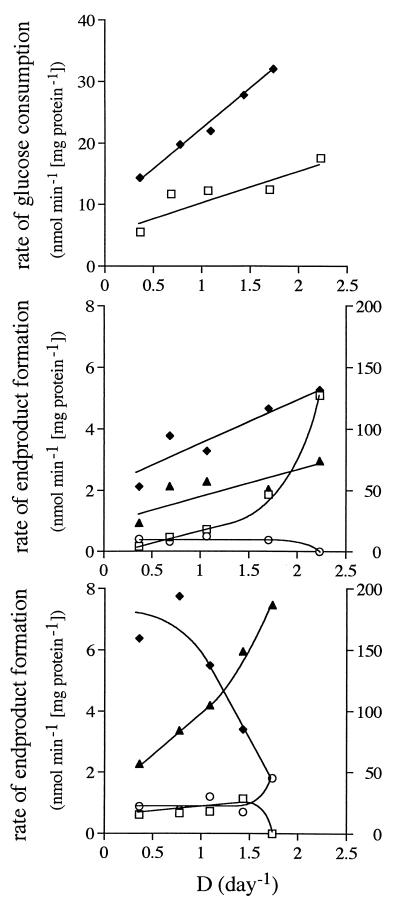
The maximum growth rate of L. donovani was higher on low-glucose (5 mM, 10% serum; LG cells) medium than on excess-glucose (30 mM, 4% serum; EG cells) medium. In the former, glucose concentrations in the culture were as low as 0.1 mM and were sufficiently low to ensure that glucose was the rate-limiting substrate at all growth rates. The lowest glucose levels in EG cultures exceeded 14 mM. The specific rate of glucose consumption depended linearly on growth rate; in EG cells it was approximately double that in LG cells (Fig. 1). A major end product in both LG cells and EG cells was succinate. Acetate was formed primarily by rapidly growing LG cells. Minor amounts of pyruvate were also produced, but none of the other end products reported in the literature for Leishmania species (see Materials and Methods) were detected. A large part of the glucose consumed could not be accounted for, indicating that CO2 was quantitatively the most important end product. The rates of formation of CO2 were calculated from the discrepancy between glucose consumed and end products formed. The formation of CO2 amounted to 50 to 95% of the total carbon excreted. The ratios of end products depended on the growth rate and on glucose availability.
FIG. 1.
Specific rates of glucose consumption and end-product formation as a function of the dilution rate (D), which at steady state equals the growth rate. Symbols in top panel: □, LG cells; ⧫, EG cells. Symbols in middle (LG cells) and bottom (EG cells) panels: □, acetate; ⧫, succinate; ○, pyruvate; ▴, CO2.
The highest and lowest specific activities of the enzymes studied differed by factors of 3 to 17 (Table 1). The in vitro activities of different enzymes were in a range slightly exceeding 1 order of magnitude, with the notable exception of TIM, which had far higher activities. The highest activities measured were very similar to those reported for nine of the same enzymes in batch cultures of L. donovani (17), with the exception of GAPDH, which had a fourfold lower activity in the present study. Capacities, defined as the activity measured in vitro divided by the flux of the corresponding steady-state culture, varied between a minimum of 0.25 for aldolase to a maximum of 176 for TIM. Capacities below 1.0 suggest a flux exceeding the enzyme activity. Except for aldolase, known to be inhibited by RNA (11), the difference was less than a factor of 2. This small difference can be explained by discrepancies between in vitro measurements and in vivo activities. Glycerol kinase and succinate thiokinase did not have measurable activities in LG cells but were readily detectable in EG cells.
TABLE 1.
Minimum and maximum cellular activities and capacities of the enzymes analyzed
| Enzyme | Cellular activity (nmol of substrate converted/mg of total cellular protein/min)
|
Capacitya
|
|||
|---|---|---|---|---|---|
| Minimum | Maximum | Ratio | Minimum | Maximum | |
| HK | 25.1 | 172.5 | 6.9 | 0.78 | 25.5 |
| G-6-PDH | 16.5 | 134.7 | 8.1 | NRb | NR |
| PGI | 61.8 | 347.6 | 5.6 | 2.36 | 24.3 |
| PFK | 9.28 | 133.4 | 14.4 | 0.53 | 9.3 |
| Aldolase | 3.15 | 54.7 | 17.4 | 0.25 | 3.4 |
| TIM | 371 | 1,178 | 3.2 | 13.3 | 176 |
| GAPDH | 5.52 | 55.3 | 10.0 | 0.45 | 2.35 |
| G-3-PDH | 6.30 | 74.9 | 11.9 | 0.51 | 5.7 |
| Glycerokinase | 0.0c | 15.0 | NR | NR | NR |
| MDH | 5.43 | 80.4 | 14.8 | 0.83 | 2.51 |
| PK | 3.09 | 17.6 | 5.7 | NR | NR |
| Malic enzyme | 0.0 | 39.4 | NR | NR | NR |
| ASCT | 12.4 | 75.4 | 6.1 | 5.46 | ∞ |
| Succinate thiokinase | 0.0c | 22.2 | NR | NR | NR |
Capacity is defined as the cellular activity divided by the flux of the corresponding steady-state culture.
NR, not relevant.
No glycerokinase or succinate thiokinase activity was detected in LG cells.
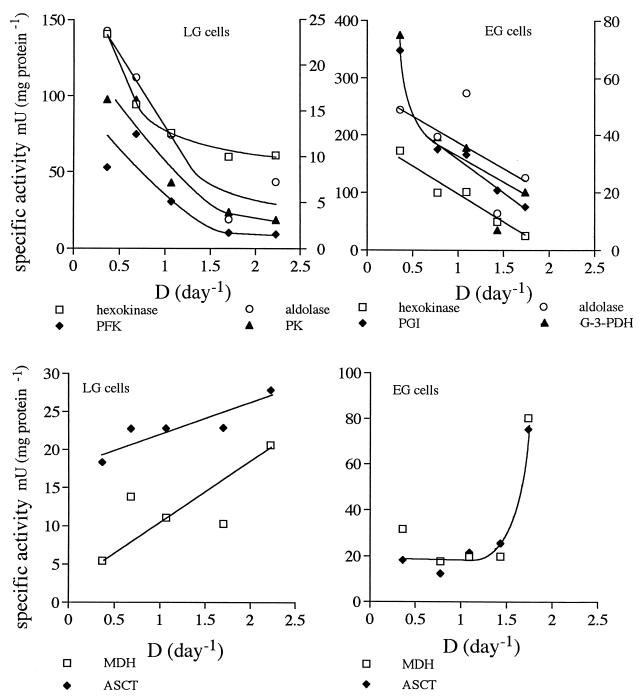
The cellular activities of most enzymes located in the glycosome decreased with increasing growth rate in both LG cells and EG cells (Fig. 2). The most typical examples, hexokinase (HK), PGI, phosphofructokinase (PFK), aldolase, G-3-PDH, and PK, are shown, but other enzymes in the initial part of the glycolytic pathway followed a similar pattern or showed little variation. GAPDH was an exception; its level increased with increasing growth rate (data not shown). The activities of the enzymes mentioned in EG cells almost always exceeded those in LG cells by a factor of approximately 2. Toward the end of the pathway, the activities of malate dehydrogenase (MDH) and acetate:succinate coenzyme A transferase (ASCT) (40) increased steadily with growth rate in LG cells. In EG cells, the activities did not change, with the exception of activities in cells growing at nearly maximal rates, which were higher by a factor of 4.
FIG. 2.
Cellular activities of selected enzymes as a function of growth rate. Activities are given as nanomoles of substrate converted per milligram of total cellular protein per minute. D, dilution rate.
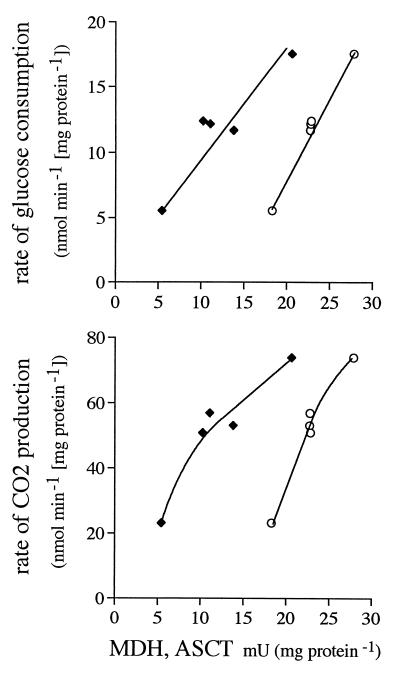
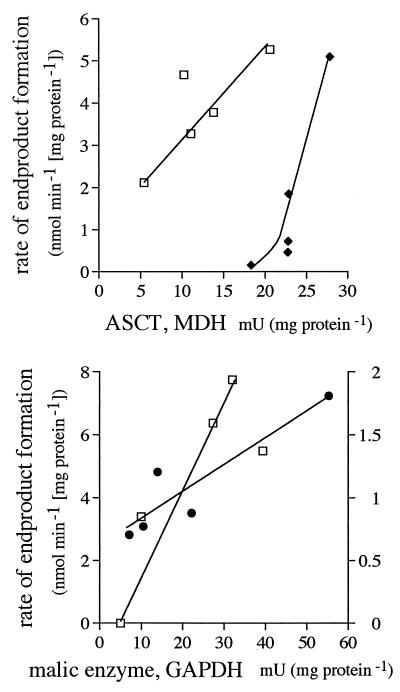
Of all the enzyme activities, only those of MDH and ASCT and, to a lesser extent, malic enzyme (data not shown) showed a positive correlation with rates of glucose consumption and CO2 formation in LG cells (Fig. 3). GAPDH, MDH, and ASCT activities correlated with rates of glucose consumption in EG cells, but the correlation coefficients were lower. Rates of CO2 formation correlated best with rates of glucose consumption in both LG cells and EG cells. In LG cells, rates of succinate formation correlated with MDH activity and rates of acetate formation correlated with ASCT activity (Fig. 4). Malic enzyme activity best predicted rates of succinate formation in EG cells, and pyruvate was linked to GAPDH. The production of pyruvate by LG cells and acetate by EG cells did not correlate with any particular enzyme.
FIG. 3.
Specific rates of glucose consumption and CO2 production as a function of MDH (⧫) or ASCT (○) activity in LG cells.
FIG. 4.
Rates of end-product formation as a function of the enzyme with which they correlated most: succinate (□) formation as a function of MDH activity in LG cells (top) and as a function of malic enzyme in EG cells (bottom), acetate (⧫) formation as a function of ASCT in LG cells, and pyruvate (●) formation as a function of GAPDH in EG cells. Rates of formation of pyruvate in LG cells and acetate in EG cells did not correlate well with any single enzyme.
Two groups of enzymes changing activities in a coordinated manner were identified (Fig. 5). The first group consists of enzymes in the central part of the glycolytic pathway: PFK, aldolase, TIM, G-3-PDH, and PK. With the exception of PK, which is regulated by phosphoenolpyruvate and fructose-1,6-bisphosphate (14) in L. donovani but by fructose-2,6-bisphosphate in T. brucei (41, 42), these enzymes are located in the glycosome. The activity of G-6-PDH, which is not part of the glycolytic pathway but is involved in the formation of polymannose (6), also correlates strongly with this group (data not shown). The second group consists of GAPDH and enzymes involved in the final part of glucose catabolism: MDH and ASCT. There was no correlation or a negative correlation between members of the two groups. Correlation between the different enzymes mentioned was usually better in LG cells than in EG cells.
FIG. 5.
Activities of PFK, aldolase, G-3-PDH, and PK as a function of TIM activity and GAPDH and ASCT as a function of MDH. Note the differences in scales in the various panels.
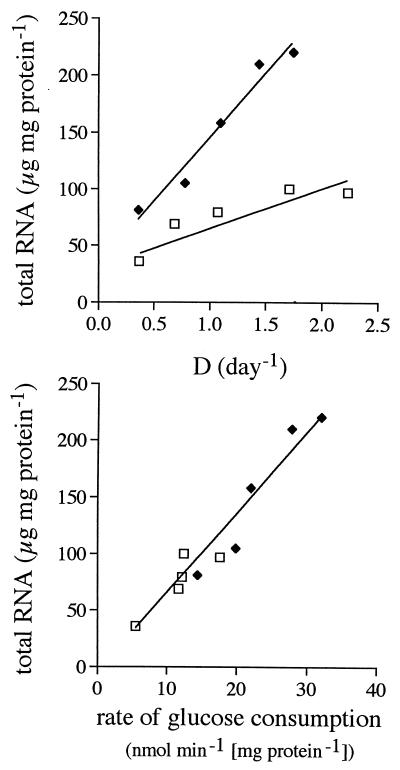
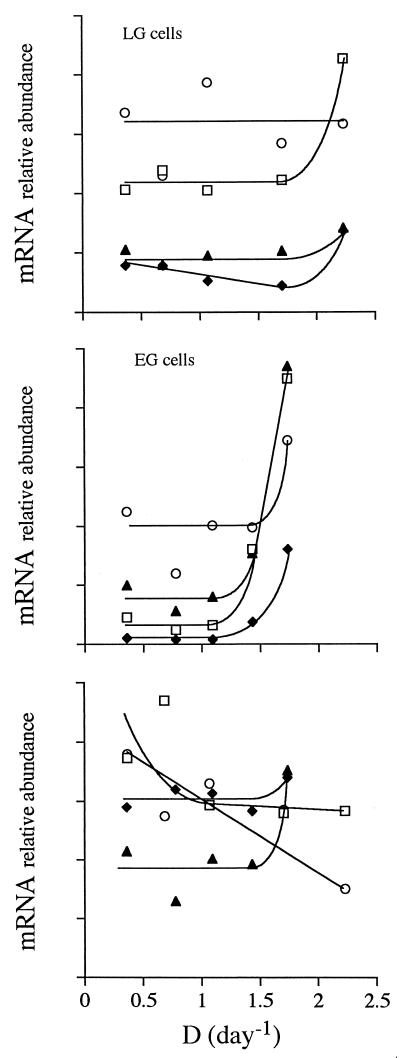
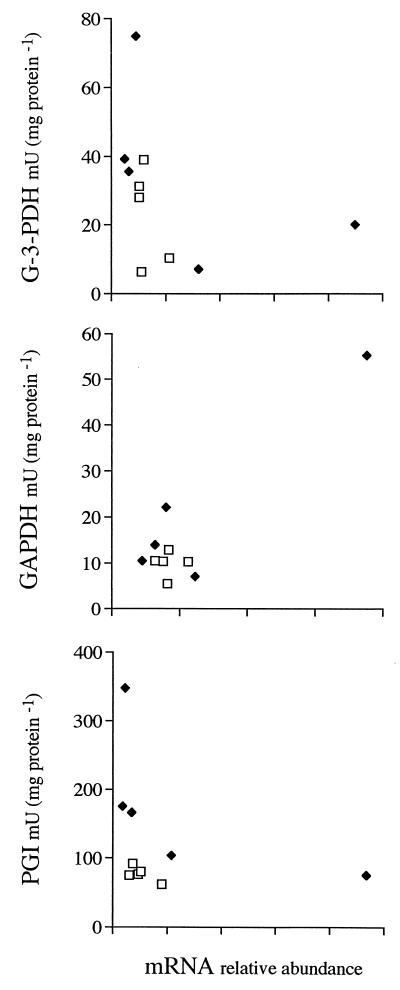
The total RNA content per milligram of cellular protein increased with growth rate but was invariably higher in EG cells than in LG cells (Fig. 6). The highest and lowest RNA contents differed by almost 1 order of magnitude. Of all possible parameters, total RNA content correlated best with specific rate of glucose consumption, increasing linearly as a function of this rate. The data points for LG cells and EG cells were on the same line. rRNA followed the same pattern (data not shown). In contrast, messages coding for different metabolic enzymes depended on growth rate in diverse ways (Fig. 7). Message levels remained basically unchanged at lower growth rates and increased only at the highest growth rates, most notably in EG cells. The exceptions to this trend were HSP70 and HTD2 (glucose transporter [21]) message levels in LG cells, which decreased with increasing growth rates. The correlation between levels of the different mRNAs was weak in EG cells and basically absent in LG cells (data not shown). The relationship between the steady-state message levels and the cellular activities of the enzymes that the messages encode was random as well (Fig. 8).
FIG. 6.
Total RNA as a function of growth rate (D) and as a function of specific rate of glucose consumption in LG cells (□) and EG cells (⧫). Protein was used as a normalizing factor.
FIG. 7.
Relative abundance of different messages as a function of growth rate, as measured by phosphorimaging. Protein was used as a normalizing factor. Symbols in top and middle panels: □, G-3-PDH; ⧫, β-tubulin; ○, phosphoglycerate kinase B (1, 30); ▴, GAPDH. Symbols in bottom panel: □, HSP70 in LG cells; ⧫, HSP70 in EG cells; ○, HTD2 in LG cells; ▴, HTD2 in EG cells.
FIG. 8.
Cellular activities of PGI, GAPDH, and G-3-PDH as a function of the encoding messages in LG cells (□) and EG cells (⧫). Note the lack of correlation between mRNA abundance and enzyme activity.
DISCUSSION
General aspects of the energy metabolism of L. donovani.
In this study, an isolate of L. donovani different from that used in an earlier characterization of energy metabolism was studied (36). The present results are mostly in accordance with those of the previous work, but the shift to a more energy-efficient metabolism when LG cells exceeded half the maximum growth rate was not observed. Estimates of growth rate-independent maintenance energy, defined as all substrates used for purposes other than growth and approximated by extrapolating specific substrate consumption to zero growth rate (43), were slightly higher this time, up to 50% the total substrate consumption. A similar high maintenance energy was found for T. vaginalis (31). The highly variable ratios of end products indicate less control over the entire metabolic pathway than was exerted in T. brucei (33) and were more in line with those in T. vaginalis (32). Stricter control over the glucose catabolic pathway, apparent from less variable end-product ratios, correlates with lower maintenance energy.
Adaptation of energy metabolism.
It is generally accepted that fluxes through metabolic pathways are rarely controlled by a single enzyme (15). Hence, adaptation of the activity of only one enzyme will not be sufficient to counteract environmental challenges. In theory, the number of possible responses of an organism to changing availability of a carbon source is nearly endless. A few of the possibilities are (i) maintaining constant enzyme levels and having fluxes change due to variations in levels of intermediates; (ii) changing all enzyme activities proportionally in response to alterations in the overall flux; (iii) sensing concentrations of intermediates and increasing only the activities of enzymes that convert the metabolites that accumulate; (iv) regulating enzyme activities through low-molecular-weight effectors, in particular, intermediates of steps further down the pathway; and (v) subordinating energy metabolism to other metabolic processes and having enzyme activities change due to causes not linked to energy metabolism.
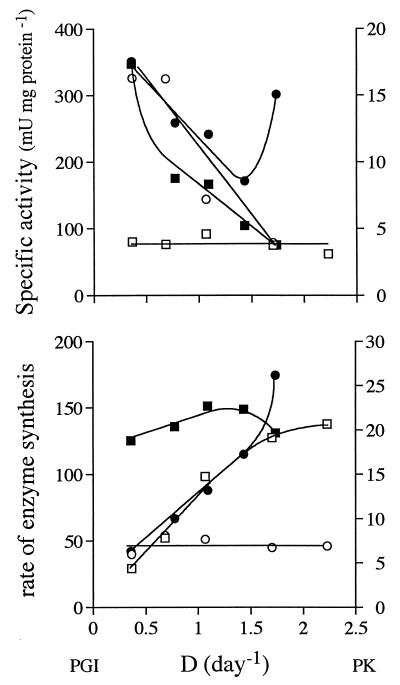
The specific activities of L. donovani metabolic enzymes changed in response to growth rate and availability of glucose in a manner that differs from those of both T. brucei (33) and T. vaginalis (32). The decreasing activities of enzymes catalyzing the initial and central parts of the glycolytic pathway with increasing growth rate can be explained simply by dilution of the enzymes by other cell materials. Such dilution will occur if the rate of synthesis is constant independent of growth rate. In that case, enzyme recruitment, calculated by multiplying activity by growth rate, should be constant. Activity will remain constant when the rate of synthesis increases linearly with growth rate. In Fig. 9, examples of both constant and linearly increasing rates of synthesis are presented. The activities of PGI in LG cells and PK in EG cells remained more or less constant, while the activities of PGI in EG cells and PK in LG cells decreased with growth rate. These findings translate into constant rates of synthesis for PGI in EG cells and PK in LG cells but almost linearly increasing rates for PGI in LG cells and PK in EG cells. For Fig. 9, two examples were chosen, but similar trends were observed for other enzymes as well (data not shown).
FIG. 9.
Activities of PGI (squares) and PK (circles) in LG cells (open symbols) and EG cells (closed symbols) as a function of growth rate (top panel) and calculated rates of synthesis assuming that rates of turnover are negligible in comparison to growth rate (bottom panel). A straight line crossing the origin would indicate rates of synthesis that maintain constant specific activities. D, dilution rate.
There is no correlation or a negative one between the activities of the initial enzymes of the pathway and the flux of carbon. The hypothesis that the enzymes in the beginning of the pathway completely control flux must be rejected because, with the exception of GAPDH, their activities correlate negatively with flux. A similar hypothesis cannot be rejected based on the data from this study for GAPDH, MDH, and ASCT. For verification of such a hypothesis, measurements of intracellular metabolite concentrations will have to be made simultaneously with enzyme measurements. The complete data set then will have to be modeled as was done for T. brucei bloodstream forms (3). On a preliminary basis, however, this would make the first group of enzymes less suitable targets for chemotherapy than the last.
It is unlikely that the rates of synthesis of the enzymes in the beginning of the pathway are adjusted to the rate of carbon consumption of the organism, whether individually, as in T. brucei, or as a group, as in T. vaginalis. GAPDH, MDH, and ASCT synthesis rates may be adjusted to the metabolic flux. Succinate thiokinase and glycerol kinase activities were detected only in EG cells, indicating regulation at the recruitment level in response to concentrations of intermediates. An important flux-controlling role for MDH and ASCT is likewise indicated by the good correlation between glucose consumption and CO2 formation in LG cells for only these enzymes among the 14 measured. The rates of formation of the other end products do not seem to depend on any single enzyme, suggesting flux control independent of the rate of glucose consumption and distributed throughout the pathway (15). It is possible that the incomplete oxidation of glucose occurs because the capacity of the glycolytic pathway exceeds the capacity of the mitochondrion. In that case, end products other than CO2 would be the result of overflow metabolism. At the mechanistic level, the activities of the two groups of enzymes seem to be adjusted by entirely different strategies. The latter group (GAPDH, MDH, and ASCT) behaved in a way predicted on theoretical grounds (16) and may be regulated by the third of the possible strategies mentioned above. The activities of the first group probably are not under the control of energy metabolism.
Regulation of RNA abundance.
The most remarkable finding with respect to RNA in L. donovani is that total RNA and rRNA contents seem to be determined by the specific rate of glucose consumption. At higher growth rates, an increase in the level of rRNA, the main constituent of total RNA, relative to the total cellular protein level can be expected, because the rate of protein synthesis increases. Nevertheless, growth rate is not the sole determinant of RNA content, as shown by a difference of a factor of 2 between LG cells and EG cells growing at similar rates. Since protein was used as a normalizing factor, the difference cannot be explained by the need to synthesize extra enzyme. The dependence of RNA content on glucose consumption may be explained by the fact that RNA synthesis requires more energy than protein synthesis. The relationship between growth rate and RNA abundance was entirely different in T. brucei and in T. vaginalis (34), indicating dissimilar mechanisms for regulating RNA levels in each species.
The increase in total cellular RNA content also does not agree well with the constant levels of most messages, which increase only at nearly maximum growth rates. These constant levels do not by necessity indicate that rates of mRNA synthesis increase linearly with growth rate, because turnover rates were not measured. If message half-lives are considerably shorter than the doubling time of the cell, as most likely is the case, constant rates of synthesis will yield constant levels, because dilution by newly synthesized cell material will be barely detectable. Even at the highest growth rates, doubling times exceeded 10 h, far longer than the probable half-life of mRNA. An increase in message levels at higher growth rates was also observed for T. brucei but not for T. vaginalis (34).
As in T. brucei and T. vaginalis, there was no correlation between message levels and the cellular activities of the enzymes that they encode. This lack of correlation cannot be explained as a temporary readjustment within the cell because, due to the use of chemostats, steady-state message and enzyme levels were compared. This finding emphasizes once more the importance of translational control in the expression of metabolic genes, similar to that in other organisms (22). The synthesis of β-tubulin in L. donovani is also controlled at the translational level (5), as are the syntheses of the variable surface glycoprotein, the procyclic repetitive acidic protein, and the hexose transporter of T. brucei (8, 18, 39). In addition, there was no correlation between total RNA or rRNA and the different kinds of mRNA or between the various mRNAs. As discussed above, the rates of synthesis of some enzymes were constant, while the levels of the messages encoding them were constant as well. Since constant mRNA levels may be maintained by constant rates of synthesis and turnover, a system of minimal regulation for these enzymes is indicated.
Intracellular interactions regulating energy metabolism.
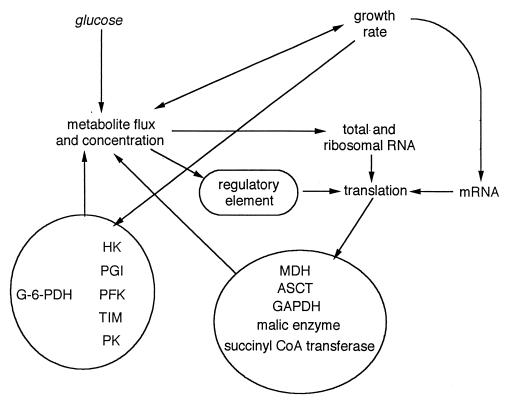
Correlations between compartments and processes involved in regulating energy metabolism in L. donovani are outlined in Fig. 10, which is intended to provide a phenomenological summary of the results. The basis of Fig. 10 is the most probable explanation for the observed correlations, not proven causal relationships. Glucose availability affects both the flux of metabolites and, at least for early intermediates, the intracellular metabolite concentrations. In LG cells, growth rate depended on metabolic flux. In EG cells, the causal relationship was inverse, as flux increased with growth rate, but growth rate was controlled by another component of the medium. As shown in Fig. 6, total RNA and rRNA levels depended on the flux of metabolites. Message levels were independent of total RNA levels, and the levels of most mRNAs remained unchanged through most of the range of growth rates and increased only at the highest growth rates.
FIG. 10.
Scheme indicating the phenomenology of interactions involved in the regulation of energy metabolism in L. donovani. Lines indicate observed correlations but not proven causal relationships or demonstrated cellular mechanisms. CoA, coenzyme. See the text for details.
Two groups of enzymes that had activities changing in parallel within the group but not between the groups were identified. The change in the cellular activities of members of the first group, which primarily belong to the initial part of the pathway, was not regulated in response to metabolic flux in the cell. Since the activity of none of the enzymes of this group correlated with the overall rate of glucose consumption, it is unlikely that this part of the pathway exerts much flux control. The activities of the second group, GAPDH, MDH, and ASCT, correlated well with the fluxes through the glucose pathway. The expression of their genes may therefore be under the control of metabolism. Fluxes cannot function as signals; only concentrations can be sensed. Hence, levels of intermediates may affect the expression of the genes coding for the enzymes catalyzing their metabolism. Changes in activities will influence the intracellular concentrations of the intermediates in that part of the pathway, forming a loop by which the metabolic and gene expression levels influence each other. Such systems are described by hierarchical control analysis (44, 45). Since message and enzyme levels did not correlate, regulation must occur primarily at the translational level. It is improbable that rates of translation can be regulated directly by metabolic intermediates. For that reason, a hypothetical regulatory element is introduced in Fig. 10. This element would consist of a “sensing protein” that can determine the levels of a metabolic intermediate and, through a signal transduction pathway, activate a translation initiation factor or inactivate a translation inhibitor of the relevant gene (2, 20). A major question is which intermediates would provide the initial signal. In the yeast Saccharomyces cerevisiae, the expression of core metabolic enzymes was regulated by metabolites two to five steps down the pathway (24). Such a system cannot operate in L. donovani, because regulation by end products would yield very erratic results. Consequently, the signal must be provided by intermediates of earlier steps or by metabolites converted by MDH or ASCT.
Strategy for regulation.
A comparison of the regulation of energy metabolism in L. donovani, T. brucei, and T. vaginalis demonstrates that the manner of regulation and adaptation substantially affects the overall physiology of each organism. The cellular activities of a large group of core metabolic enzymes of T. vaginalis are adapted in parallel to glucose availability (32), resulting in widely varying ratios of end products, depending on growth conditions. The ratios of end products also change in L. donovani, which regulates enzyme activities in a totally different manner. Both organisms have in common high maintenance energy, which indicates inefficient metabolism (29), because a large portion of the available energy is used for purposes other than growth. In contrast, T. brucei adapts the activity of each enzyme separately in a way that yields almost constant end-product ratios and requires very minimal maintenance energy (33). S. cerevisiae has a similar manner of separately adjusting the activity of each enzyme (24, 27) and also has very minimal maintenance energy (29). Therefore, the more complex manner of individually adjusting the activity of each enzyme is more energy efficient than groupwise adjustment of enzyme activities. At present, the manner of individual adjustment may seem uncoordinated in the sense that for the observer, no system can be discerned. The resulting efficiency and constant end-product ratios, however, indicate that the energy metabolism is strictly regulated by the cell in a way that probably cannot be understood unless intracellular metabolite concentrations are known as well.
Taxonomic and reconstructed evolutionary relationships reflect little on metabolic strategies. When L. donovani and T. brucei are compared to T. vaginalis, no strategy common to the kinetoplastids is apparent. Similarly, Trypanosoma cruzi and Leishmania infantum possess different control mechanisms for the regulation of histone expression (28). It therefore seems more probable that the ecology of the organism determines the manner of regulation and adaptation. The sandfly, the vector of L. donovani, feeds intermittently on a variety of plant and animal juices (10), making the supply of carbon unpredictable. It may therefore not be feasible for L. donovani to adapt as precisely to its growth conditions as T. brucei, because the conditions at any given moment have little predictive value for the future. The tsetse fly, however, feeds more regularly and restricts itself to blood meals, providing T. brucei with a more predictable environment.
ACKNOWLEDGMENTS
I thank M. Müller, H. V. Westerhoff, and D. A. Fell for stimulating discussions and M. Müller for comments on an early version of the manuscript. I greatly appreciate the careful and constructive criticism of two anonymous reviewers.
Financial support for this study was provided by grant 1 R29 AI34981 from the National Institute of Allergy and Infectious Diseases.
REFERENCES
- 1.Adje C A, Opperdoes F R, Michels P A. Organization, sequence and stage-specific expression of the phosphoglycerate kinase genes of Leishmania mexicana mexicana. Mol Biochem Parasitol. 1997;90:155–168. doi: 10.1016/s0166-6851(97)00152-7. [DOI] [PubMed] [Google Scholar]
- 2.Altmann M, Trachsel H. Regulation of translation initiation and modulation of cellular physiology. Trends Biochem Sci. 1993;18:429–432. doi: 10.1016/0968-0004(93)90143-b. [DOI] [PubMed] [Google Scholar]
- 3.Bakker B M, Michels P, Opperdoes F R, Westerhoff H V. Glycolysis in bloodstream form Trypanosoma brucei can be understood in terms of the kinetics of the glycolytic enzymes. J Biol Chem. 1997;272:3207–3215. doi: 10.1074/jbc.272.6.3207. [DOI] [PubMed] [Google Scholar]
- 4.Bergmeyer H U. Methods of enzyme analysis. New York, N.Y: Academic Press, Inc.; 1974. [Google Scholar]
- 5.Bhaumik M, Das S, Adhya S. Evidence for translational control of beta-tubulin synthesis during differentiation of Leishmania donovani. Parasitology. 1991;2:197–205. doi: 10.1017/s0031182000059485. [DOI] [PubMed] [Google Scholar]
- 6.Blum J J. Intermediary metabolism in Leishmania. Parasitol Today. 1993;9:118–122. doi: 10.1016/0169-4758(93)90168-f. [DOI] [PubMed] [Google Scholar]
- 7.Blum J J. Energy metabolism in Leishmania. J Bioenerg Biomembr. 1994;26:147–155. doi: 10.1007/BF00763063. [DOI] [PubMed] [Google Scholar]
- 8.Bringaud F, Baltz T. Differential regulation of two distinct families of glucose transporter genes in Trypanosoma brucei. Mol Cell Biol. 1993;13:1146–1154. doi: 10.1128/mcb.13.2.1146. [DOI] [PMC free article] [PubMed] [Google Scholar]
- 9.Brun R, Schonenberger M. Cultivation and in vitro cloning of procyclic culture forms of Trypanosoma brucei in a semi-defined medium. Acta Trop. 1979;36:289–292. [PubMed] [Google Scholar]
- 10.Brusell E. Introduction to insect physiology. New York, N.Y: Academic Press, Inc.; 1970. [Google Scholar]
- 11.Callens M, Kuntz D A, Opperdoes F R. Kinetic properties of fructose bisphosphate aldolase from Trypanosoma brucei compared to aldolase from rabbit muscle and Staphylococcus aureus. Mol Biochem Parasitol. 1991;47:1–9. doi: 10.1016/0166-6851(91)90142-s. [DOI] [PubMed] [Google Scholar]
- 12.Chirgwin J M, Przybyla A E, MacDonald R J, Rutter W J. Isolation of biologically active ribonucleic acid from sources enriched in ribonuclease. Biochemistry. 1979;18:5294–5299. doi: 10.1021/bi00591a005. [DOI] [PubMed] [Google Scholar]
- 13.Darling T N, Davis D G, London R E, Blum J J. Carbon dioxide abolishes the reverse Pasteur effect in Leishmania. Mol Biochem Parasitol. 1989;33:191–202. doi: 10.1016/0166-6851(89)90033-9. [DOI] [PubMed] [Google Scholar]
- 14.Etges R, Mukkada A J. Purification and characterization of a metabolite-regulated pyruvate kinase from Leishmania major promastigotes. Mol Biochem Parasitol. 1988;27:281–289. doi: 10.1016/0166-6851(88)90048-5. [DOI] [PubMed] [Google Scholar]
- 15.Fell D. Understanding the control of metabolism. London, England: Portland Press; 1997. [Google Scholar]
- 16.Fell D A, Thomas S. Physiological control of metabolic flux: the requirement for multisite modulation. Biochem J. 1995;311:35–39. doi: 10.1042/bj3110035. [DOI] [PMC free article] [PubMed] [Google Scholar]
- 17.Hart D T, Opperdoes F R. The occurrence of glycosomes (microbodies) in the promastigote stage of four major Leishmania species. Mol Biochem Parasitol. 1984;13:159–172. doi: 10.1016/0166-6851(84)90110-5. [DOI] [PubMed] [Google Scholar]
- 18.Hotz H R, Lorenz P, Fischer R, Krieger S, Clayton C. Role of 3′-untranslated regions in the regulation of hexose transporter mRNAs in Trypanosoma brucei. Mol Biochem Parasitol. 1995;75:1–14. doi: 10.1016/0166-6851(95)02503-0. [DOI] [PubMed] [Google Scholar]
- 19.Keegan F P, Blum J J. Utilization of a carbohydrate reserve comprised primarily of mannose by Leishmania donovani. Mol Biochem Parasitol. 1992;53:193–200. doi: 10.1016/0166-6851(92)90021-b. [DOI] [PubMed] [Google Scholar]
- 20.Kleijn M, Scheper G C, Voorma H O, Thomas A A. Regulation of translation initiation factors by signal transduction. Eur J Biochem. 1998;253:531–544. doi: 10.1046/j.1432-1327.1998.2530531.x. [DOI] [PubMed] [Google Scholar]
- 21.Langford C K, Ewbank S A, Hanson S S, Ullman B, Landfear S M. Molecular characterization of two genes encoding members of the glucose transporter superfamily in the parasitic protozoan Leishmania donovani. Mol Biochem Parasitol. 1992;55:51–64. doi: 10.1016/0166-6851(92)90126-5. [DOI] [PubMed] [Google Scholar]
- 22.McCarthy J E G. Posttranscriptional control of gene expression in yeast. Microbiol Mol Biol Rev. 1998;62:1492–1553. doi: 10.1128/mmbr.62.4.1492-1553.1998. [DOI] [PMC free article] [PubMed] [Google Scholar]
- 23.Mertens E, Van Schaftingen E, Müller M. Pyruvate kinase from Trichomonas vaginalis, an allosteric enzyme stimulated by ribose 5-phosphate and glycerate 3-phosphate. Mol Biochem Parasitol. 1992;54:13–20. doi: 10.1016/0166-6851(92)90090-7. [DOI] [PubMed] [Google Scholar]
- 24.Müller S, Boles E, May M, Zimmermann F K. Different internal metabolites trigger the induction of glycolytic gene expression in Saccharomyces cerevisiae. J Bacteriol. 1995;177:4517–4519. doi: 10.1128/jb.177.15.4517-4519.1995. [DOI] [PMC free article] [PubMed] [Google Scholar]
- 25.Opperdoes F R. Compartmentation of carbohydrate metabolism in trypanosomes. Annu Rev Microbiol. 1987;41:127–151. doi: 10.1146/annurev.mi.41.100187.001015. [DOI] [PubMed] [Google Scholar]
- 26.Opperdoes F R, Borst P. Localization of nine glycolytic enzymes in a microbody-like organelle in Trypanosoma brucei: the glycosome. FEBS Lett. 1977;80:360–364. doi: 10.1016/0014-5793(77)80476-6. [DOI] [PubMed] [Google Scholar]
- 27.Sierkstra L N, Nouwen N P, Verbakel J M, Verrips C T. Regulation of glycolytic enzymes and the Crabtree effect in galactose-limited continuous cultures of Saccharomyces cerevisiae. Yeast. 1993;9:787–795. doi: 10.1002/yea.320090713. [DOI] [PubMed] [Google Scholar]
- 28.Soto M, Requena J M, Quijada L, Alonso C. Organization, transcription and regulation of the Leishmania infantum histone H3 genes. Biochem J. 1996;318:813–819. doi: 10.1042/bj3180813. [DOI] [PMC free article] [PubMed] [Google Scholar]
- 29.Stouthamer A H. The search for correlation between theoretical and experimental growth yields. Int Rev Biochem. 1979;21:1–47. [Google Scholar]
- 30.Swinkels B W, Loiseau A, Opperdoes F R, Borst P. A phosphoglycerate kinase-related gene conserved between Trypanosoma brucei and Crithidia fasciculata. Mol Biochem Parasitol. 1992;50:69–78. doi: 10.1016/0166-6851(92)90245-f. [DOI] [PubMed] [Google Scholar]
- 31.Ter Kuile B H. Carbohydrate metabolism and physiology of the parasitic protist Trichomonas vaginalis studied in chemostats. Microbiology. 1994;140:2495–2502. doi: 10.1099/13500872-140-9-2495. [DOI] [PubMed] [Google Scholar]
- 32.Ter Kuile B H. Metabolic adaptation of Trichomonas vaginalis to growth rate and glucose availability. Microbiology. 1996;142:3337–3345. doi: 10.1099/13500872-142-12-3337. [DOI] [PubMed] [Google Scholar]
- 33.Ter Kuile B H. Adaptation of metabolic enzyme activities of Trypanosoma brucei promastigotes to growth rate and carbon regimen. J Bacteriol. 1997;179:4699–4705. doi: 10.1128/jb.179.15.4699-4705.1997. [DOI] [PMC free article] [PubMed] [Google Scholar]
- 34.Ter Kuile B H, Bonilla Y. Influence of growth conditions on RNA levels in relation to activity of core metabolic enzymes in the parasitic protists Trypanosoma brucei and Trichomonas vaginalis. Microbiology. 1999;145:755–765. doi: 10.1099/13500872-145-3-755. [DOI] [PubMed] [Google Scholar]
- 35.Ter Kuile B H, Opperdoes F R. Chemostat cultures of Leishmania donovani promastigotes and Trypanosoma brucei procyclic trypomastigotes. Mol Biochem Parasitol. 1991;45:171–173. doi: 10.1016/0166-6851(91)90039-9. [DOI] [PubMed] [Google Scholar]
- 36.Ter Kuile B H, Opperdoes F R. Comparative physiology of two protozoan parasites, Leishmania donovani and Trypanosoma brucei, grown in chemostats. J Bacteriol. 1992;174:2929–2934. doi: 10.1128/jb.174.9.2929-2934.1992. [DOI] [PMC free article] [PubMed] [Google Scholar]
- 37.Ter Kuile B H, Opperdoes F R. Uptake and turnover of glucose in Leishmania donovani. Mol Biochem Parasitol. 1993;60:313–321. doi: 10.1016/0166-6851(93)90142-k. [DOI] [PubMed] [Google Scholar]
- 38.Tielens A, Van Hellemond J J. Differences in energy metabolism between Trypanosomatidae. Parasitol Today. 1998;14:265–271. doi: 10.1016/s0169-4758(98)01263-0. [DOI] [PubMed] [Google Scholar]
- 39.Vanhamme L, Pays E. Control of gene expression in trypanosomes. Microbiol Rev. 1995;59:223–240. doi: 10.1128/mr.59.2.223-240.1995. [DOI] [PMC free article] [PubMed] [Google Scholar]
- 40.Van Hellemond J J, Opperdoes F R, Tielens A G M. Trypanosomatidae produce acetate via a mitochondrial acetate:succinate CoA transferase. Proc Natl Acad Sci USA. 1998;95:3036–3041. doi: 10.1073/pnas.95.6.3036. [DOI] [PMC free article] [PubMed] [Google Scholar]
- 41.van Schaftingen E, Opperdoes F R, Hers H G. Stimulation of Trypanosoma brucei pyruvate kinase by fructose-2,6-bisphosphate. Eur J Biochem. 1985;153:403–406. doi: 10.1111/j.1432-1033.1985.tb09316.x. [DOI] [PubMed] [Google Scholar]
- 42.Van Schaftingen E, Opperdoes F R, Hers H G. Effects of various metabolic conditions and of the trivalent arsenical melarsen oxide on the intracellular levels of fructose 2,6-bisphosphate and of glycolytic intermediates in Trypanosoma brucei. Eur J Biochem. 1987;166:653–661. doi: 10.1111/j.1432-1033.1987.tb13563.x. [DOI] [PubMed] [Google Scholar]
- 43.Veldkamp H. Continuous culture in microbial physiology and ecology. Durham, United Kingdom: Meadowfield Press; 1976. [Google Scholar]
- 44.Westerhoff H V, Jensen P R, Snoep J L, Kholodenko B N. Thermodynamics of complexity—the live cell. Thermochim Acta. 1998;309:111–120. [Google Scholar]
- 45.Westerhoff H V, Kahn D. Control involving metabolism and gene expression: the square-matrix. Acta Biotheor. 1993;41:75–83. doi: 10.1007/BF00712776. [DOI] [PubMed] [Google Scholar]


