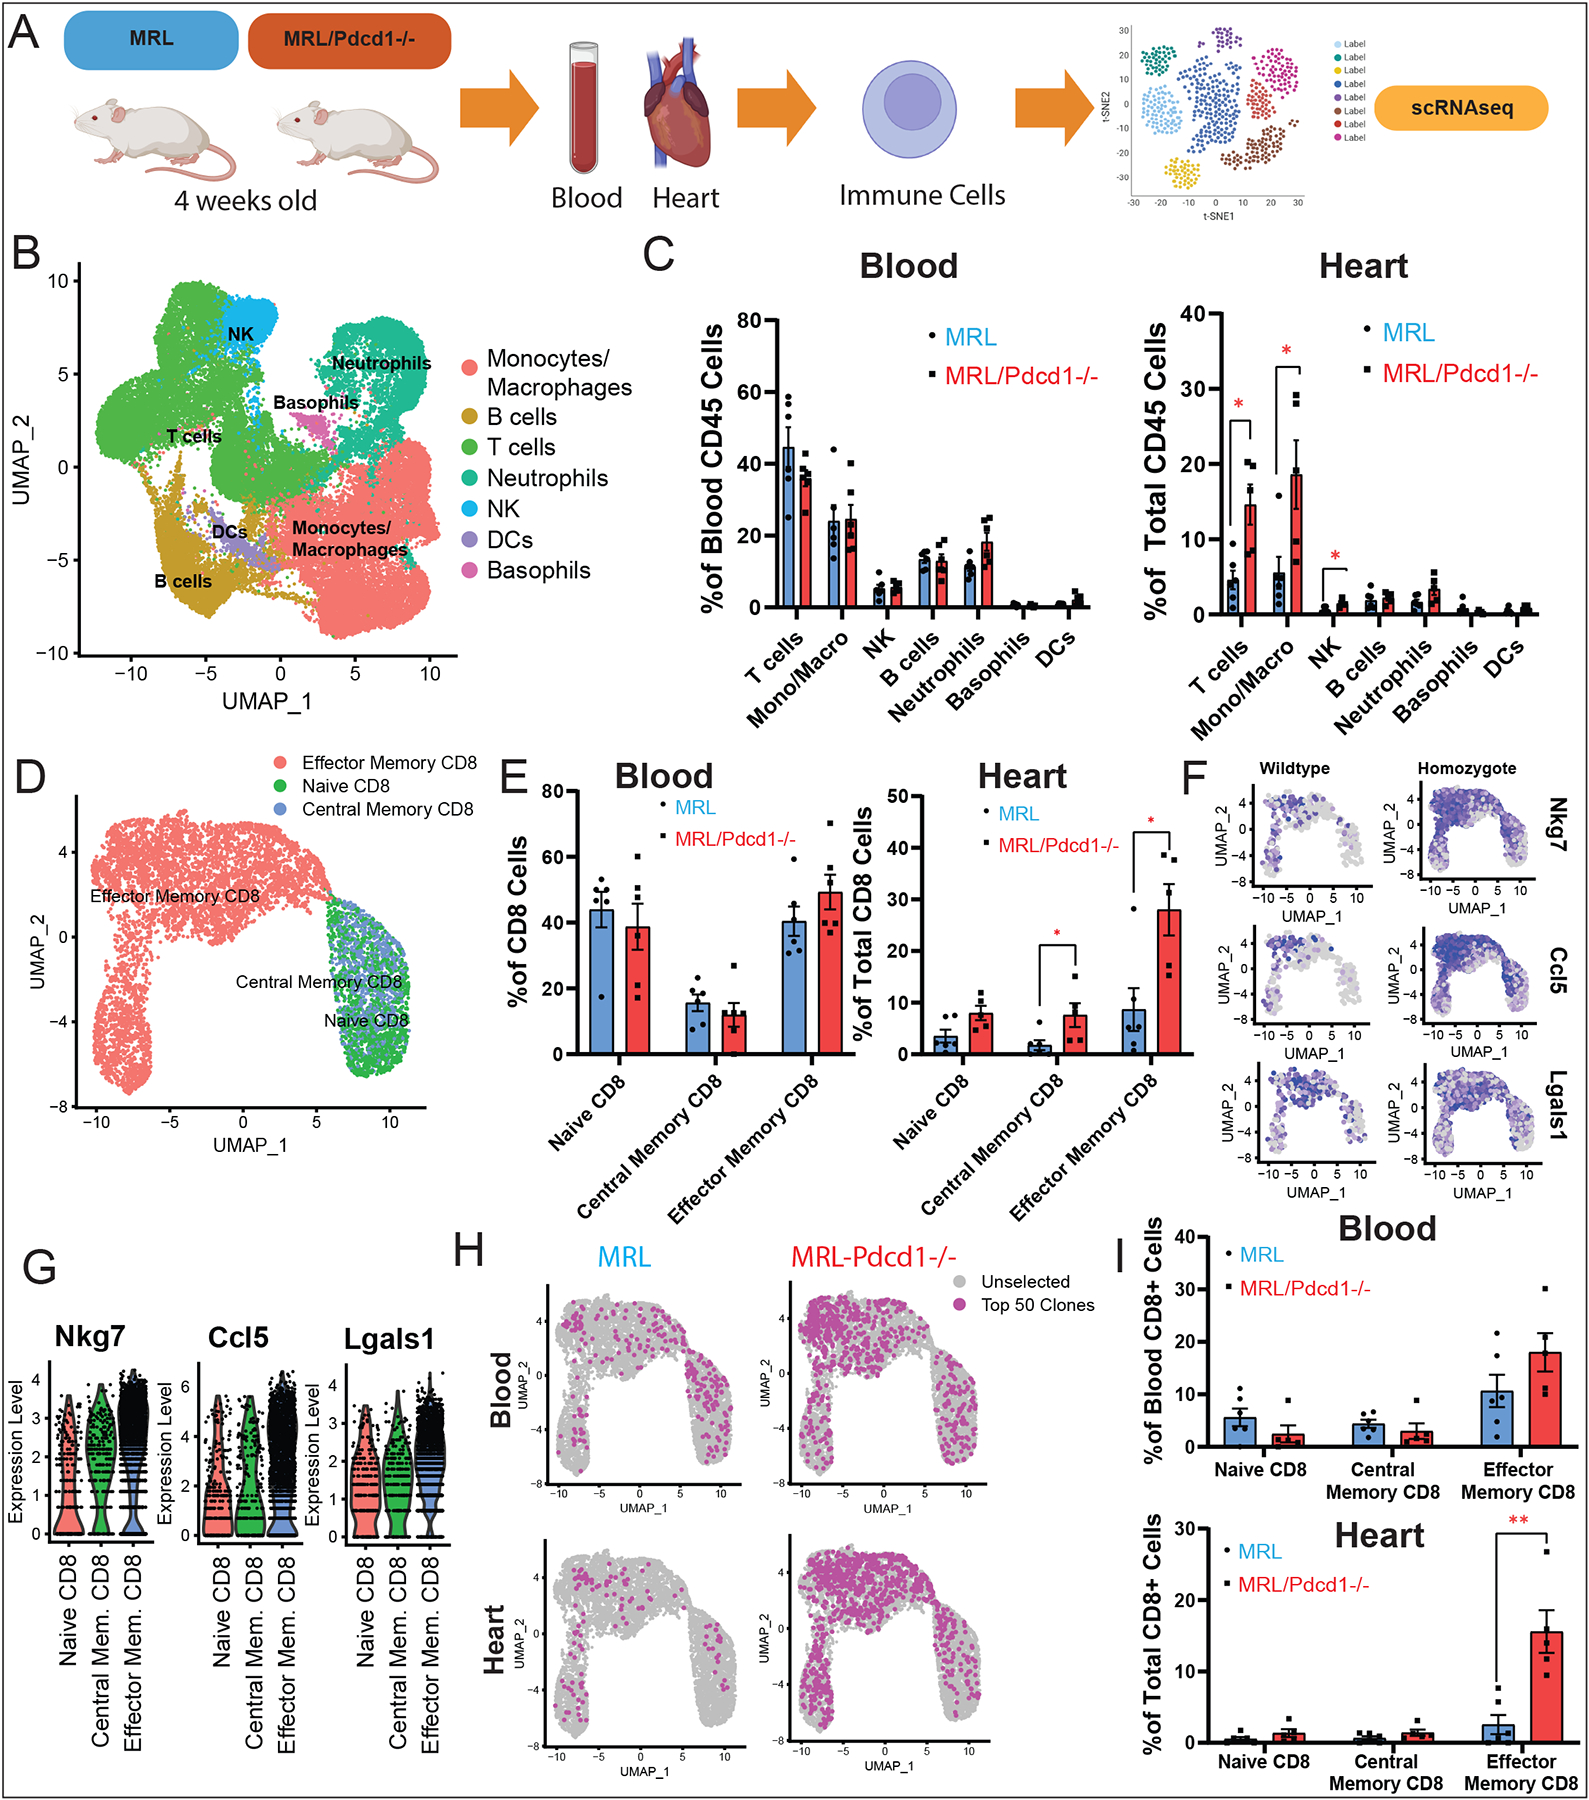
Fig. 7. Analysis of Immune Cell Populations in MRL vs. MRL/Pdcd1−/− mice using scRNA-seq.

(A) Workflow showing collection of peripheral blood and processing of single-cell suspensions for single-cell RNA-seq from 4-week-old MRL/Pdcd1−/− mice (n=6) with spontaneous myocarditis and control MRL mice (n=6). (B) Identification of CD45+ immune cell clusters from blood and hearts of MRL/Pdcd1−/− and control MRL mice. (C) Quantification of CD45+ cell subtypes across clusters and comparison of MRL vs. MRL/Pdcd1−/− mice show increased macrophages/monocytes as well as T-cells in the hearts of MRL/Pdcd1−/− mice. Average and SEM are shown for each genotype. Statistical analysis compares MRL vs MRL/Pdcd1−/− groups. (D) Identification of CD8+ immune cell clusters from blood and hearts of MRL/Pdcd1−/− and control MRL mice. (E) Quantification of CD8+ cell subtypes across clusters and comparison of MRL vs. MRL/Pdcd1−/− mice. Average and SEM are shown for each genotype. Statistical analysis compares MRL vs MRL/Pdcd1−/− groups. (F) Feature plots showing top differentially expressed genes in CD8+ T-cells among MRL/Pdcd1−/− mice compared to MRL mice, showing increased expression of cytotoxicity markers (Nkg7), myocardial-tropic chemokines (Ccl5), and exhaustion markers (Lgals1) in the effector CD8+ T-cell clusters. (G) Violin plots displaying significantly differentially expressed genes in MRL/Pdcd1−/− compared to MRL mice, including cytotoxicity markers (Nkg7), myocardial-tropic chemokines (Ccl5), and exhaustion markers (Lgals1) in the effector CD8+ T-cell clusters. (H) Visualization of top 50 TCR clonotypes in blood and hearts of MRL and MRL/Pdcd1−/− mice. (I) Quantification of top 50 TCR clonotypes across CD8+ cell subtypes in MRL/Pdcd1−/− mice and MRL control mice.
