

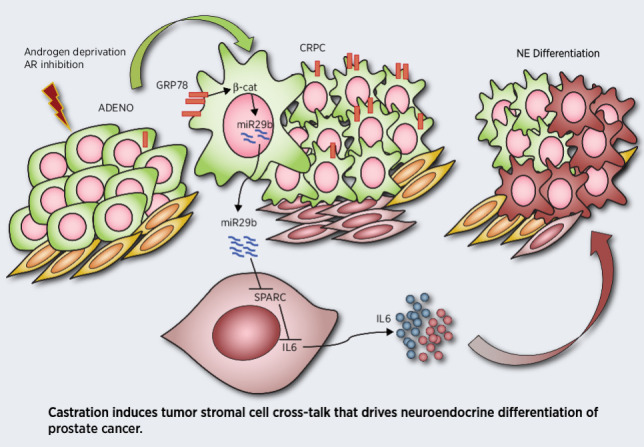
Tumor–stroma cross-talk promotes neuroendocrine differentiation in prostate cancer in response to hormone therapy via a GRP78/SPARC/IL6 axis, providing potential therapeutic targets and biomarkers for neuroendocrine prostate cancer.
Abstract
Fatal neuroendocrine differentiation (NED) of castration-resistant prostate cancer is a recurrent mechanism of resistance to androgen deprivation therapies (ADT) and antiandrogen receptor pathway inhibitors (ARPI) in patients. The design of effective therapies for neuroendocrine prostate cancer (NEPC) is complicated by limited knowledge of the molecular mechanisms governing NED. The paucity of acquired genomic alterations and the deregulation of epigenetic and transcription factors suggest a potential contribution from the microenvironment. In this context, whether ADT/ARPI induces stromal cells to release NED-promoting molecules and the underlying molecular networks are unestablished. Here, we utilized transgenic and transplantable mouse models and coculture experiments to unveil a novel tumor-stroma cross-talk that is able to induce NED under the pressure of androgen deprivation. Castration induced upregulation of GRP78 in tumor cells, which triggers miR29-b–mediated downregulation of the matricellular protein SPARC in the nearby stroma. SPARC downregulation enabled stromal cells to release IL6, a known inducer of NED. A drug that targets GRP78 blocked NED in castrated mice. A public, human NEPC gene expression dataset showed that Hspa5 (encoding for GRP78) positively correlates with hallmarks of NED. Finally, prostate cancer specimens from patients developing local NED after ADT showed GRP78 upregulation in tumor cells and SPARC downregulation in the stroma. These results point to GRP78 as a potential therapeutic target and to SPARC downregulation in stromal cells as a potential early biomarker of tumors undergoing NED.
Significance:
Tumor–stroma cross-talk promotes neuroendocrine differentiation in prostate cancer in response to hormone therapy via a GRP78/SPARC/IL6 axis, providing potential therapeutic targets and biomarkers for neuroendocrine prostate cancer.
Graphical Abstract
Introduction
Prostate cancer is the second leading cause of cancer-related death and the most commonly diagnosed cancer in the U.S. males (1). Being a hormone-driven disease, advanced and metastatic tumors are treated with androgen deprivation therapy (ADT). However, this treatment eventually leads to castration-resistant prostate cancer (CRPC) in most patients (2). Despite the introduction of next-generation ADT such as enzalutamide or abiraterone, which blocks the androgen receptor (AR) pathway (named “androgen receptor pathway inhibitors”, or ARPI), prognosis remains dismal because of primary or acquired resistance (2). Therapeutic resistance of CRPC is often associated with the gain of neuroendocrine (NE) features (3). A form of “de novo” NE prostate cancer (NEPC), that resembles small-cell NE tumors of lung and pancreas, occurs rarely (<2% of patients) in untreated patients with prostate cancer (3, 4). On the contrary, treatment-related NEPC is a relevant clinical entity (5) that is thought to occur through trans-differentiation of adenocarcinoma cells as a consequence of ADT/ARPI (6, 7). The molecular mechanisms driving NE differentiation (NED) remain poorly defined. Intrinsic tumor features include (i) genomic alterations (loss of RB1 and TP53 and amplification of MYCN (6), (ii) deregulation of epigenetic regulators [upregulation of EZH2 (8), and downregulation of REST (9)], and (iii) upregulation of transcription factors [BRN2 (10), PEG10 (11), and FOXA2 (12)]. The paucity of genomic aberrations suggests that the microenvironment contributes to NED through the production of paracrine factors (13), including the recently identified IL6 (14), SFRP1 (15), glutamine (16), and neurotensin (17). However, the molecular networks that are activated in response to ADT and trigger stromal cells to release these mediators remain largely unknown. Furthermore, no biomarkers that can predict risk of NED are currently available.
The secreted protein acidic and rich in cysteine (SPARC) is a matricellular protein involved in tissue remodeling and plasticity in physiologic and pathologic conditions. It exerts different functions when released from or retained within the cell (18, 19). SPARC can be either up- or downregulated in different tumor types, and can be produced by both the neoplasm and the neighboring stromal cells (20). Its role in prostate cancer is controversial. Tumor SPARC upregulation is associated with epithelial-to-mesenchymal transition (EMT) and metastasis (21), but stroma-derived SPARC can limit proliferation of prostate cancer cells (22). Deletion of the Sparc gene enhanced tumor growth in the TRAMP mouse model of prostate cancer (23), but the different roles of tumor versus stroma SPARC and the role of SPARC in NED were not investigated.
Here, we unveil that a cross-talk between tumor and stromal cells is necessary for adenocarcinoma–NEPC transition under the pressure of ADT. In response to therapy, tumor cells release miR29-b, which in turn triggers the downregulation of SPARC in stromal cells. We demonstrate that stromal SPARC downregulation is a key event needed for NED of prostate cancer cells, and could represent a potential biomarker. We also prove that pharmacologic inhibition of GRP78, the driver of this cross-talk, restrains NED in castrated TRAMP mice, highlighting GRP78 as a promoter of NED and a potential therapeutic target in patients.
Materials and Methods
Mice and treatments
TRAMP mice on C57BL6/J background (C57BL/6-tgN (TRAMP)8247Ng) (RRID:IMSR_JAX:003135) were kindly provided by V. Bronte (Verona University Hospital, Italy), under agreement with Dr. N.M. Greenberg (formerly at Fred Hutchinson Cancer Research Center, Seattle, WA). They were maintained and screened as described previously (24). Mice deficient for Sparc on a mixed 129SV/C57BL/6 background (RRID:IMSR_JAX:003728; ref. 25) were provided by C. Howe (The Wistar Institute, Philadelphia, PA). They were backcrossed to C57BL/6 for 12 generations (Charles River Laboratories; RRID:SCR_003792) and then intercrossed over 12 generations with TRAMP mice (B6.tgN (TRAMP)8247Ng Sparc<tm1Hwe> Ptprc<a>/J). TRAMP+/− and Sparc−/−TRAMP+/− mice were used for experiments.
Surgical castration was performed in 20-week-old TRAMP mice, under anesthesia with ketamine (100 mg/kg; Imalgene, Boeringher Ingheilm) and xylazine (5 mg/kg; Rompun, Bayer) with carprofen given as an analgesic (5 mg/kg; Norocarp, Norbrook). All transgenic mice were sacrificed at 30 weeks of age. For subcutaneous tumor challenge, 2×10⁶ T23 cells or 5×10⁵ RM1 cells were injected into the right flanks of C57BL/6 or Sparc−/− male mice. Mice were sacrificed when tumor diameters reached 10 mm. Anti-IL6-R antibody (200 μg/mouse; clone 15A7; for in vivo studies purified from hybridoma cells as indicated in Supplementary Table S1), isotype control (200 μg/mouse, Supplementary Table S1), isoliquiritigenin (Selleckem; catalog no. S2404, 10 mg/Kg) or vehicle, were injected intra-peritoneum twice a week. Treatments started one-week post castration in TRAMP mice or when tumors were palpable in subcutaneous models. Animal housing and experimentation were performed following institutional guidelines and the Italian law (D.Lgs. 26/2014). In vivo experiments were approved by the Italian Ministry of Health (authorization numbers 664/2017-PR, 758/2018-PR and 256/2021-PR).
Cell lines and in vitro experiments
T1525 and T23 prostate adenocarcinoma cell lines were isolated from TRAMP mice as described previously (26). Stable fibroblast cell lines were generated from muscle and dermis of newborn C57BL/6 or Sparc−/− mice as described previously (27). To restore SPARC expression, Sparc−/− fibroblasts were infected with the retroviral vector LXSPARCSH as in (28). RM1 murine prostate carcinoma cells (ATCC CRL-3310; RRID:CVCL_B459; (29)) and LNCaP human prostate cancer cells (clone FGC, ATCC CRL-1740; RRID:CVCL_1379) were purchased from ATCC. The human WPMY-1 prostate stromal cell line was kindly provided by N. Zaffaroni in our Institute, who originally purchased it from ATCC (ATCC-CRL2854; RRID:CVCL_3814). All cell lines were routinely tested for Mycoplasma using the MycoAlert Mycoplasma Detection Kit (Lonza, catalog no. LT07–118).
For coculture experiments, cells were plated in transwell plates (0.4-μm pore size, Corning), at a 1:1 tumor cell: fibroblast ratio. Experiments were repeated to allow alternative seeding of tumor cells or fibroblasts on the bottom of the well, to ensure proper cell recovery. When indicated, IL6 (50 ng/mL, PeproTech), mAb to IL6-R (50 ng/mL; D7715A7 clone, for in vitro experiments purchased from eBioscience, as indicated in Supplementary Table S1), enzalutamide (10 μmol/L; SelleckChem, catalog no. S1250), isoliquiritigenin (25 μmol/L, SelleckChem, catalog no. S2404) or HA15 (10 μmol/L SelleckChem, catalog no. S8299) were added.
Human prostate cancer samples
Formalin-fixed paraffin-embedded (FFPE) human tumor samples from core-biopsies and prostatectomies from patients with prostate cancer, either untreated or undergoing neoadjuvant ADT, were obtained from the European Institute of Oncology (IEO), Milan, Italy. Samples were collected in accordance with the Helsinki Declaration. Tissue collection, fixation, and processing were performed according to standardized protocols adopted by the Uropathology and Intraoperative Consultation of IEO, as part of routine clinical activity. Immunofluorescence and IHC performed in this study were approved by the Institutional Review Board of IEO (authorization number UID 2133; informed written consent was not obtained because according to Institutional rules it was not necessary for these analyses).
IHC and immunofluorescence
Murine and human FFPE tumor samples were cut in 5-μm sections. Slides were deparaffined, rehydrated, and stained with hematoxylin and eosin (BioOptica).
For IHC, antigen retrieval was performed utilizing: (i) the Novocastra Epitope Retrival Solution pH9 (Leica Biosystems), at 98°C for 30 minutes, for human and mouse SPARC; (ii), the Dako EnVision Flex Target Retrieval Solution High pH (Dako Omnis) for human AR and synaptophysin (SYP) and (iii) the Dako EnVision Flex Target Retrieval Solution Low pH (Dako Omnis) at 98°C for 30 minutes for human and mouse cromogranin A (CgA). After neutralization of the endogenous peroxidase with 3% H2O2 and specific Fc blocking (Novocastra, Leica Biosystems), samples were incubated with primary antibodies (listed in Supplementary Table S1). Staining was revealed using polymer detection kit (Novocastra, Leica Biosystems) or goat anti-rat IgG secondary antibody 1:500 (listed in Supplementary Table S1) and S3′-Amino-9-ethylcarbazole or DAKO EnVison FLEX (Dako Omnis, catalog no. GV800) as chromogenic substrate, followed by counterstaining with Harris hematoxylin (Novocastra, Leica Biosystems). Slides were analyzed under an Axioscope A1 microscope equipped with Axiocam 503 Color camera (Zeiss). Scan of whole human slides was obtained with Aperio Scan Scope (svs files) and pictures were extracted with ObjectiveView software.
For immunofluorescence, after antigen retrieval, sections were blocked with PBS-Tween (0.1%) containing 5% of BSA (Sigma). Primary antibodies were incubated overnight at 4°C; when necessary, staining with secondary antibodies was performed for 30 minutes at room temperature. All antibodies used are listed in Supplementary Table S1. Slides were mounted with ProLong Diamond Antifade Mountant with DAPI (Thermo Fisher Scientific), and acquired with a Leica DM4 B microscope equipped with a Leica DFC450 C digital camera, utilizing the LAS X software (Leica Biosystems; RRID:SCR_013673). Alternatively, for pSTAT3, immunofluorescence imaging was performed using a confocal laser-scanning microscope Leica TCS SP8 X (Leica Microsystems), Images were analyzed using the ImageJ (RRID:SCR_003070) software.
The “SPARC Score” was assigned comparing the staining intensity of all the slides, given 3 to the maximum intensity observed and 0 to the lowest, and then reassigning the values to all the slides. For digital quantification, we used the Aperio Image Scope (RRID:SCR_006355) and/or the ImageJ (RRID:SCR_003070) softwares. We quantified staining intensity in five different pictures at 20× magnification for each slide and we reported in graph the average of the five measurements. Serial slides cut from the same FFPE sample containing patient's prostatectomy or tumor biopsy were used for all the IHC and IF staining. Two board-certified pathologists (G. Renne and C. Tripodo) analyzed IHC slides in a blind fashion and highlighted them with felt-tip areas interested by neoplasia. Slides used for IF were then superimposed and the same areas were marked. Pictures were taken within these areas. A similar procedure was adopted to analyze murine prostates.
Mouse tumor histopathology
A board-certified pathologist (C. Tripodo) examined all the lobes of TRAMP prostates and classified lesions according to histopathologic and phenotypic analyses as follows. Adenocarcinomas (ADENO) were characterized by CK8 positive atypical cells with high nuclear pleiomorphism, variably marginated chromatin and prominent nucleoli, that formed distorted/ill-defined glands within the stroma. De novo NE in untreated TRAMP mice were composed by sheets and nests of medium-sized to large cells with high nuclear to cytoplasmic ratio, hyperchromatic nuclei, frequent mitotic/apoptotic figures and/or anaplastic morphology, in the absence of signs of glandular structures formation, immunoreactive for SYP and CgA, but negative for CK8. Tumors arising in castrated or Sparc−/− TRAMP mice and showing similar features as described above were also scored as “de novo” NE. NED was defined by the presence of tumor foci of atypical cells with less pleiomorphic nuclei and granular chromatin, which display a tendency to diffuse growth still maintaining the capability to form glandular remnants, with nuclear features of NE tumors and expression of CK8, SYP, and CgA. This definition of NED is in accordance with a published consensus (30) and with the proposed morphological classification of prostate cancer subtypes (31). Regression was marked by a variable degree of glandular involution within the context of stromal remodeling proliferation. When “de novo” NE tumors and adenocarcinoma were present in different lobes, we classified the sample as “de novo” NE.
RNA and BASE scope assays
Mouse pre-Mir29b (Mm-pre-MIR29b-1zz-st targeting 2–52 of NR_029532.1; Cod. 713421; Advanced Cell Diagnostic, ACD) and mouse Il6 transcript (Mm-Il6; Cod. 315891, ACD) were detected using BaseScope Detection kit (ACD) or RNAscope 2.5 HD Detection Reagent-BROWN (ACD), respectively, according to the manufacturer's protocol. The same sections that underwent RNA-scope hybridization were also stained for Synaptophysin or for PDGFRβ (Supplementary Table S1) by IHC. After specific Fc blocking (Novocastra, Leica Biosystems), primary antibodies were applied overnight and staining was revealed using Rabbit on Rodent AP-Polymer (BioCare) or SignalStain Boost IHC Detection Reagent (AP, Rabbit). Vulcan Fast Red was used as substrate-chromogen followed by counterstaining with Harris hematoxylin.
Transfection with miRNA inhibitors
Fibroblasts or T23 cells were transfected by mixing in a 1:1 ratio Lipofectamine3000 Reagent (Invitrogen, catalog no. L3000015) with an anti-miR specific for miR29b (mmu-miR-29b-3p, catalog no. AM17000; Invitrogen mirVana by Thermo Fisher Scientific) both diluted in Opti-MEM (Gibco, catalog no. 31985070). Positive and negative controls (Invitrogen mirVana miRNA Inhibitor, let-7c positive control, catalog no. 4464080 and negative control #1, catalog no. 4464076, respectively) were used to verify efficiency of transfection (by measuring Hmga2 transcript levels after two days).
Sparc reporter assay
The sequence of Sparc 3′UTR, extrapolated on the Genome Browser website (RRID:SCR_004267), was synthetized, amplified in a pUC57 vector (Genscript Biotech), and then cloned in a psiCHECK-2 vector (Promega, catalog no. C8021), downstream of Firefly and Renilla luciferase genes, inserted as reporter (the vector was named psiCHECK-SPARC-3′UTR). Fibroblasts were transfected with psiCHECK-SPARC-3′UTR in presence or not of mimics of miR29b 3p or miR29b 5p (Invitrogen mirVana mimics, catalog no. 4464066), using Lipofectamine 3000 Reagent (Invitrogen, catalog no. L3000015), following the manufacturer's protocol. Dual-Luciferase Reporter Assay System Kit (Promega, catalog no. E1910) was used to assess Firefly and Renilla luciferase activity as readout of miRNA targeting the 3′UTR of Sparc.
Sparc and Hspa5 siRNA transient transfection
Fibroblasts or T23 cells were transfected with 10μmol/L of mouse siRNA specific for Sparc or Hspa5, (Thermo Fisher Scientific, siRNA ID: 150942 and s68084, respectively) or a scramble control, using Lipofectamine3000 Reagent (Invitrogen, catalog no. L3000015).
Murine prostate digestion and sorting of luminal and stromal populations
We adapted the procedure from a published protocol (32). Prostates lobes were digested with collagenase I (1 mg/mL GIBCO, catalog no. 17018–029) for 2 hours at 37°C. After washing, pellets were dissociated with Trypsin-EDTA (Euroclone), p1000 pipette, and 18G needle. Obtained cell suspensions were filtered through a 40-μm strainer, washed in PBS, and then stained for 15 minutes at 4°C with fluorochrome-labeled mAbs (listed in Supplementary Table S1). 7AAD (eBioscience) was added to exclude dead cells. Samples were acquired with a BD FACSAria instrument. Cells were sorted as Lineage (CD45/CD31/Ter119) negative, and CD49f+Sca-1− (luminal) or CD49f−Sca1+ (stromal). For each experiment, cells were sorted from a pool of at least three mice per group. Real-time PCRs were performed on samples obtained in three independent sorting, for a total of three independent biological replicates per group.
Flow cytometry and Western blot analyses
Detailed protocols are reported in Supplementary Materials and Methods and antibodies used are listed in Supplementary table S1.
Exosome purification
Exosomes were purified from cell culture supernatants utilizing the ExoQuick-TC kit (System Biosciences; catalog no. EXOTC50A-1), following the manufacturer's protocol. For RNA extraction, the protocol described for cell supernatants was followed.
Real-time PCR
Total RNA from cells was extracted using the Quick RNA Micro Prep Kit (Zymo Research). For the supernatants, 500 μL of supernatant was admixed 1:1 with TRIzol Reagent (Thermo Fisher Scientific; catalog no. 15596026), and then 200 μL of chloroform was added. After the phase separation, the clear upper aqueous layer containing RNA was admixed 1:1 to 95% ethanol; and then miRNeasy Micro Kit (QIAGEN, catalog no. 217084) was used to purify total RNA. cDNA was obtained using the MultiScribe- Reverse Transcriptase kit (Applied Biosystems by Thermo Fisher Scientific). Real-time PCR was performed in a volume of 20 μL using the Taqman Fast Universal PCR Master Mix (Applied Biosystems), 20 ng of cDNA and specific probes (all from Applied Biosystems, listed in Supplementary Materials and Methods). Values were normalized to Gapdh and analyzed using the ΔCt or ΔΔCt method as indicated. For the detection of miR-29b1, cDNA was obtained using Taqman MicroRNA Reverse Transcription Kit (Applied Biosystems), with a custom RT primer pool consisting in specific primer set for miR-29b1 and U6 snRNA (used as internal control) for analysis of cell lysates, or with a custom RT primer pool consisting of a specific primer set for miR-29b1 and cel-miR-39 (used as internal control) for supernatants. Real-time PCR was performed in a volume of 10 μL using the Taqman Fast Advanced Master Mix (Applied Biosystems). Ten nanograms of cDNA and specific probes for miR-29b1, U6 or cel-miR-39 were all from Applied Biosystems (listed in Supplementary Methods). Values were normalized to internal control and analyzed using the ΔCt or ΔΔCt methods as indicated.
RNA sequencing
Detailed protocols are reported in Supplementary Materials and Methods. RNA-sequencing (RNA-seq) data have been deposited to GEO (RRID:SCR_004584), the accession number is GSE156033. Log2-fold changes and Padj values were generated for each class comparison (Supplementary Table S2).
Functional analyses
We used the functional annotation tool available within DAVID 6.8 (RRID:SCR_001881; https://david.ncifcrf.gov/) to investigate overrepresented biological processes and molecular functions; MetaCore version 19.4 (Clarivate Analytics; RRID:SCR_008125) for network and pathway analysis; and MeV version 4.9.0 for Heatmap representation.
cBioPortal and correlation analyses
Copy-number alteration and mutation data of the Hspa5 gene were analyzed with cBioportal (https://www.cbioportal.org/; refs. 33, 34), comparing data from prostate adenocarcinoma (from The Cancer Genome Atlas, TCGA), metastatic CRPC (from the SU2C/PCF Dream Team data set; ref. 35), and CRPC and NEPC samples (from the Kumar data set; ref. 36).
Median normalized RNA-seq data of the Beltran data set, including 34 CRPC samples and 15 CRPC-NE (NEPC) samples (6), was downloaded from cBioPortal (33, 34) and imported in R software. Spearman correlation between Hspa5 and all other genes was calculated and genes with a positive correlation (spearman coefficient ≥ 0.7; Supplementary Table S3) were used to calculate pathway enrichment through package pathfindR with Reactome database (https://reactome.org/). Among significantly enriched pathways (P < 0.05), we chose those with biological relevance. The average of expression of each gene within each pathway was then correlated with the expression of Hspa5 through Spearman correlation. Spearman correlation was also calculated between Akt1 or Cdk5 and Hspa5.
Statistical analyses and reproducibility
Statistical analyses were performed with the GraphPad Prism8 software (RRID:SCR_005375). For in vitro and ex vivo experiments, histograms report means ± SD of biological replicates, which are represented by dots. We applied one-way ANOVA followed by Tukey tests, two-way ANOVA or Student t test, as indicated. For ethical reasons, the number of animals used for in vivo studies, randomly assigned to different groups, was the minimum necessary to ensure significance of the results. On the basis of previous experience with the model (26), sample size was selected to obtain an effect size of 0.4 with 80% power and 5% error (α = 0.05). We used Fisher test to compare categorical variables indicating the phenotypes of tumor lesions.
In all statistical comparisons, differences were considered significant when P < 0.05, and were indicated as: *, P < 0.05; **, P < 0.01; ***, P < 0.001; ****, P < 0.0001. Numbers and types of replicates are indicated in each figure legend.
Results
Absence of SPARC and castration induce comparable NED
We compared tumors collected from TRAMP and Sparc−/−TRAMP mice of 30 weeks of age to identify linkages between SPARC expression and tumor types. Consistent with the literature (24, 37, 38), the majority of TRAMP mice (11/13 mice, 84.6%) developed multifocal invasive adenocarcinoma, whereas a small fraction (2/13 mice, 15.4%) developed de novo small-cell NE tumors (Fig. 1A and 1B). Adenocarcinoma lesions selectively expressed the luminal marker cytokeratin 8 (CK8), whereas de novo NE lesions selectively expressed NE markers SYP and CgA (Fig. 1C–E; Supplementary Fig. S1A and S1B). Pathologic examination revealed areas of NED within adenocarcinoma in 38.5% of Sparc−/−TRAMP mice (5/13 mice) and 35.7% of TRAMP mice previously castrated at 20 weeks of age (5/14 mice). NED areas were not observed in untreated TRAMP mice (Fig. 1A). Tumor cells in NED areas had large morphology (Fig. 1B) and coexpressed CK8, SYP, and CgA (Fig. 1C–E; Supplementary Fig. S1A and S1B; please refer to Materials and Methods for detailed criteria for tumor lesion classification). In the castrated cohort, we also found mice with CRPC without features of NED (2/14 mice, 14.3%) and mice with tumor regression (5/14 mice, 35.7%). No changes in the frequency of tumors showing features of de novo small-cell NE tumors were observed in comparing TRAMP, castrated TRAMP, or Sparc−/−TRAMP mice (frequency was 15.4%, 14.3% and 15.4%, respectively; Fig. 1A). We concluded that Sparc genetic deficiency mimics NED induced by late-stage castration in TRAMP mice. Castration in Sparc−/−TRAMP mice slighted enhanced the frequency of NED (7/15 mice, 47%) if compared with untreated Sparc−/−TRAMP or castrated TRAMP mice (38.5% and 35.7%, respectively; Fig. 1A), suggesting that additional factors, unrelated to SPARC, might contribute to NED upon castration.
Figure 1.

NED similarly occurs in SPARC-deficient or castrated TRAMP mice. A, Percentage of prostatic lesions scored as adenocarcinoma (ADENO), neuroendocrine differentiation (NED), de novo neuroendocrine (NE), or regression in 30-week-old TRAMP (n = 13), Sparc−/− TRAMP mice (n = 13), TRAMP mice subjected to surgical castration (n = 14), and Sparc−/− TRAMP mice subjected to surgical castration (n = 15). Fisher test: ****, P < 0.0001; *, P < 0.05. B–E, Representative images of prostates of mice affected by adenocarcinoma, NED, or de novo NE. Hematoxylin and eosin (B); immunofluorescence staining for CK8 (green), SYP (red) and DAPI (blue; C); IHC for CgA (D); immunofluorescence staining for CK8 (green), CgA (red), and DAPI (blue; E). F, Representative IHC for SPARC in prostates of TRAMP and castrated TRAMP mice. Red and black arrows highlight stromal and tumor cells, respectively. G, Real-time PCR for Sparc on stromal and luminal cells sorted from the prostates of untreated and castrated TRAMP mice. Histograms depict mean ± SD of biological replicates (indicated by dots, n = 3/group). One-way ANOVA followed by Tukey test: **, P < 0.01. B, D, and F, Top, magnification ×200; bottom, magnification ×400 of the same areas.
IHC on prostates from untreated TRAMP mice revealed mild SPARC expression by tumor cells and a stronger positivity in infiltrating fibroblasts and myeloid elements (Fig. 1F). Notably, SPARC was downregulated in the stromal cell compartment in castrated mice (Fig. 1F). Results were confirmed by relative quantification of Sparc transcript levels on stromal or luminal cells that had been sorted by FACS from the prostates of untreated or castrated TRAMP mice (Fig. 1G; Supplementary Fig. S1C and S1D). Data so far suggest that the absence of SPARC in stromal cells is associated with NED.
SPARC-null stroma induces NED via IL6
To better understand the source and role of SPARC in NED, we cocultured prostate adenocarcinoma cells with SPARC-proficient or -deficient immortalized fibroblasts (Supplementary Fig S1E and S1F) under transwell physical separation. We used two different TRAMP-derived adenocarcinoma cell lines: T1525, a well-differentiated adenocarcinoma that does not express endogenous SPARC, and T23, a poorly differentiated adenocarcinoma (26) that produces and secretes high levels of SPARC (Supplementary Fig. S1E–S1F). In cocultures, SPARC-proficient fibroblasts did not alter tumor cell phenotypes, but tumor cells cocultured with SPARC-deficient fibroblasts acquired Syp and retained Ck8 and Ar expression (Fig. 2A and B). Immunofluorescence confirmed the upregulation of SYP in these cells at the protein level (Fig. 2C–F; Supplementary Fig. S2A and S2B) and the maintained expression of AR (Supplementary Fig. S2C). To better mimic the tumor microenvironment, we cultured adenocarcinoma cells with stromal or myeloid cells isolated from the prostates of TRAMP or Sparc−/−TRAMP mice. T1525 cells increased SYP expression when in the presence of either stromal or myeloid cells from Sparc−/−TRAMP mice (Supplementary Fig. S2D-S4F). These data indicate that SPARC-deficient fibroblasts and myeloid cells can induce NED of prostate adenocarcinoma cells, regardless of whether or not SPARC is produced by the tumor.
Figure 2.

SPARC-deficient fibroblasts mediate NED of adenocarcinoma cells via IL6. A–H, T1525 or T23 prostate adenocarcinoma cell lines were cocultured with wild-type (Fibro) or SPARC-deficient (Fibro Sparc−/−) fibroblasts. Cells were divided by a 0.4-μm pore transwell and analyzed after 7 days of culture. A and B, Real-time PCR for Ar, Syp, and Ck8 on tumor cells. C and D, Representative immunofluorescence for SYP (red) on tumor cells. Blue, DAPI. E and F, Quantification of immunofluorescence in C and D. G, ELISA for IL6 on cell culture supernatants. H, Real-time PCR for Il6 on tumor cells (black bars) or fibroblasts (white bars). A–H, Data are a pool of three independent experiments. Legends indicate the cell type plated on the bottom of the well, and further analyzed, and the cell type plated in the transwell insert is reported in the parentheses. I and J, T1525 (I) or T23 (J) cells were cultured as in A with Sparc−/− fibroblasts, in presence or not of anti-IL6 receptor antibody (αIL6R). SYP (red) was analyzed by immunofluorescence. Blue, DAPI. Experiment was repeated three times. K, Quantification of immunofluorescence in I. L, Quantification of immunofluorescence in L. M, Representative immunofluorescence (red, SYP; blue, DAPI) of T23-derived tumors grown in wild-type (B6) or Sparc−/− mice, treated or not with αIL6R or isotype control as indicated. Experiment was repeated two times, each with three mice/group, with comparable results. One of the two experiments is shown. N, Quantification of immunofluorescence in M. All histograms depict mean ± SD of biological replicates (represented by dots). One-way ANOVA followed by Tukey test: *, P < 0.05; **, P < 0.01; ***, P < 0.001; ****, P < 0.0001.
We tested whether IL6 was produced in our cocultures since (i) loss of SPARC correlates with IL6 production in bladder cancer–associated fibroblasts (39), (ii) IL6 can induce NED (14), and (iii) T1525 and T23 tumor cells express the IL6 receptor (IL6R/CD126) and its coreceptor CD130 (Supplementary Fig. S3A). ELISA detected IL6 in the supernatant of cultures containing SPARC-deficient fibroblasts either alone or with T1525 or T23 cells, but not in cultures containing SPARC-proficient fibroblasts, regardless of the presence of tumor cells (Fig. 2G). Real-time PCR for Il6 transcript levels in fibroblasts and tumor cells, collected separately because of transwell segregation, confirmed that SPARC-deficient fibroblasts were the only source of IL6 (Fig. 2H). In line with published evidence (39), IL6 production correlated with constitutive activation of the canonical and noncanonical NF-κB pathway in SPARC-deficient fibroblasts, detected as an increase in IkBα and p52 here (Supplementary Fig. S3B and S3C).
Retrovirus-mediated Sparc-replacement in Sparc-null fibroblasts strongly reduced Il6 expression (Supplementary Fig. S3D). Conversely, transient Sparc downregulation induced by siRNA resulted in increased Il6 expression in wild-type fibroblasts (Supplementary Fig. S3E). Finally, SYP expression (associated with NED) by T1525 and T23 cells that were co-cultured with SPARC-deficient fibroblasts was abolished when a blocking antibody to IL6R was added to the coculture (Fig. 2I–L; Supplementary Figs. S3F and S4A and S4B). Specificity of the blocking antibody was confirmed in vitro for its capacity to reduce phosphorylation of STAT3 (pSTAT3) in tumor cells stimulated with IL6 (Supplementary Fig. S3G).
We then subcutaneously injected SPARC-proficient T23 adenocarcinoma cells into SPARC-competent or -deficient syngeneic C57BL/6 mice, to determine whether host SPARC expression affected tumor phenotype. We found no apparent effect on growth rate (Supplementary Fig. S5A). Tumors that developed in Sparc−/− hosts acquired SYP expression, and this acquisition was blocked if mice were treated with anti-IL6R antibody (Fig. 2M and N; Supplementary Fig. S5C). Histologically, wild-type C57BL/6 mice developed high-grade tumors, with sarcomatoid (Supplementary Fig. S5B, black arrows) and epithelioid elements (Supplementary Fig. S5B, red arrows). The latter appeared to be replaced by small-sized cells (Supplementary Fig. S5B, cyan arrows) in tumors from Sparc−/− mice, either untreated or treated with isotype control. This phenotypic change was reduced in Sparc−/− mice treated with anti-IL6R antibody whose tumors retained marked epithelioid features (Supplementary Fig. S5B, red arrows). Also, the expression of pSTAT3 was significantly increased in tumors from Sparc−/− mice, in comparison with tumors from wild-type C57BL/6 and anti-IL6R antibody–treated Sparc−/− mice (Supplementary Fig. S5D and S5E). Similarly, tumors generated by RM1, a murine prostate carcinoma not related to the TRAMP mouse (29), acquired SYP expression only when grown in isotype-treated Sparc−/− recipients, and not when the latter were treated with anti-IL6R antibody (Supplementary Fig. S6A and S6B). Histopathology indicated highly undifferentiated and EMT-like features of RM1 tumors grown in wild-type mice. In Sparc−/− mice, RM1 tumors had a contrasting appearance of a syncytial pattern with apoptotic and mitotic figures, compatible with an anaplastic NE phenotype, whereas in Sparc−/− mice treated with anti-IL6R antibody, tumors gained epithelioid features (Supplementary Fig. S6C).
Together, these results show that stroma defective in SPARC expression can promote the adenocarcinoma–NE transition through IL6 release. Because castration induces stromal SPARC downregulation in the prostates of TRAMP mice (Fig. 1F and G), we tested their IL6 production. RNAscope (ACDbio), which enables the analysis of RNA expression on FFPE tissues, detected high Il6 positivity in stromal cells of prostates of castrated TRAMP (Fig. 3A and B) and Sparc−/−TRAMP mice (Supplementary Fig. S6D), and not in untreated TRAMP mice (Fig. 3A and B). Il6-positive stromal cells coexpressed the fibroblast marker PDGFRβ (Supplementary Fig. S6E), and were adjacent to SYP-positive tumor cells (Supplementary Fig. S6F). Real-time PCR on luminal and stromal cells, that had been FACS-sorted from prostates of TRAMP mice, confirmed no Il6 expression in the luminal compartment, and its upregulation in the stroma after castration (Fig. 3C). Both luminal and stromal cells of TRAMP mice, either castrated or not, expressed IL6R (Fig. 3D; Supplementary Fig. S6G). Consistently, anti-IL6R antibody reduced the frequency of NED in castrated TRAMP mice (16.7% of anti-IL6R treated vs. 35.7% of untreated castrated mice; Fig. 3E; Supplementary Fig. S6H). These data support the proposal that castration-induced downregulation of SPARC expression in tumor-infiltrating stromal cells is responsible for their secretion of IL6, the final mediator of NED.
Figure 3.

Blocking IL6R inhibits NED in castrated TRAMP mice. A, Representative pictures showing Il6 evaluation by RNAscope on prostate tissues of TRAMP and castrated TRAMP mice. Black arrows, positive cells. Top, magnification, ×200; bottom, magnification, ×400 of the same areas. B, Quantification of staining in A and in Supplementary Fig. S6D. Histogram depicts mean ± SD of biological replicates (represented by dots; n = 4/group). ANOVA followed by Tukey test: ****, P < 0.0001. C, Real-time PCR for Il6 on stromal and luminal cells sorted from the prostates of untreated and castrated TRAMP mice. Histogram depicts mean ± SD of biological replicates (represented by dots; n = 3/group). ANOVA followed by Tukey test: **, P < 0.01. D, Flow cytometry evaluation of IL6R (CD126) and CD130 on stromal and luminal cells in prostates of TRAMP and castrated TRAMP mice. E, Relative percentage of prostatic lesions, scored as in Fig. 1, in 30 weeks old TRAMP mice subjected to surgical castration at 20 weeks of age and left untreated (n = 14; the same cohort reported in Fig. 1A) or treated weekly with αIL6R (n = 12). Fisher test: *, P < 0.05.
Tumor cells trigger stromal SPARC downregulation
We wanted to identify the mechanism that causes stromal SPARC downregulation in response to castration (Fig. 4A–E; Supplementary Fig. S7A–S7I). Fibroblasts and immune cells infiltrating prostate cancer and fibroblasts used in our in vitro experiments express AR (Supplementary Fig. S7A and S7B; ref. 40). However, in vitro treatment with the AR inhibitor enzalutamide or coculture with tumor cells alone did not alter SPARC levels in wild-type fibroblasts. Notably, in culture conditions combining tumor cells, fibroblasts and enzalutamide, fibroblasts downregulated SPARC (Fig. 4A–C), and upregulated IL6 (Fig. 4D and E). This suggested a tumor–stroma cross-talk, activated by AR inhibition, as responsible for SPARC downregulation and consequent IL6 production by stroma. Both steps are necessary to induce NED in tumor cells. According to this hypothesis, T23 cells did not acquire the expression of the NE markers SYP and CgA after treatment with enzalutamide, unless wild-type fibroblasts (Supplementary Fig. S8A–S8D) or exogenous IL6 (Supplementary Fig. S9A–S9D) were also added in the culture. Notably, IL6 alone was sufficient to induce upregulation of NE markers, albeit at a lower extent (Supplementary Fig S9A–S9D). T23 cells did not autonomously produce Il6 upon enzalutamide treatment (Supplementary Fig S9E), highlighting the need of fibroblasts as a source of IL6 in our model.
Figure 4.

Interaction with tumor cells causes SPARC downregulation in fibroblasts. Fibroblasts were cocultured in 0.4-μm pore transwell system with T1525 or T23 cells (indicated in parentheses) and treated or not with enzalutamide (ENZA). A and B, After 48 hours, we measured SPARC expression in fibroblasts by real-time PCR (A) and Western blot analysis (B). C, Quantification of B. D and E, The Western blot analysis was validated twice. We also measured Il6 transcript in fibroblasts (D) and protein by ELISA on culture supernatants collected after 72 hours (E). A, D, and E, Data are a pool of three independent experiments. In all panels, histograms depict mean ± SD of biological replicates (represented by dots). One-way ANOVA followed by Tukey test or two-tailed Student t test: *, P < 0.05; **, P < 0.01; ***, P < 0.001; ****, P < 0.0001.
The expression of SPARC can be dampened by miR-29b, which targets the Sparc transcript (41). Notably, miR-29b can be upregulated through the activation of the Wnt/β-catenin pathway (42), which is often altered in prostate cancer and associated with castration resistance (43). Moreover, RNA-seq data on paired prostate cancer samples collected from patients before and after ADT showed upregulation of the Wnt/β-catenin pathway in response to treatment (44). Both T1525 and T23 cells treated with enzalutamide upregulated β-catenin (Supplementary Fig S7C–S7E) and miR-29b1 (Fig. 5A), which was also released into their supernatants (Supplementary Fig. S7F). In these supernatants, miR-29b1 was encapsulated in exosomes (Fig. 5B; Supplementary Fig. S7G). The same supernatants caused SPARC downregulation in fibroblasts, but not if fibroblasts were pretransfected with an anti-miRNA specific for miR-29b (Fig. 5C–E). Furthermore, we found that intracellular levels of miR-29b1 increased in fibroblasts incubated with supernatants from T23 cells treated with enzalutamide. Previous transfection of T23 cells with an anti-miRNA specific for miR-29b abolished this effect (Fig. 5F; Supplementary Fig. S7H). These data indicate T23 cells can release miR-29b encapsulated in exosomes; miR-29b is then transferred to fibroblasts. The specificity of miR-29b for Sparc in fibroblasts was confirmed by transfecting them with a vector containing two luciferase reporter genes followed by the 3′UTR region of Sparc, in presence or absence of miRNA mimic specific for miR29b 3p or miR29b 5p. The mimic specific for miR29b 3p reduced luciferase activity, confirming its targeting Sparc expression in fibroblasts (Fig. 5G).
Figure 5.

miR29b upregulation by enzalutamide-treated tumor cells causes SPARC downregulation in fibroblasts. A, Real-time PCR for miR29b1 in T1525 or T23 cells, treated or not with enzalutamide (ENZA) for 24 hours. B, Real-time PCR for miR29b1 in exosomes isolated from supernatants of T23 cells, treated as in A. Experiment was repeated twice. C–E, Fibroblasts were incubated for 48 hours with supernatants (ratio 1:1 with fresh DMEM) collected from either untreated or enzalutamide-treated T1525 cells (as shown in parentheses). Where indicated, we previously transfected fibroblasts with an anti-miRNA specific for miR-29b (anti-miR-29b), or with an unspecific sequence as negative control (scramble). We measured SPARC by real-time PCR (C) or Western blot analysis (D and E). Vinculin was used as internal control. The Western blot was validated twice. F, Fibroblasts were incubated with supernatants of enzalutamide–treated T23 cells that had been transfected with a negative control (scramble) or with anti-miR specific for miR29b. Histogram shows real-time PCR for miR29b1 in recipient fibroblasts. G, Histogram shows luciferase activity of fibroblasts that were transfected with a vector containing two luciferase reporter genes, followed by the 3′UTR region of Sparc. Transfection was made in presence or not of miRNA mimic specific for miR29b 3p or miR29b 5p. A–C, F, and G, Data are a pool of two independent experiments. H, Real-time PCR for miR29b1 on stromal and luminal cells sorted from the prostates of untreated and castrated TRAMP mice (n = 3 biological replicates/group). I, Representative pictures showing miR29b1 evaluation by BaseScope on prostate tissues of TRAMP and castrated TRAMP mice. Black arrows, positive cells. J, Quantification of staining in H (n = 4/group). In all panels, histograms depict mean ± SD of biological replicates (represented by dots). One-way ANOVA followed by Tukey test or two-tailed Student t test: *, P < 0.05; **, P < 0.01; ***, P < 0.001; ****, P < 0.0001.
We confirmed the upregulation of β-catenin (Supplementary Fig. S7I) and miR-29b1 (Fig. 5H) in luminal cells FACS sorted from the prostates of castrated TRAMP mice versus noncastrated controls. We also confirmed miR-29b1 upregulation in tumor cells in FFPE prostate samples of castrated TRAMP mice, utilizing the BASEscope Assay (ACDBio; Fig. 5I and J). A plausible explanation for these results is that inhibition of AR signaling leads to activation of the β-catenin pathway that upregulates miR-29b in tumor cells. miR-29b is then transferred in neighboring stromal cells, in which it causes downregulation of SPARC; this event consequently induces IL6 production, leading to NED of tumor cells.
Drug to GRP78 blocks SPARC downregulation and NED
β-catenin signaling can be promoted by GRP78 (45), a protein involved in the unfolded protein response and regulation of cancer cell survival (46). GRP78 is also upregulated in prostate cancer in correlation with CRPC (47) and NE features (48). We found increased levels of GRP78 in luminal cells of castrated TRAMP mice (Fig. 6A–C; Supplementary Fig. S10A) and in T1525 or T23 cells treated with enzalutamide (Fig. 6D and E; Supplementary Fig. S10B and S10C). Fibroblasts expressed only low levels of GRP78, not further increased by enzalutamide (Supplementary Fig. S11A and S11B).
Figure 6.

GRP78 inhibition reduces NED in castrated TRAMP mice. A, Representative immunofluorescence for GRP78 (red), CK8 (green), and DAPI (blue) on prostate tissues of TRAMP and castrated TRAMP mice. Top, magnification, ×200; bottom, magnification, ×400 of the same areas. B, Quantification of staining in A. Dots indicate biological replicates (n = 3/group). C, Real-time PCR for Hspa5 (GRP78) on luminal cells sorted from the prostates of untreated and castrated TRAMP mice. Dots indicate biological replicates (n = 3/group). D, Representative immunofluorescence for GRP78 (red) in T1525 or T23 tumor cells treated for 24 hours with enzalutamide (ENZA). Blue, DAPI. E, Quantification of staining in D. F, Real-time PCR for miR29b1 in T1525 or T23 cells, treated with enzalutamide (ISO) isoliquiritigenin, or their combination for 24 hours. G, Real-time PCR for Sparc on fibroblasts cocultured with T23 cells (indicated in parentheses) and treated with enzalutamide, isoliquiritigenin, or their combination. Cells were analyzed after 48 hours of culture. H, Western blot analysis for SPARC in fibroblasts treated as in G. Vinculin was used as internal control. The Western blot was validated twice. I, Quantification of G. J, T23 cells were cocultured in transwell system with fibroblasts (fibro, indicated in brackets) as in Fig. 2, also adding enzalutamide, isoliquiritigenin, or their combination. Pictures show representative immunofluorescence for SYP (red) on tumor cells. Blue, DAPI. K, Quantification of staining in J. F, G, and K, Data are a pool of at least two independent experiments. L, Relative percentage of prostatic lesions, scored as in Fig. 1, in 30-week-old TRAMP mice subjected to surgical castration at 20 weeks of age and left untreated (n = 14; the same cohort reported in Fig. 1A) or treated weekly with isoliquiritigenin (n = 13). Fisher test: ***, P < 0.001. M, Quantification of staining in N. Biological replicates are indicated by dots (n = 4/group). N, Representative IHC for SPARC on prostate of untreated TRAMP and castrated TRAMP mice, either untreated or not with ISO. Red arrows, stromal cells. In all panels, histograms depict mean ± SD of biological replicates (represented by dots). ANOVA followed by Tukey test: *, P < 0.05; **, P < 0.01; ***, P < 0.001; ****, P < 0.0001.
We hypothesized that the upregulation of GRP78 in tumor cells in response to enzalutamide induces the production of miR-29b, through stimulation of β-catenin activity. Therefore, blocking GPR78 could prevent the pathway, here described, that leads to NED. We then tested the efficacy of isoliquiritigenin, a natural compound that inhibits the activity of GRP78 in stimulating the β-catenin pathway (45). Expression of miR-29b1 in enzalutamide-treated T1525 and T23 tumor cells was reduced by cotreatment with isoliquiritigenin (Fig. 6F). We found a significant reduction of miR-29b production and secretion also in enzalutamide-treated T23 cells transfected with a siRNA specific for Hspa5, encoding GRP78, or cotreated with HA15, a specific chemical inhibitor of GRP78 (Supplementary Fig. S11C and S11D). Furthermore, Sparc downregulation that occurred in fibroblasts cultured with tumor cells in the presence of enzalutamide was inhibited by the addition of isoliquiritigenin (Fig. 6G–I).
As shown above (Supplementary Fig. S8), tumor cells cultured with enzalutamide expressed SYP and CgA only when fibroblasts were present in the culture, indicating that NED of adenocarcinoma cells required tumor–stroma cross-talk. The inhibition of GRP78 activity with isoliquiritigenin prevented SYP upregulation in tumor cells in this setting (Fig. 6J and K; Supplementary Figs. S11E–S11G and S12A–S12D). As a final proof of our proposed mechanism, NED was reduced in castrated TRAMP mice treated with isoliquiritigenin (1/13 mice with isoliquiritigenin vs. 5/14 untreated mice; Fig. 6L; Supplementary Fig. S11H). Notably, IHC on prostate sections and real-time PCR on FACS-sorted cells showed that castrated mice treated with isoliquiritigenin did not down modulate stromal SPARC (Fig. 6M and N; Supplementary Fig. S11I).
In summary, these results indicate that ADT upregulates GRP78 expression, which triggers miR-29b upregulation and tumor–stroma cross-talk, leading to downmodulation of stromal SPARC to mediate NED of prostate cancer cells (Graphical Abstract).
To gain further molecular insights on NED occurring via cross-talk with stroma cells we performed RNA-seq on T23 adenocarcinoma cells, in different coculture conditions, as for Figs. 2I–L or 6J and K. When cultured with Sparc−/− fibroblasts, T23 cells upregulated genes involved in the IL6 pathway, in pathways related to NEPC [i.e., HIF1 (12), WNT (13), IGF (49)] and to NE tumors in general, as HGF receptor (50). In the same condition, T23 cells downregulated genes related to AR and Notch signaling, the latter needed downregulation to promote NED (51; Supplementary Fig. S13A; Supplementary Table S2). Similarly, when cultured with wild-type fibroblasts and enzalutamide T23 cells upregulated genes related to IL6, β-catenin, tumor–stroma interaction and neurogenesis, and known pathways related to NEPC such as EZH2 (8) and sonic hedgehog (52), whereas they downregulated genes related to Notch and YAP–TAZ pathway (Supplementary Fig. 13A; Supplementary Table S2). Indeed, it is known that AR and YAP can colocalize in the nucleus of tumor cells and downregulation of YAP results in downregulation of AR target genes (53). Adding isoliquiritigenin to the culture between T23 and wild-type fibroblasts, in the presence of enzalutamide, reverted most of the enzalutamide effects, causing, in T23 cells, the upregulation of transcription targets of AR and the downregulation of NE-related pathways, such as HIF1, IGF, hedgehog, and pathways related to general neurogenesis (Supplementary Fig. S13B and Supplementary Table S2). Results indicate that blocking GRP78 activity with isoliquiritigenin can restrain, at least in part, the NED program triggered by the interaction between tumor and stroma in response to enzalutamide.
GRP78 correlates with NED in human prostate cancer
We replicated our in vitro experiments with mouse cells with the human cell lines LNCaP and WPMY-1, which are representative of prostate cancer and prostate stroma, respectively. As predicted by our mouse studies, enzalutamide caused the upregulation of GRP78, β-catenin, and miR-29b1, but not of IL6 in LNCaP cells (Fig. 7A–E; Supplementary Fig. S14A and S14B). GRP78 expression in human fibroblasts was negligible and unaffected by enzalutamide (Supplementary Fig. S14C and S14D). Addition of enzalutamide to cocultures of the two human cell lines caused SPARC downregulation in WPMY-1 cells (Fig. 7F–H) and upregulation of the NE markers CgA and Eno2 in LNCaP cells (Fig. 7I; Supplementary S14E and S14F). In LNCaP cells cultured alone, upregulation of CgA and SYP was caused by stimulation with exogenous IL6, and further increased by concomitant addiction of enzalutamide (Supplementary Fig. S15A–S15D). Finally, in cocultures in the presence of enzalutamide, isoliquiritigenin increased SPARC expression in fibroblasts (Fig. 7F–H) and decreased CgA and Eno2 expression in tumor cells (Fig. 7I; Supplementary S14E and S14F), confirming the role of GRP78 in driving NED in LNCaP cells.
Figure 7.

The tumor-GRP78/stroma–SPARC network in human NE prostate cancer. A, Representative immunofluorescence for GRP78 (red) in LNCaP tumor cells treated for 24 hours with enzalutamide (ENZA). Blue, DAPI. B, Quantification of staining in A, Experiment was repeated two times. C and D, Real-time PCR for β-catenin (Ctnbb1 gene; D) and miR29b1 (E) in LNCaP cells treated with enzalutamide for 8 or 24 hours, respectively. E, ELISA for IL6 in LNCaP cells treated for 24 hours with enzalutamide, alone or in coculture with human prostatic fibroblasts (the WPMY-1 cell line, indicated as Human Fibro). F, Real-time PCR for Sparc in human fibro cocultured or not with LNCaP cells (indicated in parentheses) and treated with enzalutamide, isoliquiritigenin, or their combination. Cells were analyzed after 48 hours of culture. G, Western blot analysis for SPARC in human fibro cultured as in F. Vinculin was used as internal control. The Western blot was validated twice. H, Quantification of G. I, Real-time PCR for Cga or Eno2 on LNCaP cells cocultured or not with human fibro (indicated in brackets) and treated with enzalutamide, isoliquiritigenin, or their combination. Cells were analyzed after 48 hours of culture. F and I, Data are a pool of three independent experiments. In all panels, histograms depict mean ± SD of biological replicates (represented by dots). Two-tailed Student t test or one-way ANOVA followed by Tukey test: *, P < 0.05; **, P < 0.01; ***, P < 0.001; ****, P < 0.0001. J, Mutation burden for Hspa5 gene (encoding for GRP78) in human prostate cancer, obtained on cBioportal analyzing data from the Kumar data set (NEPC and CRPC; ref. 36), the SU2C/PCF Dream Team data set of CRPC (35), and the TCGA. K, Spearman correlation between transcript levels of Hspa5 and Akt1 or Cdk5 in the Beltran data set of NEPC (6).
To add translational relevance to our data, we interrogated publicly available data sets of patients with prostate cancer through the cBioPortal tool (33, 34). Copy-number alterations and mutation data were available for the Kumar data set (36), which included 156 CRPC and 20 NEPC samples, however, with no available clinical information to distinguish the two subtypes. Nevertheless, in this data set, we found an increased frequency of mutations in Hspa5 (the gene encoding for GRP78) in comparison with data sets including only patients with CRPC (SU2C/PCF data set, ref. 35) or patients with primary adenocarcinoma (TCGA). Furthermore, we found that Hspa5 is strongly amplified in patients with CRPC/NEPC (Fig. 7J). We then focused on the Beltran data set of NEPC (6), finding an increase, albeit not statistically significant, of mRNA levels of Hspa5 in patients with NEPC compared with CRPC (Supplementary Fig. S16A). In this data set, we further analyzed genes correlated with Hspa5 mRNA expression (Supplementary Table S3), finding its positive correlation with two genes, Akt1 and Cdk5, involved in the NED-promoting activity mediated by MYCN (Fig. 7K; refs. 8, 54), and with pathways related to FOXO transcription factors, AURKA, DNA damage response, and downregulation of cyclin D1 and of Notch signaling, all hallmarks of NEPC (6, 12, 51, 55, 56; Supplementary Fig. S16B and S16C). These analyses further highlight GRP78 as a possible therapeutic target to prevent NED of prostate cancer.
SPARC downregulation relates to NED in patients
Additional translational relevance of our results comes from the analysis of paired FFPE specimens from prostate core biopsies (pre-ADT) and radical prostatectomies (post-ADT) of eight patients with prostate cancer (Pt) who underwent neoadjuvant ADT (Fig. 8). We also analyzed prostatectomies from six patients with untreated prostate cancer (Supplementary Fig. S17A and S17B). All patients had comparable Gleason scores (Gleason grade group 2 or 3; Supplementary Fig. S18A). Immunofluorescence revealed low-to-intermediate levels of GRP78 in tumor cells in untreated patients (UntrPt; Supplementary Figs. S17A, S18B, S19A and S19B, S20A and S20B) and in pre-ADT core biopsies (Fig. 8A; Supplementary Figs. S18B and S19A and S19B). GRP78 was upregulated in the majority of prostates collected after ADT, excluding Pt#5 and Pt#14 (Fig. 8B; Supplementary Figs. S18B and S19C and S19D). Conversely, SPARC was highly expressed by tumor and stroma cells in prostatectomies from untreated patients (Supplementary Figs. S17B, S18B, and S18C) and in core biopsies pre-ADT, except for Pt#14 (Fig. 8A; Supplementary Fig. S18B and S18C), and variably downmodulated in all patients after ADT (Fig. 8B; Supplementary Fig. S18B and S18C). Besides digital quantification (Supplementary Fig. S18B), examination by board-certified pathologists identified differences between the expression of SPARC in tumor and stroma with the latter being the primary source of SPARC in the cross-talk we are describing. They assigned empirical scores (0–3) for distinct SPARC expression in stroma and tumor cells (Supplementary Fig. S18C). This enabled us to quantify the evidence in the IHC images (Fig. 8A and B) that showed that all patients downmodulated SPARC in stroma cells after ADT, except Pt#5 and Pt#14. Notably, in these two patients the levels of GRP78 had not increased after ADT (Fig. 8A; Supplementary Fig. S18B and S19), in line with its presumed upstream role in the network regulating SPARC downregulation.
Figure 8.

Stromal SPARC loss after ADT correlates with NED in patients with human prostate cancer. Immunofluorescence for GRP78 (red) and DAPI (blue), hematoxylin and eosin (H&E) staining, and IHC for SPARC, CgA, SYP, and AR in biopsies collected pretreatment (A) and in prostatectomies obtained post-treatment (B) from patients with prostate cancer undergoing neoadjuvant ADT. Except for hematoxylin and eosin staining (provided at ×200 magnification only), for each staining we provide both ×200 magnification (top) and ×400 magnification of the same area (bottom).
We further used IHC to evaluate the expression of AR, SYP, and CgA on prostatectomies. All patients' tumor samples showed mild to high AR staining, except for Pt#3, UntrPt#7, and UntrPt#8. All specimens from control untreated patients and prostatectomies collected after ADT from Pt#1, Pt#3, Pt#5, and Pt#14 showed no expression of the NE markers SYP and CgA in tumor cells. Curiously, Pt#5 showed SYP positivity in stromal but not tumor cells. Tumor cells in Pt#4 and Pt#13 showed mild SYP and CgA upregulation only in a few scattered cells. On the contrary, in Pt#2 and Pt#6, we found a mild to moderate staining for SYP and a strong positivity for CgA in tumor cells and only in the areas showing stromal SPARC downregulation (Fig. 8B; Supplementary Figs. S17B and S18B). Results demonstrated that stromal SPARC downregulation in tumor microenvironment occurs also in patients with prostate cancer after ADT (in 6/8 patients, 75%), and that this event correlated with focal NED of adenocarcinoma cells. Indeed, we detected clear positivity of NE markers in 2 of 6 patients that modulated GRP78 and SPARC (corresponding to 33% of them, and to 25% of the total of 8 patients analyzed). Two additional patients showed scattered upregulation of NE markers in correlation with stromal SPARC loss. These results confirm the correlation between tumor GRP78 gain, stroma SPARC downregulation and NED, following ADT, in human patients and support the translational relevance of the mechanism we here detailed. Results cannot exclude the existence of additional microenvironment-related mechanisms, to be further investigated, that can drive or prevent NED.
Discussion
NED of CRPC occurs as a mechanism of resistance to ADT/ARPI and remains an obstacle to effective therapies. Cellular plasticity permits NED with the complicity of tumor microenvironment that provides the necessary paracrine factors (13, 15, 16). Nevertheless, the molecular pathways activated by ADT that induce stromal cells to release NED-promoting molecules are undefined. Here, we unveil that castration triggers a tumor–stroma cross-talk, leading to stromal SPARC downregulation, that we found to be a crucial step for NED of prostate cancer cells (Graphical Abstract).
Either genetic inactivation of Sparc or its castration-induced downregulation led to increased occurrence of NED within adenocarcinoma in TRAMP mice, but the frequency of tumors with features mirroring de novo small-cell NEPC remained unaltered. The cellular origin of de novo NEPC is still debated (37, 57) and out of the scope of this manuscript. On the contrary, it is widely accepted that NED of prostate adenocarcinoma results from a process of lineage plasticity triggered by ADT/ARPI (6, 7, 13). The final outcome of such plasticity is associated with the loss of AR expression and AR-related transcriptional activity but the gain of NE features. However, the timing and molecular steps of this transition are not well understood (30). “Hybrid tumors” expressing AR (and related genes) and NE markers, as well as “double negative” tumors, can be different transition steps of this process (30). Notably, it has recently been shown that patients with treatment-related NEPC have low expression of AR-regulated genes despite nuclear AR positivity (5). Similarly, in our small set of patients, we found expression of NE markers in post-ADT samples in the presence of nuclear AR staining. Also, in our system, prostate cancer cells upregulated NE markers and downregulated AR-target genes despite persistent AR expression when cultured with fibroblasts.
The molecular steps leading to NED detailed here reinforce the fundamental role of stromal accessory cells in modulating tumor cell plasticity in response to therapy. We show that SPARC produced by stromal cells needs to be downregulated to allow NED of tumor cells, and we excluded any contribution of SPARC released by tumor cells in this process. This suggests that SPARC may have intracellular functions, not yet described, in regulating the production of cytokines in response to external signals. It was recently described that, in the cytoplasm of colorectal cancer cells, physical interaction between SPARC and GRP78 results in increased apoptosis in response to endoplasmic reticulum stress (58). Our data point out an inverse correlation between these two players when expressed on different cells within the tumor microenvironment. Indeed, we show that upregulation of GRP78 in tumor cells is the first step of a network that leads to downregulation of SPARC in stromal cells and consequent IL6 release. The fine mechanism that explains how SPARC can limit IL6 production remains elusive and will be investigated in future studies. Consistent with published data (39), we found a constitutive, mild upregulation of the NF-κB pathway, which promotes IL6 production, in Sparc−/− fibroblasts. Being SPARC a chaperone protein, it could be conceivable that it could sequester members of the NF-κB pathway, preventing its activation. An alternative explanation could be that intracellular SPARC could influence the expression of AR, which in cancer-associated fibroblasts actively represses the transcription of key effector genes, including Il6 (59). In support of this second hypothesis, we found that AR was downregulated in Sparc−/− fibroblasts.
The molecular findings that we detailed here in preclinical models are corroborated by in silico analyses of human data sets, showing that the Hspa5 gene, encoding for GRP78, positively correlates with genes involved in key pathways related to NED. The role of the gain of GRP78 expression and loss of stromal-SPARC expression in driving NED was further validated analyzing tumor tissues of patients collected before and after ADT. Despite the shortness of the cell exposure to the ADT in the neoadjuvant setting, we detected evidence of NED in two of them (corresponding to 25% of total patients and the 33% of those who downregulated SPARC). Although we analyzed only a few cases, this frequency is in the range of those reported in the literature for treatment-related NEPC (5, 60). The relatively low number of tissues that we collected post-ADT is due to the common clinical practice in Italy that spares patients with advanced/metastatic prostate cancer from biopsies, in favor of noninvasive imaging techniques for follow-up. As ARPI in neoadjuvant settings is now being tested in clinical trials (61), our data indicate that evaluating NED as a possible drawback of these treatments could be informative and could provide a rationale for Italian physicians to collect biopsies from metastatic sites in patients at risk of NED to facilitate diagnosis and inform therapy.
Although the role of IL6 in cellular plasticity and NED in prostate cancer is established (13), clinical trials attempting to modulate the IL6 signaling pathway have not shown significant efficacy in CRPC (62). Our data suggest the possibility of future testing of SPARC downregulation in stromal cells in patients with CRPC who relapse after ADT, as a biomarker to identify patients who are likely undergoing NED and who could benefit from anti-IL6 therapy in combination with ARPI.
A different, conceivable, therapeutic approach could include the concomitant use of GRP78 inhibitors and ADT/ARPI. This is based on our demonstration that (i) GRP78 is a triggering factor of the newly identified cross-talk between tumor and stromal cells that is activated in response to ADT and (ii) pharmacologic targeting of GRP78 with isoliquiritigenin prevents NED in castrated TRAMP mice. We show that inhibition of GRP78 prevents the production of miR-29b in enzalutamide-treated tumor cells, and consequently SPARC downregulation in fibroblasts. We hypothesize that that GRP78 could promote the expression of miR-29b by fostering the expression/activity of β-catenin, because (i) miR-29b expression can be promoted by the β-catenin pathway (42) and (ii) isoliquiritigenin can prevent the binding of GRP78 to β-catenin, which consequently is no more protected from proteasome degradation (45).
Isoliquiritigenin showed in vitro activity against prostate cancer cells (63), but it has not been tested relative to NED nor tested in patients with cancer to date. Several other drugs that block GRP78 are under preclinical or clinical evaluation (46). The MAb159 antibody against cell-surface GRP78 demonstrated anti-tumor activity in the PTEN-null mouse model of prostate cancer, and the PAT-SM6 antibody is being clinically tested in patients with multiple myeloma. The ruthenium-based drug, NKP-1339, against GRP78 was tested in phase I with different solid tumors, but prostate, and showed a manageable safety profile but limited antitumor activity (46), which might suggest that it should be further tested in combination therapies.
In conclusion, we have unveiled tumor–stroma cross-talk that is triggered by ADT that is responsible for the adenocarcinoma–NE transition in prostate cancer. Additive/alternative mechanisms of NED might coexist, as suggested by our in vivo data showing further increase of NED in SPARC-deficient TRAMP mice subjected to castration, and in vitro data showing that NED caused by administration of exogenous IL6 to tumor cells was slightly increased by coadministration of enzalutamide. These mechanisms could be cell autonomous or mediated by microenvironment signals. Because only roughly one third of mice and patients that/who experience downregulation of stromal-derived SPARC have evidence of NED, we also hypothesize that other mechanisms exist that can counteract NED or have different threshold levels that enable the activation of pathways described in this article. Inter- and intrapatient heterogeneity of tumors and stroma may be based in different pathways toward NED and should be considered when translating our results to the clinic.
Authors' Disclosures
C. Enriquez reports personal fees from Associazione Italiana per la Ricerca sul Cancro during the conduct of the study. R. Sulsenti reports other support from Ministero della Salute (Italian Ministry of Health) during the conduct of the study. M. Milani reports other support from AIRC during the conduct of the study. M.P. Colombo reports grants from Italian Association for Cancer Research (AIRC) and other support from Italian Ministry of Health during the conduct of the study. E. Jachetti reports grants from Ministero della Salute (Italian Ministry of Health) and grants from Fondazione Cariplo (Cariplo Foundation, Italy) during the conduct of the study. No disclosures were reported by the other authors.
Supplementary Material
the file includes supplementary material and methods and 20 supplementary figures
list of antibodies used in the paper
RNAseq in T23 cells list of differentially expressed genes
genes positively correlated to Hspa5 in the Beltran data set
uncropped western blot gels
Acknowledgments
This work was supported by Grants from Associazione Italiana per la Ricerca sul Cancro (AIRC; Investigator Grant 18425 and 24363 to M.P. Colombo; three-year fellowship to C. Enriquez), Fondazione Italo Monzino (to M.P. Colombo), Fondazione Cariplo (2018–0213 to E. Jachetti), and Italian Ministry of Health (GR-2016–02362484 to E. Jachetti). The authors thank Fondazione IRCCS Istituto Nazionale dei Tumori: Ivano Arioli, Enrico Fontanella and Giovanna Talarico for technical assistance and logistics, Gabriella Abolafio for cell sorting, Ester Grande for administrative assistance, Nadia Zaffaroni for provision of human commercial stroma cell lines, and Marilena V. Iorio and Orazio Fortunato for helpful discussion. We acknowledge Chiara Villa and Emanuele Canonico from the Cell Sorting Facility of San Raffaele Scientific Institute. The authors thank Peter Wettstein for English revision of the manuscript. R. Sulsenti is a PhD student registered with the Open University, Milton Keynes, United Kingdom. This work has been done to fulfill, in part, requirements for the PhD thesis of C. Enriquez. E. Berrino was the recipient of a PhD fellowship under the funding of Dipartimenti di Eccellenza 2018–2022 (Project no. D15D18000410001).
The publication costs of this article were defrayed in part by the payment of publication fees. Therefore, and solely to indicate this fact, this article is hereby marked “advertisement” in accordance with 18 USC section 1734.
Footnotes
Note: Supplementary data for this article are available at Cancer Research Online (http://cancerres.aacrjournals.org/).
Authors' Contributions
C. Enriquez: Conceptualization, investigation, methodology, writing–original draft. V. Cancila: Investigation, methodology, writing–original draft. R. Ferri: Investigation, methodology. R. Sulsenti: Investigation, methodology. I. Fischetti: Investigation. M. Milani: Investigation, methodology. P. Ostano: Investigation, methodology. I. Gregnanin: Investigation, methodology. M. Mello-Grand: Investigation, methodology. E. Berrino: Investigation, methodology. M. Bregni: Resources. G. Renne: Resources, investigation, writing–original draft. C. Tripodo: Investigation, writing–original draft. M.P. Colombo: Conceptualization, supervision, funding acquisition, writing–original draft. E. Jachetti: Conceptualization, supervision, funding acquisition, investigation, methodology, writing–original draft.
References
- 1. Siegel RL, Miller KD, Jemal A. Cancer statistics, 2019. CA Cancer J Clin 2019;69:7–34. [DOI] [PubMed] [Google Scholar]
- 2. Drake CG, Sharma P, Gerritsen W. Metastatic castration-resistant prostate cancer: new therapies, novel combination strategies and implications for immunotherapy. Oncogene 2014;33:5053–64. [DOI] [PMC free article] [PubMed] [Google Scholar]
- 3. Beltran H, Tomlins S, Aparicio A, Arora V, Rickman D, Ayala G, et al. Aggressive variants of castration-resistant prostate cancer. Clin Cancer Res 2014;20:2846–50. [DOI] [PMC free article] [PubMed] [Google Scholar]
- 4. Chedgy EC, Vandekerkhove G, Herberts C, Annala M, Donoghue AJ, Sigouros M, et al. Biallelic tumour suppressor loss and DNA repair defects in de novo small-cell prostate carcinoma. J Pathol 2018;246:244–53. [DOI] [PubMed] [Google Scholar]
- 5. Aggarwal R, Huang J, Alumkal JJ, Zhang L, Feng FY, Thomas GV, et al. Clinical and genomic characterization of treatment-emergent small-cell neuroendocrine prostate cancer: a multi-institutional prospective study. J Clin Oncol 2018;36:2492–503. [DOI] [PMC free article] [PubMed] [Google Scholar]
- 6. Beltran H, Prandi D, Mosquera JM, Benelli M, Puca L, Cyrta J, et al. Divergent clonal evolution of castration-resistant neuroendocrine prostate cancer. Nat Med 2016;22:298–305. [DOI] [PMC free article] [PubMed] [Google Scholar]
- 7. Zou M, Toivanen R, Mitrofanova A, Floch N, Hayati S, Sun Y, et al. Transdifferentiation as a mechanism of treatment resistance in a mouse model of castration-resistant prostate cancer. Cancer Discov 2017;7:736–49. [DOI] [PMC free article] [PubMed] [Google Scholar]
- 8. Dardenne E, Beltran H, Benelli M, Gayvert K, Berger A, Puca L, et al. N-Myc induces an EZH2-mediated transcriptional program driving neuroendocrine prostate cancer. Cancer Cell 2016;30:563–77. [DOI] [PMC free article] [PubMed] [Google Scholar]
- 9. Flores-Morales A, Bergmann TB, Lavallee C, Batth TS, Lin D, Lerdrup M, et al. Proteogenomic characterization of patient-derived xenografts highlights the role of REST in neuroendocrine differentiation of castration-resistant prostate cancer. Clin Cancer Res 2019;25:595–608. [DOI] [PubMed] [Google Scholar]
- 10. Bishop JL, Thaper D, Vahid S, Davies A, Ketola K, Kuruma H, et al. The master neural transcription factor BRN2 is an androgen receptor-suppressed driver of neuroendocrine differentiation in prostate cancer. Cancer Discov 2017;7:54–71. [DOI] [PubMed] [Google Scholar]
- 11. Akamatsu S, Wyatt AW, Lin D, Lysakowski S, Zhang F, Kim S, et al. The placental gene PEG10 promotes progression of neuroendocrine prostate cancer. Cell Rep 2015;12:922–36. [DOI] [PubMed] [Google Scholar]
- 12. Qi J, Nakayama K, Cardiff RD, Borowsky AD, Kaul K, Williams R, et al. Siah2-dependent concerted activity of HIF and FoxA2 regulates formation of neuroendocrine phenotype and neuroendocrine prostate tumors. Cancer Cell 2010;18:23–38. [DOI] [PMC free article] [PubMed] [Google Scholar]
- 13. Davies AH, Beltran H, Zoubeidi A. Cellular plasticity and the neuroendocrine phenotype in prostate cancer. Nat Rev Urol 2018;15:271–86. [DOI] [PubMed] [Google Scholar]
- 14. Zhu Y, Liu C, Cui Y, Nadiminty N, Lou W, Gao AC. Interleukin-6 induces neuroendocrine differentiation (NED) through suppression of RE-1 silencing transcription factor (REST). Prostate 2014;74:1086–94. [DOI] [PubMed] [Google Scholar]
- 15. Kato M, Placencio-Hickok VR, Madhav A, Haldar S, Tripathi M, Billet S, et al. Heterogeneous cancer-associated fibroblast population potentiates neuroendocrine differentiation and castrate resistance in a CD105-dependent manner. Oncogene 2019;38:716–30. [DOI] [PMC free article] [PubMed] [Google Scholar]
- 16. Mishra R, Haldar S, Placencio V, Madhav A, Rohena-Rivera K, Agarwal P, et al. Stromal epigenetic alterations drive metabolic and neuroendocrine prostate cancer reprogramming. J Clin Invest 2018;128:4472–84. [DOI] [PMC free article] [PubMed] [Google Scholar]
- 17. Zhu S, Tian H, Niu X, Wang J, Li X, Jiang N, et al. Neurotensin and its receptors mediate neuroendocrine transdifferentiation in prostate cancer. Oncogene 2019;38:4875–84. [DOI] [PMC free article] [PubMed] [Google Scholar]
- 18. Brekken RA, Sage EH. SPARC, a matricellular protein: at the crossroads of cell-matrix. Matrix Biol 2000;19:569–80. [DOI] [PubMed] [Google Scholar]
- 19. Fenouille N, Puissant A, Dufies M, Robert G, Jacquel A, Ohanna M, et al. Persistent activation of the Fyn/ERK kinase signaling axis mediates imatinib resistance in chronic myelogenous leukemia cells through upregulation of intracellular SPARC. Cancer Res 2010;70:9659–70. [DOI] [PubMed] [Google Scholar]
- 20. Arnold SA, Brekken RA. SPARC: a matricellular regulator of tumorigenesis. J Cell Commun Signal 2009;3:255–73. [DOI] [PMC free article] [PubMed] [Google Scholar]
- 21. Derosa CA, Furusato B, Shaheduzzaman S, Srikantan V, Wang Z, Chen Y, et al. Elevated osteonectin/SPARC expression in primary prostate cancer predicts metastatic progression. Prostate Cancer Prostatic Dis 2012;15:150–6. [DOI] [PubMed] [Google Scholar]
- 22. Kapinas K, Lowther KM, Kessler CB, Tilbury K, Lieberman JR, Tirnauer JS, et al. Bone matrix osteonectin limits prostate cancer cell growth and survival. Matrix Biol 2012;31:299–307. [DOI] [PMC free article] [PubMed] [Google Scholar]
- 23. Said N, Frierson HF, Jr., Chernauskas D, Conaway M, Motamed K, Theodorescu D. The role of SPARC in the TRAMP model of prostate carcinogenesis and progression. Oncogene 2009;28:3487–98. [DOI] [PubMed] [Google Scholar]
- 24. Greenberg NM, DeMayo F, Finegold MJ, Medina D, Tilley WD, Aspinall JO, et al. Prostate cancer in a transgenic mouse. Proc Natl Acad Sci U S A 1995;92:3439–43. [DOI] [PMC free article] [PubMed] [Google Scholar]
- 25. Gilmour DT, Lyon GJ, Carlton MB, Sanes JR, Cunningham JM, Anderson JR, et al. Mice deficient for the secreted glycoprotein SPARC/osteonectin/BM40 develop normally but show severe age-onset cataract formation and disruption of the lens. EMBO J 1998;17:1860–70. [DOI] [PMC free article] [PubMed] [Google Scholar]
- 26. Pittoni P, Tripodo C, Piconese S, Mauri G, Parenza M, Rigoni A, et al. Mast cell targeting hampers prostate adenocarcinoma development but promotes the occurrence of highly malignant neuroendocrine cancers. Cancer Res 2011;71:5987–97. [DOI] [PubMed] [Google Scholar]
- 27. Sangaletti S, Tripodo C, Cappetti B, Casalini P, Chiodoni C, Piconese S, et al. SPARC oppositely regulates inflammation and fibrosis in bleomycin-induced lung damage. Am J Pathol 2011;179:3000–10. [DOI] [PMC free article] [PubMed] [Google Scholar]
- 28. Sangaletti S, Tripodo C, Santangelo A, Castioni N, Portararo P, Gulino A, et al. Mesenchymal transition of high-grade breast carcinomas depends on extracellular matrix control of myeloid suppressor cell activity. Cell Rep 2016;17:233–48. [DOI] [PubMed] [Google Scholar]
- 29. Baley PA, Yoshida K, Qian W, Sehgal I, Thompson TC. Progression to androgen insensitivity in a novel in vitro mouse model for prostate cancer. J Steroid Biochem Mol Biol 1995;52:403–13. [DOI] [PubMed] [Google Scholar]
- 30. Beltran H, Hruszkewycz A, Scher HI, Hildesheim J, Isaacs J, Yu EY, et al. The role of lineage plasticity in prostate cancer therapy resistance. Clin Cancer Res 2019;25:6916–24. [DOI] [PMC free article] [PubMed] [Google Scholar]
- 31. Epstein JI, Amin MB, Beltran H, Lotan TL, Mosquera JM, Reuter VE, et al. Proposed morphologic classification of prostate cancer with neuroendocrine differentiation. Am J Surg Pathol 2014;38:756–67. [DOI] [PMC free article] [PubMed] [Google Scholar]
- 32. Lukacs RU, Goldstein AS, Lawson DA, Cheng D, Witte ON. Isolation, cultivation and characterization of adult murine prostate stem cells. Nat Protoc 2010;5:702–13. [DOI] [PMC free article] [PubMed] [Google Scholar]
- 33. Gao J, Aksoy BA, Dogrusoz U, Dresdner G, Gross B, Sumer SO, et al. Integrative analysis of complex cancer genomics and clinical profiles using the cBioPortal. Sci Signal 2013;6:pl1. [DOI] [PMC free article] [PubMed] [Google Scholar]
- 34. Cerami E, Gao J, Dogrusoz U, Gross BE, Sumer SO, Aksoy BA, et al. The cBio cancer genomics portal: an open platform for exploring multidimensional cancer genomics data. Cancer Discov 2012;2:401–4. [DOI] [PMC free article] [PubMed] [Google Scholar]
- 35. Abida W, Cyrta J, Heller G, Prandi D, Armenia J, Coleman I, et al. Genomic correlates of clinical outcome in advanced prostate cancer. Proc Natl Acad Sci U S A 2019;116:11428–36. [DOI] [PMC free article] [PubMed] [Google Scholar]
- 36. Kumar A, Coleman I, Morrissey C, Zhang XT, True LD, Gulati R, et al. Substantial interindividual and limited intraindividual genomic diversity among tumors from men with metastatic prostate cancer. Nat Med 2016;22:369. [DOI] [PMC free article] [PubMed] [Google Scholar]
- 37. Chiaverotti T, Couto SS, Donjacour A, Mao JH, Nagase H, Cardiff RD, et al. Dissociation of epithelial and neuroendocrine carcinoma lineages in the transgenic adenocarcinoma of mouse prostate model of prostate cancer. Am J Pathol 2008;172:236–46. [DOI] [PMC free article] [PubMed] [Google Scholar]
- 38. Shappell SB, Thomas GV, Roberts RL, Herbert R, Ittmann MM, Rubin MA, et al. Prostate pathology of genetically engineered mice: definitions and classification. the consensus report from the bar harbor meeting of the mouse models of human cancer consortium prostate pathology committee. Cancer Res 2004;64:2270–305. [DOI] [PubMed] [Google Scholar]
- 39. Said N, Frierson HF, Sanchez-Carbayo M, Brekken RA, Theodorescu D. Loss of SPARC in bladder cancer enhances carcinogenesis and progression. J Clin Invest 2013;123:751–66. [DOI] [PMC free article] [PubMed] [Google Scholar]
- 40. Singh M, Jha R, Melamed J, Shapiro E, Hayward SW, Lee P. Stromal androgen receptor in prostate development and cancer. Am J Pathol 2014;184:2598–607. [DOI] [PMC free article] [PubMed] [Google Scholar]
- 41. Zhou S, Lei D, Bu F, Han H, Zhao S, Wang Y. MicroRNA-29b-3p targets SPARC gene to protect cardiocytes against autophagy and apoptosis in hypoxic-induced H9c2 cells. J Cardiovasc Transl Res 2018. [DOI] [PubMed] [Google Scholar]
- 42. Kapinas K, Kessler CB, Delany AM. miR-29 suppression of osteonectin in osteoblasts: regulation during differentiation and by canonical Wnt signaling. J Cell Biochem 2009;108:216–24. [DOI] [PMC free article] [PubMed] [Google Scholar]
- 43. Murillo-Garzon V, Kypta R. WNT signalling in prostate cancer. Nat Rev Urol 2017;14:683–96. [DOI] [PubMed] [Google Scholar]
- 44. Rajan P, Sudbery IM, Villasevil ME, Mui E, Fleming J, Davis M, et al. Next-generation sequencing of advanced prostate cancer treated with androgen-deprivation therapy. Eur Urol 2014;66:32–9. [DOI] [PMC free article] [PubMed] [Google Scholar]
- 45. Wang N, Wang Z, Peng C, You J, Shen J, Han S, et al. Dietary compound isoliquiritigenin targets GRP78 to chemosensitize breast cancer stem cells via beta-catenin/ABCG2 signaling. Carcinogenesis 2014;35:2544–54. [DOI] [PubMed] [Google Scholar]
- 46. Cook KL, Clarke R. Role of GRP78 in promoting therapeutic-resistant breast cancer. Future Med Chem 2015;7:1529–34. [DOI] [PMC free article] [PubMed] [Google Scholar]
- 47. Pootrakul L, Datar RH, Shi SR, Cai J, Hawes D, Groshen SG, et al. Expression of stress response protein Grp78 is associated with the development of castration-resistant prostate cancer. Clin Cancer Res 2006;12:5987–93. [DOI] [PubMed] [Google Scholar]
- 48. Ferrara F, Staquicini DI, Driessen WHP, D'Angelo S, Dobroff AS, Barry M, et al. Targeted molecular-genetic imaging and ligand-directed therapy in aggressive variant prostate cancer. Proc Natl Acad Sci U S A 2016;113:12786–91. [DOI] [PMC free article] [PubMed] [Google Scholar]
- 49. Wilson EM, Oh Y, Hwa V, Rosenfeld RG. Interaction of IGF-binding protein-related protein 1 with a novel protein, neuroendocrine differentiation factor, results in neuroendocrine differentiation of prostate cancer cells. J Clin Endocrinol Metab 2001;86:4504–11. [DOI] [PubMed] [Google Scholar]
- 50. Sennino B, Ishiguro-Oonuma T, Schriver BJ, Christensen JG, McDonald DM. Inhibition of c-Met reduces lymphatic metastasis in RIP-Tag2 transgenic mice. Cancer Res 2013;73:3692–703. [DOI] [PMC free article] [PubMed] [Google Scholar]
- 51. Danza G, Di Serio C, Rosati F, Lonetto G, Sturli N, Kacer D, et al. Notch signaling modulates hypoxia-induced neuroendocrine differentiation of human prostate cancer cells. Mol Cancer Res 2012;10:230–8. [DOI] [PMC free article] [PubMed] [Google Scholar]
- 52. Terry S, Beltran H. The many faces of neuroendocrine differentiation in prostate cancer progression. Front Oncol 2014;4:60. [DOI] [PMC free article] [PubMed] [Google Scholar]
- 53. Kuser-Abali G, Alptekin A, Lewis M, Garraway IP, Cinar B. YAP1 and AR interactions contribute to the switch from androgen-dependent to castration-resistant growth in prostate cancer. Nat Commun 2015;6:8126. [DOI] [PMC free article] [PubMed] [Google Scholar]
- 54. Liu B, Li LK, Yang G, Geng CD, Luo Y, Wu WH, et al. PARP inhibition suppresses GR-MYCN-CDK5-RB1-E2F1 signaling and neuroendocrine differentiation in castration-resistant prostate cancer. Clin Cancer Res 2019;25:6839–51. [DOI] [PMC free article] [PubMed] [Google Scholar]
- 55. Zhang W, Liu B, Wu W, Li L, Broom BM, Basourakos SP, et al. Targeting the MYCN-PARP-DNA damage response pathway in neuroendocrine prostate cancer. Clin Cancer Res 2018;24:696–707. [DOI] [PMC free article] [PubMed] [Google Scholar]
- 56. Tsai H, Morais CL, Alshalalfa M, Tan HL, Haddad Z, Hicks J, et al. Cyclin D1 loss distinguishes prostatic small-cell carcinoma from most prostatic adenocarcinomas. Clin Cancer Res 2015;21:5619–29. [DOI] [PMC free article] [PubMed] [Google Scholar]
- 57. Smith BA, Sokolov A, Uzunangelov V, Baertsch R, Newton Y, Graim K, et al. A basal stem cell signature identifies aggressive prostate cancer phenotypes. Proc Natl Acad Sci U S A 2015;112:E6544–52. [DOI] [PMC free article] [PubMed] [Google Scholar]
- 58. Chern YJ, Wong JCT, Cheng GSW, Yu A, Yin YL, Schaeffer DF, et al. The interaction between SPARC and GRP78 interferes with ER stress signaling and potentiates apoptosis via PERK/eIF2 alpha and IRE1 alpha/XBP-1 in colorectal cancer. Cell Death Dis 2019;10. [DOI] [PMC free article] [PubMed] [Google Scholar]
- 59. Clocchiatti A, Ghosh S, Procopio MG, Mazzeo L, Bordignon P, Ostano P, et al. Androgen receptor functions as transcriptional repressor of cancer-associated fibroblast activation. J Clin Invest 2018;128:5531–48. [DOI] [PMC free article] [PubMed] [Google Scholar]
- 60. Akamatsu S, Inoue T, Ogawa O, Gleave ME. Clinical and molecular features of treatment-related neuroendocrine prostate cancer. Int J Urol 2018;25:345–51. [DOI] [PubMed] [Google Scholar]
- 61. McKay RR, Ye H, Xie W, Lis R, Calagua C, Zhang Z, et al. Evaluation of intense androgen deprivation before prostatectomy: a randomized phase II trial of enzalutamide and leuprolide with or without abiraterone. J Clin Oncol 2019;37:923–31. [DOI] [PMC free article] [PubMed] [Google Scholar]
- 62. Culig Z, Puhr M. Interleukin-6 and prostate cancer: Current developments and unsolved questions. Mol Cell Endocrinol 2018;462:25–30. [DOI] [PubMed] [Google Scholar]
- 63. Zhang X, Yeung ED, Wang J, Panzhinskiy EE, Tong C, Li W, et al. Isoliquiritigenin, a natural anti-oxidant, selectively inhibits the proliferation of prostate cancer cells. Clin Exp Pharmacol Physiol 2010;37:841–7. [DOI] [PubMed] [Google Scholar]
Associated Data
This section collects any data citations, data availability statements, or supplementary materials included in this article.
Supplementary Materials
the file includes supplementary material and methods and 20 supplementary figures
list of antibodies used in the paper
RNAseq in T23 cells list of differentially expressed genes
genes positively correlated to Hspa5 in the Beltran data set
uncropped western blot gels