

Abstract
Background
Skeletal muscle exhibits remarkable plasticity under both physiological and pathological conditions. One major manifestation of this plasticity is muscle atrophy that is an adaptive response to catabolic stimuli. Because the heterogeneous transcriptome responses to catabolism in different types of muscle cells are not fully characterized, we applied single‐nucleus RNA sequencing (snRNA‐seq) to unveil muscle atrophy related transcriptional changes at single nucleus resolution.
Methods
Using a sciatic denervation mouse model of muscle atrophy, snRNA‐seq was performed to generate single‐nucleus transcriptional profiles of the gastrocnemius muscle from normal and denervated mice. Various bioinformatics analyses, including unsupervised clustering, functional enrichment analysis, trajectory analysis, regulon inference, metabolic signature characterization and cell–cell communication prediction, were applied to illustrate the transcriptome changes of the individual cell types.
Results
A total of 29 539 muscle nuclei (normal vs. denervation: 15 739 vs. 13 800) were classified into 13 nuclear types according to the known cell markers. Among these, the type IIb myonuclei were further divided into two subgroups, which we designated as type IIb1 and type IIb2 myonuclei. In response to denervation, the proportion of type IIb2 myonuclei increased sharply (78.12% vs. 38.45%, P < 0.05). Concomitantly, trajectory analysis revealed that denervated type IIb2 myonuclei clearly deviated away from the normal type IIb2 myonuclei, indicating that this subgroup underwent robust transcriptional reprogramming upon denervation. Signature genes in denervated type IIb2 myonuclei included Runx1, Gadd45a, Igfn1, Robo2, Dlg2, and Sh3d19 (P < 0.001). The gene regulatory network analysis captured a group of atrophy‐related regulons (Foxo3, Runx1, Elk4, and Bhlhe40) whose activities were enhanced (P < 0.01), especially in the type IIb2 myonuclei. The metabolic landscape in the myonuclei showed that most of the metabolic pathways were down‐regulated by denervation (P < 0.001), while some of the metabolic signalling, such as glutathione metabolism, was specifically activated in the denervated type IIb2 myonulei. We also investigated the transcriptomic alterations in the type I myofibres, muscle stem cells, fibro‐adipogenic progenitors, macrophages, endothelial cells and pericytes and characterized their signature responses to denervation. By predicting the cell–cell interactions, we observed that the communications between myofibres and muscle resident cells were diminished by denervation.
Conclusions
Our results define the myonuclear transition, metabolic remodelling, and gene regulation networks reprogramming associated with denervation‐induced muscle atrophy and illustrate the molecular basis of the heterogeneity and plasticity of muscle cells in response to catabolism. These results provide a useful resource for exploring the molecular mechanism of muscle atrophy.
Keywords: Denervation, snRNA‐seq, Skeletal muscle, Muscle atrophy, Muscle metabolism
Introduction
Skeletal muscle atrophy occurs in response to a variety of clinical conditions, including cancer cachexia, chronic kidney disease, and denervation. It is characterized by a loss of muscle mass and contractile function, which contributes to reduced quality of life of patients, and in some circumstances increased mortality. 1 Therefore, it is paramount to understand the transcriptional landscape of atrophic muscle for exploring the molecular mechanisms behind muscle atrophy and developing corresponding treatment strategies.
Myofibres are giant muscle cells with multiple myonuclei and are typically classified as type I and type II fibres. In mice, the type II myofibre can be further divided into type IIa, IIx, and type IIb. 2 Meanwhile, the interstitial spaces between such fibres are populated with muscle‐resident cells, including fibro‐adipogenic progenitors (FAPs), vascular cells, nerve cells, and immune cells such as macrophages and lymphocytes. The exquisite orchestration of these heterogeneous cell populations is required for the maintenance of muscle function and homeostasis. To this end, distinct gene regulatory networks initiate diverse gene expression patterns in each type of muscle cell, leading the tissue to feature complex transcriptional heterogeneity. In this context, examining bulk gene expression may not allow the delineation of transcriptional profiles in a cell‐specific manner.
Single‐cell RNA sequencing can simultaneously interrogate gene expression and signalling pathways in multiple cell types within a tissue. It has been used to characterize the gene expression profiles of normal or unperturbed muscle tissues in both mouse and human 3 , 4 ; in particular, Puri and colleagues precisely described the response of muscle‐resident cells to denervation at single‐cell resolution. 5 With advances in library preparation and isolation techniques, single‐nucleus RNA sequencing (snRNA‐seq) has enabled the detection of transcriptional states in multinucleated cells such as myofibres; for example, Dos Santos et al. ingeniously defined the coordinated regulation of multiple‐nuclear transcription in myofibres using snRNA‐seq. 6 In another elegant study, Petrany et al. depicted the transcriptional heterogeneity of normal myofibres and identified new myonuclear types. 7 However, while these studies provide integral parts that have allowed us to build complete gene expression landscapes for normal muscles or perturbed muscle‐resident cells, the transcriptional heterogeneity of myofibres in response to catabolic stimuli remains to be established.
In this study, we employed snRNA‐seq to elucidate transcriptional heterogeneity in denervated myofibres. We chose the denervation context because it induces pronounced muscle atrophy and is relevant to clinical conditions including neurodegenerative diseases and age‐related muscle atrophy and weakness. 8 Importantly, the model is standardized and reproducible, which is less likely to be affected by variations in disease progression and other complications such as anorexia or systemic inflammation. In addition, denervation‐induced muscle atrophy is initiated by the loss of neural signals at myofibres. As such, studying this phenotype specifically facilitates the prediction of communications between myofibres and other non‐parenchymal cells during muscle atrophy. Using this model, we identified unique atrophic‐responsive gene signatures of all muscle tissue populations and revealed uncharacterized diversity within denervated myofibres and other resident cells. Further, we demonstrated the specific gene regulation networks (regulons) that govern the expression of those gene signatures, thus, providing a comprehensive single‐nucleus/cell atlas of atrophic muscle.
Methods
Mouse model
snRNA‐seq was carried out on gastrocnemius (Gas) muscle of 12‐week‐old, male C57BL/6J mice (The Jackson Laboratory, Bar Harbour, ME) that underwent sciatic nerve transection (n = 3). Procedures of denervation surgery were carried out as previously described. 9 Muscle samples were harvested 2 weeks after denervation. The Gas muscles from left hind limb of normal mice served as controls (n = 3). All mouse studies were approved by the Baylor College of Medicine Institutional Animal Care and Use Committee and carried out in accordance with the recommendations of Institutional and NIH guidelines.
Skeletal muscle nuclei isolation
The muscle samples were processed according to a published nuclear isolation protocol with modifications. 10 We first prepared nuclei isolation media 1 (NIM1: 320 mM sucrose, 25 mM KCl, 5 mM MgCl2, and 10 mM Tris buffer, pH = 8.0) and homogenization buffer [NIM1 buffer containing 1 μM DTT, 0.4 U/μL RNase Inhibitor (NEB Inc, Ipswich, MA), 0.20 U/μL SUPERase‐In RNase Inhibitor (Thermo Fisher scientific Inc, Waltham, MA), and 0.1% Triton X‐100]. Then, gas muscles (100–150 mg) were minced on ice with a razor blade. Muscles were resuspended in 5 mL ice‐cold homogenization buffer and homogenized with a Dounce grinder for 12 strokes gently on ice. The homogenate was sequentially filtered through 70 and 40 mm cell strainers (pluriSelect, El Cajon, CA) and centrifuged (×1000 g) for 5 min at 4°C to pellet the nuclei. The pellet was resuspended with 1 mL of ice‐cold wash buffer (PBS containing 2% bovine serum albumin and 0.2 U/μL ribonuclease inhibitor) and then filtered through the 20 μm cell strainer before centrifugation (×500 g) for 5 min at 4°C. The collected nuclei were resuspended in 100 μL of cold wash buffer and the purity of nuclei suspensions was confirmed by microscopy with DAPI staining. All chemicals were purchased from Sigma‐Aldrich Chemicals (St. Louis, MO) unless otherwise noted.
snRNA‐seq and bioinformatics analyses
Nuclei were purified and were loaded into the 10× Chromium Chip. snRNA‐seq libraries were prepared using Chromium Single Cell 3 Reagent Kits v3 and sequenced on the Illumina HiSeq4000 platform. Various R packages and software were used, including Seurat package (3.1.0) for unsupervised clustering; ClusterProfile for KEGG pathway enrichment analysis; javaGSEA for gene set enrichment analysis; Monocle3 for trajectory analysis; SCENIC for regulon inference; Single‐Cell‐Metabolic‐Landscape for metabolic signature characterization; and a ligand‐receptor interaction model for cell–cell communication prediction. Raw and processed sequencing data have been deposited in GEO with the accession code GSE183802. For other detailed methods, please refer to the supporting information.
Immunostaining and fibre size assessment
The frozen gastrocnemius muscle sections (5 μm) were fixed in −20°C acetone for 10 min. Myofibres were outlined by staining of laminin (L9393, Sigma‐Aldrich, St. Louis, MO), and nuclei were visualized by DAPI. To determine the CSA (in μm2) of normal and denervated muscles (n = 6), Nikon microscope was used for image capture, and approximately 300–400 fibres in muscles of each animal were assessed. Data are represented as CSA distribution frequency (in percentage). The mean CSA of type I and type II fibres in normal (n = 6) and denervated muscles (n = 6) were also calculated. Type I fibres were labelled by monoclonal anti‐Myosin slow (M8421, Sigma‐Aldrich, St. Louis, MO). To probe the distribution of type IIb1 and type IIb2 nuclei, sections were stained with primary antibodies to Smox (sc‐166185, Santa Cruz, Dallas, TX) and Plxdc2 (HPA017268, Sigma‐Aldrich, St. Louis, MO).
Statistics
Comparisons between two groups were performed using Student's t‐test or Wilcoxon rank‐sum test. Comparisons of more than two groups were performed using Kruskal–Wallis test. The level of significance was set at *P < 0.05, **P < 0.01, or ***P < 0.001.
Results
Muscle heterogeneity and cell type composition in normal and denervated muscles
To investigate how the heterogeneity of muscle cell responds to atrophy, we created a sciatic denervation model using 12‐week‐old male C57BL/6J mice and harvested gastrocnemius (Gas) muscles after 2 weeks. Denervation caused severe atrophy in both type I and type II myofibres (Figures 1A,B and S1A) and led to the fibre size distribution obviously shifting left‐toward (Figure 1C). Isolated muscle nuclei were used to construct single‐nucleus libraries with the 10× Genomics Chromium system followed by sequencing as previously described. 11 After quality control, 29 539 nuclei were retained from 6 individual libraries, comprising 15 739 nuclei from three normal mice and 13 800 nuclei from 3 denervated mice. Using the Seurat package (3.1.0), we obtained 30 unsupervised clusters (Figure S1B). Based on the expression of lineage specific markers (Figure S1C), all clusters were assigned into 12 known cell types, including type I myofibres, type II myofibres (IIa, IIx, and IIb), FAPs, muscle stem cells (MuSCs), NMJ, MTJ, macrophages, endothelial cells, pericytes, adipocytes, and unclassified nuclei (Figures 1D and S1D). Cell identities and top five signature genes of each cell type are provided in Figures 1E and S1E, respectively.
Figure 1.

Classification of nucleus/cell types in normal and denervated gastrocnemius (gas) muscles. (A) Immunofluorescent staining: Type I fibres are labelled with anti‐Myh7 antibody (red) and co‐stained with laminin (green). Images were taken at ×20 magnification. (B) Comparison of cross‐sectional area (CSA) between normal and denervated conditions. The data are presented as mean ± SEM (n = 6). (C) Fibre size distribution of normal and denervated gas muscles. The size of 300–400 fibres in muscles of each animal was assessed (n = 6). (D) Uniform manifold approximation and projection (UMAP) visualized nuclear clusters, which are coloured and labelled according to cell identities, in normal (left panel) and denervated (right panel) gas muscles. Type I, type I myonuclei; type IIa, type IIa myonuclei; type IIx, type IIx myonuclei; type IIb, type IIb myonuclei; MTJ, myotendinous junction nuclei; NMJ, neuromuscular junction nuclei; MuSCs, muscle satellite cells nuclei; FAPs, fibro‐adipogenic progenitors nuclei; macrophage, macrophages nuclei; ECs, endothelial cells nuclei; Pericytes, pericytes nuclei; adipocyte, adipocyte nuclei. (E) UMAP plot displaying the cell identity of each nuclear cluster. (F) Proportion of nuclear types in normal and denervated muscles. Each nucleus/cell type is colour‐coded. (G) UMAP plots with pseudotime trajectories of all nuclei obtained from normal and denervated muscles. The black lines on the UMAP plots represent branched trajectories. Each point denotes a single nucleus. Left panel: Nuclei are colour‐coded according to their cluster assignments in (D). Right panel: Nuclei are coloured by conditions (blue, normal; pink, denervation).
We first analysed the changes of cell populations in muscles following denervation. In normal Gas muscle, type II myonuclei was the predominant cell type (67%); type I myonuclei and satellite cells only accounted for 0.56% and 0.7% of cells, respectively, while non‐myofibre nuclei such as FAPs (17.95%), macrophages (2.09%), and endothelial cells (1.5%) were frequently detected. After denervation, we observed decreases in the proportions of type I, type II myonuclei, endothelial cells and pericytes, accompanied by an increase in FAP, macrophages and unclassified nuclei (Figure 1F). Although hybrid myonuclei can be detected (such as Myh2+/Myh1+ or Myh1+/Myh4+), we observed that Myh4 positive nuclei accounted for about 80% of total type II myonuclei in normal Gas muscle, consistent with the notion that most myonuclei express a single fast myh gene. 6 The unclassified population consisted of titin (myofibre gene) positive nuclei, Magi2 and Auts2 (distal axonal and neuronal gene) positive nuclei and Lama2 (extracellular gene) positive nuclei (Figure S1F), indicating that this cluster may be derived from multiple cell lineages.
We then performed the trajectory analysis of all types of nuclei using Monocle 3. This algorithm arranges each nucleus along a pseudotime based on transcriptional similarities, thus can reflect the stepwise change in expression profile experienced by different cell types. As shown in Figure 1G, the most dynamic trajectory was found in myonuclei, followed by FAPs and endothelial cells. Overall, denervation elongated the trajectory of myonuclei, while the trajectories of FAPs and other resident cells were less affected, indicating that denervation causes more pronounced transcriptional and heterogeneous changes in myofibres.
The heterogeneity of type II myonuclei in response to denervation
To delineate the responses of different myofibre types to denervation, we isolated all titin positive myonuclei and constructed myonuclear‐specific trajectories using Monocle 3. Notably, when we used ‘cluster_cells’ function in monocle 3, normal type IIb myonuclei were further divided into two subgroups (Figure S2A). To confirm this result, we performed trajectory analysis specifically for type II myonuclei and found that type II myonuclei formed a continuous trajectory from type IIa extending to type IIx, followed by type IIb1 and type IIb2 in normal muscle (Figure 2A, middle panel). Upon denervation, this continuum was disrupted by an obvious deviation of type IIb2 myonuclei, which formed a distinct cluster emerging at the end of the trajectory (Figure 2A, right panel). This response was accompanied by a remarkable increase in the proportion of type IIb2 myonuclei (Figure 2B), implying that in type II myofibres, denervation promotes a transition of myonuclei into specialized type IIb2 nuclei.
Figure 2.

Trajectory illustrated transcriptional heterogeneity in type II myonuclei. (A) UMAP showing trajectory of type II myonuclei from normal (left panel, n = 10 561) and denervated muscles (right panel, n = 6631). The myonuclei are coloured according to conditions (left panel: blue, normal; pink, denervation) or their identified subtypes (middle and right panel). Type IIa, type IIa myonuclei; type IIx, type IIx myonuclei; type IIb1, type IIb1 myonuclei; type IIb2, Type IIb2 myonuclei. (B) Proportion of different type II myonuclei subtypes in normal and denervated conditions. (C) Heatmap showing the differential expressed genes (DEGs) of type II myonuclei subtypes. The colour scale represents the relative expression level of gene in each nucleus. (D) Enriched KEGG pathways (P < 0.01) in denervated type IIb2 myonuclei. The colour scale indicates the significance level of enrichment (adjust p value). Dot size represents counts of genes enriched in the pathway. KEGG, Kyoto encyclopedia of genes and genomes. (E) GSEA plots showing enrichment score (ES) of the significant enriched hallmark gene sets in type IIb2 myonuclei. A positive value of ES indicates enriched in denervation condition, and a negative value indicates enriched in normal condition but down‐regulated in denervation. GSEA, gene set enrichment analysis; NES, normalized enrichment score; FDR, false discovery rate.
To characterize the type IIb2 myonuclei, we surveyed the differential expressed genes (DEGs) in all subtypes of type II myonuclei under normal and denervated conditions (Figure 2C). Normal type IIb1 and type IIb2 myonuclei have identical level of Myh4, but the energy metabolism related genes (Ckm and Ckmt2) were significantly down‐regulated in type IIb2 myonuclei. In contrast, the expressions of Plxdc2, Atp13a3, and Ptprd genes were higher in type IIb2 myonuclei (Figures 2C and S2B). To locate the distribution of type IIb1 and IIb2 myonuclei in muscle fibres, we performed immunofluorescence staining of Smox and Plxdc2, two signature genes of type IIb1 and IIb2, respectively (Figure S2B). We observed a co‐staining of these two proteins in the same type II myofibres, suggesting that type IIb1 and IIb2 myonuclei are present in the same myofibre (Figure S2C). In response to denervation, type IIb2 nuclei had higher expression of several well‐known atrophy related genes (Fbxo32, Runx1, and Gadd45a) 12 , 13 , 14 and genes (Robo2, Dlg2, and Sh3d19) with unknown role in muscle atrophy (Figures 2C and S2D). Pathway enrichment analysis of DEGs (denervated vs. normal type IIb2) demonstrated that calcium signalling, MAPK and Hippo pathways were enriched in denervated type IIb2 myonuclei (Figure 2D). Gene set enrichment analysis (GSEA) revealed that hallmark gene sets involving oxidative phosphorylation and hypoxia were enriched in normal type IIb1 myonuclei but down‐regulated in denervated type IIb2 myonuclei. Conversely, hallmark sets with genes involving TGF‐beta and MYC signalling were significantly enriched in denervated type IIb2 myonuclei (Figures 2E and S2E).
Lastly, we interrogated the activity of gene regulatory networks (GRNs) in type II myonuclei using single‐cell regulatory network inference and clustering (SCENIC). 15 This approach maps and scores the activity of regulons, which consist of transcription factors (TFs) and their directly regulated target genes, to determine the underlying GRNs in a given cell type. We identified 147 active regulons in normal and denervated type II myofibres (Figure S3A, Table S1). In Figure 3A, we showed the regulons whose activities were dramatically changed by denervation in type II myonuclei, alongside a list of master regulators (TFs) that may mediate the transcriptomic and phenotypic changes of denervated type II myofibres. Using the regulon activity score, all myonuclei could be divided into the expected subtypes (Figure 3B), consistent with the clustering results obtained using trajectory analysis (Figure 2A). The results of t‐SNE on the binary regulon activity matrix also supported the observation that denervation greatly changes regulon activity in type II myonuclei. For example, the Hlf and Maf regulons were active in all normal type II myonuclei but were suppressed in denervated type IIb2 myonuclei; in contrast, the Elk4, Bhlhe40, Meis1, and Zfp369 regulons were enhanced in denervated type IIb myonuclei, especially in the typeIIb2 subtype (Figure 3C). Figure S3B presented the regulons whose activities were enhanced by denervation, including Runx1, Mef2a, Myog, Myod1, and Myf6. These results indicate that distinctive gene regulatory networks were activated in type II myonuclei by denervation, driving the fibre type‐specific transcriptional changes.
Figure 3.
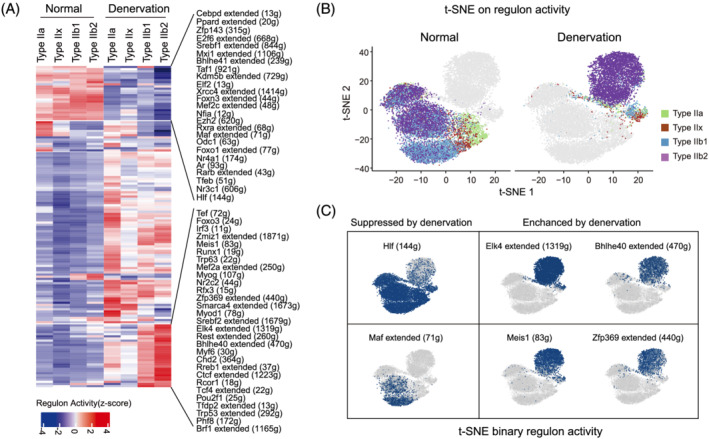
Gene regulatory network (GRN) of type IIb2 myonuclei in normal and denervation. (A) Heatmap showing regulons with significant changes between normal and denervated type IIb2 myonuclei. The colour scale represents the activities of regulons. The top changed regulons and the counts of downstream target genes in the regulons are provided on the left. (B) t‐distributed stochastic neighbour embedding (t‐SNE) on binary regulon activity matrix of normal (left panel) and denervated (right panel) type II myonuclei. Each nucleus is coloured according to corresponding subtype. (C) t‐SNE on the binary regulon activity matrix showing denervation suppresses (left panel) or enhances (right panel) the activities of select regulons in myonuclei.
Transcriptomic and heterogeneous alternations in denervated type I myonuclei
To dissect the transcriptomic changes of type I fibre in response to denervation, we reconstructed the trajectory of type I myonuclei. Unlike type II myonuclei, the trajectory of normal type I myonuclei had no nodes or branches, indicating lower heterogeneity of type I myofibres. In response to denervation, the affected type I nuclei formed a distinct cluster (Figure 4A), reflecting that denervation dramatically altered their transcription profiles. We then analysed DEGs and identified 379 genes that were significantly changed (Figure S4A, Table S2), including the top up‐regulated genes Dlg2, Col25a1, Igfn1, Col23a1, and Arpp21 and the top down‐regulated genes Rp1, Hs3st5, Rnf150, Mylk4, and Lrrfip1 (Figure 4B). KEGG analysis revealed that DEGs of denervated type I myonuclei were related to pathways involving protein degradation, autophagy, AMPK, mTOR, and insulin signalling (Figure 4C). These pathways have been shown to be determinants of muscle wasting. For example, activation of AMPK reportedly mediated mitochondrial‐dependent muscle atrophy. 16 GSEA analysis demonstrated that gene sets for fatty acid metabolism, oxidative phosphorylation (OXPHOS), PI3K/mTOR pathway, and adipogenesis were significantly enriched in normal but down‐regulated in denervated type I myonuclei (Figures 4D and S4B). SCENIC analysis showed the dominant gene regulatory networks in normal type I fibres include Mta3, Nr1h3, Rxrg, and Yy1 regulons. In response to denervation, the activities of these regulons decreased while the activities of C/EBPs, Sox13, Nr2c1, Mga, and Stat6 regulons were increased (Figure 4E). In particular, CEBP‐β, δ, γ, and ζ regulons were remarkably activated in denervated type I nuclei, consistent with previous reports that C/EBPβ promoted the expression of atrophy‐related genes in muscle during cancer cachexia. 17 Other highly activated regulons included Mta3 and Sox13. Although evidence showed that Mta3 and Sox TF family involved in the epithelial‐to‐mesenchymal transition and in the determination of cell fate, their functional roles in in skeletal muscle biology and the pathogenesis of muscle atrophy have not been explored.
Figure 4.

Transcriptional responses of type I myonuclei to denervation. (A) UMAP showing the pseudotime trajectory of type I myonuclei from normal (blue, n = 88) and denervated (pink, n = 44) muscles. (B) Violin plot showing the expression of select differentially expressed genes (DEGs) between normal (blue) and denervated (pink) type I myonuclei. N, normal; D, denervation. Wilcoxon rank sum test: Min.Pct = 0.25, logfc.Threshold = 0.25. Significance level: ***P < 0.001. (C) Enriched KEGG pathways (P < 0.01) of DEGs in denervated type I myonuclei. The colour scale indicates the significance level of enrichment (adjust p value). Dot size represents counts of genes enriched in the pathway. (D) GSEA plots showing enrichment score (ES) of the significant enriched hallmark gene sets in type I myonuclei. NES, normalized enrichment score; FDR, false discovery rate. (E) Heatmap showing top changed regulons between normal and denervated type I myonuclei. The colour scale represents the activities of regulons. The number in parentheses represents the count of target genes in corresponding regulons.
Metabolic plasticity and heterogeneity of myonuclei after denervation
Different muscle fibre types exhibit unique metabolic properties; accordingly, we characterized the metabolic heterogeneity of myofibres and their respective adaptive responses to denervation at single nucleus resolution. Specifically, we compared the normal and denervated metabolic gene expression profiles of each subtype using the Single‐Cell‐Metabolic‐Landscape pipeline (see Methods section). This approach calculates a metabolic pathway activity score according to the relative gene expression averaged over all genes in that pathway. We first constructed UMAP profile of the 1401 detected metabolic genes in type I/II myonuclei and identified myonuclei types similar to those classified using the complete gene set (Figure 5A,B), indicating metabolic features weighs heavily on the phenotypic changes of fibre types. We next quantified the overall metabolic pathway activities of normal and denervated myofibres based on myonuclear type. We observed a gradually decreasing trend in metabolic activity from oxidative type I myonuclei to glycolytic type IIb2 myonuclei in normal muscles. Upon denervation, all myonuclei exhibited significant down‐regulation of metabolic activity, reflecting the reduced metabolic demands of denervated myofibres (Figure 5C). The affected metabolic pathways involved lipid, carbohydrate, amino acid, and nucleotide metabolism, along with the citrate cycle and oxidative phosphorylation (Figure 5D). These findings support the notion that denervation induces substantial metabolic adaptations in muscle. Intriguingly, the decline in metabolic gene expression was greatest in oxidative myonuclei (types I/IIa) but smallest in glycolytic (type IIb1/2) myonuclei, suggesting that metabolic state of oxidative myofibres might be more susceptible to denervation. Whereas we also observed denervated type IIb myonuclei exhibited marked up‐regulation of certain metabolic pathways involving unsaturated fatty acid, sphingolipid, pyrimidine, and glutathione metabolism (Figure 5D). Sphingolipid and unsaturated fatty acid metabolism are closely linked to muscle biology and pathophysiology such as muscle protein loss and insulin resistance 18 ; glutathione and pyrimidine derivatives are important antioxidants, and increased activity of these pathways implies a compensatory response to oxidative stress. In addition, we observed an increase in activity for glycan biosynthesis, which is important for the modulation of cell communication and signalling transduction; however, the role of this metabolic component during muscle denervation needs further exploration.
Figure 5.

Metabolic landscape of myonuclei from normal and denervated muscles. (A) Clustering on metabolic gene expression profiles of myonuclei enables identification of normal and denervation cell states. The dots are coloured according to different conditions (normal, blue; denervation, pink). (B) UMAP of metabolic profiles of different myonuclei subtypes in normal (right panel) and denervation (left panel). The dots are coloured according to corresponding subtypes. (C) Boxplot showing the metabolic activities of different myonuclei subtypes between normal and denervation. Each dot represents the activity score of an individual metabolic pathway. Comparisons between conditions are performed using Wilcoxon rank‐sum test. N, normal; D, denervation. (D) The activity score of top metabolic pathways detected in myonuclei subtypes. The blank indicates that the score of pathway activity is not significant in relevant subtype (random permutation test, P > 0.01). The metabolic pathways are arranged according to categories.
Heterogeneity and phenotype of FAPs in response to denervation
The second complex trajectory was formed by FAPs. In normal, this trajectory was restricted to a concentrated area and segregated into three subclusters (C1–3) (Figure 6A, upper panel). We surveyed the expression patterns of known FAPs markers in each subcluster and verified that they are consistent with the results of previous studies (Figure S5A). 5 Upon denervation, those subclusters went through remarkable expansions to form three branches emanating from the main trajectory (Figure 6A, lower panel), indicating that FAPs underwent substantial transcriptional changes. To characterize these changes, we isolated FAPs nuclei from each branch and compared their transcriptomes with those of the corresponding normal subcluster. The top 10 DEGs in each subcluster are listed in Figure 6B. We then performed GSEA and compared the hallmark profiles of each subcluster under normal and denervation conditions. In normal FAPs, all three subclusters showed significantly enriched hallmarks related to myogenesis, hypoxia, and metabolism, but they were down‐regulated in denervated FAPs. In addition, these subclusters were found to be enriched for distinct gene sets in response to denervation (Figure 6C). Specifically, the denervated C1 subcluster was enriched for hallmarks of apoptosis, coagulation, and the P53 pathway, suggesting that this subcluster might represent an apoptotic phenotype. 19 Meanwhile, the C2 subcluster was enriched for hallmarks related to epithelial‐mesenchymal transition (EMT), angiogenesis, and TGF‐β signalling, and the C3 subcluster for adipogenesis, MYC targets V1, and Wnt/beta‐catenin signalling. These results imply that denervation activates C2 and C3 FAPs to acquire pro‐fibrotic and pro‐adipogenic features, respectively.
Figure 6.

Transcriptional responses to denervation in FAPs. (A) UMAP showing a branching trajectory of FAPs from normal muscles (upper panel, n = 2825) and denervated muscles (lower panel, n = 3634). The nuclei mapped on the path are coloured and labelled according to their identified subtypes as C1, C2, and C3. These subclusters are annotated as apoptotic branch, fibrotic branch and adipogenic branch according to GSEA analysis. (B) Heatmap displaying the relative expression level of the top 10 DEGs between normal and denervation condition in 3 identified FAPs subtypes. Left panel: DEGs of C1 subtype. Middle panel: DEGs of C2 subtype. Right panel: DEGs of C3 subtype. The colour scale represents the normalized expression values. (C) Heatmap showing GSEA enrichment scores of the 3 FAPs subtypes in denervated muscle compared with corresponding normal subtypes. The category annotations of hallmark gene sets are based on information from GSEA database. A positive enrichment score (ES) indicates the gene set is significantly enriched in denervated FAPs, and a negative ES indicates that gene set is significantly enriched in normal FAPs. The blank indicates there is no significant enrichment of the gene set (P > 0.05, FDR > 25%). (D) The most active regulons in 3 subtypes of FAPs from normal and denervated muscles. The colour scale represents the normalized scores of regulon activity: Red denotes high level of activity while blue indicates low level of activity. The number in parentheses represents the count of downstream target genes in corresponding regulons.
We then inferred the GRNs underlying the transcriptomic and phenotypic changes of FAPs and found 297 active regulons in normal and denervation states (Figure S5B). In normal, all subtypes of FAPs were found to be governed by some common regulons including Kdm5a, Tbx15, Yy1, and Sox5; however, unique patterns of regulon activity were also observed in different subclusters, such as higher activities of Thra (C1), Tbl1xr1 (C2), and Creb5 (C3) regulons (Figure 6D). Upon denervation, most active regulons in normal FAPs were suppressed, with concomitant adaptive activation of a diverse range of other regulons; in particular, over 120 regulons were strongly activated in the C3 subcluster (Figure S5B). It was notable that some specific regulons potentially drive the phenotypic changes of FAPs, such as theTcf7l2 and Srebf1 regulons activated in C2 and C3 FAPs after denervation. Tcf7l2 plays a major role in the Wnt signalling pathway which regulates fibrosis, 20 while Srebf1 is a key regulator of adipogenesis. 21 We also found that C2 FAPs exhibited higher activity of the Stat3 regulon, which was reported to promote myofibre atrophy and fibrosis during denervation. 9 Finally, we highlighted several novel regulons whose activities were robustly increased in FAPs after denervation (Figure S5B), the roles of these TFs during muscle atrophy merit further investigation.
Alteration in expression profile of macrophages and other resident cells in denervated muscles
In both normal and denervated muscles, macrophages (MPs) were the predominant inflammatory cells which could be divided into two distinct subclusters using unsupervised classification, representing skeletal muscle resident‐MPs (Mrc1‐positive and Cd163‐positive) and monocyte‐derived‐MPs (Ptprc‐positive and Ccr2‐positive) (Figure 7A,B). Detailed signatures gene for both groups are provided in Figure S6A. Notably, in denervated muscles, we observed an increase in total numbers of macrophages with remarkably higher proportion of resident MPs (Figure 7C). In trajectory analysis, we found that resident‐MPs generated a continuous trajectory with two clusters corresponding to normal and denervated resident‐MPs (Figure 7D). DEGs analysis revealed that in normal muscles, resident‐MPs expressed higher levels of Tmem233, Ano5, Mybpc2, and Capn3. In denervated muscles, those genes were significantly down‐regulated, while genes relating to fibrosis or immune responses, such as Col19a1, Ncam1, and Enpp3, were up‐regulated (Figure 7E). GSEA analysis revealed gene sets involving immune response, chemokine receptor binding to be significantly enriched in denervated MPs (Figure 7F). Using SCENIC, we identified several key regulons in normal resident‐MPs (Nr4a1, Nfib, and Sox6) and in denervated resident‐MPs (Mef2a, Smad5, Myc, and Nfya) (Figure 7G). Because Myc and Nfya are reportedly activated in self‐renewing macrophages, 22 these results imply that denervation may enhance the self‐renewal capacity of muscle resident macrophages.
Figure 7.

Transcriptional responses to denervation in macrophages. (A) UMAP showing 2 subclusters of macrophages coloured with identified phenotypes. Resident: Skeletal muscle resident macrophages (orange); monocyte‐derived: Monocyte‐derived macrophages (blue). (B) Visualization of the expression and distribution of established macrophage identities in 2 subtypes of macrophage. (C) Left panel: Visualization of the 2 macrophages subtypes on UMAP split by conditions (normal and denervation). The number in brackets denotes the total numbers of macrophage from normal and denervated muscles. Right panel: Changes in proportions of macrophages subtypes in normal and denervated muscles. Different colours represent the corresponding subtypes. (D) Trajectory of resident macrophages from normal and denervated muscles. Each dot represents a nucleus and is coloured according to conditions (blue, normal; pink, denervation). (E) The expression levels of top 10 DEGs in resident macrophages between normal and denervation. (F) Significant enriched GO gene sets in resident macrophages from denervated muscles. GO, gene ontology; NES, normalized enrichment score; FDR, false discovery rate. (G) The activity scores of top 10 regulons detected in normal and denervated resident macrophages.
The heterogeneity and phenotype of MuSCs and endothelia/pericytes in response to denervation are described in detail in Figures S7 and S8, respectively.
Communications between myofibres and other resident cells in response to denervation
To investigate the intercellular cross‐talks in denervated muscles, we calculated the scores of ligands and receptors interaction (L‐R) based on their differentially expression in each type of muscle cells. 3 In total, we inferred 592 and 48 potential L‐R pairs in normal and denervated muscles, respectively. This result indicated a marked suppression of intercellular communications by denervation (Figure S9A and Table S3). Because the catabolic signalling induced by denervation is initiated in myofibres, we prioritized the interaction signals from myofibres to resident cells. Normal type I myofibres expressed higher ligands of Fgf1, Mapt, Angpt1, Ptprm, Ncam1, and Jam3, while type II myofibres had higher levels of Vegfa, Fgf13, Cadm1, and Egf. Upon denervation, there were a dramatic decline of L‐R interactions, reflecting that denervation diminished the influences of myofibres on resident cells (Figure 8A). Because Vegfa and Fgf1 are critical regulators of vascular remodelling and homeostasis of skeletal muscle 23 , 24 , we highlighted the interactions mediated by these ligands (Figure 8B). For example, the Vegfa‐Kdr interaction was impeded after denervation that has previously linked to denervation‐induced vascular remodelling. 25 Likewise, the interactions mediated by Fgf1 were inhibited in denervated type I myofibre, exemplified by the decreased score of Fgf1‐Fgfr4 (Figure 8C). Because Fgf1 secreted by myofibres was reportedly critical to maintain MuSCs functions, the results suggested that down‐regulation of Fgf1 in myofibre could be one of the mechanisms leading to the dysfunction of MuSCs during denervation. However, we also detected an activation of MAPK pathway, a known downstream signalling of the FGF family, in denervated MuSCs: KEGG analysis showed that denervated MuSCs were enriched for MAPK signalling pathway, and SCENIC analysis captured an activation of Ets1 regulon which is one of targeting TFs of MAPK pathway (Figure S7D,F,G). These results implied that other FGF family members might be responsible to the activation of MAPK signalling in MuSCs, for example, Fgf13, whose expression was up‐regulated type IIb myonuclei (Figure 8B), and reflected the complex regulation of MuSCs during muscle denervation. 26
Figure 8.

Ligand‐receptor interactions between myofibres and other resident cells in response to denervation. (A) Chrod plot displaying intercellular ligand‐receptor (L‐R) interactions in normal (left panel) and denervated (right panel) muscles. Ligands differentially expressed by myofibres are listed below the dash line, and receptors differentially expressed by receiver cells (including myofibres and other types of resident cells) are listed above the dash line. The communications from myofibres (L) to other resident cells (R) are highlighted (green and yellow). Other interactions are presented in grey.(B) Heatmap showing changes in the normalized scores of L‐R interactions between type II myofibres and other cells in normal and denervated condition. The interaction score is determined by the expression level of ligands (Vegfa or Fgf13) in myofibres and expression level of receptors in receiver cells. The columns represent the receiver cell types and the rows represent predicted L‐R pairs. The colour scale represents the score of interaction; a higher score indicates greater interaction between cells. (C) Heatmap of ligand‐receptor interaction scores. Results show that the interactions between Fgf1 in type I myofibres and their receptors in other resident cells. (D) Chrod plot displaying intercellular L‐R interactions in normal (left panel) and denervated (right panel) muscles. Ligands differentially expressed by receiver cells are listed below the dash line, and receptors differentially expressed by myofibres are listed above the dash line. The communications from resident cells (L) to myofibres (R) are highlighted. Other interactions are presented in grey. (E) Heatmap of ligand‐receptor interaction scores. Results show that the interactions between ligands in resident cells and their receptors in type I myofibres. (F) Heatmap of ligand‐receptor interaction scores. Results show that the interactions between ligands in resident cells and their receptors in type II myofibres.
Using same strategy, we then investigated the communications from resident cells to myofibres. Overall, there were 85 interaction pairs in normal muscles and 25 pairs in denervated muscles, indicating that denervation also reduced communications from resident cells to myofibres (Figure 8D). In normal muscles, we predicted several cross‐talks from macrophages to type I myofibres through the interaction between Itga4, Fn1, Ptprc, and transferrin receptor (Tfrc); however, these interaction signals were largely inhibited by denervation (Figure 8E). Because Tfrc had been demonstrated critical for muscle development and metabolism, 27 the results suggest that macrophages may play a critical role in maintaining normal muscle homeostasis. Meanwhile, we noticed that denervation provoked the expression of certain ligands in macrophages that could have aberrant effects on myofibres. For instance, the scores of Adma17‐Erbb4 pair between macrophages and type I myofibre increased upon denervation and ErbB signalling reportedly promoted muscle atrophy in mice with denervation (Figure 8E). 28 FAPs are the largest population of resident cells and they are able to secrete both pro‐myogenic and pro‐atrophic factors depend on the environmental changes. 29 In normal muscle, we identified interaction pairs including Pkd1, Fbn1, Lama1/2, Bmp1, Nid1, and Col1a1, which enable cross‐talks from FAPs to type II myofibres. In response to denervation, the strength of these interactions was decreased (Figure 8F). For example, Bmp1‐Bmpr1a/b mediated FAPs to myofibres communication were largely suppressed by denervation. Because receptor Bmpr1a/b transduces an anabolic signal in myofibres, 30 the impairment of this interaction could contribute to myofibre atrophy following denervation. Taken together, our interaction network analyses indicate that denervation suppresses the overall intracellular communications in muscles, whereas also provokes the expression of pro‐atrophic factors in resident cells that could contribute to muscle atrophy induced by denervation.
Discussion
Skeletal muscle exhibits tremendous plasticity to adapt to changes in the environment, a process involving protein synthesis and degradation, metabolic reprogramming, and tissue remodelling. This capability is fully manifested in denervated muscle. Type I myofibres, which support endurance activity, are known to be profoundly affected by denervation 31 ; our snRNA‐seq not only supported this conclusion but also evidenced even more robust transcription profile changes in type II fibres, which manifested as a dramatic shifting of the type IIb2 trajectory upon denervation (Figure 2). Moreover, the proportion of type IIb2 myonuclei was increased in conjunction with decreased proportions of type IIa/x myonuclei. Existing evidence supports that myonuclei are not lost during muscle atrophy, 32 thus the observed proportion changes indicate the occurrence of myonuclear type transitions (such as type IIa to type IIb2). Thus, we propose that such transitions could be the root mechanism underpinning muscle plasticity.
We characterized the metabolic landscape of myofibres and their adaptive responses to denervation. Consistent with previous studies, 2 in normal muscles, we found type I and type IIa myonuclei to be characterized by higher activities in oxidative phosphorylation, the TCA cycle, and lipid metabolism, while type IIx and type IIb myonuclei primarily rely on glycolysis and gluconeogenesis. In response to denervation, major metabolic pathways were largely down‐regulated, which raises the possibility that myofibres adapt to the unfavourable environment by reducing their overall energy demands and entering an inactive state. The observation that denervation suppresses the expression of both oxidative and glycolytic metabolism related genes adds an amendment to existing notion that denervation induces an oxidative to glycolytic fibre type switch. 31 This could be due to our prediction being based on gene expression profiles, which do not fully reflect the actual enzyme activities. Overall, our results indicate that the decrease in metabolism is an important aspect of skeletal muscle adaptive responses upon denervation, which in turn could contribute to muscle atrophy. 33
We further ascertained the gene regulatory networks which drive cell type‐specific transcriptomes under normal and denervated conditions. Muscle atrophy is mediated by a transcription‐dependent programme involving the up‐regulation or down‐regulation of a group of atrophy‐related genes, such as Trim63 and Fbxo32. 34 Indeed, the activities of the Foxo3, Runx1, and Mef2a regulons were robustly increased in the type IIb1/2 myonuclei of denervated muscles (Figure S3A), consistent with previous reports that these TFs are important regulators of atrophy‐related genes expression and muscle atrophy. 35 The effects of other regulons in the pathogenesis of muscle atrophy remain unidentified. Robo2 and Meis1 are known to be essential for embryonic skeletal muscle development 36 , 37 ; activation of their regulons in denervation implicates activation of an early developmental programme in the pathogenesis of muscle atrophy. 26 Bhlhe40 has been shown to control oxidative metabolism in myogenic cells, 38 while Elk4 has been reported to be a target gene downstream of MAPKs. Zfp369 belongs to the krueppel C2H2‐type zinc‐finger protein family and has been proposed to act as a transcription repressor. 39 Validation of these TF‐related regulons as promoting atrophy‐related genes expression and consequent muscle atrophy would add novel members to the atrophy paradigm.
Our results provide detailed insights into the transcriptome repertoire of muscle cells, including both type I and type II myofibres, and muscle‐resident cells in the scenario of muscle atrophy. The results also highlight potential cellular and molecular targets for combating muscle atrophy induced by denervation or, perhaps, other related catabolic conditions.
Funding
This work was supported by National Institutes of Health grants (R56AR063686 and R01DK037175 to Z.H).
Conflict of interest
All authors declare no conflicting financial interests. The authors of this manuscript certify that they comply with the ethical guidelines for authorship and publishing in the Journal of Cachexia, Sarcopenia and Muscle. 40
Supporting information
Data S1. Supporting information
Table S1. Regulon activities of type II myonuclei.
Table S2. DEGs of type I myonuclei (Denervation vs Normal).
Table S3. Ligand and receptor pairs in normal muscle
Figure S1 UMAP of clustering on sample sources and signature genes identification.
(A) Gastrocnemius muscle weight (normalized to tibia length) in normal and denervated conditions (n=10). Data are presented as mean ± SEM. Student's t‐test.
(B) Uniform Manifold Approximation and Projection (UMAP) plot displaying the unsupervised clusters in Seurat (resolution=2.0). Each cluster is color coded.
(C) Dot plot showing the expression of cell identities in unsupervised clusters. Dot size represents the percentage of nuclei expressing a gene. Dot size represents the percentage of nuclei expressing a gene. The color intensity of dot indicates gene expression level and darker indicates higher expression level.
(D) Combinational visualization of the normal and denervated nuclei clusters on UMAP. Each cluster is labeled with nuclear types.
(E) Heatmap showing the top 5 signature genes of each cluster, identified by Seurat “FindAllMarkers” function across the whole dataset (logfc>0.25, min. pct>0.25).
(F) Heatmap showing the top 20 signature genes of myonuclei and unclassified cluster, identified by Seurat “FindAllMarkers” function between normal myonuclei (Type I, Type IIa, Type IIx, Type IIb1, Type IIb2) and normal unclassified nuclei (logfc>0.25, min. pct>0.25).
Figure S2. Transcriptional changes in type IIb2 myonuclei respond to denervation.
(A) Left panel: UMAP plot displaying all titin positive myonuclei using monocle 3. The color intensity of dot indicates titin expression level and darker indicates higher expression level. Middle and right panel: UMAP plots with pseudotime trajectories of titin positive myonuclei obtained from normal and denervated muscles. Nuclei are colored according to their cluster assignments. The black lines on the UMAP plots represent branched trajectories. Each point denotes a single nucleus.
(B) Violin plot showing selected gene expression in type IIb1 and b2 myonuclei. Wilcoxon ranksum test.
(C) Immunofluorescence staining of Plxdc2 (green, signature gene for type IIb2 nuclei) and Smox (red, signature gene for type IIb1 nuclei) in MYH7‐negative type II fibers. Nuclei were labeled with DAPI (blue).
(D) Comparison of denervation induced gene expression in different type of myonuclei. Violin plot with Wilcoxon rank‐sum test.
(E) GSEA plots showing enrichment scores (ES) of the enriched hallmark gene sets in type IIb2 myonuclei. NES: normalized enrichment score; FDR: false discovery rate.
Figure S3. Regulons modulating type I and II myonuclei in normal and denervated muscles.
(A) Heatmap showing the activity scores of total regulons (147) driving different myonuclei subtypes. The color scale represents the normalized scores of activities: red denotes high level of activity while blue indicates low level of activity. The number in parentheses represents the count of downstream target genes in corresponding regulons.
(B) t‐SNE on the binary regulon activity matrix showing that the regulon activity in type IIb2 myonuclei was suppressed (upper panel) or enhanced (lower panel) by denervation.
Figure S4. Transcriptomic changes of type I myonuclei in response to denervation.
(A) Violin plot showing the significantly changed genes (logfc>0.25, min. pct>0.25, p < 0.001) between normal (blue) and denervated (pink) type I myonuclei. N: normal; D: denervation. Upper panel: up‐regulated DEGs; Lower panel: down‐regulated DEGs.
(B) GSEA plots showing the enrichment score (ES) of significant enriched hallmark gene sets in type I myonuclei. NES: normalized enrichment score; FDR: false discovery rate.
Figure S5. Denervation induced changes of regulon activity in FAPs.
(A) Dot plot displaying the average expression level of previous known FAPs identities in 3 FAPs subtypes. Dot size represents the percentage of FAPs expressing a gene within the subtype. The color intensity of the dot indicates gene expression level and darker color indicates higher expression level.
(B) Heatmap showing the changes in activity scores of regulons (297) in FAPs subtypes between normal and denervation. The color scale represents the normalized scores of regulon activity: red indicates high level of activity and blue indicates low level of activity. The number in parentheses represents the count of downstream target genes in corresponding regulons.
Figure S6. The alteration of expression profile in denervated macrophages
(A) DEGs of muscle‐resident macrophages and monocyte‐derived macrophages in normal and denervated muscle.
Figure S7. Transcriptomic responses of muscle stem cells (MuSCs) to denervation.
(A) UMAP showing the trajectory of MuSCs from normal (blue, n=110) and denervated (pink, n=98) muscles.
(B) Heatmap displaying the top 20 DEGs between normal and denervated MuSCs. The color scale represents the relative level of gene expression: dark blue indicates low level and red indicates high level of expression.
(C) Changes in expression of select genes in MuSCs along the pseudotime trajectory. Each point indicates a nucleus. The color intensity represents log2 expression value of the expressed gene; darker color indicates higher expression level.
(D) Significantly enriched KEGG pathways in MuSCs from denervated muscles (p < 0.05). The color scale indicates the significant level of enrichment (adjust p value). Dot size represents counts of genes enriched in the pathway.
(E) GSEA plots showing the significantly enriched GO gene sets in MuSCs. GO, Gene Ontology; NES: normalized enrichment score; FDR: false discovery rate.
(F) Heatmap showing top changed regulons between normal and denervated MuSCs. The color scale represents the normalized scores of regulon activity: dark blue indicates low level of activity and red indicates high level of activity. The number in parentheses represents the count of downstream target genes in corresponding regulons.
(G) Left panel: t‐SNE on binary regulon activity matrix identifying two closely related clusters, representing normal (purple) and denervated (red) MuSCs, respectively. Right panel: t‐SNE showing active regulons in MuSCs form normal and denervated muscles. Each dot represents a nucleus with its regulon activity
Figure S8. Transcriptional heterogeneity of endothelial cells (ECs) and pericytes in response to denervation.
(A) UMAP visualizing 4 subclusters of ECs colored according to their identified subtypes. Art: arteriole endothelial cells; Cap: capillary endothelial cells; Ven: venule endothelial cells; Lym: lymphatic endothelial cells.
(B) Dot plot displaying the cell identities of 4 ECs subtypes in normal muscles. Dot size represents the percentage of cells expressing a gene within the subtype. The color intensity of dot indicates gene expression level and darker indicates higher expression level.
(C) Changes in proportions of ECs subtypes in normal and denervated muscles. Different color codes represent the corresponding subtypes described as (A).
(D) Trajectory of ECs from normal and denervated muscles. Left panel: The nuclei mapped on the path are colored according to conditions (normal: blue; denervation: pink). Right panel: The nuclei mapped on the path are colored by identified subtypes.
(E) Significant enriched KEGG pathways (p < 0.01) of DEGs between normal and denervated capillary ECs. The color scale indicates the significance level of enrichment (adjust p value). Dot size represents counts of genes enriched in the pathway.
(F) GSEA plots showing enrichment score (ES) of the significant enriched hallmark gene sets in capillary ECs. NES: normalized enrichment score; FDR: false discovery rate.
(G) The trajectory of pericytes from normal (blue) and denervated (pink) muscles.
(H) Violin plot displaying the difference in expression of select DEGs between normal (blue) and denervated (pink) pericytes. N: normal; D: denervation. Wilcoxon Rank Sum test: min.pct = 0.25, logfc.threshold = 0.25. Significance level: *** p < 0.001.
(I) The significant enriched hallmark gene sets identified by GSAE analysis in pericytes. Dot size indicates the significant level of enrichment (‐log p‐value). The color scale represents FDR value.
Figure S9. Cell‐cell communications in skeletal muscle mediated by ligand‐receptor (L‐R) interactions
(A) Chrod plot displaying potential ligand‐receptor (L‐R) interaction pairs between cells in normal muscles. A L‐R interaction model was used to calculate the scores of L‐R pairs based on the expression levels of ligands and receptors. All types of cells function as either sender (ligand expressing) or receiver (receptor expressing) cells. Only differentially expressed ligands and receptors (logfc>0.25, min. pct>0.25) are considered for further analysis. The detected ligands are listed below the dash line, and receptors are listed above the dash line. Each cell type is colorcoded.
(B) Chrod plot displaying potential L‐R interaction pairs between cells in denervated muscles.
Lin H., Ma X., Sun Y., Peng H., Wang Y., Thomas S. S., and Hu Z. (2022) Decoding the transcriptome of denervated muscle at single‐nucleus resolution, Journal of Cachexia, Sarcopenia and Muscle, 13, 2102–2117, 10.1002/jcsm.13023
References
- 1. Baskin KK, Winders BR, Olson EN. Muscle as a "mediator" of systemic metabolism. Cell Metab 2015;21:237–248. [DOI] [PMC free article] [PubMed] [Google Scholar]
- 2. Schiaffino S, Reggiani C. Fiber types in mammalian skeletal muscles. Physiol Rev 2011;91:1447–1531. [DOI] [PubMed] [Google Scholar]
- 3. De Micheli AJ, Laurilliard EJ, Heinke CL, Ravichandran H, Fraczek P, Soueid‐Baumgarten S, et al. Single‐Cell Analysis of the Muscle Stem Cell Hierarchy Identifies Heterotypic Communication Signals Involved in Skeletal Muscle Regeneration. Cell Rep 2020;30:3583–3595, e5. [DOI] [PMC free article] [PubMed] [Google Scholar]
- 4. Rubenstein AB, Smith GR, Raue U, Begue G, Minchev K, Ruf‐Zamojski F, et al. Single‐cell transcriptional profiles in human skeletal muscle. Sci Rep 2020;10:229. [DOI] [PMC free article] [PubMed] [Google Scholar]
- 5. Nicoletti C, Wei X, Etxaniz U, Proietti D, Madaro L, Puri PL. scRNA‐seq‐based analysis of skeletal muscle response to denervation reveals selective activation of muscle‐resident glial cells and fibroblasts. bioRxiv. 2020; 2020.12.29.424762.
- 6. Dos Santos M, Backer S, Saintpierre B, Izac B, Andrieu M, Letourneur F, et al. Single‐nucleus RNA‐seq and FISH identify coordinated transcriptional activity in mammalian myofibers. Nat Commun 2020;11:5102. [DOI] [PMC free article] [PubMed] [Google Scholar]
- 7. Petrany MJ, Swoboda CO, Sun C, Chetal K, Chen X, Weirauch MT, et al. Single‐nucleus RNA‐seq identifies transcriptional heterogeneity in multinucleated skeletal myofibers. Nat Commun 2020;11:6374. [DOI] [PMC free article] [PubMed] [Google Scholar]
- 8. Burns TM, Graham CD, Rose MR, Simmons Z. Quality of life and measures of quality of life in patients with neuromuscular disorders. Muscle Nerve 2012;46:9–25. [DOI] [PubMed] [Google Scholar]
- 9. Madaro L, Passafaro M, Sala D, Etxaniz U, Lugarini F, Proietti D, et al. Denervation‐activated STAT3‐IL‐6 signalling in fibro‐adipogenic progenitors promotes myofibres atrophy and fibrosis. Nat Cell Biol 2018;20:917–927. [DOI] [PMC free article] [PubMed] [Google Scholar]
- 10. Krishnaswami SR, Grindberg RV, Novotny M, Venepally P, Lacar B, Bhutani K, et al. Using single nuclei for RNA‐seq to capture the transcriptome of postmortem neurons. Nat Protoc 2016;11:499–524. [DOI] [PMC free article] [PubMed] [Google Scholar]
- 11. Si M, Wang Q, Li Y, Lin H, Luo D, Zhao W, et al. Inhibition of hyperglycolysis in mesothelial cells prevents peritoneal fibrosis. Sci Transl Med 2019;11:eaav5341. [DOI] [PubMed] [Google Scholar]
- 12. Bodine SC, Latres E, Baumhueter S, Lai VK, Nunez L, Clarke BA, et al. Identification of ubiquitin ligases required for skeletal muscle atrophy. Science 2001;294:1704–1708. [DOI] [PubMed] [Google Scholar]
- 13. Wang X, Blagden C, Fan J, Nowak SJ, Taniuchi I, Littman DR, et al. Runx1 prevents wasting, myofibrillar disorganization, and autophagy of skeletal muscle. Genes Dev 2005;19:1715–1722. [DOI] [PMC free article] [PubMed] [Google Scholar]
- 14. Ebert SM, Dyle MC, Kunkel SD, Bullard SA, Bongers KS, Fox DK, et al. Stress‐induced skeletal muscle Gadd45a expression reprograms myonuclei and causes muscle atrophy. J Biol Chem 2012;287:27290–27301. [DOI] [PMC free article] [PubMed] [Google Scholar]
- 15. Aibar S, Gonzalez‐Blas CB, Moerman T, Huynh‐Thu VA, Imrichova H, Hulselmans G, et al. SCENIC: single‐cell regulatory network inference and clustering. Nat Methods 2017;14:1083–1086. [DOI] [PMC free article] [PubMed] [Google Scholar]
- 16. Romanello V, Guadagnin E, Gomes L, Roder I, Sandri C, Petersen Y, et al. Mitochondrial fission and remodelling contributes to muscle atrophy. EMBO J 2010;29:1774–1785. [DOI] [PMC free article] [PubMed] [Google Scholar]
- 17. Zhang G, Jin B, Li YP. C/EBPbeta mediates tumour‐induced ubiquitin ligase atrogin1/MAFbx upregulation and muscle wasting. EMBO J 2011;30:4323–4335. [DOI] [PMC free article] [PubMed] [Google Scholar]
- 18. Tan‐Chen S, Guitton J, Bourron O, Le Stunff H, Hajduch E. Sphingolipid Metabolism and Signaling in Skeletal Muscle: From Physiology to Physiopathology. Front Endocrinol (Lausanne) 2020;11:491. [DOI] [PMC free article] [PubMed] [Google Scholar]
- 19. Lemos DR, Babaeijandaghi F, Low M, Chang CK, Lee ST, Fiore D, et al. Nilotinib reduces muscle fibrosis in chronic muscle injury by promoting TNF‐mediated apoptosis of fibro/adipogenic progenitors. Nat Med 2015;21:786–794. [DOI] [PubMed] [Google Scholar]
- 20. Contreras O, Soliman H, Theret M, Rossi FMV, Brandan E. TGF‐beta‐driven downregulation of the transcription factor TCF7L2 affects Wnt/beta‐catenin signaling in PDGFRalpha(+) fibroblasts. J Cell Sci 2020;133. [DOI] [PubMed] [Google Scholar]
- 21. Ayala‐Sumuano JT, Velez‐Delvalle C, Beltran‐Langarica A, Marsch‐Moreno M, Cerbon‐Solorzano J, Kuri‐Harcuch W. Srebf1a is a key regulator of transcriptional control for adipogenesis. Sci Rep 2011;1:178. [DOI] [PMC free article] [PubMed] [Google Scholar]
- 22. Soucie EL, Weng Z, Geirsdottir L, Molawi K, Maurizio J, Fenouil R, et al. Lineage‐specific enhancers activate self‐renewal genes in macrophages and embryonic stem cells. Science 2016;351:aad5510. [DOI] [PMC free article] [PubMed] [Google Scholar]
- 23. Kastner S, Elias MC, Rivera AJ, Yablonka‐Reuveni Z. Gene expression patterns of the fibroblast growth factors and their receptors during myogenesis of rat satellite cells. J Histochem Cytochem 2000;48:1079–1096. [DOI] [PubMed] [Google Scholar]
- 24. Tang K, Breen EC, Gerber HP, Ferrara NM, Wagner PD. Capillary regression in vascular endothelial growth factor‐deficient skeletal muscle. Physiol Genomics 2004;18:63–69. [DOI] [PubMed] [Google Scholar]
- 25. Wagatsuma A, Tamaki H, Ogita F. Capillary supply and gene expression of angiogenesis‐related factors in murine skeletal muscle following denervation. Exp Physiol 2005;90:403–409. [DOI] [PubMed] [Google Scholar]
- 26. Ehmsen JT, Hoke A. Cellular and molecular features of neurogenic skeletal muscle atrophy. Exp Neurol 2020;331:113379. [DOI] [PubMed] [Google Scholar]
- 27. Barrientos T, Laothamatas I, Koves TR, Soderblom EJ, Bryan M, Moseley MA, et al. Metabolic Catastrophe in Mice Lacking Transferrin Receptor in Muscle. EBioMedicine 2015;2:1705–1717. [DOI] [PMC free article] [PubMed] [Google Scholar]
- 28. Nicolino S, Panetto A, Raimondo S, Gambarotta G, Guzzini M, Fornaro M, et al. Denervation and reinnervation of adult skeletal muscle modulate mRNA expression of neuregulin‐1 and ErbB receptors. Microsurgery 2009;29:464–472. [DOI] [PubMed] [Google Scholar]
- 29. Uezumi A, Fukada S, Yamamoto N, Takeda S, Tsuchida K. Mesenchymal progenitors distinct from satellite cells contribute to ectopic fat cell formation in skeletal muscle. Nat Cell Biol 2010;12:143–152. [DOI] [PubMed] [Google Scholar]
- 30. Winbanks CE, Chen JL, Qian H, Liu Y, Bernardo BC, Beyer C, et al. The bone morphogenetic protein axis is a positive regulator of skeletal muscle mass. J Cell Biol 2013;203:345–357. [DOI] [PMC free article] [PubMed] [Google Scholar]
- 31. Ciciliot S, Rossi AC, Dyar KA, Blaauw B, Schiaffino S. Muscle type and fiber type specificity in muscle wasting. Int J Biochem Cell Biol 2013;45:2191–2199. [DOI] [PubMed] [Google Scholar]
- 32. Bruusgaard JC, Gundersen K. In vivo time‐lapse microscopy reveals no loss of murine myonuclei during weeks of muscle atrophy. J Clin Invest 2008;118:1450–1457. [DOI] [PMC free article] [PubMed] [Google Scholar]
- 33. Romanello V, Sandri M. The connection between the dynamic remodeling of the mitochondrial network and the regulation of muscle mass. Cell Mol Life Sci 2021;78:1305–1328. [DOI] [PMC free article] [PubMed] [Google Scholar]
- 34. Sartori R, Romanello V, Sandri M. Mechanisms of muscle atrophy and hypertrophy: implications in health and disease. Nat Commun 2021;12:330. [DOI] [PMC free article] [PubMed] [Google Scholar]
- 35. Milan G, Romanello V, Pescatore F, Armani A, Paik JH, Frasson L, et al. Regulation of autophagy and the ubiquitin‐proteasome system by the FoxO transcriptional network during muscle atrophy. Nat Commun 2015;6:6670. [DOI] [PMC free article] [PubMed] [Google Scholar]
- 36. Grade CVC, Mantovani CS, Fontoura MA, Yusuf F, Brand‐Saberi B, Alvares LE CREB. NF‐Y and MEIS1 conserved binding sites are essential to balance Myostatin promoter/enhancer activity during early myogenesis. Mol Biol Rep 2017;44:419–427. [DOI] [PubMed] [Google Scholar]
- 37. Halperin‐Barlev O, Kalcheim C. Sclerotome‐derived Slit1 drives directional migration and differentiation of Robo2‐expressing pioneer myoblasts. Development 2011;138:2935–2945. [DOI] [PubMed] [Google Scholar]
- 38. Chang HC, Kao CH, Chung SY, Chen WC, Aninda LP, Chen YH, et al. Bhlhe40 differentially regulates the function and number of peroxisomes and mitochondria in myogenic cells. Redox Biol 2019;20:321–333. [DOI] [PMC free article] [PubMed] [Google Scholar]
- 39. Benzel I, Barde YA, Casademunt E. Strain‐specific complementation between NRIF1 and NRIF2, two zinc finger proteins sharing structural and biochemical properties. Gene 2001;281:19–30. [DOI] [PubMed] [Google Scholar]
- 40. von Haehling S, Coats AJS, Anker SD. Ethical guidelines for publishing in the Journal of Cachexia, Sarcopenia and Muscle: update 2021. J Cachexia Sarcopenia Muscle 2021;12:2259–2261. [DOI] [PMC free article] [PubMed] [Google Scholar]
Associated Data
This section collects any data citations, data availability statements, or supplementary materials included in this article.
Supplementary Materials
Data S1. Supporting information
Table S1. Regulon activities of type II myonuclei.
Table S2. DEGs of type I myonuclei (Denervation vs Normal).
Table S3. Ligand and receptor pairs in normal muscle
Figure S1 UMAP of clustering on sample sources and signature genes identification.
(A) Gastrocnemius muscle weight (normalized to tibia length) in normal and denervated conditions (n=10). Data are presented as mean ± SEM. Student's t‐test.
(B) Uniform Manifold Approximation and Projection (UMAP) plot displaying the unsupervised clusters in Seurat (resolution=2.0). Each cluster is color coded.
(C) Dot plot showing the expression of cell identities in unsupervised clusters. Dot size represents the percentage of nuclei expressing a gene. Dot size represents the percentage of nuclei expressing a gene. The color intensity of dot indicates gene expression level and darker indicates higher expression level.
(D) Combinational visualization of the normal and denervated nuclei clusters on UMAP. Each cluster is labeled with nuclear types.
(E) Heatmap showing the top 5 signature genes of each cluster, identified by Seurat “FindAllMarkers” function across the whole dataset (logfc>0.25, min. pct>0.25).
(F) Heatmap showing the top 20 signature genes of myonuclei and unclassified cluster, identified by Seurat “FindAllMarkers” function between normal myonuclei (Type I, Type IIa, Type IIx, Type IIb1, Type IIb2) and normal unclassified nuclei (logfc>0.25, min. pct>0.25).
Figure S2. Transcriptional changes in type IIb2 myonuclei respond to denervation.
(A) Left panel: UMAP plot displaying all titin positive myonuclei using monocle 3. The color intensity of dot indicates titin expression level and darker indicates higher expression level. Middle and right panel: UMAP plots with pseudotime trajectories of titin positive myonuclei obtained from normal and denervated muscles. Nuclei are colored according to their cluster assignments. The black lines on the UMAP plots represent branched trajectories. Each point denotes a single nucleus.
(B) Violin plot showing selected gene expression in type IIb1 and b2 myonuclei. Wilcoxon ranksum test.
(C) Immunofluorescence staining of Plxdc2 (green, signature gene for type IIb2 nuclei) and Smox (red, signature gene for type IIb1 nuclei) in MYH7‐negative type II fibers. Nuclei were labeled with DAPI (blue).
(D) Comparison of denervation induced gene expression in different type of myonuclei. Violin plot with Wilcoxon rank‐sum test.
(E) GSEA plots showing enrichment scores (ES) of the enriched hallmark gene sets in type IIb2 myonuclei. NES: normalized enrichment score; FDR: false discovery rate.
Figure S3. Regulons modulating type I and II myonuclei in normal and denervated muscles.
(A) Heatmap showing the activity scores of total regulons (147) driving different myonuclei subtypes. The color scale represents the normalized scores of activities: red denotes high level of activity while blue indicates low level of activity. The number in parentheses represents the count of downstream target genes in corresponding regulons.
(B) t‐SNE on the binary regulon activity matrix showing that the regulon activity in type IIb2 myonuclei was suppressed (upper panel) or enhanced (lower panel) by denervation.
Figure S4. Transcriptomic changes of type I myonuclei in response to denervation.
(A) Violin plot showing the significantly changed genes (logfc>0.25, min. pct>0.25, p < 0.001) between normal (blue) and denervated (pink) type I myonuclei. N: normal; D: denervation. Upper panel: up‐regulated DEGs; Lower panel: down‐regulated DEGs.
(B) GSEA plots showing the enrichment score (ES) of significant enriched hallmark gene sets in type I myonuclei. NES: normalized enrichment score; FDR: false discovery rate.
Figure S5. Denervation induced changes of regulon activity in FAPs.
(A) Dot plot displaying the average expression level of previous known FAPs identities in 3 FAPs subtypes. Dot size represents the percentage of FAPs expressing a gene within the subtype. The color intensity of the dot indicates gene expression level and darker color indicates higher expression level.
(B) Heatmap showing the changes in activity scores of regulons (297) in FAPs subtypes between normal and denervation. The color scale represents the normalized scores of regulon activity: red indicates high level of activity and blue indicates low level of activity. The number in parentheses represents the count of downstream target genes in corresponding regulons.
Figure S6. The alteration of expression profile in denervated macrophages
(A) DEGs of muscle‐resident macrophages and monocyte‐derived macrophages in normal and denervated muscle.
Figure S7. Transcriptomic responses of muscle stem cells (MuSCs) to denervation.
(A) UMAP showing the trajectory of MuSCs from normal (blue, n=110) and denervated (pink, n=98) muscles.
(B) Heatmap displaying the top 20 DEGs between normal and denervated MuSCs. The color scale represents the relative level of gene expression: dark blue indicates low level and red indicates high level of expression.
(C) Changes in expression of select genes in MuSCs along the pseudotime trajectory. Each point indicates a nucleus. The color intensity represents log2 expression value of the expressed gene; darker color indicates higher expression level.
(D) Significantly enriched KEGG pathways in MuSCs from denervated muscles (p < 0.05). The color scale indicates the significant level of enrichment (adjust p value). Dot size represents counts of genes enriched in the pathway.
(E) GSEA plots showing the significantly enriched GO gene sets in MuSCs. GO, Gene Ontology; NES: normalized enrichment score; FDR: false discovery rate.
(F) Heatmap showing top changed regulons between normal and denervated MuSCs. The color scale represents the normalized scores of regulon activity: dark blue indicates low level of activity and red indicates high level of activity. The number in parentheses represents the count of downstream target genes in corresponding regulons.
(G) Left panel: t‐SNE on binary regulon activity matrix identifying two closely related clusters, representing normal (purple) and denervated (red) MuSCs, respectively. Right panel: t‐SNE showing active regulons in MuSCs form normal and denervated muscles. Each dot represents a nucleus with its regulon activity
Figure S8. Transcriptional heterogeneity of endothelial cells (ECs) and pericytes in response to denervation.
(A) UMAP visualizing 4 subclusters of ECs colored according to their identified subtypes. Art: arteriole endothelial cells; Cap: capillary endothelial cells; Ven: venule endothelial cells; Lym: lymphatic endothelial cells.
(B) Dot plot displaying the cell identities of 4 ECs subtypes in normal muscles. Dot size represents the percentage of cells expressing a gene within the subtype. The color intensity of dot indicates gene expression level and darker indicates higher expression level.
(C) Changes in proportions of ECs subtypes in normal and denervated muscles. Different color codes represent the corresponding subtypes described as (A).
(D) Trajectory of ECs from normal and denervated muscles. Left panel: The nuclei mapped on the path are colored according to conditions (normal: blue; denervation: pink). Right panel: The nuclei mapped on the path are colored by identified subtypes.
(E) Significant enriched KEGG pathways (p < 0.01) of DEGs between normal and denervated capillary ECs. The color scale indicates the significance level of enrichment (adjust p value). Dot size represents counts of genes enriched in the pathway.
(F) GSEA plots showing enrichment score (ES) of the significant enriched hallmark gene sets in capillary ECs. NES: normalized enrichment score; FDR: false discovery rate.
(G) The trajectory of pericytes from normal (blue) and denervated (pink) muscles.
(H) Violin plot displaying the difference in expression of select DEGs between normal (blue) and denervated (pink) pericytes. N: normal; D: denervation. Wilcoxon Rank Sum test: min.pct = 0.25, logfc.threshold = 0.25. Significance level: *** p < 0.001.
(I) The significant enriched hallmark gene sets identified by GSAE analysis in pericytes. Dot size indicates the significant level of enrichment (‐log p‐value). The color scale represents FDR value.
Figure S9. Cell‐cell communications in skeletal muscle mediated by ligand‐receptor (L‐R) interactions
(A) Chrod plot displaying potential ligand‐receptor (L‐R) interaction pairs between cells in normal muscles. A L‐R interaction model was used to calculate the scores of L‐R pairs based on the expression levels of ligands and receptors. All types of cells function as either sender (ligand expressing) or receiver (receptor expressing) cells. Only differentially expressed ligands and receptors (logfc>0.25, min. pct>0.25) are considered for further analysis. The detected ligands are listed below the dash line, and receptors are listed above the dash line. Each cell type is colorcoded.
(B) Chrod plot displaying potential L‐R interaction pairs between cells in denervated muscles.