

Summary
After polyploidization originated from one interspecific hybridization event in Gossypium, Gossypium barbadense evolved to produce extra‐long staple fibres than Gossypium hirsutum (Upland cotton), which produces a higher fibre yield. The genomic diversity between G. barbadense and G. hirsutum thus provides a genetic basis for fibre trait variation. Recently, rapid accumulation of gene disruption or deleterious mutation was reported in allotetraploid cotton genomes, with unknown impacts on fibre traits. Here, we identified gene disruptions in allotetraploid G. hirsutum (18.14%) and G. barbadense (17.38%) through comparison with their presumed diploid progenitors. Relative to conserved genes, these disrupted genes exhibited faster evolution rate, lower expression level and altered gene co‐expression networks. Within a module regulating fibre elongation, a hub gene experienced gene disruption in G. hirsutum after polyploidization, with a 2‐bp deletion in the coding region of GhNPLA1D introducing early termination of translation. This deletion was observed in all of the 34 G. hirsutum landraces and 36 G. hirsutum cultivars, but not in 96% of 57 G. barbadense accessions. Retrieving the disrupted gene GhNPLA1D using its homoeolog GhNPLA1A achieved longer fibre length in G. hirsutum. Further enzyme activity and lipids analysis confirmed that GhNPLA1A encodes a typical phospholipase A and promotes cotton fibre elongation via elevating intracellular levels of linolenic acid and 34:3 phosphatidylinositol. Our work opens a strategy for identifying disrupted genes and retrieving their functions in ways that can provide valuable resources for accelerating fibre trait enhancement in cotton breeding.
Keywords: Gossypium, Disrupted gene, Phospholipase A, Fibre elongation, Linolenic acid
Introduction
Two allotetraploid cotton species were domesticated independently, each offering superior traits relative to their diploid ancestors. More specifically, Gossypium hirsutum (2n = 4x = 52, AD1) is characterized by high‐yield properties and its cultivars dominate more than 90% of worldwide cotton production, while G. barbadense (2n = 4x = 52, AD2) is characterized by strong and fine fibres with extra‐long staples, which accounts for less than 10% of cotton global production (Wendel et al., 2010). The polyploid vigour and hybrid vigour of fibre traits in allotetraploid cotton cultivars result from the orchestrated effects of genome structural variations after polyploidization, in addition to natural and human selection (Adams and Wendel, 2005). However, the genetic and molecular basis for the interspecies divergence in fibre traits remains largely unknown, which presents a barrier in breeding cotton with superior fibre traits.
Previously, we characterized interspecies introgression events between G. hirsutum and G. barbadense, which had significant impacts on fibre yield and quality traits in G. barbadense populations (Fang et al., 2021). Notably, after polyploidization/whole‐genome duplication (WGD), some of the redundant genes were lost over the course of a few million years (Lynch and Conery, 2000). The most recent evolutionary analysis on the Gossypium genus reported that disrupted genes, also termed genes with deleterious mutations, have accumulated faster in allotetraploid cotton than in diploid species (Conover and Wendel, 2022). However, the precise effects of these disrupted genes on fibre traits have yet to be elucidated.
Cotton fibre comprises single‐celled trichomes derived from the ovule epidermis, and its development consists of four overlapping stages: initiation, rapid elongation, secondary wall thickening and maturation (Chen and Guan, 2011; Graves and Stewart, 1988; Kim and Triplett, 2001). Both transcriptome and metabolism analyses have indicated that lipid transportation and metabolic processing occur proactively during the initiation and elongation stages (Gou et al., 2007; Guan et al., 2011; Hu et al., 2019). During rapid elongation, the primary cell wall of the fibre is extended through rapid assembly of plasma membranes and vacuole development, which imposes a huge demand for phospholipids (Wanjie et al., 2005). Phospholipids and their derivatives such as linolenic acid, 34:3 phosphatidylinositol (PI) and PI‐4 monophosphate also promote cotton fibre elongation in their roles as signal molecules (Liu et al., 2015). Therefore, the network regulating phospholipid metabolism also plays a critical role in cotton fibre development, though it yet remains understudied.
Here, we characterized the disrupted genes in allotetraploid cotton species G. hirsutum and G. barbadense by comparing the coding sequences and protein structures of orthologs with their respective progenitor diploids. Disrupted genes showed significantly lower expression levels than conserved genes, and variation in their alternative expression was associated with fibre development stages in co‐expression networks, with enrichment of genes pertaining to fatty acid metabolic regulation. We further investigated the gene identified as a hub gene of fibre development, GhNPLA1 (novel cotton phospholipase A in G. hirsutum), which encodes a phospholipase A. In G. hirsutum populations, GhNPLA1D (GhNPLA1 from D subgenome) is disrupted by a 2‐bp deletion and exhibits low transcription level. We found that ectopic expression of GhNPLA1A (GhNPLA1 from A subgenome) can promote fibre elongation in transgenic lines of upland cotton. Enzyme activity and cotton fibre culture assays further demonstrated that the substrate of GhNPLA1A regulates fibre elongation directly. Thus, our study provides a strategy for trait enhancement of allopolyploid crops through the retrieval of disrupted genes.
Results
Identification and evolutionary trajectory of disrupted genes in the Gossypium lineage
To estimate the number of genes disrupted during cotton polyploidization and speciation, we utilized pairwise whole‐genome alignments of each allotetraploid and its presumed progenitor diploid genomes (Figure 1a). Using ANNOVAR (Wang et al., 2010) to annotate the genomic variation, a total of 17 925 variations in G. hirsutum and 17 886 in G. barbadense resulted in gene disruption through frameshift insertion (FI), frameshift deletion (FD), stop codon gain (SG) or stop codon loss (SL) (Table S1). Most genomic variations (97.62% in G. hirsutum and 96.63% G. barbadense) were confirmed by another software SnpEff (Cingolani et al., 2012), indicating high accuracy of genomic variation annotations. Disruption most frequently occurred through a SG event, followed by FD, FI and SL (Figure S1). We further constructed gene disruption maps of the allotetraploids, which contained 13 200 disrupted genes in G. hirsutum and 13 049 disrupted genes in G. barbadense (Figure S2).
Figure 1.
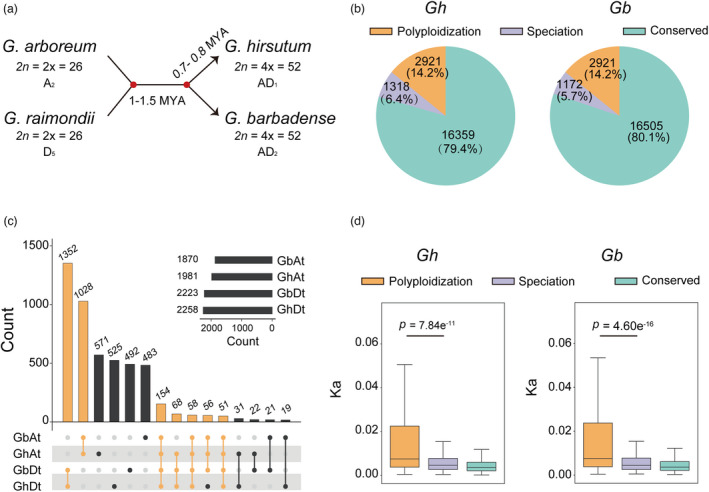
Identification of disrupted genes in Gossypium. (a) Schematic chart describing the materials of the diploids Gossypium arboreum (A2 genome, Ga) and Gossypium raimondii (D5 genome, Gr) and the tetraploids Gossypium hirsutum (AD1 genome, Gh) and Gossypium barbadense (AD2 genome, Gb). Numbers indicate genome divergence times. (b) Pie chart showing the proportion and number of disrupted genes associated with polyploidization and speciation. (c) Numbers indicate the genes disrupted in polyploidization and speciation. Bottom, numbers of disrupted genes with one‐to‐one relationships. Dots indicate disrupted genes. Lines indicate disrupted genes common in given species. (d) Box plot comparing the evolution of disrupted genes in polyploidization and speciation as indicated by synonymous substitution rate (Ks). Centre line, median; box limits, upper and lower quartiles; whiskers, 1.5× the interquartile range (***p < 0.001, ** p < 0.01 and * p < 0.05, two‐tailed Wilcox’s test).
The disrupted genes constituted 16%–17% of the genome, based on a set of 20 096 orthologous gene pairs (Table S2). A total of 2921 disrupted genes shared between G. hirsutum and G. barbadense (Gh‐Gb) (1289 from the A subgenome [At] and 1632 from the D subgenome [Dt]) were identified as related to Gossypium polyploidization (Figure 1b). Additionally, 1318 Gh‐specific disrupted genes and 1172 Gb‐specific disrupted genes were identified as related to allotetraploid speciation (Figure 1b, c and Table S2).
Disrupted genes related to polyploidization were found to have significantly higher average non‐synonymous (Ka)/synonymous (Ks), Ka, and Ks values than those related to Gb‐Gh speciation (Figure 1d and Figure S3). Synonymous substitution seems to be mainly neutral, and the disrupted genes related to polyploidization harboured more synonymous substitutions; this is consistent with previous studies of bacteria, in which gene loss occurs in a clocklike, time‐dependent manner (Snel et al., 2002).
Alternative expression of disrupted genes is associated with lipid metabolic progress during fibre development
We further evaluated the effect of gene disruption events on expression levels in different tissues (Table S3). In all 11 tissues examined, the average expression level of disrupted genes was significantly lower regardless of whether genes related to polyploidization or to Gb‐Gh speciation than the average expression of conserved genes (P < 2.2e‐16, Wilcox test) (Figure 2a, b). This trend is similar to the expression patterns of pseudogenes in Arabidopsis, which are on average shorter and less expressed than conserved genes (Yang et al., 2011).
Figure 2.
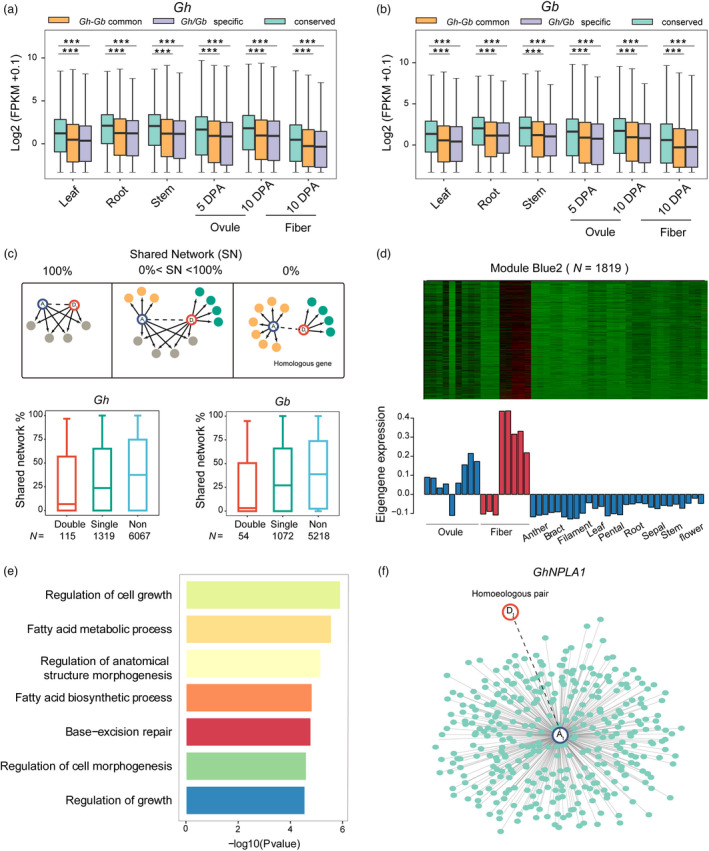
Alteration of the co‐expression networks associated with disrupted genes. (a, b) Comparison of expression levels between disrupted and conserved genes in G. hirsutum and G. barbadense. Leaf, root, stem, 5‐DPA (days post anthesis) ovule, 10‐DPA ovule and 10‐DPA fibre were selected as representative tissues. Centre line, median; box limits, upper and lower quartiles; whiskers, 1.5× the interquartile range; and dots, outliers (***p < 0.001, ** p < 0.01 and * p < 0.05, two‐tailed t test). (c) Network rewiring between homoeologous genes. Homoeologous genes may have common and unique connections (arrows). Pairs were grouped into whole‐share (left), part‐share (middle) and zero‐share (right) classifications based on the proportion of common connections. Dashed lines indicate homoeologous gene pairs. Shared network proportions between A and D orthologous genes in G. hirsutum and G. barbadense. The y‐axis represents shared connections between homoeologs, and the x‐axis, gene type (double, double‐disrupted genes; single, single‐disrupted genes; and non, conserved genes). Centre line, median; box limits, upper and lower quartiles; whiskers, 1.5× the interquartile range; and dots, outliers. (d) Expression patterns of genes in the fibre‐associated module. In the heatmap, red indicates up‐regulated genes, black indicates neutral genes, and green indicates down‐regulated genes. Bar plots show eigengene values (i.e. the first principal component) calculated from the singular value composition. (e) Gene Ontology enrichment analysis results for genes in the fibre‐associated module. (f) Global co‐expression network of a homoeologous gene pair (GhNPLA1) in the fibre‐associated module. Each dot represents a connected gene.
Most disrupted genes (96.39% in G. hirsutum and 96.87% in G. barbadense) were found to be transcribed in the examined tissues. This raises a question as to whether a disrupted gene affects the functional networks of transcripts. To examine this possibility, we selected the homoeologous gene pairs with a disrupted gene and constructed their interaction networks using weighted gene co‐expression network analysis (WGCNA) using 20 tissues from G. hirsutum and G. barbadense, respectively (Table S3). In quantifying the alterations in regulatory networks, we proposed three possible shared network patterns to exist between the A and D subgenomes: whole‐share (index = 100%), part‐share (0% < index <100%) and zero‐share (index = 0%) (method adapted from Arsovski et al., 2015; Figure 2c). The homoeologous gene pairs were classified as either single‐disrupted or double‐disrupted depending on whether disruption occurred in only one subgenome or in both subgenomes when considering one‐to‐one homoeolog genes. The comparisons included 304 and 289 double‐disrupted genes and 3631 and 3515 single‐disrupted genes in G. hirsutum and G. barbadense, respectively (Table S4). The double‐disrupted genes showed significantly lower correlation coefficients (G. hirsutum = 0.57, G. barbadense = 0.58) than either single‐disrupted genes (G. hirsutum = 0.64; G. barbadense = 0.65, P < 2.2e‐16) or conserved genes (G. hirsutum = 0.71; G. barbadense = 0.71, P < 2.2e‐16) (Figure S4).
Through the WGCNA, 7,801,385 connections were identified among the 20 096 one‐to‐one homoeologous genes. In G. hirsutum, the shared network index was significantly decreased by 15% in single‐disrupted genes (mean G. hirsutum = 0.34, P < 2.2e‐16, Wilcox test) and by 30% in double‐disrupted genes (mean G. hirsutum = 0.28, P < 2.2e‐16, Wilcox test) when compared to conserved genes (mean G. hirsutum = 0.40). Similar result was observed in G. barbadense (Figure 2c). Interestingly, 450 single‐disrupted genes were involved in extremely asymmetrical or altered networks (zero‐share index = 0%). In G. hirsutum, the 20 096 homoeologous genes were grouped into 17 modules, of which six were related to ovule and fibre development (red, yellow green, dark turquoise, green, blue2, and lightpink4; p < 0.05) (Figure 2d; Figure S5). In G. barbadense, these homoeologous genes were grouped into 12 modules; 6 of 12 were related to ovule and fibre development (pink, darkorange2, mediumpurple3, black, orangered3, and palevioletred2; p < 0.05) (Figure S6). For Gene Ontology terms, the 1819 genes in module blue2 were enriched in the fatty acid metabolic process (GO:0006631) and regulation of cell growth (GO:0001558) in G. hirsutum (Figure 2e, Tables S5 and S6). Interestingly, 55 fibre‐related genes were identified as single‐disrupted and involved in an extremely alternated co‐expression network with a share index of 0% (Table S7). Taken together, our results indicate that the destruction of gene structure also affects the related co‐expression or regulatory networks.
The hub gene with disrupted homologous pair encoding a novel phospholipase A is associated with cell elongation
Among 55 fibre‐related genes in the module blue 2, the gene GH_A05G4329 (GhNPLA1A) was ranked as the top hub gene. In G. hirsutum, the expression of GhNPLA1A was associated with 361 genes in the WGCNA module (Figure 2f), but GhNPLA1D was independent of the module (Figure 2f). It encoded an enzyme that catalyses the hydrolysis of acyl groups from phospholipids to produce free fatty acids (FFAs) and lysophospholipids (LPLs); therefore, it may play important roles during cell elongation in higher plants (Lee et al., 2003). The expression profiles of this gene pair GhNPLA1A and GhNPLA1D were found to be biased to the A subgenome in G. hirsutum: GhNPLA1A was highly expressed during the cotton fibre elongation period, while GhNPLA1D was almost silenced (Figure 3a, b; Figure S7a and Table S8). However, such biased expression was not observed between GbNPLA1A and GbNPLA1D in G. barbadense (Figure S7a). Rather, the expression of GbNPLA1A/D in elongating cotton fibres reached higher levels and persisted longer than that of GhNPLA1A/D (Figure 3c).
Figure 3.
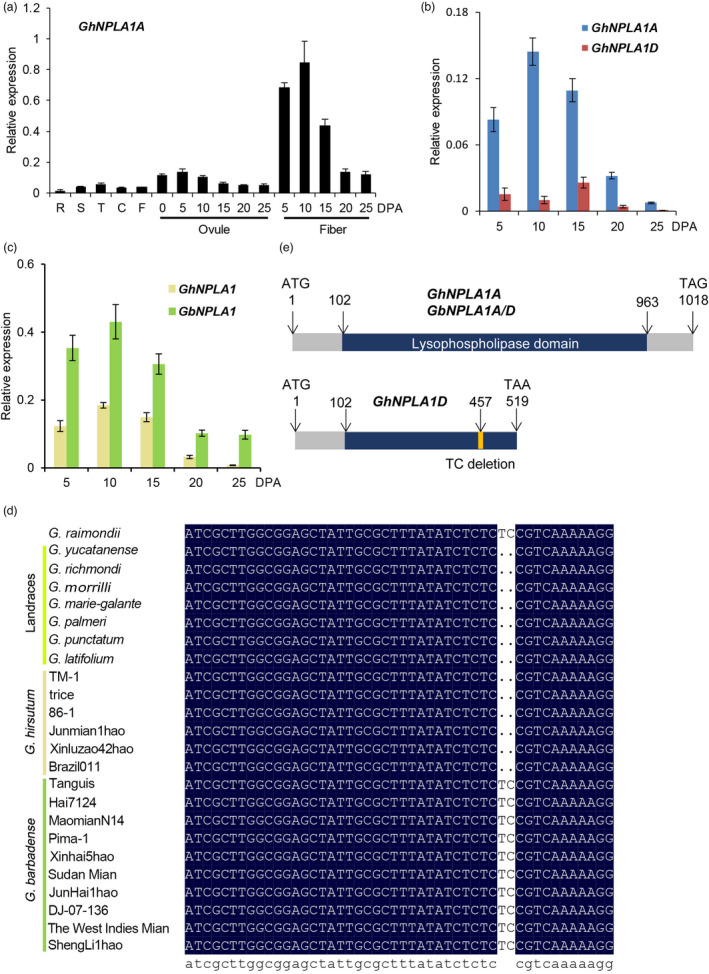
Expression and structure analysis of the phospholipase A gene in G. hirsutum and G. barbadense. (a) qRT‐PCR analysis of GhNPLA1A expression in tissues and organs of G. hirsutum acc. TM‐1. RNA was isolated from roots (R), stems (S), leaves (L) and cotyledons (C) of two‐week‐old plants, flowers (F), 0–25 DPA ovules and 5–25 DPA fibres. The EF‐1α gene was amplified as a control. Values are means ± s.d. (n = 3 biological replicates). (b) qRT‐PCR analysis of GhNPLA1A and GhNPLA1D in G. hirsutum acc. TM‐1. SNP primers designed to distinguish the homeologs were used for qRT‐PCR. (c) qRT‐PCR analysis of GhNPLA1A/D and GbNPLA1A/D expression during fibre development in G. hirsutum acc. TM‐1 and G. barbadense cv. Hai7124. (n = 3 biological replicates). (d) Nucleotide sequence comparison in selected varieties representing G. raimondii, G. hirsutum and G. barbadense. (e) Schematic model of structural variation introduced by the 2‐bp deletion. Structures were predicted by Conserved Domain Search in NCBI and showed that GhNPLA1A contained the lysophospholipase domain.
Alignment of the coding sequences from G. hirsutum and G. barbadense revealed a 2‐bp deletion in GhNPLA1D, but not GhNPLA1A and GbNPLA1A/D (Figure 3d; Table S9). This deletion led to an early termination of translation and interrupted the lysophospholipase domain (Figure 3e; Figure S8). Ectopic expression of GhNPLA1A containing the intact lysophospholipase domain in Arabidopsis, driven by the 35S promoter, resulted in seedlings with longer primary roots than the control group (Figure S9). However, ectopic expression of the GhNPLA1A‐N1‐121 and GhNPLA1A‐C122‐339, which contained truncated lysophospholipase domain, resulted in seedlings with similar root lengths to wild type. The aboved results indicate that this domain is important for fulfilling the function of GhNPLA1A. The lower levels of GhNPLA1D mRNA may be attributed to non‐sense‐mediated decay (NMD) (Brogna and Wen, 2009), since the encoded protein may be dysfunctional due to the broken lysophospholipase domain.
Next, the fragment of GhNPLA1A and GhNPLA1D was cloned using primers designed by SNP between them to investigate the occurrence of this 2‐bp deletion variation in Gossypium species. Using PCR and Sanger sequencing, the 2‐bp deletion was detected in D subgenome of all 70 G. hirsutum accessions, which represented 34 landraces and 36 cultivars (Figure 3d and Table S9). Meanwhile, of the 57 G. barbadense accessions examined, only two cultivated species contained the deletion; these instances may be due to introgression from G. hirsutum during breeding. In order to validate this hypothesis, this 2‐bp deletion was examined using cotton populations of 243 diploid accessions (Du et al., 2018) and 3248 tetraploid accession data (He et al., 2021), which were from two public cotton database, GRAND (http://grand.cricaas.com.cn/) (Zhang et al., 2022) and CottonGVD (https://db.cngb.org/cottonGVD/) (Peng et al., 2021). The 2‐bp deletion was only detected in G. hirsutum (AD1) population, but not in G. arboreum population. Thirty accessions of G. hirsutum (Han et al., 2022) and G. barbadense (Yu et al., 2021) were randomly selected to align their deep resequenced reads to the TM‐1 reference genome. Interestingly, the 2‐bp deletion was found in all the tested G. hirsutum accessions, but not in G. barbadense accessions (Table S9).
These findings indicate that the variation identified in GhNPLA1D occurred after Gossypium speciation. Given its potential roles in cell elongation, variation in GhNPLA1D may partially contribute to the difference in fibre length between allotetraploid cottons G. hirsutum and G. barbadense.
Retrieving the phospholipase A gene could promote cotton fibre elongation
To compensate for the lost function of the disrupted GhNPLA1D gene in fibre cell elongation, we introduced GhNPLA1A antisense and overexpression constructs into cotton via Agrobacterium‐mediated transformation (Figure S10a). PCR‐based genotyping and kanamycin resistance assays were conducted on the T0‐T3 generations until homozygous lines were obtained (Figure S10b and S10c). Three overexpression lines (S4, S6 and S10) and three down‐regulation lines (AS3, AS9 and AS10) were selected for further analysis based on expression analysis (Figure 4a). We found that altering the expression of GhNPLA1A did not influence cotton growth and development (Figure S10b). However, in comparison with wild‐type (WT) and empty vector transgenic control (pBI121) plants, the three overexpression lines exhibited longer fibre length at maturity, while the three down‐regulation lines had shorter fibre lengths (Figure 4b, c). Measurement of fibre length in S10 and AS10 plants aged 5 to 20 days post‐anthesis (DPA) confirmed the significant variation in fibre length compared with WT plants (Figure 4d, e). Thus, elongation rates in S10 and AS10 plants differed from those occurring in WT at the 5–10 DPA and 10–15 DPA periods, during which there was high expression of GhNPLA1A. This indicates that GhNPLA1A is important in regulating cotton fibre cell elongation.
Figure 4.

Ectopic expression of GhNPLA1 in wild‐type upland cotton promotes fibre elongation. (a) Relative expression of GhNPLA1 in the transgenic cotton. S4, S6 and S10 denote GhNPLA1 overexpression lines. AS3, AS9 and AS10 are GhNPLA1‐antisense lines. (b) Photographs showing the mature seed fibre length of the transgenic lines used in panel (a). WT and pBI121 were the transgenic receptor W0 and empty vector transgenic control. (c) Quantitative comparison of fibre lengths in the transgenic cotton lines. Values are means ± s.d. (n = 3 biological replicates), ** p < 0.01, two‐tailed Student's t test. (d) Fibre elongation of GhNPLA1A transgenic lines relative to WT. Values are means ± s.d. (n = 3 biological replicates). (e) Phenotypes of fibre‐bearing seeds in WT and GhNPLA1A transgenic plants. Stages are indicated at the tops of the graphs. Scale bar = 10 mm.
GhNPLA1A encodes an active phospholipase A
Since GhNPLA1A contained a lysophospholipase domain, we conducted an in vitro lysophospholipase activity assay to confirm its functionality. First, we tagged the protein at the N‐terminus with maltose‐binding protein (MBP) and expressed it in Escherichia coli for purification (Figure 5a), then performed the activity assay. The expressed protein released the free C16:0 from the 16:0‐lysophosphatidylcholine (LPC) substrate reaction buffer sufficiently (Figure 5b), confirming that GhNPLA1A functions as a lysophospholipase. When 16:0–18:2 phosphatidylcholine (PC) was used as a substrate, production of free 16:0 and 18:2 fatty acids was also observed (Figure 5c), suggesting that GhNPLA1A acts at the sn‐1 and sn‐2 positions during PC hydrolysis. We also examined the activity of GhNPLA1A against other classes of phospholipids, including phosphatidylinositol (PI), phosphatidylethanolamine (PE), phosphatidic acid (PA) and phosphatidylglycerol (PG). GhNPLA1A hydrolysed all the phospholipids tested, and demonstrated the highest activity when PC was used as the substrate (Figure 5d). These results revealed that GhNPLA1A exhibits typical phospholipase A activity in vitro.
Figure 5.
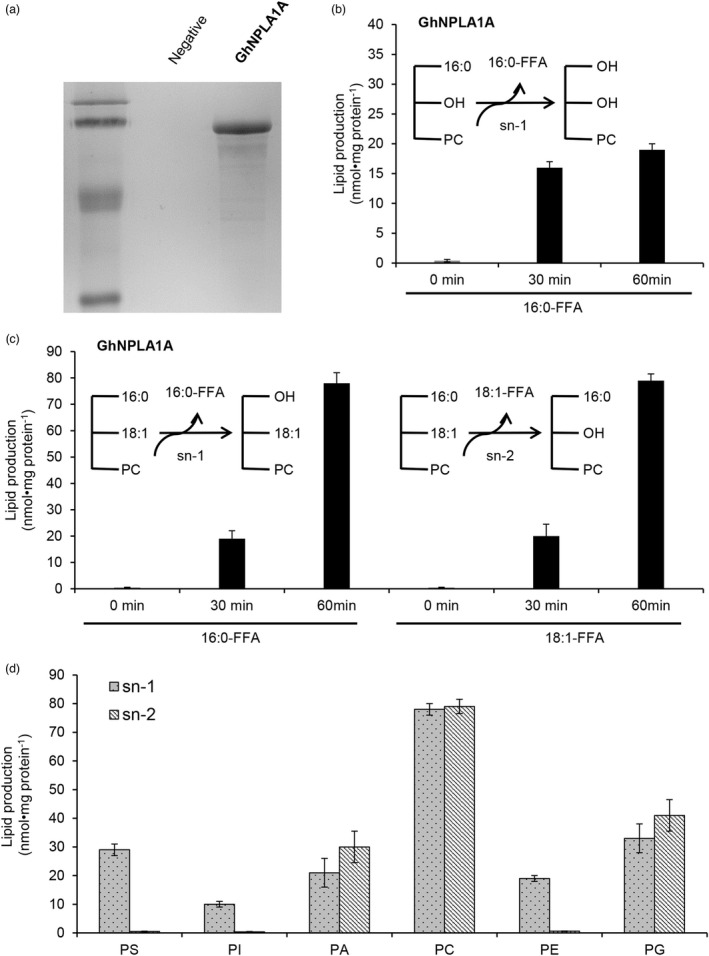
Purified GhNPLA1A hydrolyses phospholipids in vitro at the sn‐1 and sn‐2 positions. (a) SDS‐PAGE loaded with affinity‐purified MBP‐tag vector and GhNPLA1A from Escherichia coli. (b) FFA released by GhNPLA1A when 16:0‐LPC vesicles were used as substrate. Values are means ± s.d. (n = 3 separate samples). (c) FFA released by GhNPLA1A when 16:0–18:1 PC vesicles were used as substrate. Values are means ± s.d. (n = 3 separate samples). (d) Acyl hydrolysis activity of GhNPLA1A towards various classes of phospholipids. Sn‐1 and sn‐2 were the term representing the fatty acid bond position of triacylglycerin in phospholipids. Vesicles made from individual lipid species were incubated with GhNPLA1A at 28 °C for 60 min. After the reaction, lipids were extracted and quantified by GC/MS. Values are means ± s.d. (n = 3 separate samples).
Overexpression of GhNPLA1A increased lipid content of cotton fibre
To determine the function of GhNPLA1A in lipid metabolism, lipid profiles of 10‐DPA fibres from WT, the GhNPLA1A‐overexpressing line S10 and the GhNPLA1A‐down‐regulated line AS10 were examined via mass spectrometry. Free fatty acids (FFAs) and lysophospholipids (LPLs) were taken as potential products of GhNPLA1A activity. In 10‐DPA fibres, total FFA levels were 21% higher in S10 and 18% lower in AS10 than in the WT (Figure S11a). The most abundant FFAs were palmitic acid (C16:0) and linolenic acid (C18:3), which constituted 60% of the total FFAs. Contents of all FFA species exhibited a tendency to decrease in AS10 and increase in S10 compared with the WT (Figure S11b). The total LPL level was 15% higher than WT in S10 (Figure S11c, d), but lower in AS10. In cotton fibres, the main species of LPLs were C18:3‐LPLs. However, unlike the other species, contents of C18:3‐LPLs in AS10 and S10 were not different from that in the WT (Figure S11f‐h).
Total phospholipid levels were higher in 10‐DPA fibres from AS10, but lower in AS10 plants overall. In addition, PC, PI, PA and PG levels of GhNPLA1A‐altered plants were significantly different from those of WT plants (Figure 6a‐e, Figure S12, and Table S10). In 10‐DPA WT fibres, the main phospholipid species were 34:3 and 36:6, both of which contained linolenic acid. There was a general trend towards the content of 34:3 and 36:6 phospholipids being lower in AS10 but higher in S10 compared with WT (Figure 6f‐k). In addition, the levels of other phospholipids containing linolenic acid, such as 36:3, 36:4 and 36:5, were also changed. However, total PE content in GhNPLA1A‐altered plants was similar to that in WT plants, despite the 34:3 and 36:6 PE contents being higher in S10 than in WT (Figure 6c, h).
Figure 6.
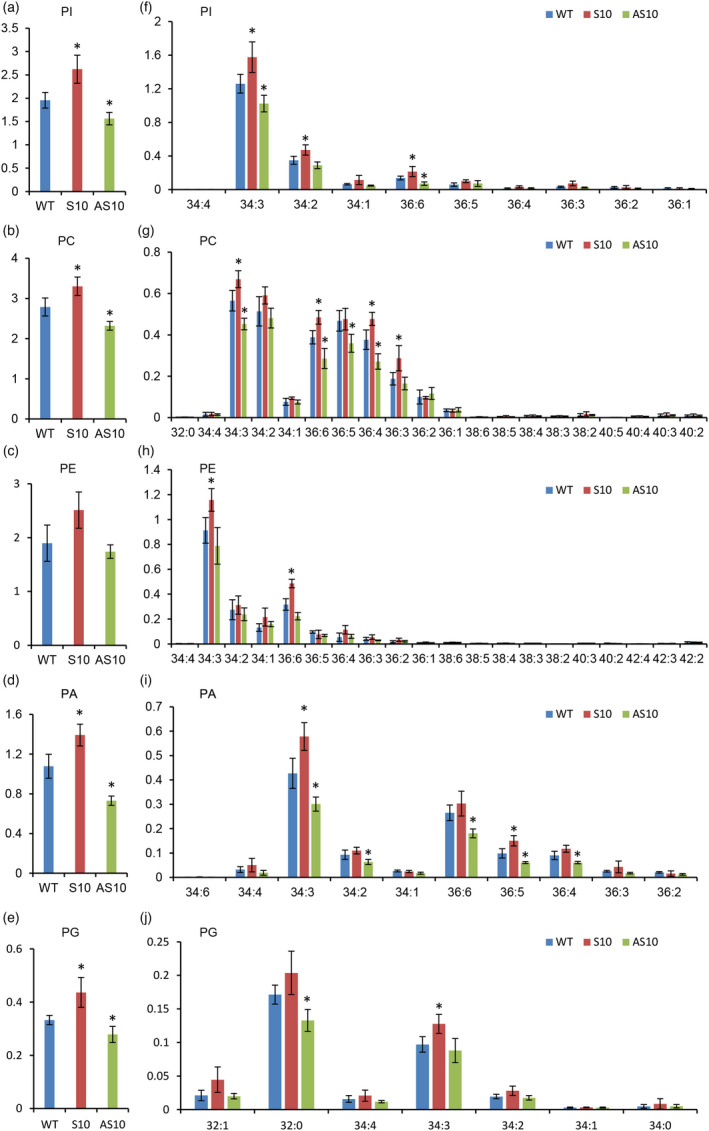
Effects of altered GhNPLA1A expression level on the phospholipid content of cotton fibres. (a‐e) Phospholipid content of WT, S10 and AS10 lines. (f‐j) Molecular species of phospholipids in WT, S10 and AS10 plants. Phospholipids include PC, PE, PI, PA and PG. Lipids from 10‐DPA fibres were quantified by ESI‐MS/MS. Values are means ± s.d. (n = 4). Asterisk indicates a significant difference at P < 0.05 compared with the WT based on Student's t test.
GhNPLA1A ‐altered fibres respond differently to α‐linolenic acid (ALA), 34:3 PI and their inhibitors
ALA (α‐linolenic acid) and 34:3 PI were previously reported to promote fibre elongation, with their inhibitors carbenoxolone (CBX) and 5‐hydroxytryptamine (5‐HT) having the opposite role (Liu et al., 2015). In transgenic GhNPLA1A cotton fibres, linolenic acid and 34:3 PI contents differed from corresponding values in the WT. Accordingly, we examined the phenotypic variation of cotton fibre elongation in transgenic GhNPLA1A plants relating to the effects of ALA, 34:3 PI and their inhibitors using in vitro ovule cultures. When 1‐DPA ovules were transferred to cultures containing 5 μM ALA and 1 μM 34:3 PI, fibre elongation was promoted in all genotypes. However, S10 fibres were more sensitive and AS10 fibres were less sensitive than WT fibres (Figure 7); specifically, fibre elongation was promoted by ~34% and ~40% in S10 plants and ~24% and ~30% in WT plants, but only by ~18% and ~22% in AS10 plants. Treatments with inhibitors, 0.5 μM CBX and 0.5 μM 5‐HT, decreased fibre length to a greater degree. As expected, S10 fibres were less sensitive and AS10 fibres were more sensitive to CBX and 5‐HT compared with WT fibres (Figure 7). These results indicated that GhNPLA1A promotes in vivo fibre elongation, at least in part, by affecting the content of linolenic acid and 34:3 PI. This in turn suggests that GhNPLA1A regulate fibre elongation via its potential substrate and product content.
Figure 7.
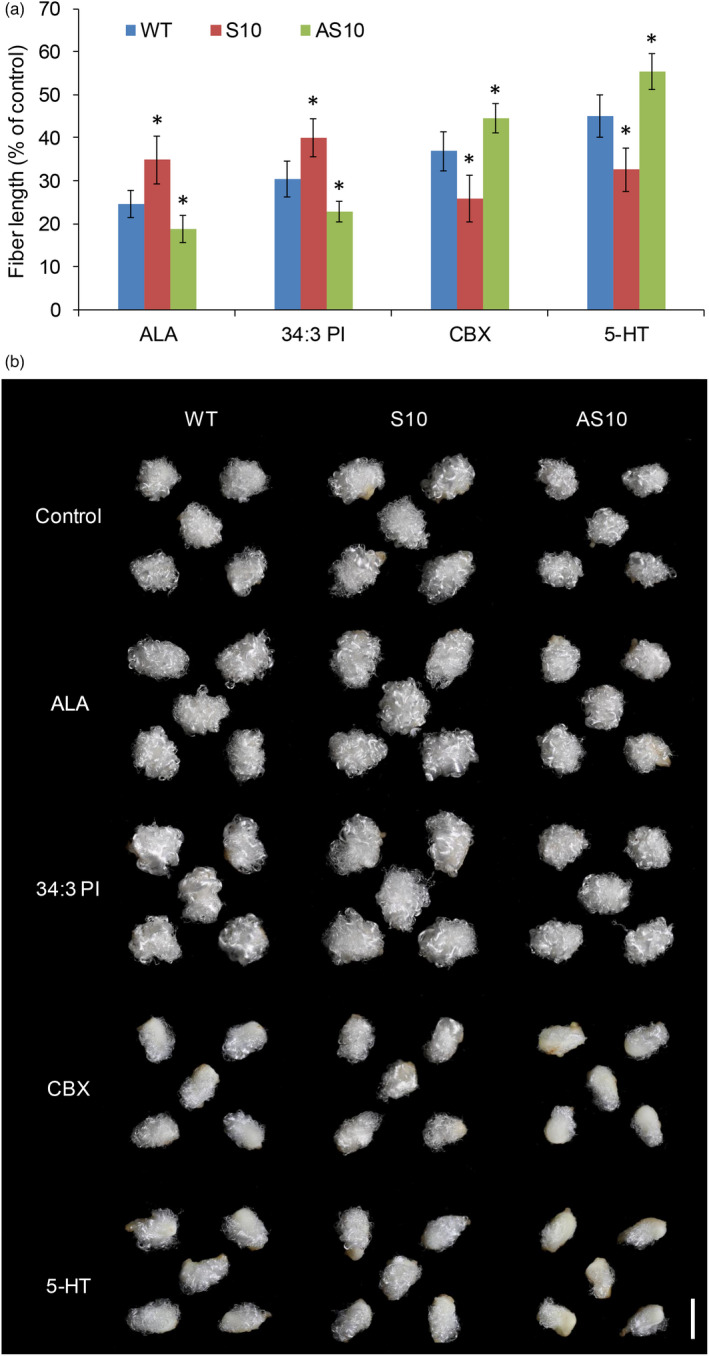
Fibre lengths in S10 and AS10 lines have different sensitivities to ALA, 34:3 PI and their inhibitors. (a) Responses of S10 and AS10 lines to ALA, 34:3 PI, CBX and 5‐HT compared with the WT. At least 20 ovules were measured in each case. Error bars indicate the standard deviation of three biological replicates. Asterisks indicate significant difference at P < 0.05 compared with the WT based on Student's t‐test. (b) Phenotypes of WT, S10 and AS10 ovules cultured for 12 days in BT medium containing 5 μM ALA, 1 μM 34:3 PI, 0.5 μM CBX or 0.5 μM 5‐HT. Scale bar = 5 mm.
Discussion
Gene disruption is parallel to species formation and evolution
Allotetraploids carry pairs of homologues for most genes, which create opportunities by enhancing phenotypic variation (Comai, 2005). Following the ancient polyploidy event in cotton, much genetic redundancy was created, with disrupted genes possibly experiencing different fates. In the present, many disrupted genes with broad‐sense inheritance exhibit fast evolution rates, low expression levels and alterable regulation networks. Unlike pseudogenes, we found that most disrupted genes continue to produce RNA; this is probably due to the relative short time passed, evolutionarily speaking, since the formation of tetraploid cotton. Hence, these genes are still undergoing processes of loss‐of‐function alteration, which relate to methylation and the oxidation–reduction process in cotton polyploidization and Gh‐Gb speciation history. In WGCNA of homoeologous gene pairs, regulation networks with disrupted genes showed significantly lower correlation coefficients. Genes in the WGCNA modules for fibre development were enriched in the Gene Ontology term metabolic process and regulation of cell growth, indicating a functional bias in gene loss. This indicates that gene disruption could potentially generate different expression patterns and eventually lead to neofunctionalization and subfunctionalization on transcriptional and network levels. We propose that loss of a gene might be accompanied by the alteration or loss of a regulation network that affects traits during evolution. While a ‘polyploidy diversity bottleneck’ arose during cotton allopolyploid formation and speciation because the time interval involved was not sufficient for the accumulation of mutations (Feldman and Levy, 2012), the identified gene disruption events could introduce the genetic diversity of the co‐expression network after allopolyploidization, which reflects the dynamic structural and functional plasticity of allopolyploid crops.
Retrieval of the disrupted gene encoding phospholipase A can restore its functional contribution to fibre enhancement
Loss‐of‐function events are widely induced and observed in experiments using biotechnological approaches, but it is difficult to extrapolate the functions of genes that have been lost. Here, we discuss three different strategies for studying the functions of disrupted genes. The first is to find, describe and map numerous natural mutants that conditioned yield, quality and resistance traits. Then, functional genes with structural variations can be further fine‐mapped and studied. For instance, Ligon lintless‐3 mutants have altered lint fibre production, with a mutation in the gene GhMML4_D12 causing early termination, resulting in fibreless seeds (Wu et al., 2018). The second strategy is to study how loss of functional genes during polyploidization or domestication could be compensated for using interspecies introgression lines. For example, in rice, small seed size resulting from the loss of the GL4 gene was compensated using a set of introgression lines between African wild rice and cultivated rice (Wu et al., 2017). Likewise, a maize UPA2 allele lost during domestication could be compensated by introgression from wild maize to achieve high‐density maize yields (Tian et al., 2019). A rapid introgression platform has been used to transfer valuable genomic variations to elite wheat plants, such as presence–absence variations for enhanced resistance (Zhou et al., 2021). Finally, the new‐type Brassica napus has been resynthesized to broaden the genetic diversity of B. napus, the better to evaluate the impacts of exotic introgression (Hu et al., 2021). The third strategy is to determine how specific gene disruptions could be compensated for using genetic engineering. In this study, we studied a single‐lost gene, GhNPLA1D, with silenced expression and a lost regulation network, in which the 2‐bp deletion causing early termination was exclusively found in the D subgenome of G. hirsutum.
After sequencing 62 G. barbadense and 76 G. hirsutum accessions, the 2‐bp deletion identified here was not observed in the vast majority of G. barbadense sequences, despite G. hirsutum and G. barbadense having both diverged from the nascent allotetraploid cotton that originated in one interspecific hybridization event between diploid species G. herbaceum or G. arboreum and G. raimondii (Du et al., 2018 ; Huang et al., 2020 ; Wendel et al., 1995 ; Wendel et al., 2010 ; Zhang et al., 2015). However, the 2‐bp deletion was also not found in the two diploid progenitor species, A genome G. arboreum and D genome G. raimondii, demonstrating that the divergence happened after formation of allopolyploid cotton. Overexpression experiments in cotton and Arabidopsis demonstrated that GhNPLA1A could increase fibre cell length and primary root length, respectively. Meanwhile, reducing the level of GhNPLA1A mRNA caused shortened fibres in cotton, indicating that after polyploidization, G. barbadense preferred to retain more copies of genes that contribute to fibre elongation than did G. hirsutum. The difference in phospholipase A gene could be involved with the molecular basis for the fibre length divergence in these two allopolyploid cottons (Figure 8).
Figure 8.
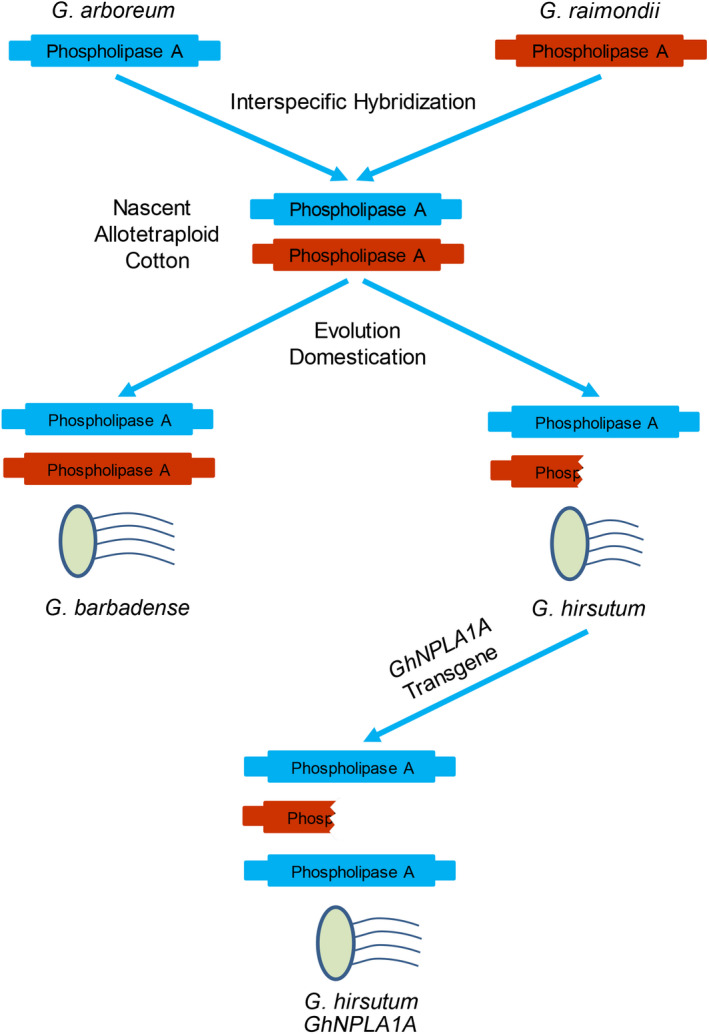
Evolution model of phospholipase A gene and its consequences for fibre elongation in cotton. The genomes of the two diploid ancestor species, G. arboreum and G. raimondii, each harbours normal phospholipase A gene. After formation of a nascent allotetraploid cotton from the interspecific hybridization of G. arboreum and G. raimondii, G. hirsutum and G. barbadense diverged and evolved independently. In this process, G. barbadense retained two copies of GbNPLA1 and developed extra‐staple fibres, while G. hirsutum lost one copy of GhNPLA1D and produced short fibres. The restored GhNPLA1A copy number in transgenic G. hirsutum achieved the longer fibre phenotype.
GhNPLA1A accelerates phospholipid biosynthesis in vivo by hydrolysing phospholipids containing the linolenic acid moiety to promote fibre elongation
GrNPLA1, the ancestor of GhNPLA1A in G. raimondii, is phylogenetically clustered with AtMAGL1, AtMAGL3/AtLysoPL2, AtMAGL14 and AtMAGL16 (Figure S7b), which belong to the monoacylglycerolase gene family. However, the proteins encoded by these genes have no monoacylglycerolase activity in Arabidopsis (Kim et al., 2016). Instead, AtMAGL1 and AtLysoPL2 exhibit lysophospholipase activity (Gao et al., 2010; Kim et al., 2016). Here, enzyme activity assays revealed that the protein encoded by GhNPLA1A has phospholipase A activity in vitro. When fibre expression of GhNPLA1A was altered using transgenic methods, the content of phospholipids, and of their hydrolysis products LPLs and FFAs, changed correspondingly showing that GhNPLA1A encodes a novel phospholipase A in cotton in vivo. The content of total FFAs and LPLs was positively related to the expression of GhNPLA1A. However, unlike other LPLs, LPLs containing linolenic acid in GhNPLA1A‐S and GhNPLA1A‐AS lines remained similar to values in the WT. Exploiting this interested result, combined with the changes in the content of linolenic acid, we presumed that GhNPLA1A prefers to hydrolyse phospholipids containing linolenic acid in vivo; otherwise, LPLs containing linolenic acid should also change if GhNPLA1A hydrolyses phospholipids containing another FA moiety (Figure S13).
Correspondingly, phospholipid analysis found GhNPLA1A‐altered cotton fibres also showed altered content of phospholipids containing linolenic acid and confirmed our conjecture. However, contrary to expectation, these levels tended to be lower in GhNPLA1A‐AS fibres and higher in GhNPLA1A‐S fibres relative to WT fibres. This finding is counterintuitive, considering that GhNPLA1A hydrolyses phospholipids in vitro. In Arabidopsis, pPLAIIIδ encodes a protein that showed typical phospholipase A activity, and overexpression of this gene increased total phospholipid content (Chen et al., 2013; Li et al., 2013). Similarly, overexpression of the related pPLAIIIβ also increased phospholipid content by accelerating phospholipid biosynthesis (Li et al., 2011). These reported results could explain the paradox that GhNPLA1A functions as typical phospholipase A to accelerate phospholipid containing linolenic acid biosynthesis in cotton fibres.
Unlike other plant cell types, the predominant molecular species of PC, PE, PI and PA in cotton fibres were 34:3 (16:0, 18:3) and 36:6 (18:3, 18:3) (Li et al., 2011; Liu et al., 2015; Wanjie et al., 2005), indicating that cotton fibres feature active synthesis and metabolism of phospholipids containing the linolenic acid moiety. Linolenic acid and 34:3 PI, but not other long‐chain fatty acids and phospholipids, were found to promote fibre elongation in vitro (Liu et al., 2015; Qin et al., 2007). Furthermore, while Li et al. (2011) reported that treatment of Arabidopsis seedlings with linolenic acid at 50 μM or 100 μM inhibited primary root growth, a later study in cotton found that linolenic acid at 5 μM and 34:3 PI at 1 μM could promote fibre elongation. Transgenic and genetic evidences show that GhNPLA1 plays a positive role in cotton fibre elongation. We also found GhNPLA1A‐S plants have higher contents of linolenic acid and 34:3 PI relative to WT, while GhNPLA1A‐AS plants had lower contents. We then tested the effect of linolenic acid, 34:3 PI and their inhibitors on cotton fibres in vitro and found that both linolenic acid and 34:3 PI promote cotton fibre elongation, while their inhibitors inhibit cotton fibre elongation. Furthermore, GhNPLA1A‐S fibres were more sensitive to linolenic acid and 34:3 PI than wild‐type fibres, whereas AS fibres were less sensitive. And these relative sensitivities were reversed when treating ovules with the inhibitors. Therefore, the effect of GhNPLA1A on fibre length may result, at least in part, from the elevated intracellular levels of linolenic acid and 34:3 PI. All polyploids, including palaeopolyploids, recent allopolyploids and diloidized autopolyploids, have undergone cytological and genetic diploidization (Feldman and Levy, 2012). Although many genes are disrupted in this process and subsequently continue to be lost through the genomic accumulation of mutations and through domestication, genetic population mapping and function studies have succeeded in partly demonstrating the previous functions of such genes. Our work opens the door to a strategy for identifying disrupted genes and retrieving their lost functions in ways that can provide valuable resources for accelerating trait enhancement in cotton breeding.
Methods
Identification of disrupted genes from genome sequences
Disrupted genes were traced between an allotetraploid and its presumed diploid wild ancestor. The selected taxa included G. hirsutum, G. barbadense, G. arboreum and G. raimondii. Genome data for each selected taxon were obtained from the COTTONGEN database (https://www.cottongen.org/) (Yu et al., 2014) and Cotton Omics Database (http://cotton.zju.edu.cn/). To reduce computational complexity, sequences of G. hirsutum and G. barbadense (Hu et al., 2019) were divided into subgenomes: GhAt, GhDt, GbAt and GbDt. Reads were assigned to the diploid ancestor's relatives G. arboreum (Du et al., 2018; Huang et al., 2020) and G. raimondii (Paterson et al., 2012) using the software BWA (Li and Durbin, 2009). Only uniquely mapping reads were retained. Following alignment, we used the Indel Realigner from the Genome Analysis Toolkit to correct alignment errors near indels and identify SNPs and indels (McKenna et al., 2010). In the obtained variant calling format files, heterozygous sites and those missing in one sample were considered as misalignments and were excluded from further analysis. Deleterious variants were annotated using ANNOVAR (Wang et al., 2010b). Genes were considered disrupted if identified as containing stop‐gain, stop‐loss, frameshift deletion or frameshift insertion variants. The deleterious variants were also annotated using another software SnpEff (v 3.5) (http://snpeff.sourceforge.net/) with default parameters (Cingolani et al., 2012) in order to conform the accuracy of genomic variation annotations.
Identification of orthologs
We constructed one‐to‐one homoeolog families in which all members were homoeologous genes in cotton and rape using OrthoFinder (parameters were ‐M msa ‐S blast ‐I 4 ‐t 5) (Emms and Kelly, 2019). This yielded a set of 20 096 orthologous Gossypium gene pairs (Ga: Gr: GhA t : GhD t : GbA t : GbD t ), the lists of which can be found in Table S2.
Calculation of Ka, Ks and Ka/Ks
To evaluate the levels of selective constraint on the disrupted genes, we determined the numbers of synonymous sites (Ks) and non‐synonymous sites (Ka) between each post‐polyploidization gene and its diploid counterparts. Protein alignments were generated using pairwise ClustalW (Larkin et al., 2007). Multiple sequence alignments were transformed using ParaAT (Zhang et al., 2012). Synonymous nucleotide substitutions on synonymous sites were estimated using the Nei–Gojobori approach (Nei and Gojobori, 1986) to implement the Ka/Ks calculator (Wang et al., 2010a).
Estimating the expression levels of disrupted genes
The cotton RNA‐seq data used in this study had been generated by our laboratory previously (Hu et al., 2019; Zhang et al., 2015). Briefly, these data were derived from 45 different tissues spanning the developmental stages of G. hirsutum and G. barbadense. The accession numbers and samples are given in Table S3. To determine which lost genes were potentially transcribed, we determined the fragments per kilobase of transcripts per million mapped fragments (FPKM) value of each gene. RNA‐seq data were preprocessed, and quality control was applied using Fastp to filter out adapters and low‐quality sequences (Chen et al., 2018). Clean data were aligned against a reference genome using the software HISAT2 (−dta) (Pertea et al., 2016). The gene expression in each sample was estimated and quantified in FPKM by StringTie (−e ‐G) (Pertea et al., 2016). An FPKM value greater than 0.5 in all the examined samples was considered to be detectable.
Degrading the gene co‐expression network
The expression levels of disrupted genes and conserved genes were examined in selected representative tissues: cotton leaf, root, stem, sepal, 1‐DPA ovule, 3‐DPA ovule, 5‐DPA ovule, 10‐DPA ovule, 10‐DPA fibre, 20‐DPA fibre and 25‐DPA fibre. To study the co‐expression patterns among conserved–conserved, disrupted–conserved and disrupted–disrupted homoeologous pairs, we calculated Spearman’s correlations of expression levels across different samples using cor() and cor.test() in R.
Co‐expression network analysis has emerged as a very useful approach for functional annotation. It is based on the idea that all genes involved in a particular biological pathway will be connected to each other. Here, gene co‐expression networks were constructed using the R package WGCNA (v1.63) (Langfelder and Horvath, 2008). Genes in a one‐to‐one relationship of G. hirsutum and G. barbadense were imported for analysis, and further divided into 17 modules and 12 modules, respectively. Genes in the blue2 module of G. hirsutum are listed in Table S5. Module–trait associations were estimated using the correlations between the eigengene module and ovule and fibre samples.
Validation the disrupted gene GhNPLA1D using population data
The 2‐bp deletion causing early termination of GhNPLA1D was validated in 57 G. barbadense and 70 G. hirsutum accessions using PCR and Sanger sequencing. Primers were designed from the flanking sequences according to the 2‐bp deletion positions in the GhNPLA1D (Table S9), which presents the real sequences unbiased by any short‐read assembly. The amplification profile consisted of an initial denaturation step at 94 °C for 4 min, followed by 35 cycles of 94°C for 30 s, 58°C for 30 s and 72°C for 40 s, with a final extension step at 72°C for 10 min.
The 2‐bp deletion was also detected in two cotton databases, GRAND (http://grand.cricaas.com.cn/) (Zhang et al., 2022) and CottonGVD (https://db.cngb.org/cottonGVD/) (Peng et al., 2021), including 243 diploid cotton accessions genome data (Du et al., 2018) and 3000 cotton genome data (He et al., 2021). Moreover, from previous published data, 30 G. hirsutum (Han et al., 2022) and 30 G. barbadense individuals (Yu et al., 2021) (Table S9) were randomly selected and their resequenced data were aligned against to the TM‐1 reference genome using BWA (Li and Durbin, 2009). Only uniquely mapping reads were retained. Following alignment, we used the Indel Realigner from the Genome Analysis Toolkit to correct alignment errors near indels and identify SNPs and indels (McKenna et al., 2010).
Plant materials, growth conditions and cotton ovule cultures
This study used the cotton cultivars G. hirsutum acc. W0. The plants were grown in our Jiangpu breeding field in Nanjing, China. Ovule and fibre stages were identified by tagging each pedicel on the day of flowering, and samples representing the different stages were removed carefully from developing bolls for DNA, RNA and lipid extraction. This study also used Arabidopsis cultivar Columbia‐0 as transgenic receptor, in which plants were grown in a growth chamber or glasshouse with long‐day conditions (22 °C, 16 h of light and ~70% relative humidity). Cotton ovules were cultured according to the method described by Beasley (Beasley, 1971). After surface sterilization using 75% ethanol, cotton ovules collected from bolls at 1 DPA were cultured in liquid BT medium at 30 °C in the presence of 5 μM linolenic acid, 1 μM 34:3 PI, 0.5 μM CBX and 0.5 μM 5‐HT (Liu et al., 2015).
Gene expression analysis and gene cloning
The genome and transcriptome data of G. hirsutum acc. TM‐1 were obtained from our laboratory as described by Zhang et al. (2015) (NCBI database, SRA: PRJNA248163). The genome and transcriptome data of G. barbadense cv. Hai7124 were also obtained from our laboratory (Hu et al., 2019). The data were visualized using the MeV software (Saeed et al., 2003). GhNPLA1A sequences were amplified from the cDNA of 5‐DPA G. hirsutum acc. TM‐1 fibres using gene‐specific primers (Table S11). The SNP primers used to detect the 2‐bp deletion were developed from GhNPA1A and GhNPLA1D sequences using WebSNAPER (https://pga.mgh.harvard.edu/cgi‐bin/snap3/websnaper3.cgi).
Enzyme assays
Hydrolase activity was measured by monitoring the release of FFA from 1,2‐dimyristoyl‐sn‐glycero‐3‐phosphate (sodium salt) (DMPA), 1‐palmitoyl‐2‐oleoyl‐sn‐glycero‐3‐phosphocholine (POPC), 1‐palmitoyl‐2‐oleoyl‐sn‐glycero‐3‐phosphoethanolamine (POPE), 1‐palmitoyl‐2‐oleoyl‐sn‐glycero‐3‐phospho‐(1′‐rac‐glycerol)(POPG), l‐α‐phosphatidylinositol (PI) and 1‐palmitoyl‐2‐hydroxy‐sn‐glycero‐3‐phosphocholine (LPC) (Aladdin). To conduct the assay, 50 μg of each substrate in chloroform was first evaporated under vacuum for 10 min. Then, 500 μL of reaction buffer (50 mM Tris–HCl, pH 8.0, 1 mM dithiothreitol) was added and vortexed vigorously, and the suspension was further sonicated for 10 min in a water bath sonicator. Afterwards, 100 μL of each substrate mixture was pre‐warmed to 28 °C for half an hour. The reaction was initiated by adding 20 μg of purified MBP‐tagged GhNPLA1A protein, then incubated at 28 °C for different time intervals, and was stopped by the addition of 300 μL Dole reagent (isopropanol: heptane: 2 M sulphuric acid = 3000: 750: 150). The FFAs released from each substrate were extracted by first adding 300 μL heptane and 300 μL water, then aliquoting 200 μL of the heptane phase and evaporating it. To methylate the isolated FFAs, 300 μL of 0.4 M potassium hydroxide in methanol was added and incubated for 30 min at room temperature. After adding 700 μL of heptane and 300 μL of water, the methylated fatty acids were extracted and measured by GC/MS. For quantitation of both palmitic and oleic acid methyl esters, a known amount of POPC was directly methylated and extracted by the method described above, then serially diluted.
Real‐time quantitative RT‐PCR (qRT‐PCR)
qRT‐PCR was carried out according to the method described by Zhang et al. (2017). The primers used to detect expression of GhNPLA1A/D genes in the At and Dt subgenomes were designed using WebSNAPER (http://pga.mgh.harvard.edu/cgi‐bin/snap3/websnaper3.cgi) based on a single nucleotide polymorphism (SNP) in the GhNPLA1A/D exon. The gene used as internal control was EF‐1α. Three biological replicates were used for each reaction with two technical replicates each. Mean values and standard errors were calculated according to data from three replicates. The primers used for qRT‐PCR are listed in Table S11.
Vector construction and plant transformation
The pBI121 plasmid was used as the backbone for vector construction. Two pairs of primers (GhNPLA1A‐full‐F and GhNPLA1A‐full‐R) were used to amplify the full‐length cDNA sequence, and the pairs OE‐GhNPLA1A‐F/R and AS‐GhNPLA1A‐F/R were used to amplify coding sequence for insertion into the pBI121 plasmid to construct GhNPLA1A overexpression/suppression vectors, both of which were driven by the constitutive Cauliflower Mosaic Virus 35S promoter (CaMV 35S). The vectors were then transformed into G. hirsutum acc. W0 as described previously (Wu et al., 2008). Kanamycin selection coupled with PCR‐based genotyping was used to determine the homozygosity of transgenic plants. The primers used for vector construction and PCR‐based screening are listed in Table S11.
Lipid content analysis of cotton fibres
Lipids were extracted and analysed by electrospray ionization–tandem mass spectrometry (ESI‐MS/MS), and levels of PA, PC, PE, PG, PI and PS were determined using a method described previously (Liu et al., 2015). LPC, LPE and LPG were determined by a method described previously (Li et al., 2011). FFAs were determined by ESI‐MS, using heptadecanoic acid (C17:0) as an internal standard (Sigma‐Aldrich), scanning in the negative ion mode over the mass range of m/z 200 to m/z 350.
Competing interests
The authors declare no competing financial interests.
Author contributions
L.F. and T. Zhang conceptualized the research program. L.F., Z.Z., T. Zhao, H.M., F.W., Z.H., N.Z., Z.S. and Y.H. performed bioinformatics analyses. L.F., T. Zhao, X.H., X.G., S.Z. and S.L. analysed all the data. L.F., Z.Z., T. Zhao and T. Zhang wrote the manuscript. All authors discussed results and commented on the manuscript.
Supporting information
Figure S1. Distribution of deleterious variation in different species.
Figure S2. Distribution of disrupted genes across the cotton genome.
Figure S3. Genomic features of disrupted genes related to polyploidization and speciation.
Figure S4. Distribution of Pearson correlation coefficients between A and D homoeologous genes.
Figure S5. Matrix showing Module‐trait relationship of different modules in different G. hirsutum tissues.
Figure S6. Matrix showing Module‐trait relationship of different modules in different G. barbadense tissues.
Figure S7. The expression and sequence characteristics of GhNPLA1A in cotton.
Figure S8. Amino acid sequence alignment of GhNPLA1 and GbNPLA1 in TM‐1 and Hai7124.
Figure S9. Overexpression of GhNPLA1A but not GhNPLA1A‐N and GhNPLA1A–C caused the longer primary root length in seedling development of Arabidopsis.
Figure S10. GhNPLA1A constructs used for genetic transformation.
Figure S11. The effect of alterations in GhNPLA1A on FFA and LPL content in cotton fibres.
Figure S12. Principal component analysis of each phospholipid content in WT, S10 and AS10 plants.
Figure S13. GhNPLA1A may prefer to hydrolyse the linolenic acid from phospholipids containing the linolenic acid moiety in vivo based on the content of the LPLs and FFAs in GhNPLA1A‐altered cotton fibre.
Table S1. Identification of variants associated with gene disruption.
Table S2. List of one‐to‐one homoeologous genes in Gossypium.
Table S3. Statistics of RNA‐seq libraries in this study.
Table S4. List of double‐disrupted and single‐disrupted genes.
Table S5. Gene list of fibre associated module blue2.
Table S6. GO analysis of the module blue2.
Table S7. Single‐lost genes within extremely changed co‐expression network.
Table S8. FPKM values of GhNPLA1 and GbNPLA1 in TM‐1 and Xinhai21.
Table S9. Distribution of 2 bp deletion in cotton genome.
Table S10. Pearson coefficient correlation analysis of four duplicated experiments of each phospholipid content.
Table S11. Oligonucleotides used for gene cloning, qRT‐PCR and vector construction in this study.
Acknowledgements
This study was financially supported in part by grants from the NSFC (32172008,31822036), Project of Hainan Yazhou Bay Seed Lab (B21HJ0223), a project from Sanya Yazhouwan Technology City (SKJC‐2021‐02‐001), the Leading Innovative and Entrepreneur Team Introduction Program of Zhejiang (2019R01002), the Fundamental Research Funds for the Central Universities (226‐2022‐00153) and Research Startup Funding from Hainan Institute of Zhejiang University (0202‐6602‐A12201).
Contributor Information
Lei Fang, Email: fangl@zju.edu.cn.
Tianzhen Zhang, Email: cotton@zju.edu.cn.
Data availability
All sequenced genomic data and transcriptomic data can be downloaded from the Cotton Omics Database (http://cotton.zju.edu.cn/).
References
- Adams, K.L. and Wendel, J.F. (2005) Polyploidy and genome evolution in plants. Curr. Opin. Plant Biol. 8, 135–141. [DOI] [PubMed] [Google Scholar]
- Arsovski, A.A. , Pradinuk, J. , Guo, X.Q. , Wang, S. and Adams, K.L. (2015) Evolution of cis‐regulatory elements and regulatory networks in duplicated genes of Arabidopsis. Plant Physiol. 169, 2982–2991. [DOI] [PMC free article] [PubMed] [Google Scholar]
- Beasley, C.A. (1971) In‐vitro culture of fertilized cotton ovules. Bioscience, 21, 906–907. [Google Scholar]
- Brogna, S. and Wen, J.K. (2009) Nonsense‐mediated mRNA decay (NMD) mechanisms. Nat. Struct. Mol. Biol. 16, 107–113. [DOI] [PubMed] [Google Scholar]
- Chen, G. , Greer, M.S. and Weselake, R.J. (2013) Plant phospholipase a: advances in molecular biology, biochemistry, and cellular function. Biomol. Concepts, 4, 527–532. [DOI] [PubMed] [Google Scholar]
- Chen, S. , Zhou, Y. , Chen, Y. and Gu, J. (2018) Fastp: an ultra‐fast all‐in‐one FASTQ preprocessor. Bioinformatics, 34, i884–i890. [DOI] [PMC free article] [PubMed] [Google Scholar]
- Chen, Z.J. and Guan, X. (2011) Auxin boost for cotton. Nat. Biotechnol. 29, 407–409. [DOI] [PubMed] [Google Scholar]
- Cingolani, P. , Platts, A. , Wang le, L. , Coon, M. , Nguyen, T. , Wang, L. , Land, S.J. et al. (2012) A program for annotating and predicting the effects of single nucleotide polymorphisms, SnpEff. Fly, 6, 80–92. [DOI] [PMC free article] [PubMed] [Google Scholar]
- Comai, L. (2005) The advantages and disadvantages of being polyploid. Nat. Rev. Genet. 6, 836–846. [DOI] [PubMed] [Google Scholar]
- Conover, J.L. and Wendel, J.F. (2022) Deleterious mutations accumulate faster in allopolyploid than diploid cotton (Gossypium) and unequally between subgenomes. Mol. Biol. Evol. 39, msac024. [DOI] [PMC free article] [PubMed] [Google Scholar]
- Du, X. , Huang, G. , He, S. , Yang, Z. , Sun, G. , Ma, X. , Li, N. et al. (2018) Resequencing of 243 diploid cotton accessions based on an updated a genome identifies the genetic basis of key agronomic traits. Nat. Genet. 50, 796–802. [DOI] [PubMed] [Google Scholar]
- Emms, D.M. and Kelly, S. (2019) OrthoFinder: phylogenetic orthology inference for comparative genomics. Genome Biol. 20, 238. [DOI] [PMC free article] [PubMed] [Google Scholar]
- Fang, L. , Zhao, T. , Hu, Y. , Si, Z. , Zhu, X. , Han, Z. , Liu, G. et al. (2021) Divergent improvement of two cultivated allotetraploid cotton species. Plant Biotechnol. J. 19, 1325–1336. [DOI] [PMC free article] [PubMed] [Google Scholar]
- Feldman, M. and Levy, A.A. (2012) Genome evolution due to allopolyploidization in wheat. Genetics, 192, 763–774. [DOI] [PMC free article] [PubMed] [Google Scholar]
- Gao, W. , Li, H.Y. , Xiao, S. and Chye, M.L. (2010) Acyl‐CoA‐binding protein 2 binds lysophospholipase 2 and lysoPC to promote tolerance to cadmium‐induced oxidative stress in transgenic Arabidopsis . Plant J. 62, 989–1003. [DOI] [PubMed] [Google Scholar]
- Gou, J.Y. , Wang, L.J. , Chen, S.P. , Hu, W.L. and Chen, X.Y. (2007) Gene expression and metabolite profiles of cotton fiber during cell elongation and secondary cell wall synthesis. Cell Res. 17, 422–434. [DOI] [PubMed] [Google Scholar]
- Graves, D.A. and Stewart, J.M. (1988) Analysis of the protein constituency of developing cotton fibers. J. Exp. Bot. 39, 59–69. [Google Scholar]
- Guan, X. , Lee, J.J. , Pang, M. , Shi, X. , Stelly, D.M. and Chen, Z.J. (2011) Activation of Arabidopsis seed hair development by cotton fiber‐related genes. PLoS One, 6, e21301. [DOI] [PMC free article] [PubMed] [Google Scholar]
- Han, Z. , Chen, H. , Cao, Y. , He, L. , Si, Z. , Hu, Y. , Lin, H. et al. (2022) Genomic insights into genetic improvement of upland cotton in the world's largest growing region. Ind. Crop Prod. 183, 114929. [Google Scholar]
- He, S. , Sun, G. , Geng, X. , Gong, W. , Dai, P. , Jia, Y. , Shi, W. et al. (2021) The genomic basis of geographic differentiation and fiber improvement in cultivated cotton. Nat. Genet. 53, 916–924. [DOI] [PubMed] [Google Scholar]
- Hu, D.D. , Zhao, Y.S. , Shen, J.X. , He, X.X. , Zhang, Y.K. , Jiang, Y. , Snowdon, R. et al. (2021) Genome‐wide prediction for hybrids between parents with distinguished difference on exotic introgressions in Brassica napus . Crop J. 9, 1169–1178. [Google Scholar]
- Hu, Y. , Chen, J. , Fang, L. , Zhang, Z. , Ma, W. , Niu, Y. , Ju, L. et al. (2019) Gossypium barbadense and Gossypium hirsutum genomes provide insights into the origin and evolution of allotetraploid cotton. Nat. Genet. 51, 739–748. [DOI] [PubMed] [Google Scholar]
- Huang, G. , Wu, Z. , Percy, R.G. , Bai, M. , Li, Y. , Frelichowski, J.E. , Hu, J. et al. (2020) Genome sequence of Gossypium herbaceum and genome updates of Gossypium arboreum and Gossypium hirsutum provide insights into cotton A‐genome evolution. Nat. Genet. 52, 516–524. [DOI] [PMC free article] [PubMed] [Google Scholar]
- Kim, H.J. and Triplett, B.A. (2001) Cotton fiber growth in planta and in vitro. Models for plant cell elongation and cell wall biogenesis. Plant Physiol. 127, 1361–1366. [PMC free article] [PubMed] [Google Scholar]
- Kim, R.J. , Kim, H.J. , Shim, D. and Suh, M.C. (2016) Molecular and biochemical characterizations of the monoacylglycerol lipase gene family of Arabidopsis thaliana. Plant J. 85, 758–771. [DOI] [PubMed] [Google Scholar]
- Langfelder, P. and Horvath, S. (2008) WGCNA: an R package for weighted correlation network analysis. BMC Bioinformatics, 9, 559. [DOI] [PMC free article] [PubMed] [Google Scholar]
- Larkin, M.A. , Blackshields, G. , Brown, N.P. , Chenna, R. , McGettigan, P.A. , McWilliam, H. , Valentin, F. et al. (2007) Clustal W and Clustal X version 2.0. Bioinformatics, 23, 2947–2948. [DOI] [PubMed] [Google Scholar]
- Lee, H.Y. , Bahn, S.C. , Kang, Y.M. , Lee, K.H. , Kim, H.J. , Noh, E.K. , Palta, J.P. et al. (2003) Secretory low molecular weight phospholipase A2 plays important roles in cell elongation and shoot gravitropism in Arabidopsis . Plant Cell, 15, 1990–2002. [DOI] [PMC free article] [PubMed] [Google Scholar]
- Li, H. and Durbin, R. (2009) Fast and accurate short read alignment with burrows‐wheeler transform. Bioinformatics, 25, 1754–1760. [DOI] [PMC free article] [PubMed] [Google Scholar]
- Li, M. , Bahn, S.C. , Fan, C. , Li, J. , Phan, T. , Ortiz, M. , Roth, M.R. et al. (2013) Patatin‐related phospholipase pPLAIIIdelta increases seed oil content with long‐chain fatty acids in Arabidopsis . Plant Physiol. 162, 39–51. [DOI] [PMC free article] [PubMed] [Google Scholar]
- Li, M. , Bahn, S.C. , Guo, L. , Musgrave, W. , Berg, H. , Welti, R. and Wang, X. (2011) Patatin‐related phospholipase pPLAIIIbeta‐induced changes in lipid metabolism alter cellulose content and cell elongation in Arabidopsis . Plant Cell, 23, 1107–1123. [DOI] [PMC free article] [PubMed] [Google Scholar]
- Liu, G.J. , Xiao, G.H. , Liu, N.J. , Liu, D. , Chen, P.S. , Qin, Y.M. and Zhu, Y.X. (2015) Targeted lipidomics studies reveal that linolenic acid promotes cotton fiber elongation by activating phosphatidylinositol and phosphatidylinositol monophosphate biosynthesis. Mol. Plant, 8, 911–921. [DOI] [PubMed] [Google Scholar]
- Lynch, M. and Conery, J.S. (2000) The evolutionary fate and consequences of duplicate genes. Science, 290, 1151–1155. [DOI] [PubMed] [Google Scholar]
- McKenna, A. , Hanna, M. , Banks, E. , Sivachenko, A. , Cibulskis, K. , Kernytsky, A. , Garimella, K. et al. (2010) The genome analysis toolkit: a MapReduce framework for analyzing next‐generation DNA sequencing data. Genome Res. 20, 1297–1303. [DOI] [PMC free article] [PubMed] [Google Scholar]
- Nei, M. and Gojobori, T. (1986) Simple methods for estimating the numbers of synonymous and nonsynonymous nucleotide substitutions. Mol. Biol. Evol. 3, 418–426. [DOI] [PubMed] [Google Scholar]
- Paterson, A.H. , Wendel, J.F. , Gundlach, H. , Guo, H. , Jenkins, J. , Jin, D. , Llewellyn, D. et al. (2012) Repeated polyploidization of Gossypium genomes and the evolution of spinnable cotton fibres. Nature, 492, 423–427. [DOI] [PubMed] [Google Scholar]
- Peng, Z. , Li, H. , Sun, G. , Dai, P. , Geng, X. , Wang, X. , Zhang, X. et al. (2021) CottonGVD: a comprehensive genomic variation database for cultivated cottons. Front. Plant Sci. 12, 803736. [DOI] [PMC free article] [PubMed] [Google Scholar]
- Pertea, M. , Kim, D. , Pertea, G.M. , Leek, J.T. and Salzberg, S.L. (2016) Transcript‐level expression analysis of RNA‐seq experiments with HISAT, StringTie and ballgown. Nat. Protoc. 11, 1650–1667. [DOI] [PMC free article] [PubMed] [Google Scholar]
- Qin, Y.M. , Hu, C.Y. , Pang, Y. , Kastaniotis, A.J. , Hiltunen, J.K. and Zhu, Y.X. (2007) Saturated very‐long‐chain fatty acids promote cotton fiber and Arabidopsis cell elongation by activating ethylene biosynthesis. Plant Cell, 19, 3692–3704. [DOI] [PMC free article] [PubMed] [Google Scholar]
- Saeed, A. , Sharov, V. , White, J. , Li, J. , Liang, W. , Bhagabati, N. et al. (2003) TM4: a free, open‐source system for microarray data management and analysis. Biotechniques, 34, 374–378. [DOI] [PubMed] [Google Scholar]
- Snel, B. , Bork, P. and Huynen, M.A. (2002) Genomes in flux: the evolution of archaeal and proteobacterial gene content. Genome Res. 12, 17–25. [DOI] [PubMed] [Google Scholar]
- Tian, J. , Wang, C. , Xia, J. , Wu, L. , Xu, G. , Wu, W. , Li, D. et al. (2019) Teosinte ligule allele narrows plant architecture and enhances high‐density maize yields. Science, 365, 658–664. [DOI] [PubMed] [Google Scholar]
- Wang, D. , Zhang, Y. , Zhang, Z. , Zhu, J. and Yu, J. (2010a) KaKs_Calculator 2.0: a toolkit incorporating gamma‐series methods and sliding window strategies. Genom. Proteom. Bioinf. 8, 77–80. [DOI] [PMC free article] [PubMed] [Google Scholar]
- Wang, K. , Li, M. and Hakonarson, H. (2010b) ANNOVAR: functional annotation of genetic variants from high‐throughput sequencing data. Nucleic Acids Res. 38, e164. [DOI] [PMC free article] [PubMed] [Google Scholar]
- Wanjie, S.W. , Welti, R. , Moreau, R.A. and Chapman, K.D. (2005) Identification and quantification of glycerolipids in cotton fibers: reconciliation with metabolic pathway predictions from DNA databases. Lipids, 40, 773–785. [DOI] [PubMed] [Google Scholar]
- Wendel, J.F. , Brubaker, C.L. and Seelanan, T. (2010) The origin and evolution of Gossypium. In Physiology of Cotton( Stewart, J. , Oosterhuis, D. , Heitholt, J. and Mauney, J. , eds), pp. 1–18. Dordrecht: Springer. [Google Scholar]
- Wendel, J.F. , Schnabel, A. and Seelanan, T. (1995) An unusual ribosomal DNA sequence from Gossypium gossypioides reveals ancient, cryptic, intergenomic introgression. Mol. Phylogenet. Evol. 4, 298–313. [DOI] [PubMed] [Google Scholar]
- Wu, H. , Tian, Y. , Wan, Q. , Fang, L. , Guan, X. , Chen, J. , Hu, Y. et al. (2018) Genetics and evolution of MIXTA genes regulating cotton lint fiber development. New Phytol. 217, 883–895. [DOI] [PubMed] [Google Scholar]
- Wu, S.J. , Wang, H.H. , Li, F.F. , Chen, T.Z. , Zhang, J. , Jiang, Y.J. , Ding, Y.Z. et al. (2008) Enhanced agrobacterium‐mediated transformation of embryogenic calli of upland cotton via efficient selection and timely subculture of somatic embryos. Plant Mol. Biol. Rep. 26, 174–185. [Google Scholar]
- Wu, W. , Liu, X. , Wang, M. , Meyer, R.S. , Luo, X. , Ndjiondjop, M.N. , Tan, L. et al. (2017) A single‐nucleotide polymorphism causes smaller grain size and loss of seed shattering during African rice domestication. Nat. Plants, 3, 17064. [DOI] [PubMed] [Google Scholar]
- Yang, L. , Takuno, S. , Waters, E.R. and Gaut, B.S. (2011) Lowly expressed genes in Arabidopsis thaliana bear the signature of possible pseudogenization by promoter degradation. Mol. Biol. Evol. 28, 1193–1203. [DOI] [PubMed] [Google Scholar]
- Yu, J. , Jung, S. , Cheng, C.H. , Ficklin, S.P. , Lee, T. , Zheng, P. , Jones, D. et al. (2014) CottonGen: a genomics, genetics and breeding database for cotton research. Nucleic Acids Research, 42, 1229–1236. [DOI] [PMC free article] [PubMed] [Google Scholar]
- Yu, J. , Hui, Y. , Chen, J. , Yu, H. , Gao, X. , Zhang, Z. , Li, Q. et al. (2021) Whole‐genome resequencing of 240 Gossypium barbadense accessions reveals genetic variation and genes associated with fiber strength and lint percentage. Theor. Appl. Genet. 134, 3249–3261. [DOI] [PubMed] [Google Scholar]
- Zhang, T. , Hu, Y. , Jiang, W. , Fang, L. , Guan, X. , Chen, J. , Zhang, J. et al. (2015) Sequencing of allotetraploid cotton (Gossypium hirsutum L. acc. TM‐1) provides a resource for fiber improvement. Nat. Biotechnol. 33, 531–537. [DOI] [PubMed] [Google Scholar]
- Zhang, Z. , Ruan, Y.L. , Zhou, N. , Wang, F. , Guan, X. , Fang, L. , Shang, X. et al. (2017) Suppressing a Putative Sterol Carrier Gene Reduces Plasmodesmal Permeability and Activates Sucrose Transporter Genes during Cotton Fiber Elongation. Plant Cell, 29, 2027–2046. [DOI] [PMC free article] [PubMed] [Google Scholar]
- Zhang, Z. , Xiao, J. , Wu, J. , Zhang, H. , Liu, G. , Wang, X. and Dai, L. (2012) ParaAT: a parallel tool for constructing multiple protein‐coding DNA alignments. Biochem. Biophys. Res. Commun. 419, 779–781. [DOI] [PubMed] [Google Scholar]
- Zhang, Z. , Chai, M. , Yang, Z. , Yang, Z. and Fan, L. (2022) GRAND: an integrated genome, transcriptome resources, and gene network database for Gossypium . Front. Plant Sci. 13, 773107. [DOI] [PMC free article] [PubMed] [Google Scholar]
- Zhou, Y. , Bai, S. , Li, H. , Sun, G. , Zhang, D. , Ma, F. , Zhao, X. et al. (2021) Introgressing the Aegilops tauschii genome into wheat as a basis for cereal improvement. Nat. Plants, 7, 774–786. [DOI] [PubMed] [Google Scholar]
Associated Data
This section collects any data citations, data availability statements, or supplementary materials included in this article.
Supplementary Materials
Figure S1. Distribution of deleterious variation in different species.
Figure S2. Distribution of disrupted genes across the cotton genome.
Figure S3. Genomic features of disrupted genes related to polyploidization and speciation.
Figure S4. Distribution of Pearson correlation coefficients between A and D homoeologous genes.
Figure S5. Matrix showing Module‐trait relationship of different modules in different G. hirsutum tissues.
Figure S6. Matrix showing Module‐trait relationship of different modules in different G. barbadense tissues.
Figure S7. The expression and sequence characteristics of GhNPLA1A in cotton.
Figure S8. Amino acid sequence alignment of GhNPLA1 and GbNPLA1 in TM‐1 and Hai7124.
Figure S9. Overexpression of GhNPLA1A but not GhNPLA1A‐N and GhNPLA1A–C caused the longer primary root length in seedling development of Arabidopsis.
Figure S10. GhNPLA1A constructs used for genetic transformation.
Figure S11. The effect of alterations in GhNPLA1A on FFA and LPL content in cotton fibres.
Figure S12. Principal component analysis of each phospholipid content in WT, S10 and AS10 plants.
Figure S13. GhNPLA1A may prefer to hydrolyse the linolenic acid from phospholipids containing the linolenic acid moiety in vivo based on the content of the LPLs and FFAs in GhNPLA1A‐altered cotton fibre.
Table S1. Identification of variants associated with gene disruption.
Table S2. List of one‐to‐one homoeologous genes in Gossypium.
Table S3. Statistics of RNA‐seq libraries in this study.
Table S4. List of double‐disrupted and single‐disrupted genes.
Table S5. Gene list of fibre associated module blue2.
Table S6. GO analysis of the module blue2.
Table S7. Single‐lost genes within extremely changed co‐expression network.
Table S8. FPKM values of GhNPLA1 and GbNPLA1 in TM‐1 and Xinhai21.
Table S9. Distribution of 2 bp deletion in cotton genome.
Table S10. Pearson coefficient correlation analysis of four duplicated experiments of each phospholipid content.
Table S11. Oligonucleotides used for gene cloning, qRT‐PCR and vector construction in this study.
Data Availability Statement
All sequenced genomic data and transcriptomic data can be downloaded from the Cotton Omics Database (http://cotton.zju.edu.cn/).