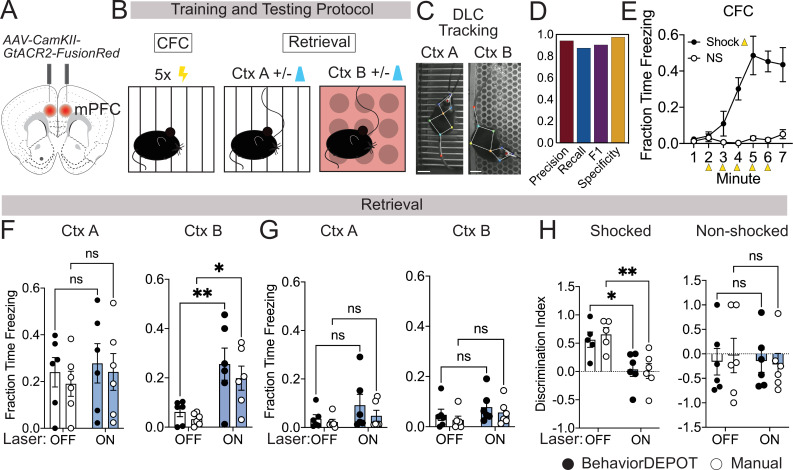
Figure 3. Use Case 1: Optogenetics.
(A) AAV1-CamKII-GtACR2-FusionRed was injected bilaterally into medial prefrontal cortex (mPFC). (B) Behavioral protocol. Mice underwent contextual fear conditioning on day 1. On day 2, mice were returned to the conditioned context or a novel context in a counterbalanced fashion and received 2x2 min 473 nm laser stimulation separated by 2 min laser off intervals. (C) Example DLC tracking of mice attached to patch cords in different contexts. Scale bars, 2cm. (D) Performance of freezing heuristic (Precision: 0.94, Recall: 0.87, F1: 0.91, Specificity: 0.98). (E) Quantification of contextual freezing during training analyzed with BehaviorDEPOT. F–G. Comparing human annotations to BehaviorDEPOT freezing heuristic. (F) Shocked mice: freezing in context A (left) and context B (right) with and without mPFC silencing (CtxA: Flaser(1,10)=0.42, p=0.53; Frater(1,10)=0.35, p=0.57; Off vs. On: PBD = 0.91, PManual = 0.86; CtxB: Flaser(1,10)=26.51, p=0.0004; Frater(1,10)=0.08, p=0.78; Off vs. On: PBD = 0.008, PMan = 0.02; Two-way repeated measures ANOVA and Sidak’s test, N=6 mice per group). (G) Non-shocked controls: freezing in context A (left) and context B (right) with and without mPFC silencing (Ctx A: Flaser(1,10)=3.60, p=0.09; Frater(1,10)=0.79, p=0.39; Off vs. On: PBD = 0.30, PManual = 0.76; CtxB: Flaser(1,10)=1.486, P=0.25; Frater(1,10)=1.59, p=0.24; Off vs. On: PBD = 0.52, PManual = 0.54; Two-way repeated measures ANOVA, N=6 mice per group). (H) Discrimination index = (FreezeA - FreezeB) / (FreezeA +FreezeB) for shocked mice (Flaser(1,10)=17.54, p=0.002; Frater(1,8)=0.09, p=0.77; Mixed-effects analysis, On vs. Off: PBD = 0.02, PManual = 0.004, Sidak’s test, N=5–6 per group) and non-shocked controls (Flaser(1,10)=0.07, p=0.80; Frater(1,8)=0.02, p=0.90; Two-way ANOVA; On vs. Off: PBD = ,0.99 PManual = 0.87, Sidak’s test, N=6 per group). Error bars represent S.E.M.


