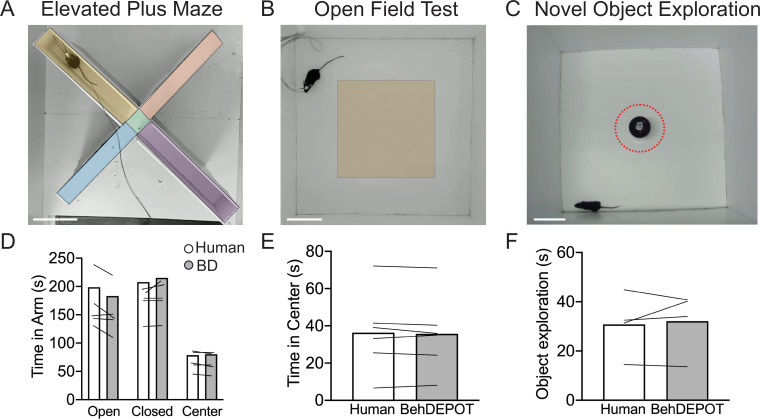
Figure 5. Use cases 3–5: EPM, OFT, NOE.
(A–C) Screens shot from Analysis Module showing user-defined ROIs in the EPM, OFT and NOE. Scale bars, 10 cm. (D) Statistical comparison of human vs. BehaviorDEPOT ratings for time in each arm (FRater (1, 4)=2.260, p=0.21, FArm(2,8)=12.69, P=0.003, Two-way ANOVA; Human vs BD: POpen = 0.15, PClosed = 0.66, PCenter = 0.99, Sidak post-hoc test, N=5 mice). (E) Statistical comparison of human vs. BehaviorDEPOT ratings for time in center (P=0.50, paired t-test, N=6 mice). (F) Statistical comparison of human vs. BehaviorDEPOT ratings for time in center (P=0.66, paired t-test, N=4 mice).

