

Abstract
This study aimed to assess the risk factors for COVID-19 mortality among hospitalized patients in Jordan. All COVID-19 patients admitted to a tertiary hospital in Jordan from September 20, 2020, to August 8, 2021, were included in this study. Demographics, clinical characteristics, comorbidities, and laboratory results were extracted from the patients' electronic records. Multivariable logistic and machine learning (ML) methods were used to study variable importance. Out of 1,613 COVID-19 patients, 1,004 (62.2%) were discharged from the hospital (survived), while 609 (37.8%) died. Patients who were of elderly age (>65 years) (OR, 2.01; 95% CI, 1.28–3.16), current smokers (OR, 1.61; 95%CI, 1.17–2.23), and had severe or critical illness at admission ((OR, 1.56; 95%CI, 1.05–2.32) (OR, 2.94; 95%CI, 2.02–4.27); respectively), were at higher risk of mortality. Comorbidities including chronic kidney disease (OR, 2.90; 95% CI, 1.90–4.43), deep venous thrombosis (OR, 2.62; 95% CI, 1.08–6.35), malignancy (OR, 2.22; 95% CI, 1.46–3.38), diabetes (OR, 1.31; 95% CI, 1.04–1.65), and heart failure (OR, 1.51; 95% CI, 1.02–2.23) were significantly associated with increased risk of mortality. Laboratory abnormalities associated with mortality included hypernatremia (OR, 11.37; 95% CI, 4.33–29.81), elevated aspartate aminotransferase (OR, 1.81; 95% CI, 1.42–2.31), hypoalbuminemia (OR, 1.75; 95% CI, 1.37–2.25), and low platelets level (OR, 1.43; 95% CI, 1.05–1.95). Several demographic, clinical, and laboratory risk factors for COVID-19 mortality were identified. This study is the first to examine the risk factors associated with mortality using ML methods in the Middle East. This will contribute to a better understanding of the impact of the disease and improve the outcome of the pandemic worldwide.
1. Introduction
Severe acute respiratory syndrome coronavirus 2 (SARS-CoV-2), or as it was provisionally named, the 2019 novel coronavirus (2019-nCoV) disease (COVID-19), is a highly contagious viral illness [1]. It has imposed catastrophic global morbidity and mortality burdens with more than 340 million cases and 5 million deaths [2, 3]. In particular, excess mortality of over one million was observed in more than 100 countries in 2020 [4]. Furthermore, a recent study has estimated an excess of 375,235 deaths from direct or indirect effects of COVID-19 [5]. Therefore, even survivors of COVID-19 may develop long-term effects and clinical consequences such as heart and lung damage leading to possible delayed death [6].
The evolution of this pandemic has required the urgent expansion of public health efforts to understand its epidemiology better and identify its impact [7]. Identifying COVID-19 impact requires the elucidation of the spectrum of its clinical severity, including the recognition of potential risk factors for severe illness or death [7]. Consequently, since its emergence, several epidemiological studies have been conducted and shown a significant association between COVID-19 severity and death with demographic characteristics, preexisting comorbidities, and other factors [8, 9].
Several demographic risk factors were observed for COVID-19 severity and mortality including older age and male gender [8, 9]. Ethnicity was also found to be associated with COVID-19 mortality as observed in a study that used OpenSAFELY in which Black and South Asian patients had increased risk of mortality when compared with patients of White ethnicity (adjusted hazard ratio [aHR] 1.48; 95% CI, 1.29–1.69; and 1.45; 95% CI, 1.32–1.58, respectively) [10]. In addition, educational attainment was significantly associated with a lower risk of COVID-19 severity (odds ratio [OR] per one standard deviation increase in years of schooling, 0.540; 95% CI, 0.376–0.777, P=0.0009) in a European study that used Mendelian randomization (MR) approach [11].
Besides, higher scores of the Charlson Comorbidity Index (CCI) were positively associated with mortality in COVID-19 patients with each point increase in the CCI score increasing the risk of death by 2.5% [12]. In fact, comorbidities in COVID-19 patients were found to hasten the progression of the infection that usually ends with patient death [13]. These findings suggest targeting this group of patients in vaccination plans and enhancing earlier identification and treatment to obtain better outcomes [12, 13]. In addition, a multicenter study has used laboratory biomarkers for the establishment of cutoff points and building a risk score ranging from 0 to 30 points. The study found that moderate (12–18 points) and high-risk patients (≥19 points) were positively associated with COVID-19 mortality (OR 4.75; CI 95%, 2.60–8.68 and 23.86; CI 95%, 13.61–41.84, respectively) [14].
These studies have provided a better understanding of COVID-19 impact and have raised several questions that require further investigation. For instance, a recent population-based study has found that heart failure and ischemic heart disease increased the risk of mortality, while atrial fibrillation and hypertension did not, suggesting potential protective effects of comedications [15]. In addition, other studies have investigated COVID-19 impact on patients with particular diseases or conditions in addition to healthy patients [16–20].
Most studies have been conducted in China, Italy, the USA, and other developed high-income countries, while studies from low- and middle-income developing countries in the Middle East are scarce [21, 22]. Therefore, the complete impact of COVID-19 is not thoroughly evaluated, and further studies are required to fill the gap [22]. In this study, we aimed to describe the characteristics of hospitalized patients with COVID-19 and identify the risk factors associated with in-hospital mortality for patients with COVID-19 in Jordan.
2. Materials and Methods
2.1. Data Source and Study Design
This study was conducted using data from King Abdullah University Hospital (KAUH) in Jordan, which has a 750-bed capacity that can be increased to 900 in emergency situations. It is a tertiary hospital and is considered the largest medical facility in the north of the country. All positive COVID-19 patients in the north of Jordan were referred to this hospital, including asymptomatic and mild cases at the beginning of the pandemic. However, hospitalization criteria have changed since August 2020, with only moderate, severe, or critical cases being hospitalized.
A cohort of COVID-19 patients was identified from inpatients' electronic records based on polymerase chain reaction (PCR) positive test results for each referred patient at the hospital. The study period was between September 20, 2020, and August 8, 2021. Cohort members younger than 18 years and those with asymptomatic infection or mild illness were excluded.
2.2. Study Variables
The patients' organized clinical data, including vital signs, radiological findings, comorbidities, and hospitalization course and outcomes were identified from electronic hospital records. Data also included age, gender, smoking status, height, weight, and laboratory results. Body mass index (BMI) was calculated based on the equation of BMI = weight(kg)/height2(m2) and categorized based on the World Health Organization (WHO) classification [23]. Patients with BMI below 18.0 kg/m2 were considered underweight, 18.5–24.9 kg/m2 were of normal weight, 25.0–29.9 kg/m2 were overweight, and patients with BMI equal to or more than 30.0 kg/m2 were considered obese. Comorbidities were identified based on related International Classification of Diseases (ICD) codes, and laboratory results were interpreted based on the reference values of the hospital laboratory. The patient severity status at admission was classified according to the National Institute of Health (NIH) Clinical Spectrum of SARS-CoV-2 Infection [24]. Patients with a positive test and no symptoms were considered “asymptomatic” while if any of the various signs and symptoms of COVID-19 were observed with no shortness of breath, dyspnea, or abnormal chest imaging then these were considered to have “mild illness.” “Moderate illness” individuals included those who showed evidence of lower respiratory disease during clinical assessment or imaging and who had an oxygen saturation (SpO2) ≥94% on room air at sea level. Patients who had SpO2 <94%, a ratio of arterial partial pressure of oxygen to fraction of inspired oxygen (PaO2/FiO2) <300 mm Hg, a respiratory rate >30 breaths/min, or lung infiltrates >50% were considered of “severe illness.” “Critically ill” patients included those who had respiratory failure, septic shock, and/or multiple organ dysfunction.
2.3. Statistical Analysis
Analysis began with a distributional analysis of patients' characteristics. All categorical data were encoded using a one-hot approach which transforms categorical variables into binary vectors. Summary tables were created to examine the proportion of inpatients with COVID-19 by age group, gender, and clinical characteristics. The mortality rates associated with each characteristic were analyzed using χ2 tests to evaluate statistical differences in the frequencies of the categorical groups. In addition to ratio testing, we used univariate logistic regression to produce the odds ratio and statistical significance for each one-hot transformed characteristic. A 2-sided P ≤ 0.05 was considered statistically significant.
After examining the variable importance of each characteristic with the increased mortality rate for COVID-19 inpatients, multivariable logistics and machine learning (ML) methods were used to study the variable importance in a comprehensive manner concerning classification modeling. Variable importance is generally defined as the sum of the decrease in error when the variable is included in the model. For linear models, variable importance is based on the absolute t-value of each model parameter used. MARS models look at reductions in the modified generalized cross-validation (MGCV) estimate of error.
| (1) |
where N is the number of observations, and C(M)∗ is a complexity penalty.
The relative importance is the variable importance divided by the highest variable importance value so that values are scaled between 0 and 1. This makes it convenient to compare and combine variable performance across multiple methods.
The ML methods considered were Random Forest (RF), Multivariate Adaptive Regression Splines (MARS), K-Nearest Neighbor (KNN), Extreme Gradient Boosting (XGB), and Classification and Regression Trees (CART). There are other ML methods and classification methods that can be entertained in addition to the methods employed here. For example, a stepwise regression method can be used to directly eliminate model parameters in the model given an overparameterized starting model. However, we feel the methods selected are among the most consistent in producing classification accuracy.
In terms of the MARS model notation, this is written y=α′c1(x − τ∗) ± c2(τ∗ − x)++e, where τ∗ is the threshold value for the x predictor variable, and (·)+ are the spline functions which take on the value 0 if the expression inside (·)+ is negative or its actual value if the expression inside (·)+ is >0. The other considered ML methods are based on classification trees differing by an algorithmic implementation that recursively split variables. These algorithms are quite involved and would take considerable space to describe here and recommend further information to be found in the work Generalized Additive Models by Hastie and Tibshirani [25].
A ten-fold cross-validation method was used to train the ML methods and extract the combined relative importance of the variables identified in each fold. The results from the ten folds were then combined to produce a collective measure of variable importance by the number of times the variable appeared across folds and the magnitude of the variable predictive power. To combine variable importance across multiple methods, the importance measures were scaled between 100 and 0. The variables' importance for all methods were then combined into a single importance measure and were presented using a lollipop chart. The reduced set of variables was then used to refine a multivariable logistic regression model that can quantify potential risk factors that result in death, adjusted for other confounding characteristics. The backward stepwise variable selection method was used to determine the variables included in the final multivariable logistic regression model. A significant level of P < 0.05 was used to retain variables in the final logistic model. To assess the classification accuracy of the final multivariable logistic model compared to the other ML methods, the dataset was randomly partitioned into a training set (70% of data) and a testing set (30% of the data) using a stratified method so that the distributions are as consistent as possible. A panel of receiver operator characteristic (ROC) charts was created. The ROC charts show the performance of a classification model at all classification thresholds using the holdout testing set. The curve plots the True Positive Classification Rate versus the False Positive Classification Rate. The area under the curve (AUC) is an aggregate measure of performance across all possible classification thresholds. All analyses were carried out using the 4.1.0 release of the R package.
3. Results
Over the study period, a total of 1,613 patients with confirmed COVID-19 who were admitted to KAUH met the inclusion criteria and were included in this study. Of these patients, 1,004 (62.2%) were discharged from the hospital (survived), and 609 (37.8%) died (deceased). Table 1 shows the characteristics, comorbidities, and disease severity of the patients by their hospitalization outcome (survived or deceased). Among all patients, 945 (58.6%) were male, 669 (41.5%) were obese (BMI ≥30 kg/m2), and 963 (59.7%) and 802 (49.7%) had hypertension and diabetes, respectively. Surviving patients were of a younger age group (18–40 years old), nonsmokers, and with moderate severity on admission (patients with lower respiratory disease and who have SpO2 ≥94%). Higher proportions of deceased patients compared to the survived patients were observed among those with heart failure (n = 73, 51.0%; p value = 0.001), cerebrovascular accident (CVA) (n = 61, 55.5%; p value <0.001), chronic kidney disease (CKD) (n = 85, 66.9%; p value <0.001), immunocompromised (n = 37, 56.9%; p value = 0.002), and malignancy (n = 65, 54.6%; p value <0.001).
Table 1.
Characteristics, comorbidities, and disease severity in patients with COVID-19 (N = 1,613).
| Characteristics | Overall sample (N = 1,613) | Survived (N = 1,004) | Deceased (N = 609) | p value |
|---|---|---|---|---|
| No. (%) | No. (%) | No. (%) | ||
| Age, years | ||||
| 18–40 | 148 (9.2) | 115 (77.7) | 33 (22.3) | <0.001 |
| 41–65 | 737 (45.7) | 520 (70.6) | 217 (29.4) | |
| >65 | 728 (45.1) | 369 (50.7) | 359 (49.3) | |
|
| ||||
| Gender | ||||
| Female | 668 (41.4) | 427 (63.9) | 241 (36.1) | 0.264 |
| Male | 945 (58.6) | 577 (61.1) | 368 (38.9) | |
|
| ||||
| Body mass index, (kg/m2) | ||||
| Underweight (<18.5) | 4 (0.2) | 2 (50.0) | 2 (50.0) | 0.221 |
| Normal (18.5–25) | 227 (14.1) | 134 (59.0) | 93 (41.0) | |
| Overweight (25–30) | 554 (34.3) | 357 (64.4) | 197 (35.6) | |
| Obese (>30) | 669 (41.5) | 403 (60.2) | 266 (39.8) | |
| Unknown | 159 (9.9) | 108 (67.9) | 51 (32.1) | |
|
| ||||
| Smoking status | ||||
| Current smoker | 223 (13.8) | 123 (55.2) | 100 (44.8) | 0.009 |
| Ex-smoker | 191 (11.8) | 107 (56.0) | 84 (44.0) | |
| Nonsmoker | 1,199 (74.3) | 774 (64.6) | 425 (35.4) | |
|
| ||||
| Comorbidities | ||||
| Hypertension | 963 (59.7) | 558 (57.9) | 405 (42.1) | <0.001 |
| Diabetes mellitus | 802 (49.7) | 467 (58.2) | 335 (41.8) | 0.001 |
| Dyslipidemia | 86 (5.3) | 52 (60.5) | 34 (39.5) | 0.814 |
| Ischemic heart disease | 291 (18.0) | 156 (53.6) | 135 (46.4) | 0.001 |
| Atrial fibrillation | 60 (3.7) | 35 (58.3) | 25 (41.7) | 0.616 |
| Heart failure | 143 (8.9) | 70 (49.0) | 73 (51.0) | 0.001 |
| Asthma | 49 (3.0) | 31 (63.3) | 18 (36.7) | 0.999 |
| Chronic obstructive pulmonary disease | 17 (1.1) | 7 (41.2) | 10 (58.8) | 0.121 |
| Sleep apnea | 12 (0.7) | 7 (58.3) | 5 (41.7) | 0.999 |
| Cerebrovascular accident (old stroke) | 110 (6.8) | 49 (44.5) | 61 (55.5) | <0.001 |
| Chronic kidney disease | 127 (7.9) | 42 (33.1) | 85 (66.9) | <0.001 |
| End-stage renal disease | 32 (2.0) | 18 (56.3) | 14 (43.8) | 0.576 |
| Chronic liver disease | 4 (0.2) | 1 (25.0) | 3 (75.0) | 0.307 |
| Liver cirrhosis | 2 (0.1) | 0 (0.0) | 2 (100.0) | 0.277 |
| Rheumatoid arthritis | 21 (1.3) | 11 (52.4) | 10 (47.6) | 0.476 |
| History of venous thromboembolism | 26 (1.6) | 11 (42.3) | 15 (57.7) | 0.056 |
| Immunocompromised | 65 (4.0) | 28 (43.1) | 37 (56.9) | 0.002 |
| Malignancy | 119 (7.4) | 54 (45.4) | 65 (54.6) | <0.001 |
| Hypothyroidism | 78 (4.8) | 43 (55.1) | 35 (44.9) | 0.227 |
| Gout | 74 (4.6) | 46 (62.2) | 28 (37.8) | 0.999 |
|
| ||||
| Severity on admission | ||||
| Moderate | 226 (14.0) | 173 (76.5) | 53 (23.5) | <0.001 |
| Severe | 522 (32.4) | 359 (68.8) | 163 (31.2) | |
| Critical | 865 (53.6) | 472 (54.6) | 393 (45.4) | |
The laboratory findings from COVID-19 patients are shown in Table 2. Among all patients, a large proportion had high levels of C-reactive protein (CRP) (n = 1,129, 70.0%), D-dimer (n = 1, 192, 73.9%), and lactate dehydrogenase (LDH) (n = 1,112, 68.9%). Higher proportions of deceased patients compared to survived patients had hypernatremia (n = 43, 89.6%; p value <0.001), hyperkalemia (n = 61, 54.5%; p value <0.001), and high troponin level (n = 15, 62.5%; p value = 0.041).
Table 2.
Laboratory characteristics of COVID-19 patients (N = 1,613).
| Laboratory test | Overall sample (n = 1,6013) | Survived (N = 1,004) | Deceased (N = 609) | p value |
|---|---|---|---|---|
| No. (%) | No. (%) | No. (%) | ||
| C-reactive protein (CRP) ∗ | ||||
| High | 1,129 (70.0) | 685 (60.7) | 444 (39.3) | 0.004 |
| Low | 28 (1.7) | 25 (89.3) | 3 (10.7) | |
| Unknown | 456 (28.3) | 294 (64.5) | 162 (35.5) | |
|
| ||||
| D-dimer ∗ | ||||
| High | 1, 192 (73.9) | 724 (60.7) | 468 (39.3) | 0.038 |
| Low | 11 (0.7) | 5 (45.5) | 6 (54.5) | |
| Unknown | 410 (25.4) | 275 (67.1) | 135 (32.9) | |
|
| ||||
| Lactate dehydrogenase (LDH) ∗ | ||||
| High | 1.112 (68.9) | 679 (61.1) | 433 (38.9) | 0.071 |
| Normal | 33 (2.0) | 27 (81.8) | 6 (18.2) | |
| Low | 1 (0.1) | 1 (100.0) | 0 (0.0) | |
| Unknown | 467 (29.0) | 297 (63.6) | 170 (36.4) | |
|
| ||||
| Sodium ∗ | ||||
| Hypernatremia | 48 (3.0) | 5 (10.4) | 43 (89.6) | <0.001 |
| Normal | 862 (53.4) | 544 (63.1) | 318 (36.9) | |
| Hyponatremia | 470 (29.1) | 285 (60.6) | 185 (39.4) | |
| Unknown | 233 (14.4) | 170 (73.0) | 63 (27.0) | |
|
| ||||
| Potassium ∗ | ||||
| Hyperkalemia | 112 (6.9) | 51 (45.5) | 61 (54.5) | <0.001 |
| Normal | 1,134 (70.3) | 709 (62.5) | 425 (37.5) | |
| Hypokalemia | 134 (8.3) | 74 (55.2) | 60 (44.8) | |
| Unknown | 233 (14.4) | 170 (73.0) | 63 (27.0) | |
|
| ||||
| Albumin ∗ | ||||
| Normal | 616 (38.2) | 443 (71.9) | 173 (28.1) | <0.001 |
| Hypoalbuminemia | 747 (46.3) | 380 (50.9) | 367 (49.1) | |
| Unknown | 250 (15.5) | 181 (72.4) | 69 (27.6) | |
|
| ||||
| Alanine transaminase (ALT) ∗ | ||||
| High | 290 (18.0) | 171 (59.0) | 119 (41.0) | <0.001 |
| Normal | 1,103 (68.4) | 669 (60.7) | 434 (39.3) | |
| Unknown | 220 (13.6) | 164 (74.5) | 56 (25.5) | |
|
| ||||
| Aspartate aminotransferase (AST) ∗ | ||||
| High | 589 (36.5) | 307 (52.1) | 282 (47.9) | <0.001 |
| Normal | 802 (49.7) | 531 (66.2) | 271 (33.8) | |
| Unknown | 222 (13.8) | 166 (74.8) | 56 (25.2) | |
|
| ||||
| Troponin ∗ | ||||
| High | 24 (1.5) | 9 (37.5) | 15 (62.5) | 0.041 |
| Normal | 520 (32.2) | 327 (62.9) | 193 (37.1) | |
| Unknown | 1,069 (66.3) | 668 (62.5) | 401 (37.5) | |
|
| ||||
| Platelets ∗ | ||||
| High | 139 (8.6) | 91 (65.5) | 48 (34.5) | <0.001 |
| Normal | 1,094 (67.8) | 684 (62.5) | 410 (37.5) | |
| Low | 254 (15.7) | 133 (52.4) | 121 (47.6) | |
| Unknown | 126 (7.8) | 96 (76.2) | 30 (23.8) | |
∗ Normal levels: CRP: 0.0–5.0 mg/L; D-dimer: 0.1–0.5 ug/ml; LDH: 264.6–441.0 U/L; sodium: 135–145 mmol/L; potassium: 3.7–5.4 mmol/L; albumin: 35–52 g/L; ALT: 0.0–41.0 U/L; AST: 0.0–40.0 U/L; troponin: 0.000–0.20 ng/ml; platelets: 150 × 103–400 × 103/mm3.
Multivariate logistic regression showed that elderly age (>65 years old) (OR, 2.01; 95% CI, 1.28–3.16; p value = 0.003) and current smoking status (OR, 1.61; 95% CI, 1.17–2.23; p value = 0.004) were strongly associated with in-hospital mortality (Table 3). Odds of severity status were almost doubled for the risk of mortality between severe (OR, 1.56; 95% CI, 1.05–2.32; p value <0.001) and critical (OR, 2.94; 95% CI, 2.02–4.27; p value <0.001) cases of COVID-19 patients on admission. Although significant, higher odds for in-hospital mortality were observed for CKD (OR, 2.90; 95% CI, 1.90–4.43; p value <0.001), DVT (OR, 2.62; 95%CI, 1.08–6.35; p value = 0.033), and malignancy (OR, 2.22; 95% CI, 1.46–3.38; p value <0.001) compared to diabetes (OR, 1.31; 95% CI, 1.04–1.65; p value = 0.022) and heart failure (OR, 1.51; 95% CI, 1.02–2.23; p value = 0.041). Hypernatremia level was the risk factor most strongly associated with mortality among COVID-19 patients (OR, 11.37; 95% CI, 4.33–29.81; p value <0.001). Other significantly associated lab results with mortality included high AST (OR, 1.81; 95% CI, 1.42–2.31; p value <0.001), hypoalbuminemia levels (OR, 1.75; 95% CI, 1.37–2.25; p value <0.001), and low platelets level (OR, 1.43; 95% CI, 1.05–1.95; p value = 0.024).
Table 3.
Multivariate logistic regression results assess the risk factors associated with in-hospital mortality among inpatients with confirmed COVID-19.
| Covariate | Univariate regression | Multivariate regression | ||
|---|---|---|---|---|
| Or (95% CI) | p value | Or (95% CI) | p value | |
| Age, years | ||||
| 18–40 (reference) | ||||
| 41–65 | 1.45 (0.96–2.21) | 0.079 | 1.06 (0.68–1.67) | 0.786 |
| >65 | 3.39 (2.24–5.13) | <0.001 | 2.01 (1.28–3.16) | 0.003 |
|
| ||||
| Severity | ||||
| Moderate (reference) | ||||
| Severe | 1.48 (1.04–2.12) | 0.032 | 1.56 (1.05–2.32) | <0.001 |
| Critical | 2.72 (1.94–3.80) | <0.001 | 2.94 (2.02–4.27) | <0.001 |
|
| ||||
| Smoking status | ||||
| Nonsmoker (reference) | ||||
| Current smoker | 1.48 (1.11–1.98) | 0.008 | 1.61 (1.17–2.23) | 0.004 |
| Ex-smoker | 1.43 (1.05–1.95) | 0.024 | 1.31 (0.94–1.84) | 0.115 |
|
| ||||
| Comorbidities | ||||
| Chronic kidney disease, yes vs. no | 3.72 (2.53–5.46) | <0.001 | 2.90 (1.90–4.43) | <0.001 |
| Diabetes miletus, yes vs. no | 1.41 (1.15–1.72) | 0.001 | 1.31 (1.04–1.65) | 0.022 |
| Heart failure, yes vs. no | 1.82 (1.29–2.57) | 0.001 | 1.51 (1.02–2.23) | 0.041 |
| History of DVT/PE, yes vs. no | 2.28 (1.04–5.00) | 0.040 | 2.62 (1.08–6.35) | 0.033 |
| Malignancy, yes vs. no | 2.10 (1.44–3.06) | <0.001 | 2.221 (1.46–3.38) | <0.001 |
|
| ||||
| Lab results | ||||
| Sodium normal (reference) | ||||
| Hypernatremia | 14.71 (5.77–37.52) | <0.001 | 11.37 (4.33–29.81) | <0.001 |
| Hyponatremia | 1.11 (0.88–1.40) | 0.374 | 0.91 (0.71–1.18) | 0.474 |
| Albumin normal (reference) | ||||
| Hypoalbuminemia | 2.47 (1.97–3.10) | <0.001 | 1.75 (1.37–2.25) | <0.001 |
| Normal AST level (reference) | ||||
| High AST level | 1.80 (1.45–2.24) | <0.001 | 1.81 (1.42–2.31) | <0.001 |
| Platelets normal (reference) | ||||
| Platelets high | 0.88 (0.61–1.28) | 0.499 | 0.84 (0.56–1.27) | 0.402 |
| Platelets low | 1.52 (1.15–2.00) | 0.003 | 1.43 (1.05–1.95) | 0.024 |
Figure 1 shows the variable reduction based on the consensus variable importance extracted from multiple ML methods. Logistic regression was then applied to the consensus. The variables selected for the final multiple logistic regression model are highlighted in black color.
Figure 1.
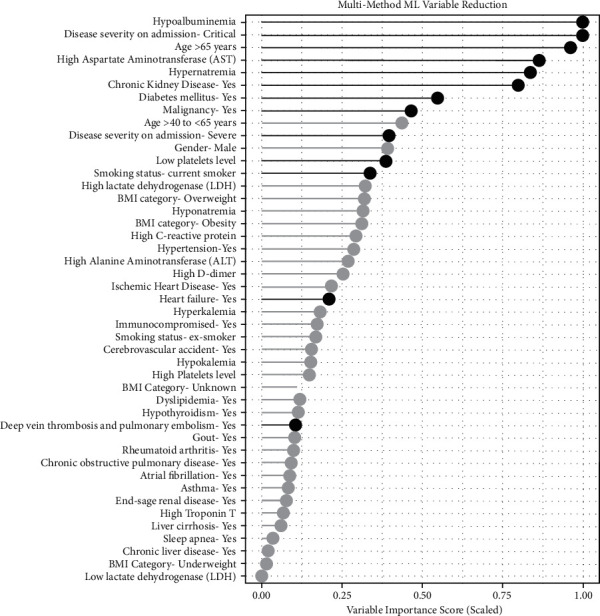
Variable reduction based on the consensus variable importance extracted from multiple ML methods. Variables highlighted in black color represent variables selected for the final multiple logistic regression model.
A sunburst chart with nested rings illustrating the hierarchical breakdown of identified risk factors segmented by patients' outcome, that is, death versus discharge, is shown in Figure 2.
Figure 2.
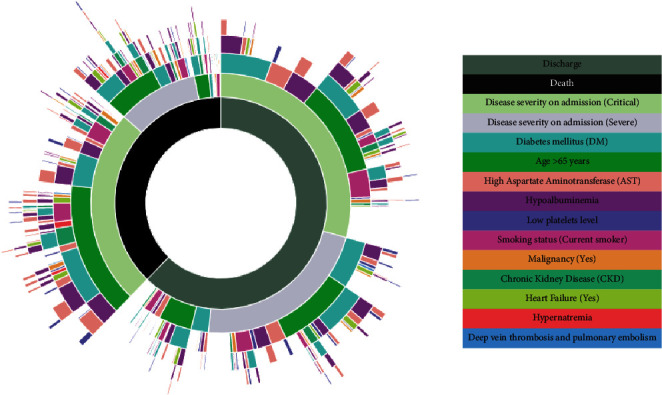
Sunburst chart with nested rings illustrating the hierarchical breakdown of identified risk factors segmented by patients' outcome, that is, death versus discharge.
The panel of Receiver Operator Characteristic (ROC) chart is shown in Figure 3 and ordered by predictive accuracy. The multivariable logistic regression model has the best predictive classification power among the other methods considered.
Figure 3.
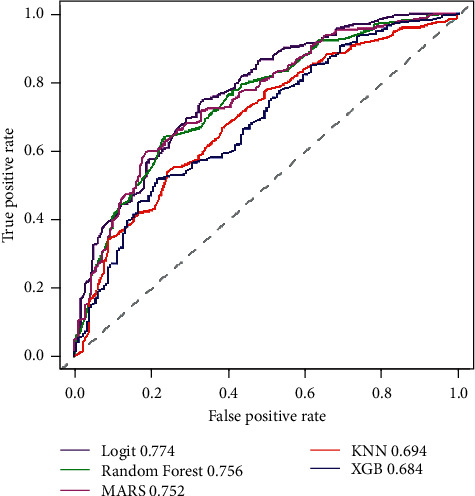
Receiver Operator Characteristic (ROC) charts for the Multiple Logistic Regression model compared to the multiple ML methods used for variable reduction.
4. Discussion
In this study, we observed a high hospital mortality (37.8%) among hospitalized COVID-19 patients. Almost half of the deceased patients (45.4%) had critical disease on admission. The study identified several risk factors for increased hospital mortality including older age, current smoking status, critical disease on admission, the presence of comorbidities, and initial laboratory derangements. To our knowledge, this study is the first to examine the risk factors associated with mortality in the Middle East.
Several studies have found that older age was significantly associated with increased mortality of COVID-19 [17, 26–29]. Consistent with our findings, a meta-analysis of 42 studies comprising 423,117 patients showed an increased risk of mortality among older people (pooled OR 2.61; 95% CI 1.75–3.47) [26]. Specifically, among 16 countries, COVID-19 patients aged 65 or older had a 62-fold higher risk of mortality than younger age groups (IRR = 62.1; 95% CI = 59.7, 64.7) [30]. The increase in mortality among the elderly may be attributed to the high prevalence of comorbidities [9]. However, a study that used UK Biobank data and included 470,034 participants concluded that, although to a lower extent, healthy elderly COVID-19 patients still have an independently increased risk of mortality [31]. This would suggest a role of other age-related factors in COVID-19 mortality, such as a decreased reserve capacity of vital organs or weaker immune defenses [32].
Our results were not consistent with the findings of other studies that showed evidence of increased mortality in male COVID-19 patients [33–36]. However, most of these studies were at the early stages of COVID-19 and were based on records that under urgent circumstances may have had missing data and used unadjusted risk estimates [33]. On the other hand, female cases and deaths from COVID-19 may have been underreported due to social norms of lower access to healthcare [37]. Therefore, gender differences should be further investigated to avoid bias in COVID-19 treatment, particularly with the similar risk of dying observed between males and females in severe cases [38, 39].
A recent systematic review and meta-analysis of 186 studies representing 210,447 deaths among 1,304,587 patients with COVID-19, found a significant increase in mortality among patients with diabetes (summary relative risk (SRR) = 1.54; 95% CI 1.44–1.64), hypertension (SRR = 1.42; 95% CI 1.30–1.54), obesity (SSR = 1.45; 95% CI 1.31–1.61), and smoking (SRR = 1.28; 95% CI 1.17 to 1.40 forever smoking, SRR = 1.29; 95% CI 1.03 to 1.62 for current smoking, and SRR = 1.25; 95% CI 1.11 to 1.42 for ex-smokers compared with nonsmokers) [40]. However, in our study, obesity and hypertension did not appear statistically significant in the final model, and an ex-smoker status was no longer significant when conducting the multivariate analyses. Similar to our findings, CKD was significantly associated with an increased risk of death (pooled OR = 5.58; 95% CI 3.27–9.54) [41]. Other comorbidities, including HF, history of DVT and PE, and malignancy were also found to be significantly associated with increased mortality in COVID-19 patients in several studies [42–46].
In health outcome predictive evaluation (HOPE) for COVID-19 registry analysis, both hypernatremia (OR 2.38, 95% CI 1.18–4.78; p=0.015) and hyponatremia (OR 1.5, 95% CI 1.08–2.09; p=0.016) were found to be independently associated with COVID-19 mortality [47]. This is consistent with our findings for hypernatremia but not hyponatremia. However, the admittance frequency with hyponatremia (20.5%) was higher than that with hypernatremia (3.7%), as observed in our study [47]. Besides being consistent with our findings, several studies have identified hypoalbuminemia as a predictor of mortality among admitted COVID-19 patients, suggesting the determination of serum albumin on admission may be useful and there could be a potential therapeutic value for albumin infusion in COVID‐19 management [48–50]. Similarly, low platelet level was found to be significantly associated with COVID-19 mortality, as observed in our study [51, 52]. However, the prognostic value of the thrombocytopenia therapeutic approach appears to be complicated and careful consideration is advised [53].
This study was relatively large and included data from the Middle East with PCR-confirmed COVID-19 cases. It used in-patient record data from a tertiary hospital to reflect the reality of COVID-19 clinical management in the region. However, the observational nature of this study does not have a temporal sequence and therefore cannot lead to causal associations.
5. Conclusions
Several demographic, clinical, and laboratory risk factors for COVID-19 mortality were identified, including severity status on admission. Further studies in real-life settings are required, particularly in the region, to identify early predictors and provide better management of the illness to control the pandemic and reduce its impact.
Data Availability
Data are available based upon request from KAUH.
Additional Points
Problem Statement. What is already known about this topic? (i)COVID-19 is a highly contagious illness that causes high mortality worldwide. (ii) Mortality in COVID-19 patients has been associated with several risk factors including demographics and preexisting comorbidities. (iii) Similar studies using real data in the Middle East are scarce. What does this article add? (i) The study is the first to identify potential risk factors for COVID-19 mortality in the Middle East. (ii) Machine learning methods were used to study the variable's importance. (iii) Recognition of the full impact of COVID-19 is important to control the pandemic.
Ethical Approval
Ethical approval for this study was obtained from the Institutional Review Board (IRB) Committee of Jordan University of Science and Technology, Irbid, Jordan (27/137/2021).
Conflicts of Interest
The authors declare that there are no conflicts of interest regarding the publication of this article.
Authors' Contributions
All authors conceptualized the study; R. K., B. Y. K., S. A.-A., A.-H. A.-M., S. K., S. S. H, and M. A. A. were responsible for methodology; R. K., B. Y. K., S. A.-A., A.-H. A.-M., S. K., and M. A. A. validated the data; R. K., W. J. L., M. A., and M. A. A. performed formal analysis; all authors interpreted the data, reviewed and edited the manuscript, critically revised the report, and approved the final version to be submitted for publication; R. K. prepared the original draft.
References
- 1.Gorbalenya A. E., Baker S. C., Baric R. S., et al. The species Severe acute respiratory syndrome-related coronavirus: classifying 2019-nCoV and naming it SARS-CoV-2. Nature Microbiology . 2020;5 doi: 10.1038/s41564-020-0695-z. [DOI] [PMC free article] [PubMed] [Google Scholar]
- 2.Gebru A. A., Birhanu T., Wendimu E., et al. Global burden of COVID-19: situational analyis and review. Human Antibodies . 2021;29(2):139–148. doi: 10.3233/hab-200420. [DOI] [PubMed] [Google Scholar]
- 3.World health organization WHO coronavirus (COVID-19) dashboard. WHO Coronavirus (COVID-19) Dashboard With Vaccination Data . Geneva, Switzerland: WHO; 2021. pp. 1–5. [Google Scholar]
- 4.Islam N., Shkolnikov V. M., Acosta R. J., et al. Excess deaths associated with covid-19 pandemic in 2020: age and sex disaggregated time series analysis in 29 high income countries. BMJ . 2021;373 doi: 10.1136/bmj.n1137.n1137 [DOI] [PMC free article] [PubMed] [Google Scholar]
- 5.Chan E. Y. S., Cheng D., Martin J. Impact of COVID-19 on excess mortality, life expectancy, and years of life lost in the United States. PLoS One . 2021;16(9) doi: 10.1371/journal.pone.0256835.e0256835 [DOI] [PMC free article] [PubMed] [Google Scholar]
- 6.Smith M. P. Estimating total morbidity burden of COVID-19: relative importance of death and disability. Journal of Clinical Epidemiology . 2022;142(142):54,–59. doi: 10.1016/j.jclinepi.2021.10.018. [DOI] [PMC free article] [PubMed] [Google Scholar]
- 7.Lipsitch M., Phil D., Swerdlow D. L., Finelli L. Defining the epidemiology of Covid-19-studies needed. The New England Journal Medicine . 2020;382 doi: 10.1056/NEJMp2002125. [DOI] [PubMed] [Google Scholar]
- 8.Du P., Li D., Wang A., Shen S., Ma Z., Li X. A systematic review and meta-analysis of risk factors associated with severity and death in COVID-19 patients. Canadian Journal of Infectious Diseases and Medical Microbiology . 2021;2021:12. doi: 10.1155/2021/6660930.6660930 [DOI] [PMC free article] [PubMed] [Google Scholar]
- 9.Zhang J. J., Dong X., Liu G. H., Gao Y. D. risk and protective factors for COVID-19 morbidity, severity, and mortality. Clinical Reviews in Allergy and Immunology . 2022 doi: 10.1007/S12016-022-08921-5. [DOI] [PMC free article] [PubMed] [Google Scholar]
- 10.Williamson E. J., Walker A. J., Bhaskaran K., et al. Factors associated with COVID-19-related death using OpenSAFELY. Nature . 2020;584(7821):430–436. doi: 10.1038/s41586-020-2521-4. [DOI] [PMC free article] [PubMed] [Google Scholar]
- 11.Yoshikawa M., Asaba K. Educational attainment decreases the risk of COVID-19 severity in the European population: a two-sample mendelian randomization study. Frontiers in Public Health . 2021;9(9) doi: 10.3389/fpubh.2021.673451.673451 [DOI] [PMC free article] [PubMed] [Google Scholar]
- 12.Comoglu S., Kant A. does the Charlson Comorbidity Index Help Predict the Risk of Death in COVID-19 Patients? Northern Clinic of Istanbul . 2022;9 doi: 10.14744/nci.2022.33349. [DOI] [PMC free article] [PubMed] [Google Scholar]
- 13.Sanyaolu A., Okorie C., Marinkovic A., et al. Comorbidity and its impact on patients with COVID-19. SN Comprehensive Clinical Medicine . 2020;2(8):1069–1076. doi: 10.1007/s42399-020-00363-4. [DOI] [PMC free article] [PubMed] [Google Scholar]
- 14.Antunez Muiños P. J., López Otero D., Amat-Santos I. J., et al. The COVID-19 lab score: an accurate dynamic tool to predict in-hospital outcomes in COVID-19 patients. Scientific Reports . 2021;11:1–9. doi: 10.1038/s41598-021-88679-6. [DOI] [PMC free article] [PubMed] [Google Scholar]
- 15.Hergens M.-P., Bell M., Haglund P., et al. Risk factors for COVID-19-related death, hospitalization and intensive care: a population-wide study of all inhabitants in Stockholm. European Journal of Epidemiology . 2022;37(2):157–165. doi: 10.1007/s10654-021-00840-7. [DOI] [PMC free article] [PubMed] [Google Scholar]
- 16.Varshney K., Ghosh P., Stiles H., Iriowen R. Risk factors for COVID-19 mortality among people living with HIV: a scoping review. AIDS and Behaviour . 2022;26 doi: 10.1007/S10461-022-03578-9. [DOI] [PMC free article] [PubMed] [Google Scholar]
- 17.Salerno S., Messana J. M., Gremel G. W., et al. COVID-19 risk factors and mortality outcomes among medicare patients receiving long-term dialysis. JAMA Network Open . 2021;4(11) doi: 10.1001/jamanetworkopen.2021.35379.e2135379 [DOI] [PMC free article] [PubMed] [Google Scholar]
- 18.Li X., Xu S., Yu M., et al. Risk factors for severity and mortality in adult COVID-19 inpatients in Wuhan. The Journal of Allergy and Clinical Immunology . 2020;146(1):110,–118. doi: 10.1016/j.jaci.2020.04.006. [DOI] [PMC free article] [PubMed] [Google Scholar]
- 19.Yek C., Warner S., Wiltz J. L., et al. Risk factors for severe COVID-19 outcomes among persons aged ≥18 Years who completed a primary COVID-19 vaccination series—465 health care facilities, United States, December 2020-October 2021. MMWR. Morbidity and Mortality Weekly Report . 2022;71:19–25. doi: 10.15585/MMWR.MM7101A4. [DOI] [PMC free article] [PubMed] [Google Scholar]
- 20.Mehta H. B., Li S., Goodwin J. S. Risk factors associated with SARS-CoV-2 infections, hospitalization, and mortality among US nursing home residents. JAMA Network Open . 2021;4(3) doi: 10.1001/jamanetworkopen.2021.6315.e216315 [DOI] [PMC free article] [PubMed] [Google Scholar]
- 21.Wolff D., Nee S., Hickey N. S., Marschollek M. Risk factors for Covid-19 severity and fatality: a structured literature review. Infection . 2021;49(1):15,–28. doi: 10.1007/s15010-020-01509-1. [DOI] [PMC free article] [PubMed] [Google Scholar]
- 22.Simonsen L., Viboud C. A comprehensive look at the COVID-19 pandemic death toll. Elife . 2021;10 doi: 10.7554/elife.71974.e71974 [DOI] [PMC free article] [PubMed] [Google Scholar]
- 23.WHO/Europe | Nutrition—Body Mass Index—BMI. 2022. https://www.euro.who.int/en/health-topics/disease-prevention/nutrition/a-healthy-lifestyle/body-mass-index-bmi (accessed on.
- 24.Clinical Spectrum | COVID-19 Treatment Guidelines. 2022. https://www.covid19treatmentguidelines.nih.gov/overview/clinical-spectrum/
- 25.Hastie T., Tibshirani R. Generalized Additive Models . London, UK: CHAPMAN & HALL/CRC; 1990. [DOI] [PubMed] [Google Scholar]
- 26.Dessie Z. G., Zewotir T. Mortality-related risk factors of COVID-19: a systematic review and meta-analysis of 42 studies and 423, 117 patients. BMC Infectious Diseases . 2021;21(1) doi: 10.1186/s12879-021-06536-3. [DOI] [PMC free article] [PubMed] [Google Scholar]
- 27.Albitar O., Ballouze R., Ooi J. P., Sheikh Ghadzi S. M. Risk factors for mortality among COVID-19 patients. Diabetes Research and Clinical Practice . 2020;166 doi: 10.1016/j.diabres.2020.108293.108293 [DOI] [PMC free article] [PubMed] [Google Scholar]
- 28.Booth A., Reed A. B., Ponzo S., et al. Population risk factors for severe disease and mortality in COVID-19: a global systematic review and meta-analysis. PLoS One . 2021;16(3) doi: 10.1371/journal.pone.0247461.e0247461 [DOI] [PMC free article] [PubMed] [Google Scholar]
- 29.Zhang L., Hou J., Ma F. Z., Li J., Xue S., Xu Z. G. The common risk factors for progression and mortality in COVID-19 patients: a meta-analysis. Archives of Virology . 2021;166(8):2071–2087. doi: 10.1007/s00705-021-05012-2. [DOI] [PMC free article] [PubMed] [Google Scholar]
- 30.Yanez N. D., Weiss N. S., Romand J. A., Treggiari M. M. COVID-19 mortality risk for older men and women. BMC Public Health . 2020;20(1):p. 1742. doi: 10.1186/s12889-020-09826-8. [DOI] [PMC free article] [PubMed] [Google Scholar]
- 31.Ho F. K., Petermann-Rocha F., Gray S. R., et al. Is older age associated with COVID-19 mortality in the absence of other risk factors? General population cohort study of 470, 034 participants. PLoS One . 2020;15(11) doi: 10.1371/journal.pone.0241824.e0241824 [DOI] [PMC free article] [PubMed] [Google Scholar]
- 32.Gao Y.-d., Ding M., Dong X., et al. Risk factors for severe and critically ill COVID-19 patients: a review. Allergy . 2021;76(2):428–455. doi: 10.1111/all.14657. [DOI] [PubMed] [Google Scholar]
- 33.Lakbar I., Luque-Paz D., Mege J. L., Einav S., Leone M. COVID-19 gender susceptibility and outcomes: a systematic review. PLoS One . 2020;15(11) doi: 10.1371/journal.pone.0241827.e0241827 [DOI] [PMC free article] [PubMed] [Google Scholar]
- 34.Nguyen N. T., Chinn J., de Ferrante M., Kirby K. A., Hohmann S. F., Amin A. Male gender is a predictor of higher mortality in hospitalized adults with COVID-19. PLoS One . 2021;16(7) doi: 10.1371/journal.pone.0254066.e0254066 [DOI] [PMC free article] [PubMed] [Google Scholar]
- 35.Tazerji S. S., Shahabinejad F., Tokasi M., et al. Global data analysis and risk factors associated with morbidity and mortality of COVID-19. Gene reports . 2022;26(26) doi: 10.1016/j.genrep.2022.101505.101505 [DOI] [PMC free article] [PubMed] [Google Scholar]
- 36.Jin J. M., Bai P., He W., et al. Gender differences in patients with COVID-19: focus on severity and mortality. Frontiers Public Health . 2020;8 doi: 10.3389/fpubh.2020.00152. [DOI] [PMC free article] [PubMed] [Google Scholar]
- 37.Aleksanyan Y., Weinman J. P. Women, men and COVID-19. Social Science & Medicine . 2022;294 doi: 10.1016/j.socscimed.2022.114698.114698 [DOI] [PMC free article] [PubMed] [Google Scholar]
- 38.Raimondi F., Novelli L., Ghirardi A., et al. Covid-19 and gender: lower rate but same mortality of severe disease in women—an observational study. BMC Pulmonary Medicine . 2021;21(1) doi: 10.1186/s12890-021-01455-0. [DOI] [PMC free article] [PubMed] [Google Scholar]
- 39.Kelada M., Anto A., Dave K., Saleh S. N. The role of sex in the risk of mortality from COVID-19 amongst adult patients: a systematic review. Cureus . 2020;12(8) doi: 10.7759/cureus.10114.e10114 [DOI] [PMC free article] [PubMed] [Google Scholar]
- 40.Mahamat-Saleh Y., Fiolet T., Rebeaud M. E., et al. Diabetes, Hypertension, body mass index, smoking and COVID-19-related mortality: a systematic review and meta-analysis of observational studies. BMJ Open . 2021;11 doi: 10.1136/BMJOPEN-2021-052777. [DOI] [PMC free article] [PubMed] [Google Scholar]
- 41.Menon T., Gandhi S. A. Q., Tariq W., et al. Impact of chronic kidney disease on severity and mortality in COVID-19 patients: a systematic review and meta-analysis. Cureus . 2021;13(4) doi: 10.7759/cureus.14279.e14279 [DOI] [PMC free article] [PubMed] [Google Scholar]
- 42.Djaharuddin I., Munawwarah S., Nurulita A., Ilyas M., Tabri N. A., Lihawa N. Comorbidities and mortality in COVID-19 patients. Gaceta Sanitaria . 2021;35 doi: 10.1016/J.GACETA.2021.10.085. [DOI] [PMC free article] [PubMed] [Google Scholar]
- 43.Chavez-Macgregor M., Lei X., Zhao H., Scheet P., Giordano S. H. Evaluation of COVID-19 mortality and adverse outcomes in US patients with or without cancer. JAMA Oncology . 2022;8 doi: 10.1001/JAMAONCOL.2021.5148. [DOI] [PMC free article] [PubMed] [Google Scholar]
- 44.Yang L., Chai P., Yu J., Fan X. Effects of cancer on patients with COVID-19: a systematic review and meta-analysis of 63, 019 participants. Cancer Biology and Medicine . 2021;18(1) doi: 10.20892/j.issn.2095-3941.2020.0559. [DOI] [PMC free article] [PubMed] [Google Scholar]
- 45.Kollias A., Kyriakoulis K. G., Lagou S., Kontopantelis E., Stergiou G. S., Syrigos K. Venous thromboembolism in COVID-19: a systematic review and meta-analysis. Vascular Medicine . 2021;26(4):415–425. doi: 10.1177/1358863x21995566. [DOI] [PMC free article] [PubMed] [Google Scholar]
- 46.Sokolski M., Reszka K., Suchocki T., et al. History of heart failure in patients hospitalized due to COVID-19: relevant factor of in-hospital complications and all-cause mortality up to six months. Journal of Clinical Medicine . 2022;11 doi: 10.3390/JCM11010241. [DOI] [PMC free article] [PubMed] [Google Scholar]
- 47.Ruiz-Sánchez J. G., Núñez-Gil I. J., Cuesta M., et al. Prognostic impact of hyponatremia and hypernatremia in COVID-19 pneumonia. A HOPE-COVID-19 (health outcome predictive evaluation for COVID-19) registry analysis. Frontiers Endocrinology . 2020;11 doi: 10.3389/FENDO.2020.599255.599255 [DOI] [PMC free article] [PubMed] [Google Scholar]
- 48.Soetedjo N. N. M., Iryaningrum M. R., Damara F. A., et al. Prognostic properties of hypoalbuminemia in COVID-19 patients: a systematic review and diagnostic meta-analysis. Clinical Nutrition ESPEN . 2021;45 doi: 10.1016/j.clnesp.2021.07.003. [DOI] [PMC free article] [PubMed] [Google Scholar]
- 49.Huang J., Cheng A., Kumar R., et al. Hypoalbuminemia predicts the outcome of COVID-19 independent of age and co-morbidity. Journal of Medical Virology . 2020;92(10):2152–2158. doi: 10.1002/jmv.26003. [DOI] [PMC free article] [PubMed] [Google Scholar]
- 50.Viana-Llamas M. C., Arroyo-Espliguero R., Silva-Obregón J. A., et al. Hypoalbuminemia on admission in COVID-19 infection: an early predictor of mortality and adverse events. A retrospective observational study. Medicina Clinica . 2021;156:428–436. doi: 10.1016/J.MEDCLI.2020.12.018. [DOI] [PMC free article] [PubMed] [Google Scholar]
- 51.Zong X., Gu Y., Yu H., Li Z., Wang Y. Thrombocytopenia is associated with COVID-19 severity and outcome: an updated meta-analysis of 5637 patients with multiple outcomes. Laboratory Medicine . 2021;52(1):10–15. doi: 10.1093/labmed/lmaa067. [DOI] [PMC free article] [PubMed] [Google Scholar]
- 52.Bashash D., Hosseini-Baharanchi F. S., Rezaie-Tavirani M., et al. The prognostic value of thrombocytopenia in COVID-19 patients; a systematic review and meta-analysis. Archives of Academic Emergency Medicine . 2020;8:1–8. doi: 10.22037/aaem.v8i1.828. [DOI] [PMC free article] [PubMed] [Google Scholar]
- 53.Delshad M., Safaroghli-Azar A., Pourbagheri-Sigaroodi A., Poopak B., Shokouhi S., Bashash D. Platelets in the perspective of COVID-19; pathophysiology of thrombocytopenia and its implication as prognostic and therapeutic opportunity. International Immunopharmacology . 2021;99 doi: 10.1016/j.intimp.2021.107995.107995 [DOI] [PMC free article] [PubMed] [Google Scholar]
Associated Data
This section collects any data citations, data availability statements, or supplementary materials included in this article.
Data Availability Statement
Data are available based upon request from KAUH.