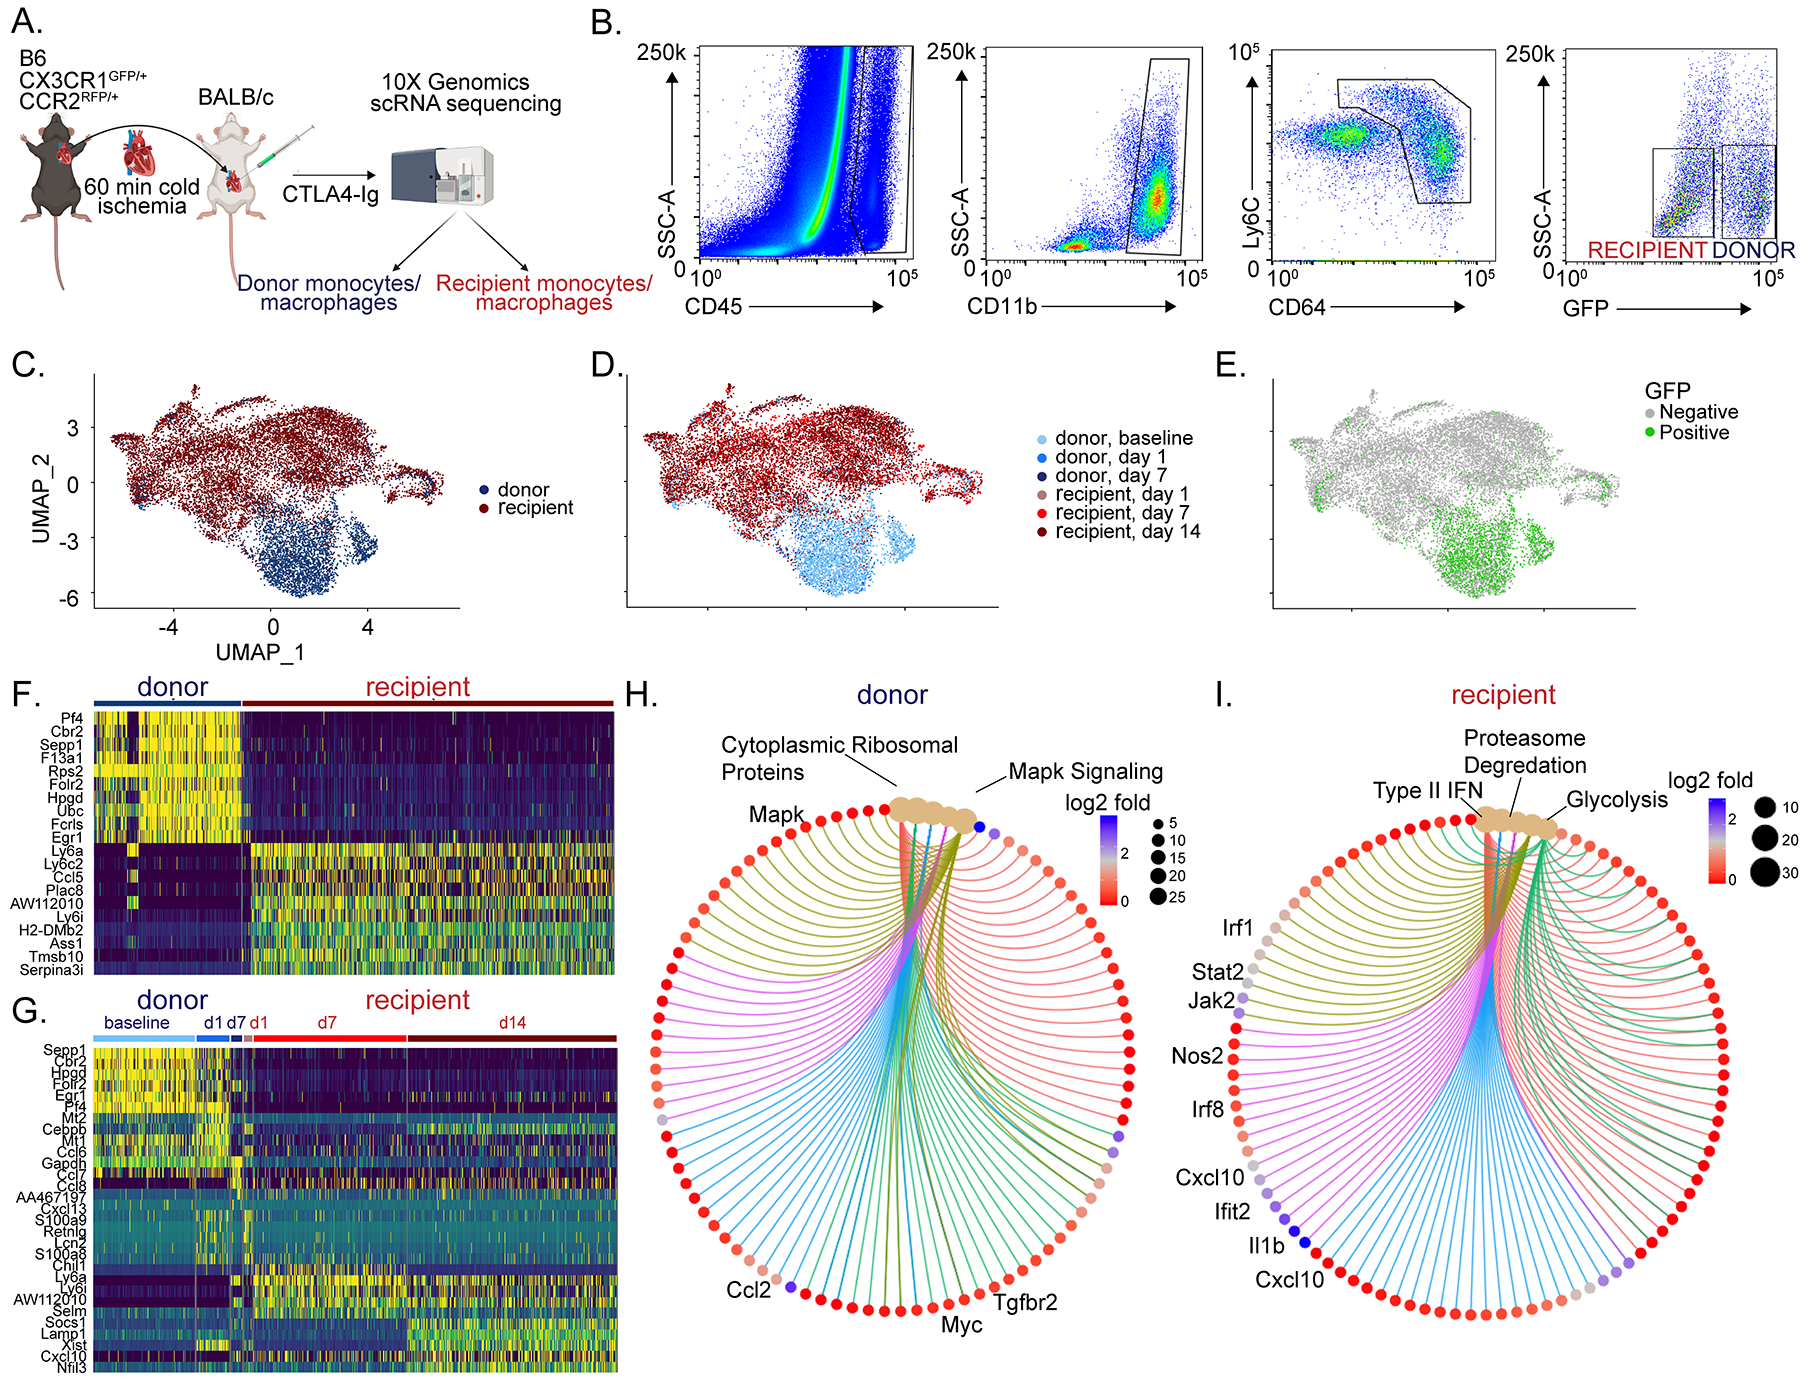
Figure 2: Donor and recipient immune cells are distinct.

A) Schematic of single cell RNA sequencing workflow. B) Post-transplant day 1 gating scheme. Donor macrophages and monocytes are CD45+ CD11b+ Ly6c+ CD64+ GFP+ whereas recipient macrophages and monocytes are CD45+ CD11b+ Ly6c+ CD64+ GFP−. UMAP embedding plot of aggregated dataset split by C) donor and recipient, D) donor and recipient split by different timepoints, and E) GFP expression showing donor vs recipient demarcation, confirming robustness of FACS gating strategy. Heatmaps of normalized counts for differentially expressed marker genes between F) donor versus recipient and G) unique markers enriched in donor and recipients at different time points. Gene-Concept Network Plot for upregulated pathways with key genes annotated in H) donors and I) recipients using statistically significant genes (adjusted p-value < 0.05, Bonferroni correction) from differential gene testing.
